

Abstract
Like other RNA viruses, influenza viruses are subject to high mutation rates. Carrying segmented RNA genomes, their genetic variability is even higher. We aimed at analyzing the mutational events occurring during the infection of chickens by the Highly Pathogenic Avian Influenza (HPAI) H5N1 virus. We therefore studied the different sequences of two surface proteins, hemagglutinin (HA) and neuraminidase (NA), as well as two internal proteins, PB2 and NS. Three organs (lung, spleen, brain) were obtained from a chicken, experimentally infected with a lethal dose of HPAI H5N1 virus. Cloning these PCR fragments enabled us to investigate the mutations undergone by the virus after several replicative cycles. The first outcome is the presence of a strong mutational bias, resembling host-driven ADAR1 adenosine deamination, which is responsible for 81% of all mutations. Whereas the frequency of RNA dependent RNA polymerase-related mutations is compatible with the survival of the virus, the ADAR1-like activity usually strongly increases the mutation frequency into a level of “error catastrophe” in theory incompatible with virus survival. Nevertheless, the virus was successfully infective. HPAI H5N1 virus displayed traits in agreement with the quasispecies theory. The role of this quasispecies structure in successful infection and the superposition with the ADAR1-like response is discussed.
Keywords: H5N1, Influenza virus, Quasispecies, Polymorphism, Biased mutational pattern
1. Introduction
A feature common to all RNA viruses is their high genetic variability due to high mutation rates of around 10−4–10−5 misincorporations per nucleotide per replication cycle (Drake and Holland, 1999), facilitated by the lack of proof-reading activity. This high genetic variability has been associated, among other things, with the concept of quasispecies for the last two decades (Eigen, 1993, Eigen and McCaskill, 1988). The quasispecies approach is based on the concept of quasi-infinite error-prone populations displaying a high mutation rate (Lauring and Andino, 2010, Wilke, 2005). In this situation a virus will generate a large progeny with genomes highly similar to the parental molecule, each one differing from this original genome by one or few mutated sites. Other rounds of replication will generate additional variants also bearing limited mutations which with time will occupy the “sequence space”, a geometrical representation of all possible sequences. The outcome is a “cloud” of variants behaving almost (quasi) as a unique entity (species), or quasispecies (Lauring and Andino, 2010, Wilke, 2005). However, this is the outcome in the mathematical modeling of the growth of a quasi-infinite population. In a true biological context, this dynamics will be strongly counterbalanced by negative, purifying, selection to generate smaller clouds of closely related sequences, each one differing from the master sequences by very few mutations. Quasispecies theory is therefore a specific case of population genetics and mutation-selection concept in which a strong negative selection generates a group of closely related sequences described as “coupled” in the sequence space (Wilke, 2005). Several studies have investigated the applicability of this model to various RNA viruses, mostly to human immunodeficiency virus (HIV) (Bordería et al., 2010, Briones et al., 2006, Briones et al., 2003), foot-and-mouth disease virus (FMDV) (Domingo et al., 2002, Ojosnegros et al., 2010), and hepatitis viruses (Domingo and Gomez, 2007, Figlerowicz et al., 2010, Fishman and Branch, 2009, Sulbaran et al., 2010). The quasispecies structure of influenza virus was also investigated through different approaches such as PCR amplicons (Chen et al., 2010, Kongchanagul et al., 2008, Iqbal et al., 2009, Watanabe et al., 2011), next generation sequencing (Kuroda et al., 2010, Ramakrishnan et al., 2009, Höper et al., 2009, Höper et al., 2011), realtime RT-PCR (Van Borm et al., 2010) and pyrosequencing (Lackenby et al., 2008, Duwe and Schweiger, 2008). Other studies were conducted on viruses such as the severe acute respiratory syndrome-associated coronavirus (SARS-CoV) (Seligman, 2007), flaviviruses (Brackney et al., 2010, Jerzak et al., 2005) and plant viruses (Hasiów-Jaroszewska et al., 2010).
Like all influenza viruses, the Highly Pathogenic Avian Influenza (HPAI) H5N1 virus is highly variable. Its segmented RNA genome allows it to evolve rapidly via mutation, reassortment, recombination and mixed infection. The consequences of this high genetic variability are numerous: resistance to drugs, modification of virulence, antigenic drift, escape from the immune response, ability to adapt to new host species, etc. Given the animal health and public health hazard that the HPAI H5N1 virus presents, these features have been investigated and documented for over 10 years. Nonetheless, nothing is known about their behavior as defined in the quasispecies framework. Furthermore, the HPAI H5N1 virus being responsible for acute fatal infections, as opposed to chronic infections caused by most viruses previously studied in the quasispecies model, data obtained from the latter do not necessarily apply to the HPAI H5N1 virus.
Here, we studied the viral subpopulations of an HPAI H5N1 inoculum and their in-host mutations when infecting an avian host, specifically in three organs. We described the mutational pattern observed, and confronted it to the conditions of the quasispecies concept. We also reported the presence of a very strong mutational bias, present both in the inoculum and in infected organs, potentially associated to a host ADAR1-like activity.
2. Materials and methods
2.1. Biosafety and ethics statement
All experiments using H5N1 virus were performed within the biosafety level 3 laboratory (BSL-3) of Institut Pasteur in Cambodia. All animal experiments were carried out in the animal biosafety level 3+ laboratory (ABSL-3+) of the Institut Pasteur in Cambodia, complying with the Animal Committee regulations of Institut Pasteur in Paris, France, in accordance with the EC 86/609/CEE directive, and approved by the Animal Ethics Committee of Institut Pasteur in Cambodia.
2.2. Virus
The HPAI H5N1 virus used in these studies was the virus A/Chicken/Cambodia/LC1AL/2007 (GenBank accession numbers HQ200574 to HQ200581). The virus stock was obtained by two passages in Specific Pathogen Free (SPF) 9–11-days old embryonated hen eggs. Incubation time was of 48 h at 37 °C. The eggs were then chilled overnight at 4 °C, and the amnio-allantoic fluid was then harvested and stored at −80 °C until further use. Virus titer was determined by calculating the 50% egg infectious dose (EID50) per milliliter of virus stock. Titration endpoints were calculated using the Reed and Muench method (Reed and Muench, 1938).
2.3. Animals
SPF chickens, of a local Cambodian breed, 4–6-weeks old, were kindly provided by the National Veterinary Research Institute of Cambodia (NaVRI). During the experiments, all birds were housed in self-contained isolation units (Cap Engineering B.V. HM1500 Isolator, Montair, Sevenum, The Netherlands) ventilated under negative pressure with High-Efficiency Particulate Air (HEPA)-filtered air, with 12 daily hours of artificial lighting. Commercial food and water were provided ad libitum.
2.4. Experimental setting
Six SPF chickens were inoculated via oral, ocular and cloacal routes with 106 EID50 of virus in 500 μL of sterile water on day 0 (D0). All birds were checked for expression of clinical signs of illness on a daily basis. Post-mortem examination and collection of samples were conducted on all animals after their death. The samples collected post-mortem included organs such as spleen, lung, and brain. All samples were stored in phosphate buffer saline (PBS) at −80 °C prior to testing.
2.5. RNA extraction and retro-transcription (RT)
Four different specimens were used for this study: the inoculum (initial viral solution inoculated to the chickens), and spleen, lung and brain samples collected from an infected chicken at the time of necropsy. After homogenization of the organs, viral RNA was extracted using the QIAamp® Viral RNA Mini Kit (QIAGEN GmbH, Hilden, Germany) according to the manufacturer’s recommendations. Complementary DNA (cDNA) fragments targeting the hemagglutinin (HA), neuraminidase (NA), PB2 and NS genes were synthesized using the following primers: H5R-1773 for the HA gene, NA- for the NA gene, PB2R-2341 for the PB2 gene, NSR-890 for the NS gene. All primers used in this study are listed with their corresponding sequences in Supplementary Table S1. The reverse transcription reaction was performed using AMV Reverse Transcriptase (Promega, Madison, WI, USA) in a reactional mix containing 6 μL of AMV Reverse Transcriptase 5× Reaction Buffer (Promega), 1 μL of dithiothreitol (DTT, 0.1 M), 1 μL of primer (working stock concentration: 10 μM), 1 μL of mixed dNTPs (10 mM), 1 μL of AMV Reverse Transcriptase (Promega), 5 μL of RNAse-free water, and 5 μL of sample’s RNA. The reaction was carried out in a MyCycler Thermal Cycler (Bio-Rad, Applied Biosystems, Foster City, CA, USA): 5 min at 25 °C, 60 min at 50 °C, 15 min at 70 °C and 10 min at 4 °C.
2.6. Polymerase chain reaction (PCR)
The HA, NA, and PB2 genes were amplified in overlapping halves named HAa and HAb, NAa and NAb, and PB2a and PB2b. The NS gene was amplified in a single segment. Primers used for this PCR step included: H5F-1 and H5R-1111 for the HAa segment; H5F-751 and H5R-1773 for the HAb segment; N1F-1 and N1R-835 for the NAa segment; N1F-459 and NA- for the NAb segment; PB2F-1 and PB2R-1250 for the PB2a segment; PB2F-1105 and PB2R-2341 for the PB2b segment; NSF-1 and NSR-890 for the NS segment. Each reaction was conducted using the GoTaq Flexi DNA Polymerase (Promega) in a reactional mix containing 11 μL of 2× Reaction Mix for SuperScript III Platinum One-Step Quantitative RT-PCR system (Invitrogen, Carlsbad, CA, USA), 1.5 μL of 5′ primer (H5F-1, H5F-751, N1F-1, N1F-459, NSF-1, PB2F-1; working stock concentration: 10 μM), 1.5 μL of 3′ primer (H5R-1111, H5R-1773, N1R-835, NA-, NSR-890, PB2R-1250, PB2R-2341; 10 μM), 0.25 μL of GoTaq Flexi DNA Polymerase (Promega), 33.75 μL of water, and 2 μL of cDNA. The PCR was then carried out in a MyCycler Thermal Cycler (Bio-Rad): 1 cycle of 2 min at 95 °C, followed by 40 cycles of 30 s at 95 °C, 30 s at 55 °C and 1 min at 72 °C, and a final cycle of 5 min at 72 °C, before reaching a final storage temperature of 4 °C. Amplified PCR products were then purified using QIAquick Gel Extraction kit (QIAGEN GmbH), according to the manufacturer’s recommendations.
2.7. Cloning and sequencing
All amplicons were ligated into pCR 2.1-TOPO plasmid vector (Invitrogen) and used for transformation using the TA TOPO Cloning Kit with One Shot MAX Efficiency DH5α-T1 Escherichia coli (Invitrogen), following the manufacturer’s instructions. Seventeen to 20 clones were selected per PCR amplicon (locus) and per sample, and sent for sequencing to a contract sequencing facility (Macrogen, Seoul, Korea). Sequencing reactions were performed in a PTC-225 Peltier Thermal Cycler (MJ Research, Waltham, MA, USA) using ABI PRISM BigDye Terminator Cycle Sequencing Kit with AmpliTaq DNA Polymerase (Applied Biosystems, Foster City, CA, USA), following the protocols supplied by the manufacturer. Single-pass sequencing was performed on each template using the following primers: H5F-1, H5F-219, H5R-515 and H5R-1111 for the HAa segment; H5F-751, H5F-1150 and H5R-1773 for the HAb segment; N1F-1, N1F-459, N1R-560, and N1R-835 for the NAa segment; N1F-459, N1F-814, N1R-835, and NA- for the NAb segment; PB2F-1, PB2R-370, PB2F-940, PB2R-960, and PB2R-1250 for the PB2a segment; PB2F-1105, PB2R-1753, PB2F-1860 and PB2R-2341 for the PB2b segment; NSF-1, NSF-467, NSR-580, and NSR-890 for the NS segment. Final electrophoresis was performed on an ABI PRISM 3730XL Analyzer (Applied Biosystems).
2.8. Sequence alignments and phylogenetic trees
For each clone, sequences on both strands were assembled into contigs to obtain a consensus sequence using CLC Main Workbench 5.7.1 (CLC bio, Aarhus, Denmark). The clones corresponding to each locus, i.e. amplicon, were aligned with CLUSTAL W (Thompson et al., 1994) in BioEdit Sequence Alignement Editor 7.0.9.0 (Ibis Therapeutics, Carslbad, CA, USA). Each locus was treated independently. Because of the very low number of mutations per clone (typically 1 or 2) with respect to the consensus, phylogenetic trees from nucleotide sequences were generated with the Neighbour-Joining method with observed differences and 100 bootstrap replicates, using MEGA 5.05 (Tamura et al., 2011). Trees were edited using MEGA 5.05 and Inkscape 0.48 (Free Software Foundation, Boston, MA, USA). Sequences used were all nucleotidic variants, truncated when necessary so as to be of equal lengths. All positions described on the clones sequenced here refer to H5N1 numbering as defined by alignment with the sequence of A/Goose/Guangdong/1/1996 virus (GenBank accession number AAD51922 to AAD51931).
2.9. Data analysis and mutation models
Sequences showing nonsense and/or frameshift mutations were excluded from all subsequent analyses. The number of mutations per clone was modeled in the following way: for a given clone of size L (typically L ∼ 800 bp), the number of observed mutations between the clone sequence and the consensus sequence was called n dif. Because of the low value of n dif (typically 1 mutation), one may assume that there is no saturation and that one observed difference corresponds exactly to one mutation. Under the hypothesis of independence of the mutation sites, n dif can be simply modeled by a Poisson process with parameter λ = f · L where f is the mutation frequency
Considering now N independent clones (of the same size L), the number N(k) of clones with exactly k mutations follows a binomial distribution with parameter n = N and . The mean and variance of N(k) are therefore given by: and . P-values of observed data can be readily calculated from the binomial distribution.
The same analysis can be performed on the number of mutations per site on a multiple alignment of N clones of same size L. This is simply done by permuting the roles of N and L in the previous equations. The number of mutations per site follows a Poisson distribution with parameter λ′ = f · N where N is typically 20 (for one organ or inoculum) and f is the same mutation frequency as before. Considering a set of L independent sites, the number M(k) of sites with exactly k mutations follows a binomial distribution with parameter n = L and .
A more detailed derivation of the distribution of N(k) and M(k) is given in the Supplementary Annex in the case of two superposed Poisson processes.
3. Results
3.1. Animal infection and sample collection
All six chickens, inoculated via oral, ocular and cloacal routes, died of H5N1 infection, within a mean death time (MDT) of two days, without exhibiting any clinical symptoms. No gross lesions were observed on the organs collected post-mortem. The samples chosen for the study were all collected from one single chicken, randomly selected. Although the passage through eggs was reported to change the quasispecies composition (Ramakrishnan et al., 2009), it did not interfere in this work since the objective was not to study the evolution of a given sequence through successive infections but to compare the mixture present in the inoculum with the sequences found in different organs. This approach is quite similar to what could be found in the wild with interspecies transmission.
3.2. Phylogeny of individual loci and divergence of amino acid sequences
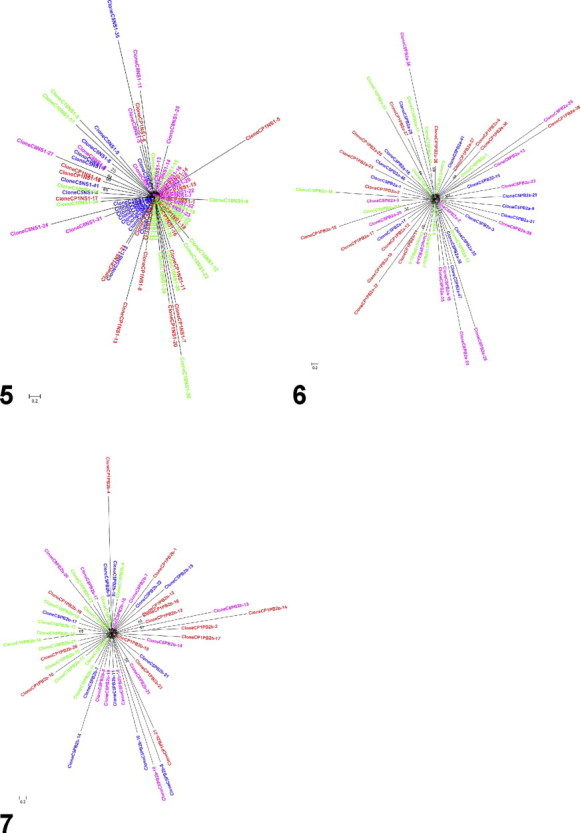
The phylogenetic trees are represented on Supplementary Fig. S1. All were left unrooted. Bootstraps values were generally low (⩽65) although few exceptions were observed, e.g. on the NAb tree with values of 85, 87, 88 and 99. Phylogenetic analysis of sequenced clones yielded similar results for each individual locus. No clear clusters appeared and all trees displayed a similar unresolved star structure when shown under a radial shape (Supplementary Fig. S1). This topology was observed for all loci, all organs and inoculum.
3.3. Isolates variation according to locus and organ
3.3.1. Mutation matrix and mutation frequencies
When considering, for each locus, the distribution of the number of mutations observed per sequence with respect to the consensus, or master sequence, a global mutation frequency of 1.58 × 10⁻³substitutions per nucleotide (nt) was obtained (Table 1 ). Owing to the low number of mutations observed, there was no saturation and each variation corresponded to a mutation. However, the mutation matrix was not symmetrical and was strongly biased towards the presence of A > G (259/556) and T > C (190/556) mutations which represented 81% of all mutations observed (Table 2 ). This bias was observed in all organs as well as in the inoculum (data not shown). Despite this strong mutational bias towards G and C, the average G + C content of sequences analyzed was 44%. These two classes of mutations were complementary, suggesting that only one class of mutation actually occurred but both on the genome and anti-genome. Such strongly biased A > G mutational patterns cannot be explained by RNA dependent RNA polymerase (RdRP) misincorporations but are usually associated with Adenosine Deaminases that act on RNA (ADAR) (Bass, 2002). However, the landmark of ADAR1 mutation is 5′ neighbor position preference (usually U = A > C > G) (Bass, 2002), a feature which was not observed here with the exception of 3 data out of 16 (data not shown), suggesting that the activity observed might be an ADAR1-related deamination process rather than strict ADAR1. Therefore, three different mutation frequencies were calculated (Table 1). The first one was simply the overall mutation frequency: f tot = (number of mutations)/(number of nucleotides) = #mutations/#nt = 1.58 × 10⁻³ mutations/site. The second one tried to estimate the fraction of mutations due to the deamination process solely. We assumed that (i) deamination only produced A > G and T > C mutations; (ii) the total number of observed A > G + T > C mutations was the sum of mutations due to deamination on one hand and to RdRP misincorporations on the other hand, and (iii) the mutation matrix of RdRP misincorporations was symmetrical, i.e. that the actual number of A > G + T > C due to RdRP equalled the observed number of G > A + C > T transitions. Therefore the mutation frequency due to the deamination process solely was: fdeam = (A > G + T > C−G > A−C > T)/(A + T) = 1.88 × 10⁻³ mutations/A-or-T-sites. Finally we estimated the mutation frequency due to RdRP solely by substracting the deamination component from A > G and T > C, using the same assumption as before: fpol = (#mutation−A > G−T > C + G > A + C > T)/#nt = 5.19 × 10⁻⁴ mutations/nt. This corrected mutation frequency was similar to the values ranging from 3.6 × 10⁻⁴ to 5.0 × 10⁻⁴ mutations/nt reported by Iqbal et al. for H5N1 virus in chickens and in very similar experimental conditions (Iqbal et al., 2009).
Table 1.
Mutation frequencies by locus.
| Locus | #seqa | #ntb | A + Tc | #mutd | A > G + T > Ce | G > A + C > Tf | ftotg | fdeamh | fpoli |
|---|---|---|---|---|---|---|---|---|---|
| HAa | 71 | 63,048 | 36,920 | 99 | 87 | 9 | 1.57 × 10⁻³ | 2.11 × 10⁻³ | 3.33 × 10⁻⁴ |
| HAb | 73 | 54,093 | 31,463 | 101 | 85 | 13 | 1.87 × 10⁻³ | 2.29 × 10⁻³ | 5.36 × 10⁻⁴ |
| NAa | 75 | 51,525 | 29,250 | 71 | 55 | 10 | 1.38 × 10⁻³ | 1.54 × 10⁻³ | 5.05 × 10⁻⁴ |
| NAb | 65 | 48,945 | 27,755 | 71 | 56 | 12 | 1.45 × 10⁻³ | 1.59 × 10⁻³ | 5.52 × 10⁻⁴ |
| NS | 71 | 44,943 | 23,643 | 49 | 39 | 6 | 1.09 × 10⁻³ | 1.40 × 10⁻³ | 3.56 × 10⁻⁴ |
| PB2a | 54 | 45,360 | 24,678 | 94 | 68 | 17 | 2.07 × 10⁻³ | 2.07 × 10⁻³ | 9.48 × 10⁻⁴ |
| PB2b | 49 | 44,688 | 25,186 | 71 | 59 | 9 | 1.59 × 10⁻³ | 1.99 × 10⁻³ | 4.70 × 10⁻⁴ |
| Total | 458 | 352,602 | 198,895 | 556 | 449 | 76 | 1.58 × 10⁻³ | 1.88 × 10⁻³ | 5.19 × 10⁻⁴ |
Total number of sequences analyzed.
Total number of nucleotides.
Total number of A and T bases.
Total number of mutations observed.
Total number of A > G and T > C mutations observed.
Total number of G > A and C > T mutations observed.
Overall frequency: #mut /#nt.
Estimated frequency of deamination process: (A > G + T > C−C > T−G > A)/A + T in mutations/A-or-T.
Estimated frequency of mutations caused by the RNA dependent RNA polymerase only : (#mut - A > G−T > C + G > A + C > T)) #nt in mutations/nt.
Table 2.
Mutation matrix (all loci).
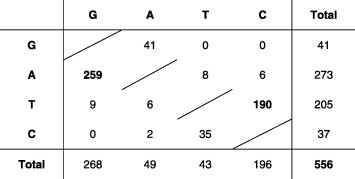 |
The mutation matrix represents mutations of nucleotides of the left column into nucleotides of the upper row.
It should be noted that the overall mutational process was actually modeled by two independent Poisson processes, one due to RdRP (with frequency f pol) and one due to deamination (with frequency f deam). As for the number of mutations per clone, the resulting process was therefore a Poisson process with parameter (see Supplementary Annex for details).
From these frequencies and from the total genome size of ∼13.5 kb the fraction of genomes, i.e. sequenced clones, displaying at most k mutations (cumulative Poisson) was calculated. These clones displaying no or very few mutations could correspond to the viable infective progeny compatible with the negative selective pressure associated to quasispecies. These values are given in Table 3 for k = 0, 1, 2.
Table 3.
Fraction of genomes displaying at most k mutations, with and without ADAR1-like deamination.
| k | All mutationsa | RdRp onlyb |
|---|---|---|
| 0 | 5.45 × 10⁻¹⁰ | 9.06 × 10⁻⁴ |
| 1 | 1.22 × 10⁻⁸ | 7.25 × 10⁻³ |
| 2 | 1.36 × 10⁻⁷ | 2.95 × 10⁻² |
Considering all mutations, with a mutation frequency of 1.58 × 10⁻³ mutations/nucleotide and a total genome size of 13.5 Kb.
Considering mutations caused by the RNA dependent RNA polymerase only, with a mutation frequency of 5.19 × 10⁻⁴ mutations/nucleotide and a total genome size of 13.5 Kb.
3.3.2. Distribution of mutations per clone
The distribution of the number of mutations per clone was compared to a Poisson distribution in order to determine whether the occurrence was stochastic or adaptive. Data are presented in Supplementary Table S2. For each locus, the distribution was considered for each organ (lung, spleen, brain) and inoculum separately as well as for the set of all sequences (“total”). The comparison of the observed mutations per locus for all sets fitted quite well with a Poisson distribution. Few variations from Poisson distribution were observed, most of them occurring on PB2a. With the exception of PB2 there was no significant difference between loci with respect to the number of mutations. Similarly, there was no significant difference between organs nor between organs and inoculum. This suggested that these mutations were purely stochastic and therefore not fixed by selective pressure. This was also supported by two observations: (i) the distribution of the number of mutations was uniform across the three reading frames (Supplementary Table S6), whereas one would expect more mutations on the third frame if selective fixation had occurred; (ii) in the same way, the observed ratio of non-synonymous over synonymous mutations was 367/189 = 1.94, a value very close to the expected ratio of 2 for purely random mutations (the actual expected value for random mutations on these particular sequences was 2.09). Finally, we performed the same analysis by removing all the A > G and T > C mutations (Supplementary Table S3). Again, the number of mutations per clone did not show any discrepancy from a purely stochastic Poisson process.
3.3.3. Distribution of mutations by site
In order to try to detect a potential fixation process, the previous analysis was complemented by the analysis of the number of mutations per site, for a given locus. The comparison of this distribution with Poisson is presented in Supplementary Table S4 (for all mutations) and C2 (for all mutations except A > G and T > C). Although some few variations were observed, the distribution per site displayed a good fit with the Poisson distribution supporting further the stochastic occurrence of the mutations and the absence of fixation with time. No significant difference could be observed between organs, nor between organs and inoculum, suggesting that the occurrence of mutations followed the same stochastic trend in all organs and in eggs. This also confirmed that there was no evolution from the inoculum by fixation of mutations through time.
4. Discussion
The main objective of this work was to analyze the mutational events occurring during the infection of chickens by the highly variable and heterogeneous Highly Pathogenic Avian Influenza (HPAI) H5N1 virus. However, this work is based on the use of amplicons in order to cover a large portion of the viral genome. A limitation is thus that only a small proportion of the overall population of variants was analyzed. This work should therefore be completed by an in-depth high-throughput approach which allows deeper coverage of the whole population.
The study of this virus in multiple organs was made possible because of the fatal systemic infection it causes in chicken. Although the mean death time of chickens was short (2 days), the average duration of the replication cycle of the influenza A virus being of 5–6 h (Baccam et al., 2006, Zambon and Potter, 2009), it allowed at least 6–8 cycles to be accomplished during the span time of the experiment. This makes the experimental data reported in this work comparable to what would be expected in a situation of quasispecies evolution. The quasispecies nature of influenza has been investigated on a variety of serotypes, including the pandemic 2009 influenzaA virus H1N1 but also H3N1 and H5N1. These investigations were performed by using a wide range of complementary approaches including in depth next generation sequencing (Kuroda et al., 2010, Ramakrishnan et al., 2009, Höper et al., 2009, Höper et al., 2011), pyrosequencing (Lackenby et al., 2008, Duwe and Schweiger, 2008), realtime RT-PCR (Van Borm et al., 2010) and PCR amplicons sequencing (Chen et al., 2010, Kongchanagul et al., 2008, Iqbal et al., 2009, Watanabe et al., 2011). This work relates to this last approach.
The first expected feature is the very limited evolution of variants from the master sequence in order to occupy the sequence space. Furthermore, the phylogenetic analysis of the different loci on a per-organ basis yielded trees with similar unresolved topologies, i.e. non-structured or star-shaped trees, indicative of parallel and independent evolution of each clone from the same original master sequence (Biebricher and Eigen, 2006, Lauring and Andino, 2010). The data reported in this work indicate that the number of observed mutations is of the order of one mutation per clone, corresponding to an overall mutation frequency of 1.58 × 10⁻³ mutations/site. Owing to a total genome size of ∼13.5 kb, this would lead to an overall mutation frequency of 21.3 mutations/genome. This value might be too high to be compatible with the creation of viable variants (Crotty et al., 2001). However, the purely replicative part of the mutations was calculated to be about 5.19 × 10⁻⁴ mutations/site which would lead to a genomic frequency of 7.0 mutations/genome. Although this value is still rather high, it would lead to a fraction of e−7.0 ∼ 1 ‰ of genomes displaying no mutation and 3% of genomes with at most 2 mutations (Table 3) during the life time of infected chickens. This indicates that the mutation frequency attributable to RdRp is compatible with the survival of viable viruses in the population. Furthermore, both the overall mutations and the restricted mutations follow a random (Poisson) process with no shared mutations or specific patterns.
The main proportion of the observed mutations is attributable to a host-driven deamination process. HPAI H5N1 virus displayed a very strong A > G mutational bias. 81% of the observed mutations were A to G and T to C transitions whereas reverse G to A and C to T transitions as well as transversions were more limited (13.6%). A very similar bias was recently reported on SRAS, although to a lower extent with A > G and T > C substitutions making about 60% of all mutations observed (Eckerle et al., 2010). This bias was never reported for in vitro activity of AMV reverse transcriptase despite extensive misincorporation survey (Operario et al., 2005, Skinner and Eperon, 1986, Taube et al., 1998). This strong mutational bias is suggestive of the activity of a family of host cell proteins known as Adenosine Deaminases that Act on RNA or ADAR (Bass, 2002). ADAR-mediated RNA editing occurs through the conversion of adenosine to inosine in both coding and noncoding regions of double-stranded RNA. This finally leads to the editing into guanosine. The presence of T to C transitions on the sequence may correspond in fact to A to G mutations on the complementary strand indicating thus that 81% of the observed mutations would be ADAR-like mediated RNA editing. However, ADAR editing is dependent on two factors, the first one being specificity which is directly dependent on the stability of the double-stranded RNA (Bass, 2002). ADAR editing usually occurs on a limited number of adenosine residues but can extend up to 50% under some situations of high stability of the double-stranded RNA editing, a process known as hypermutation (Bass, 2002, Suspène et al., 2011). In this work, the overall editing is only 0.2 ‰ of all adenosines available and an average of two residues per sequence. The second main trait of ADAR is the neighbor position preference. ADAR-mediated editing displays a slight preference for certain adenosines over others depending upon their immediate neighbor base. ADAR1 displays no 3′ preference but a clear 5′ preference where U ∼ A > C = G (Bass, 2002, Suspène et al., 2011). If the data reported here underline the overwhelming presence of A > G editing among the HPAI H5N1 virus variants isolated from chicken, this does not correspond to true ADAR1 activity owing to the lack of neighbor preference and should be referred to as ADAR1-like deamination. However, the inoculum, which was coming from egg passage, displayed the same bias indicating thus that this ADAR1-like process is also active in hen eggs. The data reported in this work most likely result from the superposition of two mechanisms: the RdRP intrinsic errors during the replication of the virus on one hand and an antiviral ADAR-like activity from the host on the other hand.
ADAR-1 proteins also display antiviral activity and the p150 isoform was shown to inhibit measles virus but also to protect against several orthomyxoviruses and other paramyxoviruses (Samuel, 2011, Ward et al., 2011). This is in particular true for influenza A. ADAR1-depleted mice were more susceptible to influenza virus (Ngamurulert et al., 2009) while ADAR1 proteins were produced in higher amounts in influenzaA infected cells (Emmott et al., 2010). Furthermore, H5N1 NS1 protein was reported to specifically interact with ADAR1 proteins, to inhibit interferon production and to manipulate host proteins to facilitate infection and confer an unusual severity (Ngamurulert et al., 2009, Randall and Goodbourn, 2008, Samuel, 2011). Antiviral ADAR1 activity seems to be based at least on two complementary actions: interferon activity and accumulation of deleterious mutations in virus protein genes. This brings the mutation frequency to a level which might be too high to maintain viral genome infectivity (1 for 10 million) pushing thus viral population towards a model of “error catastrophe” (Crotty et al., 2001).
Despite the presence of an ADAR1-like antiviral response and an overall mutation frequency beyond the viability limit, the H5N1 virus studied in this work was able to infect the chickens and kill them within two days. This demonstrates its high virulence in a susceptible host but also its ability to efficiently counteract the host innate immunity. The answer might be found in some additional key concepts in the quasispecies theory. The first one is mutational robustness (Van Nimwegen et al., 1999), in which a population minimizes the detrimental impact of mutations by gathering sequences with low probability of bearing deleterious mutations (Bornberg-Bauer and Chan, 1999, Lauring and Andino, 2010, Van Nimwegen et al., 1999, Wilke, 2001, Wilke and Adami, 2003). The second concept to consider is that of functional cooperation (Lauring and Andino, 2010, Más et al., 2010) in which a global advantage is given, here pathogenicity versus host defense, to the cloud of variants by the association of complementary functions borne by separate variants. Although intuitively sound and in line with the reality, which is that the virus was successful in evading host defenses and kill the chickens, this is difficult to demonstrate and must thus remain at a somehow speculative level. This is nevertheless an expected outcome of the quasispecies concept. Unlike Darwinian evolution which relies on the preexistence in the population of rare but suitable mutations which can be fixed by selection, and thus can be traced, there is no such preexisting fixed mutation in quasispecies. There is instead a continuous stochastic occurrence of mutations in the overall population and the cooperation of a limited number of variants to provide a temporary functional advantage in a given situation (e.g. circumventing host defense, adapting to a new host, etc.). These mutations are temporary but through cooperation and mutational robustness they may confer a functional advantage in a novel environment or host. The occurrence of such “preferred” sites was recently reported in a comparative analysis of H5N1 virus mutation frequency in different hosts (Iqbal et al., 2009). In the work presented here, several of the mutated sites observed were previously described in the literature as bearing mutations of special functional importance (Table 4 ). These regions fell roughly into two categories: those involved in adaptation to human host, and those involved in virulence and pathogenicity. Many substitutions were observed on well-known sites in the hemagglutinin protein, such as antigenic sites, receptor-binding sites, the cleavage site, or the fusion peptide. Substitution of the glutamine for an arginine on position 192 in the H5 HA1 protein was shown to be responsible for the shift from sialic acid α2,3 galactose (SAα2,3Gal) to SAα2,6Gal recognition (Yamada et al., 2006) and thus adaptation to human hosts (Matrosovich et al., 1999, Matrosovich et al., 1997). Mutations described as potentially affecting membrane fusion (Chen et al., 1999, Langley et al., 2009, Skehel and Wiley, 2000) were also detected in the HA2 protein. The three substitutions observed on relevant sites of the NA protein were located on amino acids involved in the neuraminidase active site (Collins et al., 2008, Russell et al., 2006, Yen et al., 2005, Yen et al., 2007). As for the NS protein, the main element to report was the mutation Asp92Gly. Better known at this position is the Asp92Glu substitution, responsible for increased virulence and resistance to antiviral cytokines (Seo et al., 2002, Zhou et al., 2010). Position 92 is also located within the translation initiation factor eIF4GI binding domain (positions 81–113) of NS1. Truncations of this domain were shown to have an impact on virulence and pathogenicity of H5N1 viruses (Zhou et al., 2010). It would be out of scope to speculate on a possible effect but their occurrence on the limited number of clones analyzed in this work out of the numerous possibilities offered by the sequence space make them worth to be at least mentioned.
Table 4.
Mutations observed in the region of functional importance.
| Protein | Sample | Mutation observed | Mutation previously reported | Altered function or relevant site affected | References |
|---|---|---|---|---|---|
| HA1 | Lung | S128P | None | Antigenic site (position 133 in H3-numbering) | Kaverin et al., 2007, Kaverin et al., 2002, Philpott et al., 1990, Stevens et al., 2006 |
| Inoculum | K153R | None | Antigenic site (position 157 in H3-numbering) | ||
| Spleen | T159Ta | T159A (T160A in reference H5 numbering) | Receptor specificity (avian vs mammal) | Gao et al., 2009, Stevens et al., 2006 | |
| Inoculum | N182Na | N182 K | Receptor specificity (avian vs human) | Yamada et al. (2006) | |
| Spleen | N182T | ||||
| Inoculum | Q192R | Q192R | |||
| Brain | S223G | S223N (S227N in H3-numbering) | Receptor specificity (avian vs human) and/or antibody-antigen binding | Gambaryan et al., 2006, Hoffmann et al., 2005, Shinya et al., 2005 | |
| Brain | P321Pa | None | Cleavage site | Bosch et al., 1981, OIE World Organisation for Animal Health, 2009, Perdue et al., 1997, Skehel and Wiley, 2000, Steinhauer, 1999, Walker and Kawaoka, 1993 | |
| Lung | R326Ra | ||||
| HA2 | Brain | F9S | None | Fusion peptide | Langley et al., 2009, Skehel and Wiley, 2000 |
| Lung | Y34H | None | Membrane fusion intermediate | Chen et al. (1999) | |
| Spleen | A35Aa | ||||
| NA | Lung | R118G | None | NA active site | Collins et al., 2008, Russell et al., 2006, Yen et al., 2005, Yen et al., 2007 |
| Inoculum | D151N | ||||
| Inoculum | R293G | R292K | |||
| PB2 | Brain | A44Aa | A44S | Adaptation to human host | Miotto et al. (2010) |
| Lung | A588T | A588I | |||
| Spleen | A661Aa | A661T | |||
| NS | Lung brain | V86A | None | Virulence | Zhou et al. (2010) |
| Spleen | L90La M93T W102R | ||||
| Lung | D92G | D92E | Virulence and resistance to host’s immune response | Seo et al., 2002, Zhou et al., 2010 | |
| Brain | M98L K108E | None | Virulence | Zhou et al. (2010) | |
| Inoculum | S99L |
Synonymous mutations.
Acknowledgements
We thank the staff of the Virology Unit at the Institut Pasteur in Cambodia for their technical assistance. This work was supported by the French Ministry of Research and by the Office of the Assistant Secretary for Preparedness and Response within the U.S. Department of Health and Human Services. Ramona Gutiérrez received a scholarship from the Government of New-Caledonia. Alain Viari, Bernard Godelle and Roger Frutos were supported in part by the PHC-Siam Grant 20624VK from the French Ministry of Foreign and European Affairs.
Footnotes
Supplementary data associated with this article can be found, in the online version, at doi:10.1016/j.meegid.2011.10.019.
Appendix A. Supplementary data
Supplementary Figure A1.
Phylogenetic trees in radial view of the nucleotide sequences of (1) HAa locus, (2) HAb locus, (3) NAa locus, (4) NAb locus, (5) NS locus, (6) PB2a locus, (7) PB2b locus. The trees were generated using Maximum-Likelihood method with 500 bootstrap replicates, using PhyML 3.0 (Guindon and Gascuel, 2003). Numbers on branches indicate bootstrap values. The trees were left unrooted. Colors used for the different samples are: red = inoculum (CP1); blue = lung (C5); pink = spleen (C8); green = brain (C10).
Supplementary Figure A.
Derivation of the mutation distribution models.
List of primers and their sequences.
Distribution of the number of mutations per clone - All mutations. Each table cell indicates: (observed number of mutations)/(expected number of mutations) ± (standard deviation). Observed values are for all mutations. Expected values are calculated according to a Poisson process with a mutation frequency ftot = (number of mutations)/(number of nucleotides) = #mut/#nt = 1.58 × 10⁻³ (See Supplementary Annex for details). ∗Cells with 1% < p-value ⩽ 5% are shaded in grey. ∗∗Cells with p-value ⩽ 1% are shaded in yellow.
Distribution of the number of mutations per clone - All mutations except A > G and T > C. Each table cell indicates: (observed number of mutations)/(expected number of mutations) ± (standard deviation). A > G and T > C mutations have been removed. Expected values are calculated according to a Poisson process with a mutation frequency ftot = [(number of mutations)−A > G−T > C]/(number of nucleotides) = (#mut−A>G−T>C)/#nt = 3.03 × 10⁻⁴ (See Supplementary Annex for details). ∗Cells with 1% < p-value ⩽ 5% are shaded in grey. ∗∗Cells with p-value ⩽ 1% are shaded in yellow.
Distribution of the number of mutations per site - All mutations. Each table cell indicates: (observed number of mutations)/(expected number of mutations) ± (standard deviation). Observed values are for all mutations. Expected values are calculated according to a Poisson process with a mutation frequency ftot = (number of mutations)/(number of nucleotides) = #mut/#nt = 1.58 × 10⁻³ (See Supplementary Annex for details).∗Cells with 1% < p-value ⩽ 5% are shaded in grey. ∗∗Cells with p-value ⩽ 1% are shaded in yellow.
Distribution of the number of mutations per site - All mutations except A > G and T > C. Each table cell indicates: (observed number of mutations)/(expected number of mutations) ± (standard deviation). A > G and T > C mutations have been removed. Expected values are calculated according to a Poisson process with a mutation frequency ftot = [(number of mutations)−A > G−T > C]/(number of nucleotides) = (#mut - A > G−T > C)/#nt = 3.03 × 10⁻⁴. (See Supplementary Annex for details). ∗Cells with 1% < p-value ⩽ 5% are shaded in grey. ∗∗Cells with p-value ⩽ 1% are shaded in yellow.
Distribution of the number of mutations per reading frame.
References
- Baccam P., Beauchemin C., Macken C.A., Hayden F.G., Perelson A.S. Kinetics of influenzaA virus infection in humans. J. Virol. 2006;80:7590–7599. doi: 10.1128/JVI.01623-05. [DOI] [PMC free article] [PubMed] [Google Scholar]
- Bass B.L. RNA editing by adenosine deaminases that act on RNA. Annu. Rev. Biochem. 2002;71:817–846. doi: 10.1146/annurev.biochem.71.110601.135501. [DOI] [PMC free article] [PubMed] [Google Scholar]
- Biebricher C.K., Eigen M. What is a quasispecies? Curr. Top. Microbiol. Immunol. 2006;299:1–31. doi: 10.1007/3-540-26397-7_1. [DOI] [PubMed] [Google Scholar]
- Bordería A.V., Lorenzo-Redondo R., Pernas M., Casado C., Alvaro T., Domingo E., Lopez-Galindez C. Initial fitness recovery of HIV-1 is associated with quasispecies heterogeneity and can occur without modifications in the consensus sequence. PLoS One. 2010;5:e10319. doi: 10.1371/journal.pone.0010319. [DOI] [PMC free article] [PubMed] [Google Scholar]
- Bornberg-Bauer E., Chan H.S. Modeling evolutionary landscapes: mutational stability, topology and superfunnels in sequence space. Proc. Natl. Acad. Sci. USA. 1999;96:10689–10694. doi: 10.1073/pnas.96.19.10689. [DOI] [PMC free article] [PubMed] [Google Scholar]
- Bosch F.X., Garten W., Klenk H.-D., Rott R. Proteolytic cleavage of influenza virus hemagglutinins: primary structure of the connecting peptide between HA1 and HA2 determines proteolytic cleavability and pathogenicity of avian influenza viruses. Virology. 1981;113:725–735. doi: 10.1016/0042-6822(81)90201-4. [DOI] [PubMed] [Google Scholar]
- Brackney D.E., Brown I.K., Nofchissey R.A., Fitzpatrick K.A., Ebel G.D. Homogeneity of Powassan virus populations in naturally infected Ixodes scapularis. Virology. 2010;402:366–371. doi: 10.1016/j.virol.2010.03.035. [DOI] [PMC free article] [PubMed] [Google Scholar]
- Briones C., de Vicente A., Molina-París C., Domingo E. Minority memory genomes can influence the evolution of HIV-1 quasispecies in vivoGene. 2006;384:129–138. doi: 10.1016/j.gene.2006.07.037. [DOI] [PubMed] [Google Scholar]
- Briones C., Domingo E., Molina-París C. Memory in retroviral quasispecies: experimental evidence and theoretical model for human immunodeficiency virus. J. Mol. Biol. 2003;331:213–229. doi: 10.1016/S0022-2836(03)00661-2. [DOI] [PMC free article] [PubMed] [Google Scholar]
- Chen J., Skehel J.J., Wiley D.C. N- and C-terminal residues combine in the fusion-pH influenza hemagglutinin HA2 subunit to form an N cap that terminates the triple-stranded coiled coil. Proc. Natl. Acad. Sci. USA. 1999;96:8967–8972. doi: 10.1073/pnas.96.16.8967. [DOI] [PMC free article] [PubMed] [Google Scholar]
- Chen H., Wen X., To K.K., Wang P., Tse H., Chan J.F., Tsoi H.W., Fung K.S., Tse C.W., Lee R.A., Chan K.H., Yuen K.Y. Quasispecies of the D225G substitution in the hemagglutinin of pandemic influenzaA(H1N1) 2009 virus from patients with severe disease in Hong Kong, China. J. Infect. Dis. 2010;201:1517–1721. doi: 10.1086/652661. [DOI] [PubMed] [Google Scholar]
- Collins P.J., Haire L.F., Lin Y.P., Liu J., Russell R.J., Walker P.A., Skehel J.J., Martin S.R., Hay A.J., Gamblin S.J. Crystal structures of oseltamivir-resistant influenza virus neuraminidase mutants. Nature. 2008;453:1258–1262. doi: 10.1038/nature06956. [DOI] [PubMed] [Google Scholar]
- Crotty S., Cameron C.E., Andino R. RNA virus error catastrophe: direct molecular test by using ribavirin. Proc. Natl. Acad. Sci. USA. 2001;98:6895–6900. doi: 10.1073/pnas.111085598. [DOI] [PMC free article] [PubMed] [Google Scholar]
- Domingo E., Gomez J. Quasispecies and its impact on viral hepatitis. Virus Res. 2007;127:131–150. doi: 10.1016/j.virusres.2007.02.001. [DOI] [PMC free article] [PubMed] [Google Scholar]
- Domingo E., Ruiz-Jarabo C.M., Sierra S., Arias A., Pariente N., Baranowski E., Escarmís C. Emergence and selection of RNA virus variants: memory and extinction. Virus Res. 2002;82:39–44. doi: 10.1016/s0168-1702(01)00385-9. [DOI] [PubMed] [Google Scholar]
- Drake J.W., Holland J.J. Mutation rates among RNA viruses. Proc. Natl. Acad. Sci. USA. 1999;96:13910–13913. doi: 10.1073/pnas.96.24.13910. [DOI] [PMC free article] [PubMed] [Google Scholar]
- Duwe S., Schweiger B. A new and rapid genotypic assay for the detection of neuraminidase inhibitor resistant influenzaA viruses of subtype H1N1, H3N2, and H5N1. J. Virol. Methods. 2008;153:134–141. doi: 10.1016/j.jviromet.2008.07.017. [DOI] [PubMed] [Google Scholar]
- Eckerle L.D., Becker M.M., Halpin R.A., Li K., Venter E., Lu X., Scherbakova S., Graham R.L., Baric R.S., Stockwell T.B., Spiro D.J., Denison M.R. Infidelity of SARS-CoV Nsp14-exonuclease mutant virus replication is revealed by complete genome sequencing. PLoS Pathog. 2010;6:e1000896. doi: 10.1371/journal.ppat.1000896. [DOI] [PMC free article] [PubMed] [Google Scholar]
- Eigen M. Viral quasispecies. Sci. Am. 1993;269:42–49. doi: 10.1038/scientificamerican0793-42. [DOI] [PubMed] [Google Scholar]
- Eigen M., McCaskill J. Molecular quasispecies. J. Phys. Chem. 1988;92:6881–6891. [Google Scholar]
- Emmott E., Wise H., Loucaides E.M., Matthews D.A., Digard P., Hiscox J.A. Quantitative proteomics using SILAC coupled to LC-MS/MS reveals changes in the nucleolar proteome in influenzaA virus-infected cells. J. Proteome Res. 2010;9:5335–5345. doi: 10.1021/pr100593g. [DOI] [PubMed] [Google Scholar]
- Figlerowicz M., Jackowiak P., Formanowicz P., Kedziora P., Alejska M., Malinowska N., Blazewicz J., Figlerowicz M. Hepatitis C virus quasispecies in chronically infected children subjected to interferon-ribavirin therapy. Arch. Virol. 2010;155:1977–1987. doi: 10.1007/s00705-010-0789-7. [DOI] [PMC free article] [PubMed] [Google Scholar]
- Fishman S.L., Branch A.D. The quasispecies nature and biological implications of the hepatitis C virus. Infect. Genet. Evol. 2009;9:1158–1167. doi: 10.1016/j.meegid.2009.07.011. [DOI] [PMC free article] [PubMed] [Google Scholar]
- Gambaryan A., Tuzikov A., Pazynina G., Bovin N., Balish A., Klimov A. Evolution of the receptor binding phenotype of influenza A (H5) viruses. Virology. 2006;344:432–438. doi: 10.1016/j.virol.2005.08.035. [DOI] [PubMed] [Google Scholar]
- Gao Y., Zhang Y., Shinya K., Deng G., Jiang Y., Li Z., Guan Y., Tian G., Li Y., Shi J., Liu L., Zeng X., Bu Z., Xia X., Kawaoka Y., Chen H. Identification of amino acids in HA and PB2 critical for the transmission of H5N1 avian influenza viruses in a mammalian host. PLoS Pathog. 2009;5:e1000709. doi: 10.1371/journal.ppat.1000709. [DOI] [PMC free article] [PubMed] [Google Scholar]
- Hasiów-Jaroszewska B., Jackowiak P., Borodynko N., Figlerowicz M., Pospieszny H. Quasispecies nature of Pepino mosaic virus and its evolutionary dynamics. Virus Genes. 2010;41:260–267. doi: 10.1007/s11262-010-0497-0. [DOI] [PubMed] [Google Scholar]
- Hoffmann E., Lipatov A.S., Webby R.J., Govorkova E.A., Webster R.G. Role of specific hemagglutinin amino acids in the immunogenicity and protection of H5N1 influenza virus vaccines. Proc. Natl. Acad. Sci. USA. 2005;102:12915–12920. doi: 10.1073/pnas.0506416102. [DOI] [PMC free article] [PubMed] [Google Scholar]
- Höper D., Hoffmann B., Beer M. Simple, sensitive, and swift sequencing of complete H5N1 avian influenza virus genomes. J. Clin. Microbiol. 2009;47:674–679. doi: 10.1128/JCM.01028-08. [DOI] [PMC free article] [PubMed] [Google Scholar]
- Höper D., Hoffmann B., Beer M. A comprehensive deep sequencing strategy for full-length genomes of influenzaA. PLoS One. 2011;6(4):e19075. doi: 10.1371/journal.pone.0019075. [DOI] [PMC free article] [PubMed] [Google Scholar]
- Iqbal M., Xiao H., Baillie G., Warry A., Essen S., Londt B., Brookes S.M., Brown I.H., McCauley J.V.V. Within-host variation of avian influenza viruses. Philos. Trans. R. Soc. Lond. B. 2009;364:2739–2747. doi: 10.1098/rstb.2009.0088. [DOI] [PMC free article] [PubMed] [Google Scholar]
- Jerzak G., Bernard K.A., Kramer L.D., Ebel G.D. Genetic variation in West Nile virus from naturally infected mosquitoes and birds suggests quasispecies structure and strong purifying selection. J. Gen. Virol. 2005;86:2175–2183. doi: 10.1099/vir.0.81015-0. [DOI] [PMC free article] [PubMed] [Google Scholar]
- Kaverin N.V., Rudneva I.A., Govorkova E.A., Timofeeva T.A., Shilov A.A., Kochergin-Nikitsky K.S., Krylov P.S., Webster R.G. Epitope mapping of the hemagglutinin molecule of a highly pathogenic H5N1 influenza virus by using monoclonal antibodies. J. Virol. 2007;81:12911–12917. doi: 10.1128/JVI.01522-07. [DOI] [PMC free article] [PubMed] [Google Scholar]
- Kaverin N.V., Rudneva I.A., Ilyushina N.A., Varich N.L., Lipatov A.S., Smirnov Y.A., Govorkova E.A., Gitelman A.K., Lvov D.K., Webster R.G. Structure of antigenic sites on the haemagglutinin molecule of H5 avian influenza virus and phenotypic variation of escape mutants. J. Gen. Virol. 2002;83:2497–2505. doi: 10.1099/0022-1317-83-10-2497. [DOI] [PubMed] [Google Scholar]
- Kongchanagul A., Suptawiwat O., Kanrai P., Uiprasertkul M., Puthavathana P., Auewarakul P. Positive selection at the receptor-binding site of haemagglutinin H5 in viral sequences derived from human tissues. J. Gen. Virol. 2008;89:1805–1810. doi: 10.1099/vir.0.2008/002469-0. [DOI] [PubMed] [Google Scholar]
- Kuroda M., Katano H., Nakajima N., Tobiume M., Ainai A., Sekizuka T., Hasegawa H., Tashiro M., Sasaki Y., Arakawa Y., Hata S., Watanabe M., Sata T. Characterization of quasispecies of pandemic 2009 influenzaA virus (A/H1N1/2009) by de novo sequencing using a next-generation DNA sequencer. PLoS One. 2010;5(4):e10256. doi: 10.1371/journal.pone.0010256. [DOI] [PMC free article] [PubMed] [Google Scholar]
- Lackenby A., Democratis J., Siqueira M.M., Zambon M.C. Rapid quantitation of neuraminidase inhibitor drug resistance in influenza virus quasispecies. Antivir. Ther. 2008;13:809–820. [PubMed] [Google Scholar]
- Langley W.A., Thoennes S., Bradley K.C., Galloway S.E., Talekar G.R., Cummings S.F., Vareckova E., Russell R.J., Steinhauer D.A. Single residue deletions along the length of the influenza HA fusion peptide lead to inhibition of membrane fusion function. Virology. 2009;394:321–330. doi: 10.1016/j.virol.2009.08.031. [DOI] [PubMed] [Google Scholar]
- Lauring A.S., Andino R. Quasispecies theory and the behavior of RNA viruses. PLoS Pathog. 2010;6:e1001005. doi: 10.1371/journal.ppat.1001005. [DOI] [PMC free article] [PubMed] [Google Scholar]
- Más A., López-Galíndez C., Cacho I., Gómez J., Martínez M.A. Unfinished stories on viral quasispecies and Darwinian views of evolution. J. Mol. Biol. 2010;397:865–877. doi: 10.1016/j.jmb.2010.02.005. [DOI] [PubMed] [Google Scholar]
- Matrosovich M., Zhou N., Kawaoka Y., Webster R. The surface glycoproteins of H5 influenza viruses isolated from humans, chickens, and wild aquatic birds have distinguishable properties. J. Virol. 1999;73:1146–1155. doi: 10.1128/jvi.73.2.1146-1155.1999. [DOI] [PMC free article] [PubMed] [Google Scholar]
- Matrosovich M.N., Gambaryan A.S., Teneberg S., Piskarev V.E., Yamnikova S.S., Lvov D.K., Robertson J.S., Karlsson K.-A. Avian influenzaA viruses differ from human viruses by recognition of sialyloligosaccharides and gangliosides and by a higher conservation of the HA receptor-binding site. Virology. 1997;233:224–234. doi: 10.1006/viro.1997.8580. [DOI] [PubMed] [Google Scholar]
- Miotto O., Heiny A.T., Albrecht R., Garcia-Sastre A., Tan T.W., August J.T., Brusic V. Complete-proteome mapping of human influenzaA adaptive mutations: implications for human transmissibility of zoonotic strains. PLoS One. 2010;5:e9025. doi: 10.1371/journal.pone.0009025. [DOI] [PMC free article] [PubMed] [Google Scholar]
- Ngamurulert S., Limjindaporn T., Auewaraku P. Identification of cellular partners of InfluenzaA virus (H5N1) non-structural protein NS1 by yeast two-hybrid system. Acta Virol. 2009;53:153–159. doi: 10.4149/av_2009_03_153. [DOI] [PubMed] [Google Scholar]
- OIE World Organisation for Animal Health, 2009. Manual of Diagnostic Tests and Vaccines for Terrestrial Animals 2010, Chapter 2.3.4: Avian Influenza. See: http://www.oie.int/fileadmin/Home/eng/Health_standards/tahm/2.03.04_AI.pdf. Accessed on 18 July 2011.
- Ojosnegros S., Beerenwinkel N., Antal T., Nowak M.A., Escarmís C., Domingo E. Competition-colonization dynamics in an RNA virus. Proc. Natl. Acad. Sci. USA. 2010;107:2108–2112. doi: 10.1073/pnas.0909787107. [DOI] [PMC free article] [PubMed] [Google Scholar]
- Operario D.J., Reynolds H.M., Kim B. Comparison of DNA polymerase activities between recombinant feline immunodeficiency and leukemia virus reverse transcriptases. Virology. 2005;335:106–121. doi: 10.1016/j.virol.2005.02.010. [DOI] [PubMed] [Google Scholar]
- Perdue M.L., García M., Senne D., Fraire M. Virulence-associated sequence duplication at the hemagglutinin cleavage site of avian influenza viruses. Virus Res. 1997;49:173–186. doi: 10.1016/s0168-1702(97)01468-8. [DOI] [PubMed] [Google Scholar]
- Philpott M., Hioe C., Sheerar M., Hinshaw V.S. Hemagglutinin mutations related to attenuation and altered cell tropism of a virulent avian influenzaA virus. J. Virol. 1990;64:2941–2947. doi: 10.1128/jvi.64.6.2941-2947.1990. [DOI] [PMC free article] [PubMed] [Google Scholar]
- Ramakrishnan M.A., Tu Z.J., Singh S., Chockalingam A.K., Gramer M.R., Wang P., Goyal S.M., Yang M., Halvorson D.A., Sreevatsan S. The feasibility of using high resolution genome sequencing of influenzaA viruses to detect mixed infections and quasispecies. PLoS One. 2009;4(9):e7105. doi: 10.1371/journal.pone.0007105. [DOI] [PMC free article] [PubMed] [Google Scholar]
- Randall R.E., Goodbourn S. Interferons and viruses: an interplay between induction, signalling, antiviral responses and viral countermeasures. J. Gen. Virol. 2008;89:1–47. doi: 10.1099/vir.0.83391-0. [DOI] [PubMed] [Google Scholar]
- Reed L.J., Muench H. A simple method for estimating fifty percent endpoints. Am. J. Hyg. 1938;27:493–497. [Google Scholar]
- Russell R.J., Haire L.F., Stevens D.J., Collins P.J., Lin Y.P., Blackburn G.M., Hay A.J., Gamblin S.J., Skehel J.J. The structure of H5N1 avian influenza neuraminidase suggests new opportunities for drug design. Nature. 2006;443:45–49. doi: 10.1038/nature05114. [DOI] [PubMed] [Google Scholar]
- Samuel C.E. Adenosine deaminases acting on RNA (ADARs) are both antiviral and proviral. Virology. 2011;411:180–193. doi: 10.1016/j.virol.2010.12.004. [DOI] [PMC free article] [PubMed] [Google Scholar]
- Seligman S.J. Evidence for quasi species in severe acute respiratory syndrome-associated coronavirus deletion mutants. J. Infect. Dis. 2007;195:609. doi: 10.1086/510917. [DOI] [PMC free article] [PubMed] [Google Scholar]
- Seo S.H., Hoffmann E., Webster R.G. Lethal H5N1 influenza viruses escape host anti-viral cytokine responses. Nat. Med. 2002;8:950–954. doi: 10.1038/nm757. [DOI] [PubMed] [Google Scholar]
- Shinya K., Hatta M., Yamada S., Takada A., Watanabe S., Halfmann P., Horimoto T., Neumann G., Kim J.H., Lim W., Guan Y., Peiris M., Kiso M., Suzuki T., Sukuki Y., Kawaoka Y. Characterization of a human H5N1 influenzaA virus isolated in 2003. J. Virol. 2005;79:9926–9932. doi: 10.1128/JVI.79.15.9926-9932.2005. [DOI] [PMC free article] [PubMed] [Google Scholar]
- Skehel J.J., Wiley D.C. Receptor binding and membrane fusion in virus entry: the influenza hemagglutinin. Annu. Rev. Biochem. 2000;69:531–569. doi: 10.1146/annurev.biochem.69.1.531. [DOI] [PubMed] [Google Scholar]
- Skinner J.A., Eperon I.C. Misincorporation by AMV reverse transcriptase shows strong dependence on the combination of template and substrate nucleotides. Nucleic Acids Res. 1986;14:6945–6964. doi: 10.1093/nar/14.17.6945. [DOI] [PMC free article] [PubMed] [Google Scholar]
- Steinhauer D.A. Role of hemagglutinin cleavage for the pathogenicity of influenza virus. Virology. 1999;258:1–20. doi: 10.1006/viro.1999.9716. [DOI] [PubMed] [Google Scholar]
- Stevens J., Blixt O., Tumpey T.M., Taubenberger J.K., Paulson J.C., Wilson I.A. Structure and receptor specificity of the hemagglutinin from an H5N1 Influenza virus. Science. 2006;312:404–410. doi: 10.1126/science.1124513. [DOI] [PubMed] [Google Scholar]
- Sulbaran Y., Gutierrez C.R., Marquez B., Rojas D., Sanchez D., Navas J., Rovallo E., Pujol F.H. HepatitisA virus genetic diversity in Venezuela: exclusive circulation of subgenotype IA and evidence of quasispecies distribution in the isolates. J. Med. Virol. 2010;82:1829–1834. doi: 10.1002/jmv.21856. [DOI] [PubMed] [Google Scholar]
- Suspène R., Petit V., Puyraimond-Zemmour D., Aynaud M.M., Henry M., Guétard D., Rusniok C., Wain-Hobson S., Vartanian J.P. Double-stranded RNA adenosine deaminase ADAR-1-induced hypermutated genomes among inactivated seasonal influenza and live attenuated measles virus vaccines. J. Virol. 2011;85:2458–2462. doi: 10.1128/JVI.02138-10. [DOI] [PMC free article] [PubMed] [Google Scholar]
- Tamura K., Peterson D., Peterson N., Stecher G., Nei M., Kumar S. MEGA5: molecular evolutionary genetics analysis using maximum likelihood, evolutionary distance, and maximum parsimony methods. Mol. Biol. Evol. 2011;28:2731–2739. doi: 10.1093/molbev/msr121. [DOI] [PMC free article] [PubMed] [Google Scholar]
- Taube R., Avidan O., Bakhanshvili M., Hizi A. DNA synthesis exhibited by the reverse transcriptase of mouse mammary tumor virus: processivity and fidelity of misinsertion and mispair extension. Eur. J. Biochem. 1998;258:1032–1039. doi: 10.1046/j.1432-1327.1998.2581032.x. [DOI] [PubMed] [Google Scholar]
- Thompson J., Higgins D., Gibson T. CLUSTAL W: improving the sensitivity of progressive multiple sequence alignment through sequence weighting, position-specific gap penalties and weight matrix choice. Nucleic Acids Res. 1994;22:4673–4680. doi: 10.1093/nar/22.22.4673. [DOI] [PMC free article] [PubMed] [Google Scholar]
- Van Borm S., Ferreira H.L., van den Berg T. Fine quantification of avian influenza H5N1 escape mutant quasispecies populations using mutation-specific real-time PCR. Avian Dis. 2010;54:558–564. doi: 10.1637/8756-033109-ResNote.1. [DOI] [PubMed] [Google Scholar]
- Van Nimwegen E., Crutchfield J.P., Huynen M. Neutral evolution of mutational robustness. Proc. Natl. Acad. Sci. USA. 1999;96:9716–9720. doi: 10.1073/pnas.96.17.9716. [DOI] [PMC free article] [PubMed] [Google Scholar]
- Walker J.A., Kawaoka Y. Importance of conserved amino acids at the cleavage site of the haemagglutinin of a virulent avian influenzaA virus. J. Gen. Virol. 1993;74:311–314. doi: 10.1099/0022-1317-74-2-311. [DOI] [PubMed] [Google Scholar]
- Ward S.V., George C.X., Welch M.J., Liou L.Y., Hahm B., Lewicki H., de la Torre J.C., Samuel C.E., Oldstone M.B. RNA editing enzyme adenosine deaminase is a restriction factor for controlling measles virus replication that also is required for embryogenesis. Proc. Natl. Acad. Sci. USA. 2011;108:331–336. doi: 10.1073/pnas.1017241108. [DOI] [PMC free article] [PubMed] [Google Scholar]
- Watanabe, Y., Ibrahim, M.S., Ellakany, H., Abd El-Hamid, H.S., Ikuta, K., 2011. Genetic diversification of H5N1 Highly Pathogenic Avian InfluenzaA virus during replication in wild ducks. J. Gen. Virol. [Epub ahead of print]. [DOI] [PubMed]
- Wilke C.O. Adaptive evolution on neutral networks. Bull. Math. Biol. 2001;63:715–730. doi: 10.1006/bulm.2001.0244. [DOI] [PubMed] [Google Scholar]
- Wilke C.O. Quasispecies theory in the context of population genetics. BMC Evol. Biol. 2005;5:44. doi: 10.1186/1471-2148-5-44. [DOI] [PMC free article] [PubMed] [Google Scholar]
- Wilke C.O., Adami C. Evolution of mutational robustness. Mut. Res. 2003;522:3–11. doi: 10.1016/s0027-5107(02)00307-x. [DOI] [PubMed] [Google Scholar]
- Yamada S., Suzuki Y., Suzuki T., Le M.Q., Nidom C.A., Sakai-Tagawa Y., Muramoto Y., Ito M., Kiso M., Horimoto T., Shinya K., Sawada T., Kiso M., Usui T., Murata T., Lin Y., Hay A., Haire L.F., Stevens D.J., Russell R.J., Gamblin S.J., Skehel J.J., Kawaoka Y. Haemagglutinin mutations responsible for the binding of H5N1 influenzaA viruses to human-type receptors. Nature. 2006;444:378–382. doi: 10.1038/nature05264. [DOI] [PubMed] [Google Scholar]
- Yen H.-L., Herlocher L.M., Hoffmann E., Matrosovich M.N., Monto A.S., Webster R.G., Govorkova E.A. Neuraminidase inhibitor-resistant influenza viruses may differ substantially in fitness and transmissibility. Antimicrob. Agents Chemother. 2005;49:4075–4084. doi: 10.1128/AAC.49.10.4075-4084.2005. [DOI] [PMC free article] [PubMed] [Google Scholar]
- Yen H.-L., Ilyushina N.A., Salomon R., Hoffmann E., Webster R.G., Govorkova E.A. Neuraminidase inhibitor-resistant recombinant A/Vietnam/1203/04 (H5N1) influenza viruses retain their replication efficiency and pathogenicity in vitro and in vivo. J. Virol. 2007;81:12418–12426. doi: 10.1128/JVI.01067-07. [DOI] [PMC free article] [PubMed] [Google Scholar]
- Zambon M., Potter C.W. Influenza. In: Zuckerman A.J., Banatvala J.E., Schoub B.D., Griffiths P.D., Mortimer P., editors. Principles and practice of clinical virology. sixth edition. John Wiley & Sons; Chichester: 2009. [Google Scholar]
- Zhou H., Zhu J., Tu J., Zou W., Hu Y., Yu Z., Yin W., Li Y., Zhang A., Wu Y., Yu Z., Chen H., Jin M. Effect on virulence and pathogenicity of H5N1 influenza A virus through truncations of NS1 eIF4GI binding domain. J. Infect. Dis. 2010;202:1338–1346. doi: 10.1086/656536. [DOI] [PubMed] [Google Scholar]
Associated Data
This section collects any data citations, data availability statements, or supplementary materials included in this article.
Supplementary Materials
Derivation of the mutation distribution models.
List of primers and their sequences.
Distribution of the number of mutations per clone - All mutations. Each table cell indicates: (observed number of mutations)/(expected number of mutations) ± (standard deviation). Observed values are for all mutations. Expected values are calculated according to a Poisson process with a mutation frequency ftot = (number of mutations)/(number of nucleotides) = #mut/#nt = 1.58 × 10⁻³ (See Supplementary Annex for details). ∗Cells with 1% < p-value ⩽ 5% are shaded in grey. ∗∗Cells with p-value ⩽ 1% are shaded in yellow.
Distribution of the number of mutations per clone - All mutations except A > G and T > C. Each table cell indicates: (observed number of mutations)/(expected number of mutations) ± (standard deviation). A > G and T > C mutations have been removed. Expected values are calculated according to a Poisson process with a mutation frequency ftot = [(number of mutations)−A > G−T > C]/(number of nucleotides) = (#mut−A>G−T>C)/#nt = 3.03 × 10⁻⁴ (See Supplementary Annex for details). ∗Cells with 1% < p-value ⩽ 5% are shaded in grey. ∗∗Cells with p-value ⩽ 1% are shaded in yellow.
Distribution of the number of mutations per site - All mutations. Each table cell indicates: (observed number of mutations)/(expected number of mutations) ± (standard deviation). Observed values are for all mutations. Expected values are calculated according to a Poisson process with a mutation frequency ftot = (number of mutations)/(number of nucleotides) = #mut/#nt = 1.58 × 10⁻³ (See Supplementary Annex for details).∗Cells with 1% < p-value ⩽ 5% are shaded in grey. ∗∗Cells with p-value ⩽ 1% are shaded in yellow.
Distribution of the number of mutations per site - All mutations except A > G and T > C. Each table cell indicates: (observed number of mutations)/(expected number of mutations) ± (standard deviation). A > G and T > C mutations have been removed. Expected values are calculated according to a Poisson process with a mutation frequency ftot = [(number of mutations)−A > G−T > C]/(number of nucleotides) = (#mut - A > G−T > C)/#nt = 3.03 × 10⁻⁴. (See Supplementary Annex for details). ∗Cells with 1% < p-value ⩽ 5% are shaded in grey. ∗∗Cells with p-value ⩽ 1% are shaded in yellow.
Distribution of the number of mutations per reading frame.