

Highlights
-
•
Methodical evaluation of thermography based computer aided diagnosis systems.
-
•
Thermography based diagnosis is better than its reputation.
-
•
Competition improves computer aided diagnosis systems.
-
•
A glimpse into the future: computer diagnosis will ultimately eclipse human diagnosis.
Keywords: Thermography, Computer aided diagnosis, Feature extraction, Feature evaluation, Classifier, Performance evaluation
Abstract
The invention of thermography, in the 1950s, posed a formidable problem to the research community: What is the relationship between disease and heat radiation captured with Infrared (IR) cameras? The research community responded with a continuous effort to find this crucial relationship. This effort was aided by advances in processing techniques, improved sensitivity and spatial resolution of thermal sensors. However, despite this progress fundamental issues with this imaging modality still remain. The main problem is that the link between disease and heat radiation is complex and in many cases even non-linear. Furthermore, the change in heat radiation as well as the change in radiation pattern, which indicate disease, is minute. On a technical level, this poses high requirements on image capturing and processing. On a more abstract level, these problems lead to inter-observer variability and on an even more abstract level they lead to a lack of trust in this imaging modality. In this review, we adopt the position that these problems can only be solved through a strict application of scientific principles and objective performance assessment. Computing machinery is inherently objective; this helps us to apply scientific principles in a transparent way and to assess the performance results. As a consequence, we aim to promote thermography based Computer-Aided Diagnosis (CAD) systems. Another benefit of CAD systems comes from the fact that the diagnostic accuracy is linked to the capability of the computing machinery and, in general, computers become ever more potent. We predict that a pervasive application of computers and networking technology in medicine will help us to overcome the shortcomings of any single imaging modality and this will pave the way for integrated health care systems which maximize the quality of patient care.
Nomenclature
Acronyms
- A
Accuracy
- ANN
Artificial Neural Network
- AUC
Area Under Curve
- BCDDP
Breast Cancer Detection Demonstration Project
- CAD
Computer-Aided Diagnosis
- DFT
Discrete Fourier Transform
- CRPS
Complex Regional Pain Syndrome
- DT
Decision Tree
- DWT
Discrete Wavelet Transform
- FD
Fractal Dimension
- FDA
U.S. Food and Drug Administration
- FN
False Negative
- FP
False Positive
- FS
Fourier Spectrum
- GLCM
Gray Level Co-occurrence Matrix
- HOS
Higher Order Spectra
- IR
Infrared
- IRT
Infrared Thermography
- LBP
Local Binary Pattern
- LLE
Locally Linear Embedding
- LTE
Law’s Texture Energy
- MP
Measurement and Procedure
- NCI
National Cancer Institute
- PE
Performance Evaluation
- PNN
Probabilistic Neural Network
- POD
Probability of Detection
- RBF
Radial Basis Function
- ROC
Receiver Operating Characteristic
- ROI
Regions Of Interest
- SARS
Severe Acute Respiratory Syndrome
- Se
Sensitivity
- SOM
Self Organizing Map
- Sp
Specificity
- SVM
Support Vector Machine
- TN
True Negative
- TP
True Positive
- WCOB
Weighted Center Of Bispectrum
1. Introduction
An unexpected increase of heat indicates that something is wrong. This might be one of these universal truths which are almost to sweeping and far-reaching to be credible. In the world of mechanics, increased friction develops heat and causes wear which can led to material failure [1]. Therefore, heat pattern and indeed heat pattern changes give a good indication of machine health [2]. By a striking coincidence, diagnosing via heat pattern is not limited to mechanical systems both electronic and biological systems follow the same pattern. Especially, the human body temperature has been linked to health since the time of Hippocrates [3]. Since then, the diagnostic accuracy was linked to the instruments used for temperature measurement. Therefore, the discovery and capture of Infrared (IR) radiation from the human body, by Herschel in 1800, was a big step forward [3]. These measurements are based on the physical phenomena, that all objects, including the human body, with a temperature above absolute zero (−273 K) emit IR radiation from their surface [4]. Experiments showed that human skin emits IR radiation essentially in the range of 2–20 μm wavelengths, with an average peak at 9–10 μm. Despite this understanding, it took until 1934 before Hardy described the physiological role of IR emission from the human body. He put forward that both physiological processes and thermal properties of the skin are influenced by a wide range of factors, because the skin helps to manage the core body temperature. These factors change in the presence of disease, hence IR measurements can be used for diagnostic purposes [5]. This fundamental understanding paved the way for IR thermography as a body imaging modality for medical sciences. The first use of this new technology was reported in the year 1960, it took so long because quality equipment and technical knowhow was unavailable [6]. Since 1963 it is known that heat patterns, shown in thermographic images taken with IR cameras, provide information about physical anomalies, such as cancer, especially breast cancer, infection, eye disease, diabetes and pain [7]. However, having a qualitative statement based on general observations is something different from a quantitative statement, which expresses how useful the method is for medical diagnosis [8]. In terms of medical applications, the usefulness of a particular diagnostic method can be expressed in terms of the ability to deliver a correct diagnosis, the side effects and the cost.
Heat pattern measurement, via thermography, is fast, non-contact, non-invasive, it is even passive, i.e. no potentially harmful radiation is sent through the biological system, only the body heat is captured [9]. The body would give up this heat radiation in any case, regardless of whether or not it is measured. Passive imaging modalities for medical applications attract much interest, because they are 100% side effect free [10]. Therefore, the US clinical community viewed medical thermography as an exciting and very promising technology for a variety of diagnostic applications, in the decade that followed after the first appearance of IR body images [11]. However, despite this striking advantage over other imaging modalities and the initial enthusiasm, medical thermography has been in decline since 1980 [12]. During this time, the National Cancer Institute (NCI) started the widely cited Breast Cancer Detection Demonstration Project (BCDDP) [13]. One major finding of this project was that thermography is ineffective for breast cancer screening [14]. In retrospect, this study had serious shortcomings in the way thermography images were captured [15]. To be specific, only five out of 27 participating cancer centers had sufficiently qualified personal for taking and assessing thermography images. Gautherie et al. pointed out that a lack of technical skill and expertise for thermography image interpretation leads to a sharp decline in diagnostic accuracy [16]. The need for quality assurance, during the act of image acquisition, is further emphasized by the fact that the high false positive range of 10–30% depends on the disease and the technique used. In recent years, proper protocol, such as equipment considerations preparation of patient, examination environment, and standardization of thermal imager system have been discussed elaborately in [17], [18], [19], [20]. This lead to the postulation of image capture protocols [21], [22]. So, on an abstract level, Infrared Thermography (IRT) based diagnosis suffered from interoperator dependency and inadequate equipment. As a consequence, in 1982 the Food and Drug Administration (FDA) approved thermography only as a supplement to mammography for breast cancer screening [23]. The FDA enforced this judgment in 2011 when the organization issued a press release stating that: “…the FDA is unaware of any valid scientific evidence showing that thermography, when used alone, is effective in screening for breast cancer …” [24].
To overcome the historic prejudices against thermography, and the real problems with the technology, scientific principles have to be applied in a strict way to build trust as well as to improve the diagnostic capabilities of IRT. One of these scientific principles is transparent and objective performance assessment. Therefore, in this review we report the perforce of thermography based diagnostic systems for diabetes, infection, cancer, eye diseases and pain. Based on this review, we adopt the position that thermography image interpretation can be aided with computer preprocessing. From there it is just a small, but important step, to automate the diagnosis process as well. The importance of this step comes from the promise of progress: As computing machines get more capable, and algorithms improve, the diagnostic accuracy will increase. Another important benefit of Computer-Aided Diagnosis (CAD) is cost efficiency. Once these systems are up and running, the operation cost is low, when compared with expert human labor. Furthermore, CAD systems integrate seamlessly into digital work-flows of modern hospitals. This high level of integration and the low human interaction results in two beneficial properties: fast throughput and centralized processing. As a result, there is a real chance that future thermography based CAD systems will deliver unparalleled safety together with a high level of reliability and diagnostic accuracy.
To support our position, we have organized the paper as follows: The next section gives an overview of the algorithms used in thermography based CAD systems. Section 3 reviews to what extent these techniques were used in current and past thermography systems. In Section 4 we discuss the review results. Section 5 provides concluding remarks and an attempt to define the future direction of thermography based CAD systems.
2. Methodology of the CAD system
CAD plays a significant role in the analysis of IR images. Human examination of IR images is often imperfect, because it is influenced by various factors like fatigue, being careless, and sensory overload by the sheer volume of information from this medical imaging modality. Making the right diagnosis is also constrained by the limits of human visual perception. For example, optical illusions have a detrimental impact on the diagnostic accuracy [25]. Furthermore, there is a shortage of qualified radiologists [26]. These facts manifest an urgent need to develop CAD technologies. Current research aims to improve the detection accuracy of IR image processing algorithms from three perspectives: asymmetry analysis of the thermogram including automatic segmentation approaches, smart image enhancement and restoration algorithms, and feature extraction and classification [27], [28], [29], [30].
To design such CAD systems, a clear understanding of design patterns and system structure is needed. To explain the system structure, we have adopted a top down approach which introduces the individual design steps necessary to create a generic thermography based CAD system. The block diagram, shown in Fig. 1 , introduces these design steps and the logical connection between them. The diagram is divided into offline and online systems. In the offline system, all the IR images will be pre-processed and their greyscale features may be extracted using various techniques. Subsequently, the extracted greyscale features will be analyzed with statistical methods to identify which features are significant enough to be used in the classification step. The significant features, together with the ground truth of each image class, will then be used to train a classifier. The result from this offline system is a set of classifier parameters that relates the significant features to the ground truth. The online system has a pre-processing stage as well and thereafter only those greyscale features, that were found to be significant in the offline system, are computed for the testing set of images.
Fig. 1.
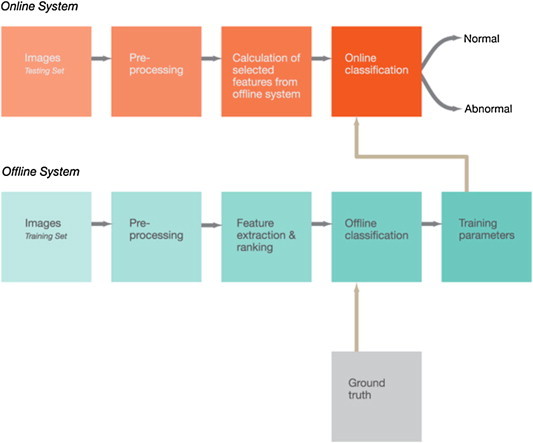
Blockdiagram of a CAD system based on thermograms.
2.1. Pre-processing
Preprocessing deals with the non-uniformity of IR images. Another source of non-uniformity is fluctuating lighting conditions such as incandescent bulb or direct sun light. Therefore, it may be required to resize the images using techniques, such as template and interpolation methods [31]. Another source of non-uniformity is fluctuating lighting conditions. The adaptive histogram equalization method can eliminate the discontinuous background, which may result from discontinuous lighting or other inconsistencies that originate from the IR image capturing technique [32, Chapter 2]. It maps the input to the output image pixel intensity values such that the output image exhibits uniformly distributed intensities. This increases the dynamic range of the image histogram.
2.2. Feature extraction
Textures, entropies, Fourier Spectrum (FS) descriptors, Hu’s invariant moments and Higher Order Spectra (HOS) methods can be used to extract features [33]. These methods are briefly explained below.
2.2.1. Texture
Textural changes are a totally new paradigm for feature collection. Gray Level Cooccurrence Matrix (GLCM) [34], run length matrix [35], Fractal Dimension (FD) [36], [37], [38], Local Binary Pattern (LBP) [39], Locally Linear Embedding (LLE) [40] and Law’s Texture Energy (LTE) [41], [42] can be used to extract useful information for the differential diagnosis of normal and abnormal classes.
2.2.2. Entropy
Entropy measures the randomness of the pixel intensity distribution in an image. It provides insight into both extent and nature of randomness and it shows how disordered the image pixels are. There are two categories of entropy: Shannon and non-Shannon [43]. Over a range of scattering conditions, Shannon entropy has a lower dynamic range than non-Shannon entropies. This makes non-Shannon entropies more useful in estimating scatter density and regularity. Examples of non-Shannon entropies, that can be used to extract features for automated disease diagnosis, are: Renyi’s, Kapur’s and Yager’s entropy [44], [45], [46].
2.2.3. Hu’s invariant moments
The global characteristics of shapes, within an image, are generally represented by a set of moment functions. This set of moments provides information about the different types of geometrical image features. Hu’s invariant moments are a set of non-linear functions that were developed from regular moments. Their main advantage comes from the fact that they are invariant to translation, size alteration and rotation. Hu’s invariants describe a total of seven moment functions, which reach up to the third order [47].
2.2.4. Discrete Wavelet Transform (DWT)
The Discrete Wavelet Transform (DWT) captures both frequency and location of features within a thermorgraphy image. This is important, because this information helps the CAD system to identify features of interest. For example, features, such as the thermographic pattern of breast cancer, have sharp borders. These sharp borders shape high frequency DWT coefficients with high levels of location (spatial) accuracy. In contrast, larger objects with smooth edges shape low frequency coefficients with low spatial resolution [48]. The DWT coefficients are established by sending a signal through a sequence of down-sampling low- and high-pass filters [49], [50]. The low- and high-pass filter output is known as approximation and detail coefficients respectively. Mookiah et al. used a novel combination of one texture and two DWT-based features to quantify the non-linear changes in malignant and normal breast IR images [51].
2.2.5. Higher Order Spectra (HOS)
HOS, usually referred to as polyspectra, consist of higher order moments that have an order greater than two. Furthermore, polyspectra also include non-linear combinations of higher order moments, known as cumulants. Third and fourth order spectra are commonly referred to as bispectrum and trispectrum respectively [52]. Features, related to the third order spectra, i.e. bispectra, can be used to extract information for automated diagnosis [53], [54].
Before the extraction of greyscale features via HOS, the images need to be subjected to the Radon transform. This transform will convert 2D images into 1D signals at various angles and thereafter the calculation of greyscale features, using HOS, will begin [55].
The Fourier Transform, of the third order 1D signal correlation, will be used to find the bispectrum. The following formula defines this relationship:
| (1) |
where, is the Fourier transform of the 1D signal and represents the expectation operation. Both bispectrum phase entropy [56] and normalized bispectrum entropies can be used as features. Various bispectrum entropies, bispctrum phase entropy, Weighted Center Of Bispectrum (WCOB), sum of logarithmic amplitudes can be evaluated from the bispectrum of the signal [57], [58].
2.2.6. Fourier Spectrum (FS) descriptors
To quantify changes in the outline (edges or contours) of image regions, the FS descriptor is used, because these descriptors are not invariant to scaling and translation [59]. For any edge, within an image, having coordinates , where represent the edge points of an object, the FS descriptors are denoted by the following expression:
| (2) |
where . In Eq. (2), each point is treated as a complex number [60]. The FS descriptors are defined as the Discrete Fourier Transform (DFT) coefficients of the complex vector , which is formed by the edge points. It is expressed by:
| (3) |
2.3. Statistical analysis
Statistical analysis is part of the quantitative approach to knowledge. During the design of thermography based CAD systems, statistical analysis is used to summarize the data and understand the processes which generate the data. In most cases, this is done by making a mathematical model from which the data generating processes can be inferred. Furthermore, statistical analysis gives us a way to quantify how confident we are in these inferences [61], [62], [63].
2.3.1. Feature selection
Student’s t-test can be used to detect the clinical significance of extracted features by evaluating the p-value. This value indicates whether or not the means of two classes are statistically different [64]. A lower p-value indicates that the feature has more clinical significance [65]. To evaluate the feature performance for CAD systems, the feature which has the lowest p-value is ranked first and so on. Subsequently, the ranked features are applied one by one until the highest classification accuracy is reached.
2.4. Classification
Automated classification algorithms are a solution to the machine learning and statistics problem of finding the category or class of a new observation. Classifiers have been used in a wide range of CAD systems [66]. Supervised algorithms call for training data, which contains observations where the category membership is known, i.e. the ground truth is available. The main idea behind these classification algorithms is to extract information, which differentiates the individual categories, from the training dataset. The act of information extraction is known as learning phase. The extracted information is used in the classification phase to decide to which category or class a new observation belongs.
2.4.1. Support Vector Machine (SVM)
Support Vector Machine (SVM) classifiers train easily and they can generalize the training information to a wide range of classification problems. The algorithm searches for a hyperplane, which subsequently serves as a decision surface. This surface separates the datapoints, which belong to distinct classes, from each other with maximum margin. SVM are popular, because of their high classification accuracy even under adverse conditions, such as non-linear and high dimensional datasets and very few cases for training the model [66], [67].
If the data is non-linear, the boundary problems, encountered by the SVM, are non-linear as well [68], [69]. To handle such data, kernels are used to facilitate a non-linear mapping of the input data to a high-dimensional space [70]. Various kernel functions like, linear, polynomial of order 2, and 3 as well as Radial Basis Function (RBF), can be used.
2.4.2. Decision Tree (DT)
The Decision Tree (DT) is a simplified model that breaks down a complicated decision making process into a simple sequence of binary questions. It consists of decision nodes which extend downwards from a root node [71, Chapter 6]. An attribute is tested with each outcome in a branch at each decision node. The branches may end at another decision node or terminate at a leaf node. Nicandro et al. used this classifier to evaluate the diagnostic power of thermography in breast cancer [72].
2.4.3. Fuzzy Sugeno
The pattern space, in a Fuzzy Sugeno classifier, is divided into many subspaces. For each subspace, if-then type rules show the relationship between targeting the patterns and their corresponding classes. The Fuzzy Sugeno classifier discriminates unknown patterns with fuzzy inference and rejects pattern of an unknown class [73], [74]. This type of classifier was successfully used, together with a hybrid feature extraction strategy, for breast cancer detection [51].
2.4.4. k-Nearest Neighbour
k-Nearest Neighbour is a very simple classifier which determines the k nearest neighbors for a specific query instance by calculating the minimum distance to the training samples [75], [76]. A data point is classified by the majority of votes from these k neighbors. If k is 1, then the data point is assigned to the class of the nearest neighbor. For well designed algorithms, nearer data points give a higher contribution as compared to data points which are further apart [51].
2.4.5. Probabilistic Neural Network (PNN)
The Probabilistic Neural Network (PNN) classifier uses four layers of neurons to implement a kernel discriminant analysis step [77], [78]. Features, extracted from IR images, are fed from the input layer into a hidden later which computes of the Euclidean distance of the test data from the center point of the hidden neuron [51]. The RBF kernel function uses the sigma values, which were computed as part of the Euclidean distance evaluation in the hidden layer. The results from the hidden layer are fed to the pattern layer, which contains a pattern neuron for each class. Each weighted vote is added to the corresponding neuron from the hidden layer in the pattern layer. In the final layer, the largest votes are used to predict the unknown class by comparing the weighted votes, for each class, with predetermined values, which are stored in the pattern layer.
2.4.6. Self Organizing Map (SOM)
The Self Organizing Map (SOM) method visualizes high dimensional data by converting complex, non-linear statistical relationships into straight forward geometric relationships on a low-dimensional plain [79]. With this conversion, the algorithm compresses the data while preserving the most important topological and metric relationships of the initial data elements [80]. This creates a special kind of abstraction. These abilities are particularly important for extracting information from thermogram images [81], [82].
2.4.7. Artificial Neural Network (ANN)
Artificial Neural Networks (ANN) are parallel-distributed information processing structures which model the functionality of small biological neural clusters and thereby they mimic human decision making [83]. In many cases, ANN are trained with the so called backpropagation algorithm [84]. Due to its parallel nature, ANN algorithms can reach a decision after a relatively short processing time. Therefore, they are applied in hard realtime systems, such as mass fever scanning [82].
2.4.8. Data resampling and performance evaluation
The cross-validation method assesses a classifier with a training dataset [85]. For this technique, the entire dataset is randomly split into k equal (almost) parts. Each part contains the same ratio of samples from both classes [86]. In the first iteration (fold), data parts are used to train the classifier and the remaining part is used for testing. The iteration is repeated times using a different test set (with the remaining folds as training sets) each time. This procedure is used to develop classifiers for thermography based CAD systems [87].
In the offline system, the classification results are assessed by performance measures, such as True Positive (TP), True Negative (TN), False Positive (FP), False Negative (FN) Accuracy (A), Sensitivity (Se) and Specificity (Sp). This assessment helps to select the most appropriate classification algorithm for online system. The individual measures are briefly explained below:
-
•
TN = Number of normal data classified as normal.
-
•
FN = Number of depression data classified as normal.
-
•
TP = Number of depression data correctly classified as they are.
-
•
FP = Number of normal data classified as abnormal (depression).
-
•
A = (TP + TN)/(TP + FN + TN + FP).
-
•
Se = TP/(TP + FN).
-
•
Sp = TN/(TN + FP).
2.4.9. Receiver Operating Characteristic (ROC)
The diagnostic accuracy is a measure for the clinical significance of a CAD system [88]. Receiver Operating Characteristic (ROC) plots provide a pure index of accuracy by demonstrating the limits of a test’s ability to discriminate between alternative states of health over the complete spectrum of operating conditions. A wide range of studies on IR thermography used the ROC curve to measure the cutoff point, diagnostic accuracy (indicated by the area under the curve), sensitivity, and specificity [67], [89]. Despite these positive characteristics, Cook points out that ROC measures may be mediocre in assessing models that predict future risk or stratify individuals into risk categories [90].
From the algorithmic perspective, ROC is a method to evaluate the ability of a test to discriminate diseased cases from normal cases. ROC allows us to perform an objective comparison between two or more imaging modalities. ROC is a useful approach because other methods do not quantify diagnostic accuracy in sufficiently complete or meaningful way. In brief, ROC analysis is used to select the optimal cut point to dichotomize a continuous scale. The usual choice of cut points minimizes the overall number of false positive and false negative errors. The cut point may be shifted if the cost of false positives is higher than that of false negatives, or vice versa.
Probability of Detection (POD) is based on TN, FN, TP and FP. The best way to describe a confidence curve, say with 98%, is as follows: If the actual POD curve, were to be reconstructed repeatedly using the same method and data, then 98% of those constructed curves would be above the confidence curve (i.e. 2% would be below). As a consequence, we are 98% sure that the REAL POD curve is above the confidence curve. The confidence level must also consider the effects of the full matrix for POD where we have the potential for false calls.
3. Applications
This section discusses four prominent application areas where thermography is used for disease diagnosis. The first of these areas is diabetes diagnosis, more specifically CAD systems for diabetic foot. The next important application area is infection diagnosis. Thermography based CAD systems help to screen for fever patients in places with a high volume of people, such as airports and border crossings. Cancer, especially breast cancer in woman, is the next application area. In this area, thermography has a weaker position against the established mammography. However, this fact sparks some of the most advanced work on thermography based CAD systems. The work on eye diseases is less advanced, because it suffers from the limited availability of IR images. The CAD for pain is a very complex concept, because pain itself is very difficult to diagnose. Despite this fact, there are a number of CAD systems for this application area.
The review of the thermography systems, from these diverse application areas, focuses on the building blocks of the CAD system. This strategy ensures transferable and relevant results across the application areas. The assessment begins with Measurement and Procedure (MP). This performance parameter is composed from an integer, which indicates the measurement used, and a character, that suggests how the procedure is applied. In the measurement section (integer) we assess the work according to the following criteria:
-
1.
Points of interest – One or multiple discrete measurement points on the IR image.
-
2.
Regions Of Interest (ROI) or template – Predefined regions where an average temperature is obtained.
-
3.
Feature obtained via image processing – A single measure which takes into account the heat distribution structure of the human skin.
-
4.
Feature vector obtained via image processing – Multiple measures which are obtained by assessing the heat distribution structure. The results of the individual measures form a feature vector.
-
5.
Feature vector whose elements come from diverse sources – This setup represents the most advanced form of CAD systems. For most systems the resulting feature vectors are used as input to automated classification algorithms.
The procedure part (character) of the MP criteria, establishes the way in which the studies were conducted. This is an important assessment criterion, because the false positive rate of the diagnosis depends, to a large extend, on this setup:
-
(a)
Comparison between groups of individuals – Most studies in this category discriminate between IR images from diseased and normal individuals.
-
(b)
Comparison between different symmetrical parts of the human body – This method is based on the fact that the human thermoregulatory system is substantially symmetrical [91]. The advantage of differential over group based methods is that for a symmetrical measurement there is no need to establish a general ground truth [92]. To be specific, the relevant information is extracted from the discrepancy between the temperature patterns exhibited by symmetrical parts of the human body [93].
The Performance Evaluation (PE) criteria assess the work in terms of the following criteria:
-
(1)
Statistical analysis – This analysis can be done with Student’s t-test which assesses whether or not two or more feature sets are statically different. Less advanced statistical analysis methods evaluate just mean and variance values.
-
(2)
Threshold – Thresholding is the simplest classification method. It takes only a single scalar value into account. For thermography, this single scalar value is usually the temperature measured in one point or in a region of the IR image. A temperature value above the threshold indicates disease and a value below the threshold indicates a normal sample. More advanced analysis is done using ROC and Area Under Curve (AUC) [67], [88], [94]. However, both methods are based on scalar thresholding as well.
-
(3)
Classifier – Automated classification algorithms represent the most advanced way to discriminate different signal classes, or in terms of CAD systems, to discriminate normal from diseased individuals. The reason for this superiority comes from the fact that classification algorithms take into account feature vectors, which represent relevant information about the image. In general, each feature vector constitutes a point in high dimensional vector spaces. This technique is much more flexible, and truer to the nature of diagnosis, 1 than simple thresholding methods. To be specific, thresholding methods are limited to discriminate points on a line, i.e. one dimensional space. In most practical scenarios, this is insufficient to achieve an acceptable classification accuracy.
The subsequent Sections describe five different application areas. Each of these sections contains a table which describes the thermography based CAD methods used in this application area. Fig. 2 shows the table header with additional information.
Fig. 2.
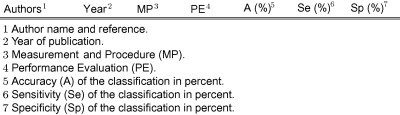
Header structure of the result tables.
3.1. Diabetes
Thermography can be used to visualize morphological skin temperature pattern that depend on blood circulation. In ischemic conditions, where blood perfusion may be reduced, especially at the periphery of the human body and limbs (hands and feet), these temperature pattern change [95]. Diabetic foot complications are expensive and they reduce the quality of life for many patients [96]. More specifically, neuropathic foot ulceration is a major cause of morbidity in patients with diabetes and it commonly leads to prolonged hospital stays [97]. Table 1 represents the work published on CAD systems for diabetes detection. Each row details one study and this study was assessed in terms of MP, PE, A, Se and Sp. For example, the study by Peregrina et al. was done in 2013 [98]. MP = 2b indicates that they used ROI or a template to determine the temperature from an IR image and that they compare the temperature differences of symmetrical body parts. 2 The temperature results were analyzed with statistical methods. Neither threshold nor classification methods were used, therefore A, Se and Sp were not reported.
Table 1.
Diabetes diagnosis performance.
| Authors | Year | MP | PE | A (%) | Se (%) | Sp (%) |
|---|---|---|---|---|---|---|
| Peregrina et al. [98] | 2013 | 2b | 1 | – | – | – |
| Sivanandam et al. [94] | 2013 | 1a | 2 | 72 | 90 | 55 |
| Tamaki [99] | 2013 | 2b | 1 | – | 60 | 100 |
| Balbinot et al. [100] | 2013 | 1b | 1 | – | – | – |
| Mori et al. [101] | 2013 | 3b | 1 | – | – | – |
| Najafi et al. [102] | 2012 | 2b | 1 | – | – | – |
| Barriga et al. [103] | 2012 | 2b | 1 | – | – | – |
| Balbinot et al. [63] | 2012 | 1b | 2 | – | 81.3 | 46.2 |
| Nagase et al. [61] | 2011 | 1b | 1 | – | – | – |
| Bagavathiappan et al. [104] | 2010 | 2b | 1 | – | – | – |
| Kaabouch et al. [105] | 2009 | 3b | – | – | – | – |
| Lavery et al. [106] | 2007 | 1a | 1 | – | – | – |
| Sun et al. [107] | 2006 | 2a | 1 | – | – | – |
| Armstrong et al. [108] | 2006 | 3b | 1 | – | – | – |
| Bharara et al. [109] | 2006 | 1b | 1 | – | – | – |
| Marcinkowska-Gapińska and Kowal [110] | 2006 | 2a | 1 | – | – | – |
| Sun et al. [111] | 2005 | 2a | 1 | – | – | – |
| Armstrong et al. [112] | 2003 | 1b | 1 | – | – | – |
| Jiang et al. [113] | 2002 | 2a | 1 | – | – | – |
| Fujiwara et al. [114] | 2000 | 2a | 1 | – | – | – |
| Hosaki et al. [115] | 1999 | 2b | – | – | – | |
| Armstrong et al. [116] | 1997 | 1b | 1 | – | – | – |
| Benbow et al. [62] | 1994 | 1b | 1 | – | – | – |
| Stess et al. [117] | 1986 | 2a | 1 | – | – | – |
| Fushimi et al. [118] | 1985 | 3b | 1 | – | – | – |
| Sandrow et al. [119] | 1972 | 2- | – | – | – | – |
| Brånemark et al. [120] | 1967 | 1a | – | – | – | – |
3.2. Fever
At any one time, during the temperature regulation process, the human body establishes a temperature value as its so-called “set point” [121]. Fever happens if the hypothalamus detects pyrogens and then raises the set point. IR thermography systems are very well suited for non-contact blind mass fever scanning, because image capturing is fast, non-invasive, and it is able to reliably detect people with fever. Therefore, this technique was used to detect inflammatory abnormalities and it has the potential to become a tool for mass scanning of fever [122]. Fig. 3 shows three thermogram images captured during a fever scanning exercise. The square box in the thermograms indicates the ROI. Users need to carry out pre-screening system verification to verify and fine tune the settings by comparing the screening result with a calibrated clinical thermometer. Since the thermal imager measures the skin temperature and not the body core temperature, the threshold setting needs to take into consideration the physiological site offset and the performance characteristics of the thermal imager in order to obtain a reliable screening operation. Studies show that there is a correlation between the human skin surface temperature and the body core temperature. However, the extent of correlation depends on the changes in skin temperature. Skin temperature may be altered at different environmental and physiological conditions. Skin temperature may not have direct relationship to the infectious stages of the diseases. Table 2 details the work published on CAD systems for infection detection and fever scanning.
Fig. 3.
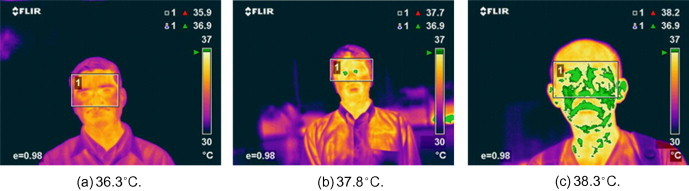
Examples of temperature profiles using fever thermal imager with temperature reading (Reproduced with permission of SPRING Singapore. Copyright remains with SS 582: Part 2: 2013 – ‘Specification for thermal imagers for human temperature scanning’). The picture captions report the mean body temperature, measured by an aural thermometer.
Table 2.
Infection results.
| Authors | Year | MP | PE | A (%) | Se (%) | Sp (%) |
|---|---|---|---|---|---|---|
| Sun et al. [81] | 2013 | 5a | 3 | – | 92.3 | 92.3 |
| Singler et al. [123] | 2013 | 2a | 2 | – | – | – |
| Chan et al. [124] | 2013 | 2a | 2 | – | 74 | 79 |
| Romano et al. [125] | 2013 | 2b | 2 | 90 | 89 | 91 |
| Priest et al. [126] | 2011 | 2a | 2 | – | 86 | 71 |
| Nishiura and Kamiya [127] | 2011 | 2a | 2 | – | 72.4 | 81.7 |
| Matsui et al. [128] | 2009 | 5a | 1 | – | – | – |
| Hausfater et al. [129] | 2008 | 2a | 2 | 90 | 82 | 90 |
| Chiang et al. [130] | 2008 | 2a | 2 | – | 40 | 77 |
| Ng [131] | 2007 | 2a | 3 | 100 | 94.3 | |
| Kee and Ng [132] | 2007 | 2a | 3 | 96 | 95 | 85.6 |
| Ng et al. [133] | 2005 | 2a | 3 | 98 | – | – |
| Chiu et al. [134] | 2005 | 2a | 2 | – | 75 | 99.6 |
| Ng et al. [135] | 2005 | 2a | 2 | – | 89.4 | 75.4 |
| Ng [136] | 2005 | 2a | 2 | – | 90.7 | 75.8 |
| Ng et al. [137] | 2004 | 2a | 2 | – | 85.4 | 95 |
| Ng et al. [138] | 2004 | 2a | 2 | – | 85 | 95 |
| Chan et al. [139] | 2004 | 2a | 2 | – | 67 | 96 |
| Ng and Chong [82] | 2006 | 2a | 3 | 97.5 | – | – |
| Liu et al. [140] | 2004 | 2a | 2 | 24 | 17.3 | 98.2 |
| Clark and Stothers [141] | 1980 | 1a | 1 | – | – | – |
3.3. Cancer
The surface temperature around the area of cancerous cells is slightly higher than normal tissues and this area is seen as hot spots on thermograms [33]. This temperature increase is caused by the high metabolic activity of cancer cells [142]. IR imaging has frequently been used in clinics to detect changes in skin surface temperature associated with some superficial tumors [143]. We found 32 studies on thermography based breast cancer detection. These studies are discussed in the next section. Section 3.3.2 details thermography based skin cancer CAD systems.
3.3.1. Breast cancer
On a global scale, breast cancer accounts for 22.9% of all cancers (excluding non-melanoma skin cancers) in women [144]. In 2008, breast cancer caused 458,503 deaths worldwide (13.7% of cancer deaths in women) [145]. These statistics highlight the importance of breast cancer research. The research community has responded with a substantial body of work on this specific disease and IRT is at the forefront of this effort.
A breast harboring a cancer can produce an increase in IR emission causing a disparity in the thermographic skin pattern of the two breasts [146]. Therefore, in normal breast thermograms, symmetric heat patterns are observed in both breasts, but in the case of an unilateral abnormality, asymmetry is observed. Thermography is especially well suited for picking up tumors in their early stages or tumors in dense tissue and in these scenarios it outperforms other modalities, such as mammography [142]. Fig. 4 shows normal (Fig. 4a) and malignant (Fig. 4b) thermography images of the female breast. The malignant part is clearly visible in Fig. 4b. Studies have shown a high correlation between obviously abnormal thermograms and increased breast cancer risk as well as a poorer prognosis for the breast cancer patient [14], [16]. A constant irregular thermogram carries a 22 times higher risk than its regular counterpart and it is 10 times more indicative than a first-order family history of the illness as a future risk signal for breast cancer. Studies have indicated that an irregular IR image is probably the single most crucial risk marker for the presence, or future growth, of breast cancer [147]. Table 3 details the work published on CAD systems for breast cancer detection.
Fig. 4.
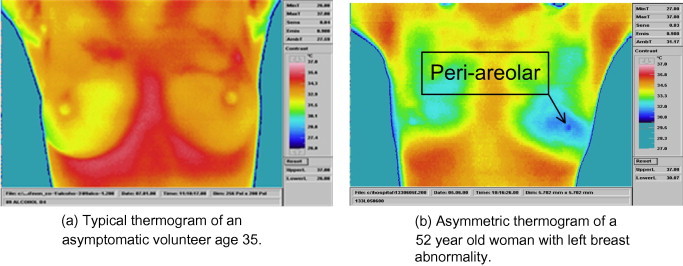
Typical breast themograms. (The figure is reproduced from International Journal of Thermal Sciences 48 (2009) 849–859 from Elsevier Masson SAS. All rights reserved.)
Table 3.
Breast cancer diagnosis results.
| Authors | Year | MP | PE | A (%) | Se (%) | Sp (%) |
|---|---|---|---|---|---|---|
| Kolarić et al. [148] | 2013 | 2b | 2 | 92 | 100 | 79 |
| Francis and Sasikala [33] | 2013 | 3b | 3 | – | 88.1 | 85.71 |
| EtehadTavakol et al. [55] | 2013 | 3b | 3 | 95 | – | – |
| EtehadTavakol et al. [48] | 2013 | 3b | 3 | 86 | – | – |
| Zore et al. [149] | 2013 | 2b | 1 | – | – | – |
| Nicandro et al. [72] | 2013 | 4b | 3 | 71.88 | 82 | 37 |
| Sella et al. [67] | 2013 | 3b | 3 | – | 90.9 | 72.5 |
| Francis and Sasikala [150] | 2013 | 3b | 3 | 85.19 | 88.89 | 77.78 |
| Acharya et al. [151] | 2012 | 3b | 3 | 90 | 76 | 84 |
| Boquete et al. [152] | 2012 | 3b | 4 | – | 100 | 94.7 |
| Zore et al. [153] | 2012 | b | 1 | – | – | – |
| Acharya et al. [87] | 2012 | 3b | 3 | 88.10 | 85.71 | 90.48 |
| Mookiah et al. [51] | 2012 | 3b | 3 | 93.3 | 86.70 | 100 |
| Kontos et al. [154] | 2011 | 3b | 2 | – | 25 | 85 |
| Grubisic et al. [155] | 2011 | 4b | – | – | – | – |
| Wishart et al. [156] | 2010 | 3b | 3 | – | 78 | 75 |
| Wiecek et al. [157] | 2010 | 3b | 3 | 86.60 | – | – |
| Schaefer et al. [142] | 2009 | 3b | 3 | 80 | 93.10 | 99.15 |
| Arora et al. [158] | 2008 | 3b | 3 | – | 97 | 44 |
| Tan et al. [89] | 2007 | 3b | 4 | 94.74 | 100 | 60 |
| Qi et al. [159] | 2007 | 3b | 1 | – | – | – |
| Ng and Kee [160] | 2007 | 3b | 3 | 80.95 | 81.2 | 88.2 |
| Yang et al. [161] | 2007 | 2a | 1 | – | – | – |
| Jakubowska et al. [162] | 2003 | 4b | 1 | – | – | – |
| Ng et al. [163] | 2002 | 3b | 3 | 61.54 | 68.97 | 40 |
| Frize et al. [164] | 2002 | 2b | 1 | – | – | – |
| Kuruganti and Qi [165] | 2002 | 3b | 1 | – | – | – |
| Ng et al. [166] | 2001 | 3b | 2 | 59 | 54 | 67 |
| Ng et al. [167] | 2001 | 3b | – | – | – | – |
| Keyserlingk et al. [168] | 1998 | 2a | 1 | – | – | – |
| Thompson et al. [169] | 1978 | 2b | 1 | – | – | – |
| Folberth and Heim [170] | 1984 | 2a | 1 | – | – | – |
3.3.2. Skin cancer
Flores-Sahagun et al. showed that there are significant differences in skin thermal mapping between patients suffering from basal cell carcinoma and seborrhoeic keratosis [171]. These differences come from the fact that benign skin lesions have a lower mean temperature than the surrounding healthy skin and cancerous skin mutations have a higher mean temperature [172]. IRT can be used to capture the heat patterns of the skin and the resulting images can be used for diagnosis. The sensitivity of the CAD system depends on the lesion diameter [173]. Table 4 details the work published on CAD systems for skin cancer detection.
Table 4.
Skin cancer diagnosis results.
| Authors | Year | MP | PE | A (%) | Se (%) | Sp (%) |
|---|---|---|---|---|---|---|
| Cholewka et al. [172] | 2013 | 2a | 1 | – | – | – |
| Garcia-Romero et al. [174] | 2013 | 2a | 1 | – | – | – |
| Shada et al. [173] | 2013 | 2a | 2 | – | 95 | 100 |
| Cholewka et al. [175] | 2012 | 2a | 1 | – | – | – |
| Flores-Sahagun et al. [171] | 2011 | 1a | 1 | – | – | – |
| Aweda et al. [176] | 2010 | 2a | 1 | – | – | – |
| Buzug et al. [177] | 2006 | 3a | 1 | – | – | – |
| Button et al. [59] | 2004 | 2a | 1 | – | – | – |
3.4. Eye
Eye thermography measures temperature changes in the vascular tissues. These temperature changes can be linked to eye diseases, such as dry eye and dry eye after eye lid reconstruction [178]. Therefore, this technique is beginning to play an important role in the field of ophthalmology [179]. Fig. 5 shows an example of thermography based dry eye detection. Table 5 details the work published on CAD systems for eye disease detection.
Fig. 5.
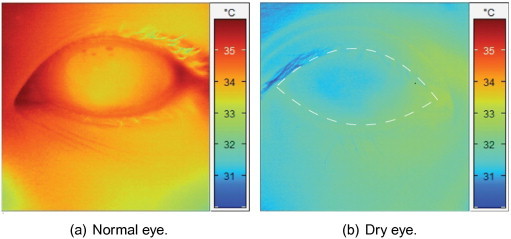
IR images of the human eye.
Table 5.
Eye disease diagnosis results.
| Authors | Year | MP | PE | A (%) | Se (%) | Sp (%) |
|---|---|---|---|---|---|---|
| Klamann et al. [180] | 2013 | 2a | 1 | – | – | – |
| Arita et al. [181] | 2013 | 2a | 1 | – | – | – |
| Purslow [182] | 2013 | 1a | 1 | – | – | – |
| Klamann et al. [183] | 2013 | 2a | 1 | – | – | – |
| Petznick et al. [184] | 2013 | 2a | 1 | – | – | – |
| Gonnermann et al. [178] | 2012 | 2a | 1 | – | – | – |
| Kottaiyan et al. [185] | 2012 | 2a | 1 | – | – | – |
| Tan et al. [186] | 2011 | 4a | 1 | – | – | – |
| Kamao et al. [187] | 2011 | 2a | 2 | – | 83 | 80 |
| Tan et al. [188] | 2010 | 4a | 1 | – | – | – |
| Tan et al. [189] | 2010 | 3a | 1 | – | – | – |
| Tan et al. [190] | 2010 | 2a | 1 | – | – | – |
| Acharya et al. [191] | 2009 | 4a | 1 | – | – | – |
| Chiang et al. [192] | 2006 | 2a | 2 | – | 79.3 | 75 |
| Purslow et al. [193] | 2005 | 2a | 2 | – | – | – |
| Cherkas et al. [194] | 2003 | 2a | 1 | – | – | – |
| Morgan et al. [195] | 1999 | 1a | – | – | – | – |
| Mori et al. [196] | 1997 | 1a | 1 | – | – | – |
| Morgan et al. [197] | 1996 | 2a | 1 | – | – | – |
| Morgan et al. [198] | 1995 | 2a | 1 | – | – | – |
3.5. Pain and inflammation
One symptom of pain is excessive body heat, which can be measured with thermography. Such measurements are important, because in some cases it is difficult to locate the physical source of pain. For example, the Complex Regional Pain Syndrome (CRPS) develops after a minor trauma of the distal limbs. A gold standard in diagnosing CRPS has not been found yet, diagnostics are based on the patient’s medical history and correlating clinical signs [199]. IRT can help medical practitioners to detect areas of cutaneous thermal changes of neural origin and it can lead to a high degree of interexaminer agreement for assessing skin temperature differences in patients with CRPS [200], [201]. Kang et al. show that IRT can be used in the diagnosis and assessment of therapeutic results for erythromelalgia [202]. Table 6 details the work published on CAD systems for pain detection.
Table 6.
Pain and inflammation diagnosis results.
| Authors | Year | MP | PE | A (%) | Se (%) | Sp (%) |
|---|---|---|---|---|---|---|
| Jeong et al. [203] | 2013 | 2b | – | – | – | – |
| Dibai Filho et al. [204] | 2013 | 1b | 1 | – | – | – |
| Kang et al. [202] | 2013 | 2b | – | – | – | – |
| Rodrigues-Bigaton et al. [88] | 2013 | 1a | 2 | – | 62.2 | 75.6 |
| Dibai Filho et al. [205] | 2013 | 1a | 2 | 60 | 55.8 | 55.8 |
| Zaproudina et al. [206] | 2013 | 2a | 1 | – | – | – |
| Roy et al. [207] | 2013 | 2a | 1 | – | – | – |
| Choi et al. [201] | 2013 | 2b | 1 | – | – | – |
| Zaproudina et al. [208] | 2013 | 2a | 1 | – | – | – |
| Frize and Ogungbemile [209] | 2012 | 3b | 3 | – | 96 | 92 |
| Hildebrandt et al. [210] | 2012 | 2b | – | – | – | – |
| Laino [211] | 2012 | 2b | – | – | – | – |
| Wu et al. [212] | 2009 | 2b | 1 | – | – | – |
| Chang et al. [213] | 2008 | 1b | 1 | – | – | – |
| Niehof et al. [214] | 2007 | 2a | 2 | – | 74.3 | 83.9 |
| Park et al. [215] | 2007 | 2b | 1 | – | – | – |
| Herry and Frize [216] | 2004 | 2a | 2 | – | 78 | 83 |
| Canavan and Gratt [217] | 1995 | 2b | 2 | 89 | 85 | 92 |
| Tchou et al. [218] | 1992 | 2a | 1 | – | – | – |
| Ben-Eliyahu [219] | 1991 | 2a | 2 | – | 97 | 90 |
| Herrick and Herrick [220] | 1987 | 2b | 2 | – | 97 | 100 |
4. Discussion
In this paper we reviewed thermography based CAD systems. We found that over the years tremendous progress was made in terms of accuracy, sensitivity and specificity of these systems. This progress was fueled by better sensors [156], [207], diagnostic procedure [169], [221], [222], [223], more computing power and a deeper understanding of the processing algorithms [224], [225], [226], [227]. Standardization and quality assurance efforts, such as the human skin temperature atlas database, have deepened and solidified this progress [228], [229], [230], [231], [232]. However, in terms of applicability of thermography based CAD systems, there is still a mixed picture. On the one hand there are the novel applications, such as dry eye and pain indication, where thermography is the only viable imaging modality, on the other hand there are applications where thermography stands in direct competition with active imaging modalities, such as ultrasound and X-ray. When the CAD systems, for the novel applications, reach majority they will be a great help for physicians to diagnose diseases, such as pain, for which it was historically difficult to reach a conclusive diagnosis [233]. The picture is different for applications of thermography where there is direct competition from active imaging modalities. The main advantage of active imaging modalities comes from the fact that an active system knows what signal was send out and what signal was received. So, these systems can analyze the changes the human body did to these signals. Thermography does not have the benefit of knowing the signal source, because it is the body itself which radiates the signals. Unfortunately, the ways in which the body generates heat are only rudimentarily understood.
In each of the five investigated areas, thermography has a different standing when compared with other diagnostic tools. During our review, we recognized that the most advanced analysis methods were used in areas where thermography has a strong competition. There is a strong correlation between competition and system quality in the area of breast cancer screening, where thermography is recognized only as an adjunct tool to mammography [234], [235]. Mammography is accepted as the most reliable and cost-effective imaging modality, however its contribution continues to be challenged with persistent false-negative rates ranging up to 30% [236]. In light of the continued controversy surrounding established breast imaging modalities, such as mammography [237], [238], a number of new and emerging technologies are being developed for breast cancer screening and diagnosis [239]. Even back in 1973, it was established that the combination of thermography and mammography achieves better results, for diagnosing asymptomatic breast cancer, then each method individually [240]. However, the interpretation of thermograms is heavily dependent on the analysts, which may be inconsistent and error-prone [89]. Therefore, breast cancer screening with IR imaging has still a weaker position [241]. But as a consequence of this struggle, IR based breast cancer screening is the area where most of the progress was made. The progress in this field is documented by the fact that in this review 20 studies, out of 32, report a measure of diagnostic quality, i.e. either A, Se or Sp. The increase in diagnostic quality is fueled by two facts: (a) IR cameras are getting better and cheaper, (b) Computing machinery is getting ever more powerful and there are better algorithms [242], [243]. At least the later point is also true for mammography, but for this imaging modality the margins of improvement are rather slim. Therefore, we predict that over the coming years the progress of thermography will outpace the progress of mammography for breast cancer diagnosis. Furthermore, the image of thermography for breast cancer screening might be better in the general public than in the research community, because a survey shows that online advertising for thermography is effective and woman consider the uptake of alternative breast imaging services over mammography [244].
Thermography is an important tool to measure diabetes induced changes in the human body physiognomy. 16 out of the 27 studies on thermography based CAD systems for diabetes assessed temperature differences in symmetrical parts of the human body, in most cases the foot. For these different measurements, there is no need for to establish the symmetrical heat pattern for a large group of normal subjects, i.e. there is no need to establish or indeed rely on a pre-established heat pattern atlas. For contralateral asymmetry based studies normal subjects are used to establish the control group. Diagnostic progress is made by applying image processing and feature extraction algorithms which extract information from the differences in skin temperature pattern between the two feet. However, our review shows that these feature extraction algorithms and the subsequent machine classification is not applied consistently. To be specific, the PE column of Table 1 shows that no classification algorithms were used for performance evaluation.
Thermography is the imaging modality of choice for fever scanning, because this method of data acquisition has several distinct advantages, such as imaging speed, non-contact measurement and passiveness [245]. The most significant problem associated with the use of thermal imagers comes from the fact that there is no objective way to determine the body temperature of an individual [246]. The correlation of IRT temperatures with the core temperature is significant but weak [247]. The measurements do not depend on skin color, they depend on skin surface properties such as wrinkled or shiny skin, dry or sweaty skin, emissivity, reflectivity and transmissivity [248]. On the positive side, this imaging modality saves time (temperature is displayed within a few seconds) and it reduces close contacts with infected individuals [249]. However, the effectiveness in a practical setting is hard to asses. For example, during the Severe Acute Respiratory Syndrome (SARS) epidemic of 2003, thermal scanning of over 35 million international travelers entering Canada, China, Hong Kong SAR, and Singapore did not pick up a single SARS case [250]. One reason for this mediocre performance might be the simple thresholding methods which were used during the fever scanning. More advanced feature extraction algorithms and the combination of multi-sensor data, similar to the system proposed by Sun et al. [81], might improve the performance of these CAD systems.
Thermography is a novel method to measure the anterior segment temperature of a human eye. It is generally agreed that the applications of ocular surface temperature measurement can include dry eye, contact lenswear, corneal sensitivity, refractive surgery, and other ocular surface disorders. All studies, discussed in Section 3.4, were based on the comparison of IR eye images from healthy normal and diseased individuals. Most of these studies were based on a small sample size, especially the number of IR images from diseased patients was low. This lack of images is a big problem, because non-symmetric IR measurements demand a large sample size to be statistically significant.
It is very difficult to objectify pain. The difference of skin temperature in symmetrical body parts gives an objective indication that something is wrong. Therefore, thermography may be used in pain diagnosis. However, there was only limited research on CAD systems for point and inflammation diagnosis. Table 6 shows that the study on rheumatoid arthritis activity, by Frize and Ogungbemile, was the only work that used automated decision making with a classification algorithm [209]. Both sensitivity and specificity results, reported in this study, were very good. Therefore, more work is needed to support and to compete with this study, especially work with a strong methodology where the results are obtained by automated classification algorithms.
All the reviewed material focused on algorithms and systems building, thereby harvesting the advantages of modern computing machinery for medical diagnosis. However, such work can only establish maximum performance figures which are rarely achieved with deployed CAD systems [251]. In terms of systems design, theoretical and applied research can only provide evidence that a specific method, or a specific way of building a system, can serve in a practical problem solution which helps medical practitioners and patients [252], [253]. Once implemented, these practical CAD systems can only meet the promises, established through the theoretical research work, when they function according to specification [254]. Therefore, it is so important to design and develop these systems with a formal and model driven approach [255], [256].
In the review we focused on selected disease categories, thereby we neglected excellent work in related areas, such as surgery follow up [257] and dentistry [258], [259]. The work that was included in this study was reviewed with a special focus on feature extraction algorithms, statistical feature performance, classification and overall performance. This strict selection did not include important parameters, such as sample size and level of randomization. Hence, care should be taken when dealing with the reported performance values. In general, a larger sample size and more variety will lead to better or more conclusive results. Therefore, more work is needed in this area to improve the quality of thermography based CAD systems which, in the long run, re-establishes trust in this useful imaging modality.
5. Conclusion
Computer aided interpretation of thermogram images is of eminent importance, because the link between disease and body heat pattern is subtle and in many cases non-linear. Data mining and knowledge discovery algorithms help to improve thermogram based diagnosis in three key areas. The first of these areas is the imminent visual overload of screening professionals. Computer support reduces the diagnostic workload and the experts can focus on the hard cases and thereby increase the level of care. The second area is inter-observer variability. Relying entirely on the human brain, thermogram based diagnosis tends to be subjective and the quality varies widely. Objective methods, from the area of computer science and mathematics, can help to objectify the diagnosis and thereby reduce the inter-observer variability. The last area is concerned with the diagnosis quality. Human based diagnosis is largely based on both experience as well as mental state of the screening practitioner and to a lesser extent from equipment and diagnostic method. Hence, progress depends on the level of training and the experience in the field. For algorithm supported diagnosis progress is made in terms of hardware and software. Computing machinery will get more and more potent; this is independent of any individual application area. Progress in the software domain will come from integrating and to a lesser extent from inventing signal processing algorithms as well as managing an ever growing knowledge base. Therefore, we predict that one day CAD systems will outperform human practitioners in terms of accuracy, speed and cost.
This review describes some of the algorithms used in state of the art thermography based CAD systems. These algorithms come from the domains of pre-processing, feature extraction, statistical feature analysis, classification, and result assessment. Both statistical feature analysis and result assessment steps are very important, because the resulting performance figures foster competition between research groups and thereby drive thermography as a medical imaging modality forward. The idea of competition is most evident in areas where thermography based diagnosis is not the standard imaging modality, such as breast cancer diagnosis. The majority of researchers in this area published performance results in terms or sensitivity and specificity. The resulting competition has driven thermography based breast cancer systems to include the most advanced signal processing algorithms. Another area which uses performance measures extensively are CAD systems for influenza screening. The very act of publishing these measures builds up trust and thermography is widely seen as the most promising imaging modality for this application.
We adopt the position that CAD systems objectify thermography based diagnosis. The benefits of this objective approach are threefold. The reduction of inter-observer variability is an initial and very tangible benefit. The progress, which can be achieved with computer based systems, outpaces the progress of human observation. Finally, the performance of objective systems can be measured, which creates competition and this competition instills trust and fosters progress. This is especially important for thermography based diagnosis, because much trust was destroyed in the 1980s due to human error; lack of judgment and foremost the desire to cut corners for personal benefit. Since then, tremendous progress was made by applying scientific methods and sticking to scientific principles.
CAD systems are the future. We are living in exciting times where computers move from being a peripheral tool for administration and data storage towards the center of medical diagnosis and patient care. State of the art CAD systems mimic human diagnosis. This role model based development is important, because it guarantees a fast rate of progress during the initial phase of technology development. In layman’s terms: the apprentice mimics the master. However, there are distinct limitations of how much information even the most skilled human can process. These restrictions do not, or at least to a much lesser extent, apply to computing machinery. From this perspective, the direction for thermography diagnosis is clear: more data. This data can come from higher resolution IR scanning, but the main contribution will be existing datasets and case studies. For a human it is impossible to make sense of all available thermography images; however machines can process these images and extract relevant information. Staying with the idea of more or big data, there is no need to limit CAD systems to one data source alone. Computer based systems can make sense of data from various sources, such as thermography, X-ray, ultrasound, etc. At the end, the work is not about thermography or indeed any other imaging modality, it is about alleviating human suffering in patients and loved ones. This leaves no space for an unreasonable focus on just one imaging modality.
Conflicts of interest
We wish to confirm that there are no known conflicts of interest associated with this publication and there has been no significant financial support for this work that could have influenced its outcome.
In this case, the symmetrical body parts were the feet.
A practitioner seldom relies on a single observation.
References
- 1.Hameed Z., Hong Y.S., Cho Y.M., Ahn S.H., Song C.K. Condition monitoring and fault detection of wind turbines and related algorithms: a review. Renew. Sustain. Energy Rev. 2009;13(1):1–39. [Google Scholar]
- 2.Wang M., Vandermaar A., Srivastava K.D. Review of condition assessment of power transformers in service. IEEE Electr. Insulat. Mag. 2002;18(6):12–25. [Google Scholar]
- 3.Ring E.F.J. The historical development of temperature measurement in medicine. Infrared Phys. Technol. 2007;49(3):297–301. [Google Scholar]
- 4.Diakides N.A., Bronzino J.D. Taylor & Francis; 2007. Medical Infrared Imaging. [Google Scholar]
- 5.Hardy J.D. The radiation of heat from the human body: I. J. Clin. Invest. 1934;13(4):593–604. doi: 10.1172/JCI100607. [DOI] [PMC free article] [PubMed] [Google Scholar]
- 6.Ring E.F.J., Jung A., Zuber J. New opportunities for infrared thermography in medicine. Acta Bio-Optika Inform. Med. 2009;15:28–30. [Google Scholar]
- 7.Barnes R.B. Thermography of the human body infrared-radiant energy provides new concepts and instrumentation for medical diagnosis. Science. 1963;140(3569):870–877. doi: 10.1126/science.140.3569.870. [DOI] [PubMed] [Google Scholar]
- 8.Herman C. Emerging technologies for the detection of melanoma: achieving better outcomes. Clin. Cosmet. Invest. Dermatol. 2012;5:195–212. doi: 10.2147/CCID.S27902. [DOI] [PMC free article] [PubMed] [Google Scholar]
- 9.Lahiri B.B., Bagavathiappan S., Jayakumar T., Philip J. Medical applications of infrared thermography: a review. Infrared Phys. Technol. 2012;55(4):221–235. doi: 10.1016/j.infrared.2012.03.007. [DOI] [PMC free article] [PubMed] [Google Scholar]
- 10.Yang W.-J., Yang P.P. Literature survey on biomedical applications of thermography. Bio-Med. Mater. Eng. 1992;2(1):7–18. [PubMed] [Google Scholar]
- 11.Keyserlingk J.R., Ahlgren P.D., Yu E., Belliveau N., Yassa M. Functional infrared imaging of the breast. IEEE Eng. Med. Biol. Mag. 2000;19(3):30–41. doi: 10.1109/51.844378. [DOI] [PubMed] [Google Scholar]
- 12.Feig S.A., Shaber G.S., Schwartz G.F., Patchefsky A., Libshitz H.I., Edeiken J., Nerlinger R., Curley R.F., Wallace J.D. Thermography, mammography, and clinical examination in breast cancer screening review of 16,000 studies. Radiology. 1977;122(1):123–127. doi: 10.1148/122.1.123. [DOI] [PubMed] [Google Scholar]
- 13.Baker L.H. Breast cancer detection demonstration project: five-year summary report. CA: A Cancer J. Clin. 1982;32(4):194–225. doi: 10.3322/canjclin.32.4.194. [DOI] [PubMed] [Google Scholar]
- 14.Head J.F., Wang F., Elliott R.L. Breast thermography is a noninvasive prognostic procedure that predicts tumor growth rate in breast cancer patients. Ann. New York Acad. Sci. 1993;698(1):153–158. doi: 10.1111/j.1749-6632.1993.tb17203.x. [DOI] [PubMed] [Google Scholar]
- 15.Fauci M.A., Breiter R., Cabanski W., Fick W., Koch R., Ziegler J., Gunapala S.D. Medical infrared imaging–differentiating facts from fiction, and the impact of high precision quantum well infrared photodetector camera systems, and other factors, in its reemergence. Infrared Phys. Technol. 2001;42(3):337–344. [Google Scholar]
- 16.Gautherie M., Gros C.M. Breast thermography and cancer risk prediction. Cancer. 1980;45(1):51–56. doi: 10.1002/1097-0142(19800101)45:1<51::aid-cncr2820450110>3.0.co;2-l. [DOI] [PubMed] [Google Scholar]
- 17.Gamagami P. Atlas of Mammography: New Early Signs in Breast Cancer. Blackwell Science; Boston: 1996. [Google Scholar]
- 18.W. Amalu, Thermography guidelines, standards and protocols in clinical thermographic imaging, 2002. <http://www.iact-org.org/professionals/thermog-guidelines.html> (accessed 01.06.14).
- 19.Mannara G., Salvatori G.C., Pizzuti G.P. Ethyl alcohol induced skin temperature changes evaluated by thermography. preliminary results. Bollettino Soc. Italiana Biol. Speriment. 1993;69(10):587–594. [PubMed] [Google Scholar]
- 20.Gershon-Cohen J., Habennan J.D. Thermography of smoking. Archiv. Environ. Health: An Int. J. 1968;16(5):637–641. doi: 10.1080/00039896.1968.10665120. [DOI] [PubMed] [Google Scholar]
- 21.Standards technical reference (str 2004) for thermal imagers for human temperature screening. Part 2: Users’ implementation guidelines, tR15-2, Spring Singapore, 2004, ISBN: 9971-67-977-9.
- 22.Ammer K., Ring E. Biomedical Engineering Handbook. CRC Press; 2006. Standard procedures for infrared imaging in medicine; p. 1. [Google Scholar]
- 23.Lindberg D. Is thermography or mammography a more effective breast cancer screening tool? ONS Connect. 2012;27(8):24. [PubMed] [Google Scholar]
- 24.U.S. Food and Drug Administration, FDA: Breast thermography not a substitute for mammography, 2011. <http://www.fda.gov/NewsEvents/Newsroom/PressAnnouncements/ucm257633.htm> (accessed 11.11.13).
- 25.Suissa S., Ernst P. Optical illusions from visual data analysis: example of the new zealand asthma mortality epidemic. J. Clin. Epidemiol. 1997;50(10):1079–1088. doi: 10.1016/s0895-4356(97)00158-3. [DOI] [PubMed] [Google Scholar]
- 26.Sone M., Mizunuma K., Nakajima Y., Yasunaga H., Ohtomo K. Job satisfaction, income, workload, workplace, and demographics of Japanese radiologists in the 2008 survey. Jpn. J. Radiol. 2013;31(5):364–370. doi: 10.1007/s11604-013-0189-5. [DOI] [PubMed] [Google Scholar]
- 27.Ng E.Y.K., Chen Y. Segmentation of breast thermogram: improved boundary detection with modified snake algorithm. J. Mech. Med. Biol. 2006;6(02):123–136. [Google Scholar]
- 28.Ng E.Y.K., Sudharsan N.M. Computer simulation in conjunction with medical thermography as an adjunct tool for early detection of breast cancer. BMC Cancer. 2004;4(1):17. doi: 10.1186/1471-2407-4-17. [DOI] [PMC free article] [PubMed] [Google Scholar]
- 29.Ng E.Y.K. A review of thermography as promising non-invasive detection modality for breast tumor. Int. J. Therm. Sci. 2009;48(5):849–859. [Google Scholar]
- 30.EtehadTavakol M., Lucas C., Sadri S., Ng E.Y.K. Analysis of breast thermography using fractal dimension to establish possible difference between malignant and benign patterns. J. Healthcare Eng. 2010;1(1):27–44. [Google Scholar]
- 31.Blu T., Thévenaz P., Unser M. Linear interpolation revitalized. IEEE Trans. Image Process. 2004;13(5):710–719. doi: 10.1109/tip.2004.826093. [DOI] [PubMed] [Google Scholar]
- 32.Gonzalez R.C., Woods R.E., Eddins S.L. vol. 2. Gatesmark Publishing Knoxville; 2009. (Digital Image Processing Using MATLAB). [Google Scholar]
- 33.Francis S.V., Sasikala M. Automatic detection of abnormal breast thermograms using asymmetry analysis of texture features. J. Med. Eng. Technol. 2013;37(1):17–21. doi: 10.3109/03091902.2012.728674. [DOI] [PubMed] [Google Scholar]
- 34.Haralick R.M., Shanmugam K., Dinstein I.H. Textural features for image classification. IEEE Trans. Syst. Man Cybernet. 1973;3(6):610–621. [Google Scholar]
- 35.Galloway M.M. Texture analysis using gray level run lengths. Comput. Graph. Image Process. 1975;4(2):172–179. [Google Scholar]
- 36.Fortin C.S., Kumaresan R., Ohley W.J., Hoefer S. Fractal dimension in the analysis of medical images. IEEE Eng. Med. Biol. Mag. 1992;11(2):65–71. [Google Scholar]
- 37.Chaudhuri B.B., Sarkar N. Texture segmentation using fractal dimension. IEEE Trans. Pattern Anal. Machine Intell. 1995;17(1):72–77. [Google Scholar]
- 38.Biswas M.K., Ghose T., Guha S., Biswas P.K. Fractal dimension estimation for texture images: a parallel approach. Pattern Recogn. Lett. 1998;19(3):309–313. [Google Scholar]
- 39.Ojala T., Pietikainen M., Maenpaa T. Multiresolution gray-scale and rotation invariant texture classification with local binary patterns. IEEE Trans. Pattern Anal. Machine Intell. 2002;24(7):971–987. [Google Scholar]
- 40.EtehadTavakol M., Ng E.Y.K., Lucas C., Sadri S., Ataei M. Nonlinear analysis using lyapunov exponents in breast thermograms to identify abnormal lesions. Infrared Phys. Technol. 2012;55(4):345–352. [Google Scholar]
- 41.Liao S., Law M.W.K., Chung A.C.S. Dominant local binary patterns for texture classification. IEEE Trans. Image Process. 2009;18(5):1107–1118. doi: 10.1109/TIP.2009.2015682. [DOI] [PubMed] [Google Scholar]
- 42.Zhang B., Gao Y., Zhao S., Liu J. Local derivative pattern versus local binary pattern: face recognition with high-order local pattern descriptor. IEEE Trans. Image Process. 2010;19(2):533–544. doi: 10.1109/TIP.2009.2035882. [DOI] [PubMed] [Google Scholar]
- 43.Faust O., Bairy M.G. Nonlinear analysis of physiological signals: a review. J. Mech. Med. Biol. 2012;12(04):21. [Google Scholar]
- 44.A.P.S. Pharwaha, B. Singh, Shannon and non-shannon measures of entropy for statistical texture feature extraction in digitized mammograms, in: Proceedings of the World Congress on Engineering and Computer Science, vol. 2, 2009, pp. 20–22.
- 45.Acharya U.R., Krishnan Mookiah M.R., Vinitha Sree S., Yanti R., Martis Roshan, Saba L., Molinari F., Guerriero S., Suri J.S. Ovarian Neoplasm Imaging. Springer; USA: 2013. Evolutionary algorithm-based classifier parameter tuning for automatic ovarian cancer tissue characterization and classification; pp. 425–440. [DOI] [PubMed] [Google Scholar]
- 46.Muthu Rama Krishnan M., Rajendra Acharya U., Martis R.J., Chua C.K., Min L.C., Ng E.Y.K., Laude A. Evolutionary algorithm based classifier parameter tuning for automatic diabetic retinopathy grading: a hybrid feature extraction approach. Knowl.-Based Syst. 2012;39:9–22. [Google Scholar]
- 47.Hu M.-K. Visual pattern recognition by moment invariants. IRE Trans. Inform. Theory. 1962;8(2):179–187. [Google Scholar]
- 48.Etehadtavakol M., Ng E.Y.K., Chandran V., Rabbani H. Separable and non-separable discrete wavelet transform based texture features and image classification of breast thermograms. Infrared Phys. Technol. 2013;61:274–286. [Google Scholar]
- 49.Daubechies I. vol. 61. SIAM; 1992. (Ten Lectures on Wavelets). [Google Scholar]
- 50.Acharya U.R., Faust O., Sree S.V., Molinari F., Suri J.S. Thyroscreen system: high resolution ultrasound thyroid image characterization into benign and malignant classes using novel combination of texture and discrete wavelet transform. Comput. Methods Progr. Biomed. 2012;107(2):233–241. doi: 10.1016/j.cmpb.2011.10.001. [DOI] [PubMed] [Google Scholar]
- 51.Mookiah M.R.K., Acharya U.R., Ng E.Y.K. Data mining technique for breast cancer detection in thermograms using hybrid feature extraction strategy. Quant. Infrared Thermogr. J. 2012;9(2):151–165. [Google Scholar]
- 52.Nikias C.L., Raghuveer M.R. Bispectrum estimation: a digital signal processing framework. Proc. IEEE. 1987;75(7):869–891. [Google Scholar]
- 53.Nikias C.L., Mendel J.M. Signal processing with higher-order spectra. IEEE Signal Process. Mag. 1993;10(3):10–37. [Google Scholar]
- 54.Acharya U.R., Faust O., Sree S.V., Alvin A.P.C., Krishnamurthi G., Seabra J.C.R., Sanches J., Suri J.S. 2011 Annual International Conference of the IEEE Engineering in Medicine and Biology Society, EMBC. IEEE; 2011. Atheromatictm: symptomatic vs. asymptomatic classification of carotid ultrasound plaque using a combination of hos, dwt & texture; pp. 4489–4492. [DOI] [PubMed] [Google Scholar]
- 55.EtehadTavakol M., Chandran V., Ng E.Y.K., Kafieh R. Breast cancer detection from thermal images using bispectral invariant features. Int. J. Therm. Sci. 2013;69:21–36. [Google Scholar]
- 56.Chua K.C., Chandran V., Rajendra Acharya U., Lim C.M. Analysis of epileptic eeg signals using higher order spectra. J. Med. Eng. Technol. 2009;33(1):42–50. doi: 10.1080/03091900701559408. [DOI] [PubMed] [Google Scholar]
- 57.Acharya U.R., Chua E.C.-P., Chua K.C., Min L.C., Tamura T. Analysis and automatic identification of sleep stages using higher order spectra. Int. J. Neural Syst. 2010;20(06):509–521. doi: 10.1142/S0129065710002589. [DOI] [PubMed] [Google Scholar]
- 58.Chua K.C., Chandran V., Acharya U.R., Lim C.M. Application of higher order statistics/spectra in biomedical signals – a review. Med. Eng. Phys. 2010;32(7):679–689. doi: 10.1016/j.medengphy.2010.04.009. [DOI] [PubMed] [Google Scholar]
- 59.Button T.M., Li H., Fisher P., Rosenblatt R., Dulaimy K., Li S., O’Hea B., Salvitti M., Geronimo V., Geronimo C. Dynamic infrared imaging for the detection of malignancy. Phys. Med. Biol. 2004;49(14):3105. doi: 10.1088/0031-9155/49/14/005. [DOI] [PubMed] [Google Scholar]
- 60.Rajendra Acharya U., Vinitha Sree S., Muthu Rama Krishnan M., Molinari F., Garberoglio R., Suri J.S. Non-invasive automated 3d thyroid lesion classification in ultrasound: a class of thyroscan systems. Ultrasonics. 2012;52(4):508–520. doi: 10.1016/j.ultras.2011.11.003. [DOI] [PubMed] [Google Scholar]
- 61.Nagase T., Sanada H., Takehara K., Oe M., Iizaka S., Ohashi Y., Oba M., Kadowaki T., Nakagami G. Variations of plantar thermographic patterns in normal controls and non-ulcer diabetic patients: novel classification using angiosome concept. J. Plastic Reconstruct. Aesthetic Surg. 2011;64(7):860–866. doi: 10.1016/j.bjps.2010.12.003. [DOI] [PubMed] [Google Scholar]
- 62.Benbow S.J., Chan A.W., Bowsher D.R., Williams G., Macfarlane I.A. The prediction of diabetic neuropathic plantar foot ulceration by liquid-crystal contact thermography. Diabetes Care. 1994;17(8):835–839. doi: 10.2337/diacare.17.8.835. [DOI] [PubMed] [Google Scholar]
- 63.Balbinot L.F., Canani L.H., Robinson C.C., Achaval M., Zaro M.A. Plantar thermography is useful in the early diagnosis of diabetic neuropathy. Clinics (Sao Paulo) 2012;67(12):1419–1425. doi: 10.6061/clinics/2012(12)12. [DOI] [PMC free article] [PubMed] [Google Scholar]
- 64.Mahony M.O. vol. 16. CRC Press; 1986. (Sensory Evaluation of Food: Statistical Methods and Procedures). [Google Scholar]
- 65.Fisher R.A. The correlation between relatives on the supposition of mendelian inheritance. Philos. Trans. Roy. Soc. Edinburgh. 1918;52:399–433. [Google Scholar]
- 66.Acharya U.R., Faust O., Sree S.V., Molinari F., Saba L., Nicolaides A., Suri J.S. An accurate and generalized approach to plaque characterization in 346 carotid ultrasound scans. IEEE Trans. Instrument. Measure. 2012;61(4):1045–1053. [Google Scholar]
- 67.Sella T., Sklair-Levy M., Cohen M., Rozin M., Shapiro-Feinberg M., Allweis T.M., Libson E., Izhaky D. A novel functional infrared imaging system coupled with multiparametric computerised analysis for risk assessment of breast cancer. Eur. Radiol. 2013;23(5):1191–1198. doi: 10.1007/s00330-012-2724-7. [DOI] [PubMed] [Google Scholar]
- 68.Burges C.J.C. A tutorial on support vector machines for pattern recognition. Data Min. Knowl. Discov. 1998;2(2):121–167. [Google Scholar]
- 69.Cristianini N., Shawe-Taylor J. Cambridge University Press; 2000. An Introduction to Support Vector Machines and other Kernel-based Learning Methods. [Google Scholar]
- 70.Muller K.R., Mika S., Ratsch G., Tsuda K., Scholkopf B. An introduction to kernel-based learning algorithms. IEEE Trans. Neural Netw. 2001;12(2):181–201. doi: 10.1109/72.914517. [DOI] [PubMed] [Google Scholar]
- 71.Larose D.T. Wiley.com; 2005. Discovering Knowledge in Data: An Introduction to Data Mining. [Google Scholar]
- 72.Nicandro C.R., Efren M.M., Maria Yaneli A.A., Enrique M.D., Hector Gabriel A.M., Nancy P.C., Alejandro G.H., Guillermo de Jesus H.R., Rocio Erandi B.M. Evaluation of the diagnostic power of thermography in breast cancer using bayesian network classifiers. Comput. Math. Methods Med. 2013;2013:264246. doi: 10.1155/2013/264246. [DOI] [PMC free article] [PubMed] [Google Scholar]
- 73.Ross T.J. John Wiley & Sons; 2009. Fuzzy Logic with Engineering Applications. [Google Scholar]
- 74.Martin Larsen P. Industrial applications of fuzzy logic control. Int. J. Man-Machine Stud. 1980;12(1):3–10. [Google Scholar]
- 75.Altman N.S. An introduction to kernel and nearest-neighbor nonparametric regression. Am. Stat. 1992;46(3):175–185. [Google Scholar]
- 76.Keller J.M., Gray M.R., Givens J.A. A fuzzy k-nearest neighbor algorithm. IEEE Trans. Syst. Man Cybernet. 1985;(4):580–585. [Google Scholar]
- 77.Haykin S. vol. 3. Prentice Hall; New York: 2009. (Neural Networks and Learning Machines). [Google Scholar]
- 78.Han J., Kamber M., Pei J. Morgan Kaufman; 2006. Data Mining: Concepts and Techniques. [Google Scholar]
- 79.Kohonen T. Self-organized formation of topologically correct feature maps. Biol. Cybernet. 1982;43(1):59–69. [Google Scholar]
- 80.Kohonen T., Oja E., Simula O., Visa A., Kangas J. Engineering applications of the self-organizing map. Proc. IEEE. 1996;84(10):1358–1384. [Google Scholar]
- 81.G. Sun, N. Abe, Y. Sugiyama, Q.V. Nguyen, K. Nozaki, Y. Nakayama, O. Takei, Y. Hakozaki, S. Abe, T. Matsui, Development of an infection screening system for entry inspection at airport quarantine stations using ear temperature, heart and respiration rates, in: Conf. Proc. IEEE Eng. Med. Biol. Soc. 2013, 2013, pp. 6716–6719. [DOI] [PubMed]
- 82.Ng E.Y.K., Chong C. Ann-based mapping of febrile subjects in mass thermogram screening: facts and myths. J. Med. Eng. Technol. 2006;30(5):330–337. doi: 10.1080/03091900500225136. [DOI] [PubMed] [Google Scholar]
- 83.Patel J.L., Goyal R.K. Applications of artificial neural networks in medical science. Current Clin. Pharmacol. 2007;2(3):217–226. doi: 10.2174/157488407781668811. [DOI] [PubMed] [Google Scholar]
- 84.Chauvin Y., Rumelhart D.E., editors. Backpropagation: Theory, Architectures, and Applications. L. Erlbaum Associates Inc.; Hillsdale, NJ, USA: 1995. [Google Scholar]
- 85.R. Kohavi, et al., A study of cross-validation and bootstrap for accuracy estimation and model selection, in: IJCAI, no. 2 in 14, 1995, pp. 1137–1145.
- 86.Mosteller F. A k-sample slippage test for an extreme population. Ann. Math. Stat. 1948;19(1):58–65. [Google Scholar]
- 87.Acharya U.R., Ng E.Y.K., Tan J.-H., Sree S.V. Thermography based breast cancer detection using texture features and support vector machine. J. Med. Syst. 2012;36(3):1503–1510. doi: 10.1007/s10916-010-9611-z. [DOI] [PubMed] [Google Scholar]
- 88.Rodrigues-Bigaton D., Dibai Filho A.V., Costa A.C., Packer A.C., de Castro E.M. Accuracy and reliability of infrared thermography in the diagnosis of arthralgia in women with temporomandibular disorder. J. Manipul. Physiol. Ther. 2013;36(4):253–258. doi: 10.1016/j.jmpt.2013.04.006. [DOI] [PubMed] [Google Scholar]
- 89.Tan T.Z., Quek C., Ng G.S., Ng E.Y.K. A novel cognitive interpretation of breast cancer thermography with complementary learning fuzzy neural memory structure. Expert Syst. Appl. 2007;33(3):652–666. doi: 10.1016/j.eswa.2006.06.012. [DOI] [PMC free article] [PubMed] [Google Scholar]
- 90.Cook N.R. Use and misuse of the receiver operating characteristic curve in risk prediction. Circulation. 2007;115(7):928–935. doi: 10.1161/CIRCULATIONAHA.106.672402. [DOI] [PubMed] [Google Scholar]
- 91.Niu H.-H., Lui P.-W., Hu J.S., Ting C.-K., Yin Y.-C., Lo Y.-L., Liu L., Lee T.-Y. Thermal symmetry of skin temperature: normative data of normal subjects in taiwan. Chinese Med. J. – TAIPEI. 2001;64(8):459–468. [PubMed] [Google Scholar]
- 92.Mabuchi K., Chinzei T., Fujimasa I., Haeno S., Motomura K., Abe Y., Yonezama T. Evaluating asymmetrical thermal distributions through image processing. IEEE, Eng. Med. Biol. Mag. 1998;17(2):47–55. doi: 10.1109/memb.1998.687963. [DOI] [PubMed] [Google Scholar]
- 93.Uematsu S. Symmetry of skin temperature comparing one side of the body to the other. Thermology. 1985;1(1):4–7. [Google Scholar]
- 94.Sivanandam S., Anburajan M., Venkatraman B., Menaka M., Sharath D. Estimation of blood glucose by non-invasive infrared thermography for diagnosis of type 2 diabetes: an alternative for blood sample extraction. Mol. Cell. Endocrinol. 2013;367(1–2):57–63. doi: 10.1016/j.mce.2012.12.017. [DOI] [PubMed] [Google Scholar]
- 95.Ring F. Foot technology, part 1 of 2: thermal imaging today and its relevance to diabetes. J. Diabetes Sci. Technol. 2010;4(4):857–862. doi: 10.1177/193229681000400414. [DOI] [PMC free article] [PubMed] [Google Scholar]
- 96.Roback K. An overview of temperature monitoring devices for early detection of diabetic foot disorders. Expert Rev. Med. Dev. 2010;7(5):711–718. doi: 10.1586/erd.10.35. [DOI] [PubMed] [Google Scholar]
- 97.Jeffcoate W.J., Harding K.G. Diabetic foot ulcers. Lancet. 2003;361(9368):1545–1551. doi: 10.1016/S0140-6736(03)13169-8. [DOI] [PubMed] [Google Scholar]
- 98.Peregrina-Barreto H., Morales-Hernandez L.A., Rangel-Magdaleno J.J., Vazquez-Rodriguez P.D. 2013 IEEE International Instrumentation and Measurement Technology Conference (I2MTC) IEEE; 2013. Thermal image processing for quantitative determination of temperature variations in plantar angiosomes; pp. 816–820. [Google Scholar]
- 99.T. Tamaki, Screening for osteomyelitis using thermography in patients with diabetic foot, Ulcers, 2013.
- 100.Balbinot L.F., Robinson C.C., Achaval M., Zaro M.A., Brioschi M.L. Repeatability of infrared plantar thermography in diabetes patients: a pilot study. J. Diabetes Sci. Technol. 2013;7(5):1130–1137. doi: 10.1177/193229681300700505. [DOI] [PMC free article] [PubMed] [Google Scholar]
- 101.Mori T., Nagase T., Takehara K., Oe M., Ohashi Y., Amemiya A., Noguchi H., Ueki K., Kadowaki T., Sanada H. Morphological pattern classification system for plantar thermography of patients with diabetes. J. Diabetes Sci. Technol. 2013;7(5):1102–1112. doi: 10.1177/193229681300700502. [DOI] [PMC free article] [PubMed] [Google Scholar]
- 102.Najafi B., Wrobel J.S., Grewal G., Menzies R.A., Talal T.K., Zirie M., Armstrong D.G. Plantar temperature response to walking in diabetes with and without acute charcot: the charcot activity response test. J. Aging Res. 2012;2012:1–5. doi: 10.1155/2012/140968. [DOI] [PMC free article] [PubMed] [Google Scholar]
- 103.E.S. Barriga, V. Chekh, C. Carranza, M.R. Burge, A. Edwards, E. McGrew, G. Zamora, P. Soliz, Computational basis for risk stratification of peripheral neuropathy from thermal imaging, in: Conf. Proc. IEEE Eng. Med. Biol. Soc. 2012, 2012, pp. 1486–1489. [DOI] [PubMed]
- 104.Bagavathiappan S., Philip J., Jayakumar T., Raj B., Rao P.N.S., Varalakshmi M., Mohan V. Correlation between plantar foot temperature and diabetic neuropathy: a case study by using an infrared thermal imaging technique. J. Diabetes Sci. Technol. 2010;4(6):1386. doi: 10.1177/193229681000400613. [DOI] [PMC free article] [PubMed] [Google Scholar]
- 105.N. Kaabouch, Y. Chen, J. Anderson, F. Ames, R. Paulson, Asymmetry analysis based on genetic algorithms for the prediction of foot ulcers, in: IS&T/SPIE Electronic Imaging, International Society for Optics and Photonics, 2009, pp. 724304–724304.
- 106.Lavery L.A., Higgins K.R., Lanctot D.R., Constantinides G.P., Zamorano R.G., Athanasiou K.A., Armstrong D.G., Agrawal C.M. Preventing diabetic foot ulcer recurrence in high-risk patients use of temperature monitoring as a self-assessment tool. Diabetes Care. 2007;30(1):14–20. doi: 10.2337/dc06-1600. [DOI] [PubMed] [Google Scholar]
- 107.Sun P.-C., Lin H.-D., Jao S.-H.E., Ku Y.-C., Chan R.-C., Cheng C.-K. Relationship of skin temperature to sympathetic dysfunction in diabetic at-risk feet. Diabetes Res. Clin. Pract. 2006;73(1):41–46. doi: 10.1016/j.diabres.2005.12.012. [DOI] [PubMed] [Google Scholar]
- 108.Armstrong D.G., Lipsky B.A., Polis A.B., Abramson M.A. Does dermal thermometry predict clinical outcome in diabetic foot infection? Analysis of data from the sidestep* trial. Int. Wound J. 2006;3(4):302–307. doi: 10.1111/j.1742-481X.2006.00269.x. [DOI] [PMC free article] [PubMed] [Google Scholar]
- 109.Bharara M., Cobb J.E., Claremont D.J. Thermography and thermometry in the assessment of diabetic neuropathic foot: a case for furthering the role of thermal techniques. Int. J. Lower Extremity Wounds. 2006;5(4):250–260. doi: 10.1177/1534734606293481. [DOI] [PubMed] [Google Scholar]
- 110.Marcinkowska-Gapińska A., Kowal P. Blood fluidity and thermography in patients with diabetes mellitus and coronary artery disease in comparison to healthy subjects. Clin. Hemorheol. Microcirc. 2006;35(4):473–479. [PubMed] [Google Scholar]
- 111.Sun P.-C., Jao S.-H.E., Cheng C.-K. Assessing foot temperature using infrared thermography. Foot Ankle Int. 2005;26(10):847–853. doi: 10.1177/107110070502601010. [DOI] [PubMed] [Google Scholar]
- 112.Armstrong D.G., Lavery L.A., Wunderlich R.P., Boulton A.J. Skin temperatures as a one-time screening tool do not predict future diabetic foot complications. J. Am. Podiatric Med. Assoc. 2003;93(6):443–447. doi: 10.7547/87507315-93-6-443. [DOI] [PubMed] [Google Scholar]
- 113.Jiang G., Shang Z., Zhang M. Engineering in Medicine and Biology, 2002, 24th Annual Conference and the Annual Fall Meeting of the Biomedical Engineering Society EMBS/BMES Conference, 2002. vol. 3. IEEE; 2002. Metabolism parameter analysis of diabetics based on the thermography; pp. 2226–2227. (Proceedings of the Second Joint). [Google Scholar]
- 114.Fujiwara Y., Inukai T., Aso Y., Takemura Y. Thermographic measurement of skin temperature recovery time of extremities in patients with type 2 diabetes mellitus. Exp. Clin. Endocrinol. Diabetes. 2000;108(7):463–469. doi: 10.1055/s-2000-8142. [DOI] [PubMed] [Google Scholar]
- 115.Y. Hosaki, S. Takata, F. Mitsunobu, T. Mifune, K. Ashida, H. Tsugeno, M. Okamoto, S. Harada, Y. Tanizaki, Evaluation of body surface temperature by thermography 3, correlation between the peripheral circulation estimated by laser-doppler blood flowmetry and thermography, Annual Reports of Misasa Medical Branch, Okayama University Medical School 70, 1999, pp. 36–42.
- 116.Armstrong D.G., Lavery L.A., Liswood P.J., Todd W.F., Tredwell J.A. Infrared dermal thermometry for the high-risk diabetic foot. Phys. Therapy. 1997;77(2):169–175. doi: 10.1093/ptj/77.2.169. [DOI] [PubMed] [Google Scholar]
- 117.Stess R.M., Sisney P.C., Moss K.M., Graf P.M., Louie K.S., Gooding G.A., Grunfeld C. Use of liquid crystal thermography in the evaluation of the diabetic foot. Diabetes Care. 1986;9(3):267–272. doi: 10.2337/diacare.9.3.267. [DOI] [PubMed] [Google Scholar]
- 118.Fushimi H., Inoue T., Nishikawa M., Matsuyama Y., Kitagawa J. A new index of autonomic neuropathy in diabetes mellitus: heat stimulated thermographic patterns. Diabetes Res. Clin. Pract. 1985;1(2):103–107. doi: 10.1016/s0168-8227(85)80035-8. [DOI] [PubMed] [Google Scholar]
- 119.Sandrow R.E., Torg J.S., Lapayowker M.S., Resnick E.J. The use of thermography in the early diagnosis of neuropathic arthropathy in the feet of diabetics. Clin. Orthopaed. Relat. Res. 1972;88:31–33. doi: 10.1097/00003086-197210000-00004. [DOI] [PubMed] [Google Scholar]
- 120.Brånemark P.-I., Fagerberg S.-E., Langer L., Säve-Söderbergh J. Infrared thermography in diabetes mellitus a preliminary study. Diabetologia. 1967;3(6):529–532. doi: 10.1007/BF01213572. [DOI] [PubMed] [Google Scholar]
- 121.Selent M.U., Molinari N.M., Baxter A., Nguyen A.V., Siegelson H., Brown C.M., Plummer A., Higgins A., Podolsky S., Spandorfer P., Cohen N.J., Fishbein D.B. Mass screening for fever in children: a comparison of 3 infrared thermal detection systems. Pediatr. Emerg. Care. 2013;29(3):305–313. doi: 10.1097/PEC.0b013e3182854465. [DOI] [PubMed] [Google Scholar]
- 122.Ng E.Y.K., Acharya R. Remote-sensing infrared thermography. IEEE, Eng. Med. Biol. Mag. 2009;28(1):76–83. doi: 10.1109/MEMB.2008.931018. [DOI] [PubMed] [Google Scholar]
- 123.Singler K., Bertsch T., Heppner H.J., Kob R., Hammer K., Biber R., Sieber C.C., Christ M. Diagnostic accuracy of three different methods of temperature measurement in acutely ill geriatric patients. Age Aging. 2013;42(6):740–746. doi: 10.1093/ageing/aft121. [DOI] [PubMed] [Google Scholar]
- 124.Chan L.S., Lo J.L., Kumana C.R., Cheung B.M. Utility of infrared thermography for screening febrile subjects. Hong Kong Med. J. 2013;19(2):109–115. [PubMed] [Google Scholar]
- 125.Romano C.L., D’Anchise R., Calamita M., Manzi G., Romano D., Sansone V. Value of digital telethermography for the diagnosis of septic knee prosthesis: a prospective cohort study. BMC Musculoskelet. Disord. 2013;14:7. doi: 10.1186/1471-2474-14-7. [DOI] [PMC free article] [PubMed] [Google Scholar]
- 126.Priest P.C., Duncan A.R., Jennings L.C., Baker M.G. Thermal image scanning for influenza border screening: results of an airport screening study. PloS One. 2011;6(1):e14490. doi: 10.1371/journal.pone.0014490. [DOI] [PMC free article] [PubMed] [Google Scholar]
- 127.Nishiura H., Kamiya K. Fever screening during the influenza (h1n1-2009) pandemic at Narita International Airport, Japan. BMC Infect. Diseas. 2011;11(1):1–11. doi: 10.1186/1471-2334-11-111. [DOI] [PMC free article] [PubMed] [Google Scholar]
- 128.Matsui T., Suzuki S., Ujikawa K., Usui T., Gotoh S., Sugamata M., Badarch Z., Abe S. Development of a non-contact screening system for rapid medical inspection at a quarantine depot using a laser doppler blood-flow meter, microwave radar and infrared thermography. J. Med. Eng. Technol. 2009;33(5):403–409. doi: 10.1080/03091900902821151. [DOI] [PubMed] [Google Scholar]
- 129.Hausfater P., Zhao Y., Defrenne S., Bonnet P., Riou B. Cutaneous infrared thermometry for detecting febrile patients. Emerg. Infect. Diseas. 2008;14(8):1255. doi: 10.3201/eid1408.080059. [DOI] [PMC free article] [PubMed] [Google Scholar]
- 130.Chiang M.-F., Lin P.-W., Lin L.-F., Chiou H.-Y., Chien C.-W., Chu S.-F., Chiu W.-T. Mass screening of suspected febrile patients with remote-sensing infrared thermography: alarm temperature and optimal distance. J. Formosan Med. Assoc. 2008;107(12):937–944. doi: 10.1016/S0929-6646(09)60017-6. [DOI] [PMC free article] [PubMed] [Google Scholar]
- 131.Ng E.Y.K. Thermal imager as fever identification tool for infectious diseases outbreak. In: Diakides N.A., Bronzino J.D., editors. Medical Infrared Imaging: Principles and Practices. CRC Press; 2007. pp. 23-1–23-19. [Google Scholar]
- 132.Kee E.C., Ng E.Y.K. Fever mass screening tool for infectious diseases outbreak: integrated artificial intelligence with bio-statistical approach in thermogram analysis. In: Diakides N.A., Bronzino J.D., editors. Medical Infrared Imaging: Principles and Practices. CRC Press; 2007. pp. 16-1–16-19. [Google Scholar]
- 133.Ng E.Y.K., Chong C., Kaw G.J.L. Classification of human facial and aural temperature using neural networks and ir fever scanner: a responsible second look. J. Mech. Med. Biol. 2005;5(01):165–190. [Google Scholar]
- 134.Chiu W.T., Lin P.W., Chiou H.Y., Lee W.S., Lee C.N., Yang Y.Y., Lee H.M., Hsieh M.S., Hu C.J., Ho Y.S. Infrared thermography to mass-screen suspected sars patients with fever. Asia-Pacific J. Public Health. 2005;17(1):26–28. doi: 10.1177/101053950501700107. [DOI] [PubMed] [Google Scholar]
- 135.Ng D.K., Chan C.-H., Lee R.S., Leung L.C. Non-contact infrared thermometry temperature measurement for screening fever in children. Ann. Tropical Paediatr.: Int. Child Health. 2005;25(4):267–275. doi: 10.1179/146532805X72412. [DOI] [PubMed] [Google Scholar]
- 136.Ng E.Y.-K. Is thermal scanner losing its bite in mass screening of fever due to sars? Med. Phys. 2005;32:93. doi: 10.1118/1.1819532. [DOI] [PMC free article] [PubMed] [Google Scholar]
- 137.E.Y.K. Ng, G.J.L. Kaw, K. Ng, Infrared thermographic in identification of human elevated temperature with biostatistical and ROC analysis, in: Defense and Security, International Society for Optics and Photonics, 2004, pp. 88–97.
- 138.Ng E.Y.K., Kaw G.J.L., Chang W.M. Analysis of ir thermal imager for mass blind fever screening. Microvasc. Res. 2004;68(2):104–109. doi: 10.1016/j.mvr.2004.05.003. [DOI] [PubMed] [Google Scholar]
- 139.Chan L.-S., Cheung G.T.Y., Lauder I.J., Kumana C.R. Screening for fever by remote-sensing infrared thermographic camera. J. Travel. Med. 2004;11(5):273–279. doi: 10.2310/7060.2004.19102. [DOI] [PubMed] [Google Scholar]
- 140.Liu C.-C., Chang R.-E., Chang W.-C. Limitations of forehead infrared body temperature detection for fever screening for severe acute respiratory syndrome. Infect. Control Hospital Epidemiol. 2004;25(12):1109–1111. doi: 10.1086/502351. [DOI] [PubMed] [Google Scholar]
- 141.Clark R.P., Stothers J.K. Neonatal skin temperature distribution using infra-red colour thermography. J. Physiol. 1980;302(1):323–333. doi: 10.1113/jphysiol.1980.sp013245. [DOI] [PMC free article] [PubMed] [Google Scholar]
- 142.Schaefer G., Závišek M., Nakashima T. Thermography based breast cancer analysis using statistical features and fuzzy classification. Pattern Recogn. 2009;42(6):1133–1137. [Google Scholar]
- 143.Chato J.C. Measurement of thermal properties of growing tumors. Ann. New York Acad. Sci. 1980;335(1):67–85. doi: 10.1111/j.1749-6632.1980.tb50737.x. [DOI] [PubMed] [Google Scholar]
- 144.Boyle P., Levin B. IARC Press; 2008. World Cancer Report 2008. (International Agency for Research on Cancer). [Google Scholar]
- 145.Sree S.V., Ng E.Y.K., Acharya U.R., Tan W. Breast imaging systems: a review and comparative study. J. Mech. Med. Biol. 2010;10(01):5–34. [Google Scholar]
- 146.Isard H.J., Becker W., Shilo R., Ostrum B.J. Breast thermography after four years and 10,000 studies. Am. J. Roentgenol. 1972;115(4):811–821. doi: 10.2214/ajr.115.4.811. [DOI] [PubMed] [Google Scholar]
- 147.ETEHADTAVAKOL M., NG E.Y.K. Breast thermography as a potential non-contact method in the early detection of cancer: a review. J. Mech. Med. Biol. 2013;13(02) pp. 1330001-1–1330001-20. [Google Scholar]
- 148.Kolarić D., Herceg Z., Nola I.A., Ramljak V., Kulis T., Holjevac J.K., Deutsch J.A., Antonini S. Thermography – a feasible method for screening breast cancer? Coll. Antropol. 2013;37(2):583–588. [PubMed] [Google Scholar]
- 149.Zore Z., Boras I., Stanec M., Oresić T., Zore I.F. Influence of hormonal status on thermography findings in breast cancer. Acta Clin. Croat. 2013;52(1):35–42. [PubMed] [Google Scholar]
- 150.Francis S.V., Sasikala M. Automatic detection of abnormal breast thermograms using asymmetry analysis of texture features. J. Med. Eng. Technol. 2013;37(1):17–21. doi: 10.3109/03091902.2012.728674. [DOI] [PubMed] [Google Scholar]
- 151.Acharya U.R., Ng E.Y.K., Sree S.V., Chua C.K., Chattopadhyay S. Higher order spectra analysis of breast thermograms for the automated identification of breast cancer. Expert Syst. 2012;0(0):1–11. [Google Scholar]
- 152.Boquete L., Ortega S., Miguel-Jiménez J.M., Rodríguez-Ascariz J.M., Blanco R. Automated detection of breast cancer in thermal infrared images, based on independent component analysis. J. Med. Syst. 2012;36(1):103–111. doi: 10.1007/s10916-010-9450-y. [DOI] [PubMed] [Google Scholar]
- 153.Zore Z., Boras I., Filipovic-Zore I., Stanec M., Lesar M., Vrdoljak D.V. The impact of human epidermal growth factor receptor-2 status of invasive breast tumors on thermography findings. Saudi Med. J. 2012;33(10):1118–1121. [PubMed] [Google Scholar]
- 154.Kontos M., Wilson R., Fentiman I. Digital infrared thermal imaging (diti) of breast lesions: sensitivity and specificity of detection of primary breast cancers. Clin. Radiol. 2011;66(6):536–539. doi: 10.1016/j.crad.2011.01.009. [DOI] [PubMed] [Google Scholar]
- 155.Grubisic I., Gjenero L., Lipic T., Sovic I., Skala T. MIPRO, 2011 Proceedings of the 34th International Convention. IEEE; 2011. Active 3d scanning based 3d thermography system and medical applications; pp. 269–273. [Google Scholar]
- 156.Wishart G.C., Campisi M., Boswell M., Chapman D., Shackleton V., Iddles S., Hallett A., Britton P.D. The accuracy of digital infrared imaging for breast cancer detection in women undergoing breast biopsy. Eur. J. Surgical Oncol. (EJSO) 2010;36(6):535–540. doi: 10.1016/j.ejso.2010.04.003. [DOI] [PubMed] [Google Scholar]
- 157.Wiecek B., Wiecek M., Strakowski R., Jakubowska T., Ng E.Y.K. Wavelet-based thermal image classification for breast screening and other medical applications. In: Ng E.Y.K., Acharya R.U., Suri J.S., editors. Performance Evaluation Techniques in Multimodality Breast Cancer Screening, Diagnosis and Treatment. American Scientific Publishers; 2010. [Google Scholar]
- 158.Arora N., Martins D., Ruggerio D., Tousimis E., Swistel A.J., Osborne M.P., Simmons R.M. Effectiveness of a noninvasive digital infrared thermal imaging system in the detection of breast cancer. Am. J. Surgery. 2008;196(4):523–526. doi: 10.1016/j.amjsurg.2008.06.015. [DOI] [PubMed] [Google Scholar]
- 159.Qi H., Kuruganti P.T., Snyder W.E. Detecting breast cancer from thermal infrared images by asymmetry analysis. Med. Dev. Syst. 1995;38:13-1–13-14. [Google Scholar]
- 160.Ng E.Y.K., Kee E.C. Integrative computer-aided diagnostic with breast thermogram. J. Mech. Med. Biol. 2007;7(01):1–10. [Google Scholar]
- 161.Yang H.-q., Xie S.-s., Lin Q.-Y., Ye Z., Chen S.-Q., Li H. IEEE/ICME International Conference on Complex Medical Engineering, 2007 (CME 2007) IEEE; 2007. A new infrared thermal imaging and its preliminary investigation of breast disease assessment; pp. 1071–1074. [Google Scholar]
- 162.Jakubowska T., Wiecek B., Wysocki M., Drews-Peszynski C. Engineering in Medicine and Biology Society, 2003. vol. 2. IEEE; 2003. Thermal signatures for breast cancer screening comparative study; pp. 1117–1120. (Proceedings of the 25th Annual International Conference of the IEEE). [DOI] [PubMed] [Google Scholar]
- 163.Ng E.Y.K., Fok S.C., Peh Y.C., Ng F.C., Sim L.S.J. Computerized detection of breast cancer with artificial intelligence and thermograms. J. Med. Eng. Technol. 2002;26(4):152–157. doi: 10.1080/03091900210146941. [DOI] [PubMed] [Google Scholar]
- 164.Frize M., Herry C., Roberge R. Engineering in Medicine and Biology, 2002, 24th Annual Conference and the Annual Fall Meeting of the Biomedical Engineering Society EMBS/BMES Conference, 2002. vol. 2. IEEE; 2002. Processing of thermal images to detect breast cancer: comparison with previous work; pp. 1159–1160. (Proceedings of the Second Joint). [Google Scholar]
- 165.Kuruganti P.T., Qi H. Engineering in Medicine and Biology, 2002, 24th Annual Conference and the Annual Fall Meeting of the Biomedical Engineering Society EMBS/BMES Conference, 2002. vol. 2. IEEE; 2002. Asymmetry analysis in breast cancer detection using thermal infrared images; pp. 1155–1156. (Proceedings of the Second Joint). [Google Scholar]
- 166.Ng E.Y.K., Ung L.N., Ng F.C., Sim L.S.J. Statistical analysis of healthy and malignant breast thermography. J. Med. Eng. Technol. 2001;25(6):253–263. doi: 10.1080/03091900110086642. [DOI] [PubMed] [Google Scholar]
- 167.Ng E.Y.K., Chen Y., Ung L.N. Computerized breast thermography: study of image segmentation and temperature cyclic variations. J. Med. Eng. Technol. 2001;25(1):12–16. doi: 10.1080/03091900010022247. [DOI] [PubMed] [Google Scholar]
- 168.Keyserlingk J.R., Ahlgren P.D., Yu E., Belliveau N. Infrared imaging of the breast: Initial reappraisal using high-resolution digital technology in 100 successive cases of stage i and ii breast cancer. Breast J. 1998;4(4):245–251. doi: 10.1046/j.1524-4741.1998.440245.x. [DOI] [PubMed] [Google Scholar]
- 169.Thompson J.E., Simpson T.L., Caulfield J.B. Thermographic tumor detection enhancement using microwave heating. IEEE Trans. Microwave Theory Techniq. 1978;26(8):573–580. [Google Scholar]
- 170.Folberth W., Heim G. Spectral emissivity measurements of human skin – a new method for the early detection of cancer? Infrared Phys. 1984;24(2):353–358. [Google Scholar]
- 171.Flores-Sahagun J.H., Vargas J.V.C., Mulinari-Brenner F.A. Analysis and diagnosis of basal cell carcinoma (bcc) via infrared imaging. Infrared Phys. Technol. 2011;54(5):367–378. [Google Scholar]
- 172.Cholewka A., Stanek A., Kwiatek S., Sieroń A., Drzazga Z. Does the temperature gradient correlate with the photodynamic diagnosis parameter numerical colour value (ncv)? Photodiag. Photodyn. Ther. 2013;10(1):33–38. doi: 10.1016/j.pdpdt.2012.07.001. [DOI] [PubMed] [Google Scholar]
- 173.Shada A.L., Dengel L.T., Petroni G.R., Smolkin M.E., Acton S., Slingluff C.L. Infrared thermography of cutaneous melanoma metastases. J. Surg. Res. 2013;182(1):e9–e14. doi: 10.1016/j.jss.2012.09.022. [DOI] [PMC free article] [PubMed] [Google Scholar]
- 174.Garcia-Romero M.T., Chakkittakandiyil A., Pope E. The role of infrared thermography in evaluation of proliferative infantile hemangiomas: results of a pilot study. Int. J. Dermatol. 2013:1–2. doi: 10.1111/ijd.12045. [DOI] [PubMed] [Google Scholar]
- 175.Cholewka A., Stanek A., Sieroń A., Drzazga Z. Thermography study of skin response due to whole-body cryotherapy. Skin Res. Technol. 2012;18(2):180–187. doi: 10.1111/j.1600-0846.2011.00550.x. [DOI] [PubMed] [Google Scholar]
- 176.Aweda M.A., Ketiku K.K., Ajekigbe A.T., Edi A.A. Potential role of thermography in cancer management. Archiv. Appl. Sci. Res. 2010;2(6):300–312. [Google Scholar]
- 177.Buzug T.M., Schumann S., Pfaffmann L., Reinhold U., Ruhlmann J. Engineering in Medicine and Biology Society, 2006 (EMBS’06) IEEE; 2006. Functional infrared imaging for skin-cancer screening; pp. 2766–2769. (28th Annual International Conference of the IEEE). [DOI] [PubMed] [Google Scholar]
- 178.Gonnermann J., Klein J.P., Klamann M.K., Maier A.K., Pleyer U., Joussen A.M., Bertelmann E. Dry eye symptoms in patients after eyelid reconstruction with full-thickness eyelid defects: using the tomey tg-1000 thermographer. Ophthal. Res. 2012;48(4):192–198. doi: 10.1159/000339598. [DOI] [PubMed] [Google Scholar]
- 179.Tan J.-H., Ng E.Y.K., Rajendra Acharya U., Chee C. Infrared thermography on ocular surface temperature: a review. Infrared Phys. Technol. 2009;52(4):97–108. [Google Scholar]
- 180.Klamann M.K., Maier A.K., Gonnermann J., Klein J.P., Ruokonen P., Pleyer U. Thermography: a new option to monitor filtering bleb function? J. Glaucoma. 2013:1–12. doi: 10.1097/IJG.0b013e31825af0ca. [DOI] [PubMed] [Google Scholar]
- 181.Arita R., Shirakawa R., Maeda S., Yamaguchi M., Ohashi Y., Amano S. Decreased surface temperature of tarsal conjunctiva in patients with meibomian gland dysfunction. JAMA Ophthalmol. 2013;131(6):818–819. doi: 10.1001/jamaophthalmol.2013.1895. [DOI] [PubMed] [Google Scholar]
- 182.Purslow C. Evaluation of the ocular tolerance of a novel eyelid-warming device used for meibomian gland dysfunction. Cont. Lens Anterior Eye. 2013;36(5):226–231. doi: 10.1016/j.clae.2013.02.009. [DOI] [PubMed] [Google Scholar]
- 183.Klamann M.K., Maier A.K., Gonnermann J., Klein J.P., Bertelmann E., Pleyer U. Ocular surface temperature gradient is increased in eyes with bacterial corneal ulcers. Ophthal. Res. 2013;49(1):52–56. doi: 10.1159/000343774. [DOI] [PubMed] [Google Scholar]
- 184.Petznick A., Tan J.H., Boo S.K., Lee S.Y., Acharya U.R., Tong L. Repeatability of a new method for measuring tear evaporation rates. Optometry Vis. Sci. 2013;90(4):366–371. doi: 10.1097/OPX.0b013e318288bdd1. [DOI] [PubMed] [Google Scholar]
- 185.Kottaiyan R., Yoon G., Wang Q., Yadav R., Zavislan J.M., Aquavella J.V. Integrated multimodal metrology for objective and noninvasive tear evaluation. Ocular Surf. 2012;10(1):43–50. doi: 10.1016/j.jtos.2011.12.001. [DOI] [PubMed] [Google Scholar]
- 186.Tan J.H., Ng E.Y.K., Acharya U.R. Evaluation of topographical variation in ocular surface temperature by functional infrared thermography. Infrared Phys. Technol. 2011;54(6):469–477. [Google Scholar]
- 187.Kamao T., Yamaguchi M., Kawasaki S., Mizoue S., Shiraishi A., Ohashi Y. Screening for dry eye with newly developed ocular surface thermographer. Am. J. Ophthalmol. 2011;151(5):782–791. doi: 10.1016/j.ajo.2010.10.033. [DOI] [PubMed] [Google Scholar]
- 188.Tan J.-H., Ng E.Y.K., Rajendra Acharya U., Chee C. Study of normal ocular thermogram using textural parameters. Infrared Phys. Technol. 2010;53(2):120–126. [Google Scholar]
- 189.Tan J.-H., Ng E.Y.K., Acharya U R., Chee C. Automated study of ocular thermal images: comprehensive analysis of corneal health with different age group subjects and validation. Digital Signal Process. 2010;20(6):1579–1591. [Google Scholar]
- 190.Tan J.-H., Ng E.Y.K., Acharya U.R. Evaluation of tear evaporation from ocular surface by functional infrared thermography. Med. Phys. 2010;37:6022. doi: 10.1118/1.3495540. [DOI] [PubMed] [Google Scholar]
- 191.Acharya R., Ng E.Y.K., Yee G.C., Hua T.J., Kagathi M. Analysis of normal human eye with different age groups using infrared images. J. Med. Syst. 2009;33(3):207–213. doi: 10.1007/s10916-008-9181-5. [DOI] [PubMed] [Google Scholar]
- 192.H.K. Chiang, C.Y. Chen, H.Y. Cheng, K.-H. Chen, D.O. Chang, Development of infrared thermal imager for dry eye diagnosis, in: Optics & Photonics, International Society for Optics and Photonics, 2006, pp. 629406–629406.
- 193.Purslow C., Wolffsohn J.S., Santodomingo-Rubido J. The effect of contact lens wear on dynamic ocular surface temperature. Contact Lens Anterior Eye. 2005;28(1):29–36. doi: 10.1016/j.clae.2004.10.001. [DOI] [PubMed] [Google Scholar]
- 194.Cherkas L.F., Carter L., Spector T.D., Howell K.J., Black C.M., MacGregor A.J. Use of thermographic criteria to identify Raynaud’s phenomenon in a population setting. J. Rheumatol. 2003;30(4):720–722. [PubMed] [Google Scholar]
- 195.Morgan P.B., Soh M.P., Efron N. Corneal surface temperature decreases with age. Contact Lens Anterior Eye. 1999;22(1):11–13. doi: 10.1016/s1367-0484(99)80025-3. [DOI] [PubMed] [Google Scholar]
- 196.Mori A., Oguchi Y., Okusawa Y., Ono M., Fujishima H., Tsubota K. Use of high-speed, high-resolution thermography to evaluate the tear film layer. Am. J. Ophthalmol. 1997;124(6):729–735. doi: 10.1016/s0002-9394(14)71689-7. [DOI] [PubMed] [Google Scholar]
- 197.Morgan P.B., Tullo A.B., Efron N. Ocular surface cooling in dry eyea pilot study. J. British Contact Lens Assoc. 1996;19(1):7–10. [Google Scholar]
- 198.Morgan P.B., Tullo A.B., Efron N. Infrared thermography of the tear film in dry eye. Eye. 1995;9(5):615–618. doi: 10.1038/eye.1995.149. [DOI] [PubMed] [Google Scholar]
- 199.Peltz E., Seifert F., Maihofner C. Diagnostic guidelines for complex regional pain syndrome. Handchir. Mikrochir. Plast Chir. 2012;44(3):135–141. doi: 10.1055/s-0032-1321775. [DOI] [PubMed] [Google Scholar]
- 200.Verdugo R.J., Ochoa J.L. Use and misuse of conventional electrodiagnosis, quantitative sensory testing, thermography, and nerve blocks in the evaluation of painful neuropathic syndromes. Muscle Nerve. 1993;16(10):1056–1062. doi: 10.1002/mus.880161009. [DOI] [PubMed] [Google Scholar]
- 201.Choi E., Lee P.B., Nahm F.S. Interexaminer reliability of infrared thermography for the diagnosis of complex regional pain syndrome. Skin Res. Technol. 2013;19(2):189–193. doi: 10.1111/srt.12032. [DOI] [PubMed] [Google Scholar]
- 202.Kang B.C., Nam d.a.J., Ahn E.K., Yoon D.M., Cho J.G. Secondary erythromelalgia – a case report. Korean J. Pain. 2013;26(3):299–302. doi: 10.3344/kjp.2013.26.3.299. [DOI] [PMC free article] [PubMed] [Google Scholar]
- 203.Jeong M.Y., Yu J.S., Chung W.B. Usefulness of thermography in diagnosis of complex regional pain syndrome type i after transradial coronary intervention. J. Invasive Cardiol. 2013;25(9):E183–185. [PubMed] [Google Scholar]
- 204.Dibai-Filho A.V., Costa A.C., Packer A.C., Rodrigues-Bigaton D. Correlation between skin surface temperature over masticatory muscles and pain intensity in women with myogenous temporomandibular disorder. J. Back Musculoskelet. Rehabil. 2013;26(3):323–328. doi: 10.3233/BMR-130387. [DOI] [PubMed] [Google Scholar]
- 205.Dibai Filho A.V., Packer A.C., Costa A.C., Rodrigues-Bigaton D. Accuracy of infrared thermography of the masticatory muscles for the diagnosis of myogenous temporomandibular disorder. J. Manipulative Physiol. Ther. 2013;36(4):245–252. doi: 10.1016/j.jmpt.2013.04.007. [DOI] [PubMed] [Google Scholar]
- 206.Zaproudina N., Narhi M., Lipponen J.A., Tarvainen M.P., Karjalainen P.A., Karhu J., Airaksinen O., Giniatullin R. Nitroglycerin-induced changes in facial skin temperature: ‘cold nose’ as a predictor of headache? Clin. Physiol. Funct. Imag. 2013;33(6):409–417. doi: 10.1111/cpf.12042. [DOI] [PubMed] [Google Scholar]
- 207.Roy R.A., Boucher J.P., Comtois A.S. Comparison of paraspinal cutaneous temperature measurements between subjects with and without chronic low back pain. J. Manipulative Physiol. Ther. 2013;36(1):44–50. doi: 10.1016/j.jmpt.2012.12.002. [DOI] [PubMed] [Google Scholar]
- 208.Zaproudina N., Airaksinen O., Narhi M. Are the infrared thermography findings skin temperature-dependent? A study on neck pain patients. Skin Res. Technol. 2013;19(1):e537–544. doi: 10.1111/srt.12007. [DOI] [PubMed] [Google Scholar]
- 209.Frize M., Ogungbemile A. Estimating rheumatoid arthritis activity with infrared image analysis. Stud. Health Technol. Inform. 2012;180:594–598. [PubMed] [Google Scholar]
- 210.Hildebrandt C., Zeilberger K., Ring E.F.J., Raschner C. The application of medical infrared thermography in sports medicine. Ultrasound. 2012;10:2. doi: 10.3390/s100504700. [DOI] [PMC free article] [PubMed] [Google Scholar]
- 211.Laino L., dysesthesia Idiopathic. complex regional pain syndrome and video-thermography: a new tool for diagnosis? Eur. J. Dermatol. 2012;22(5):700–701. doi: 10.1684/ejd.2012.1814. [DOI] [PubMed] [Google Scholar]
- 212.Wu C.-L., Yu K.-L., Chuang H.-Y., Huang M.-H., Chen T.-W., Chen C.-H. The application of infrared thermography in the assessment of patients with coccygodynia before and after manual therapy combined with diathermy. J. Manipulative Physiol. Therapeut. 2009;32(4):287–293. doi: 10.1016/j.jmpt.2009.03.002. [DOI] [PubMed] [Google Scholar]
- 213.Chang T.-C., Hsiao Y.-L., Liao S.-L. Application of digital infrared thermal imaging in determining inflammatory state and follow-up effect of methylprednisolone pulse therapy in patients with graves ophthalmopathy. Graefe’s Arch. Clin. Exp. Ophthalmol. 2008;246(1):45–49. doi: 10.1007/s00417-007-0643-0. [DOI] [PubMed] [Google Scholar]
- 214.Niehof S.P., Huygen F.J.P.M., Stronks D.L., Klein J., Zijlstra F.J. Reliability of observer assessment of thermographic images in complex regional pain syndrome type 1. Acta Orthopaed. Belgica. 2007;73(1):31. [PubMed] [Google Scholar]
- 215.Park J.-Y., Hyun J.K., Seo J.-B. The effectiveness of digital infrared thermographic imaging in patients with shoulder impingement syndrome. J. Shoulder Elbow Surgery. 2007;16(5):548–554. doi: 10.1016/j.jse.2006.11.010. [DOI] [PubMed] [Google Scholar]
- 216.Herry C., Frize M. Quantitative assessment of pain-related thermal dysfunction through clinical digital infrared thermal imaging. BioMed. Eng. OnLine. 2004;3(1):19. doi: 10.1186/1475-925X-3-19. [DOI] [PMC free article] [PubMed] [Google Scholar]
- 217.Canavan D., Gratt B.M. Electronic thermography for the assessment of mild and moderate temporomandibular joint dysfunction. Oral Surg. Oral Med. Oral Pathol. Oral Radiol. Endodontol. 1995;79(6):778–786. doi: 10.1016/s1079-2104(05)80316-6. [DOI] [PubMed] [Google Scholar]
- 218.Tchou S., Costich J.F., Burgess R.C., Wexler C.E. Thermographic observations in unilateral carpal tunnel syndrome: report of 61 cases. J. Hand Surg. 1992;17(4):631–637. doi: 10.1016/0363-5023(92)90306-a. [DOI] [PubMed] [Google Scholar]
- 219.Ben-Eliyahu D. Infrared thermographic imaging in the detection of sympathetic dysfunction in patients with patellofemoral pain syndrome. J. Manipulative Physiol. Therapeut. 1991;15(3):164–170. [PubMed] [Google Scholar]
- 220.Herrick R.T., Herrick S.K. Thermography in the detection of carpal tunnel syndrome and other compressive neuropathies. J. Hand Surg. 1987;12(5):943–949. doi: 10.1016/s0363-5023(87)80262-9. [DOI] [PubMed] [Google Scholar]
- 221.Deng Z.-S., Liu J. 27th Annual International Conference of the Engineering in Medicine and Biology Society, 2005 (IEEE-EMBS 2005) IEEE; 2006. Enhancement of thermal diagnostics on tumors underneath the skin by induced evaporation; pp. 7525–7528. [DOI] [PubMed] [Google Scholar]
- 222.Amalu W.C., Hobbins W.B., Head J.F., Elliot R.L. vol. 19. CRC Press; 2006. (Biomedical Engineering Handbook: Functional Infrared Imaging of the Breast – An Overview). [Google Scholar]
- 223.Sudharsan N.M., Ng E.Y.K. Numerical uncertainty and perfusion induced instability in bioheat equation: its importance in thermographic interpretation. J. Med. Eng. Technol. 2001;25(5):222–229. doi: 10.1080/03091900110067328. [DOI] [PubMed] [Google Scholar]
- 224.H. Szu, I. Kopriva, P. Hoekstra, N. Diakides, J. Buss, J. Lupo, Lagrange constraint neural net de-mixing enabled multispectral breast imaging, in: IEEE EMBS, vol. 59, 2002, pp. 33–42.
- 225.Cetingul M.P., Herman C. 5th IEEE International Symposium on Biomedical Imaging: From Nano to Macro, 2008 (ISBI 2008) IEEE; 2008. Identification of skin lesions from the transient thermal response using infrared imaging technique; pp. 1219–1222. [Google Scholar]
- 226.Padra C., Salva N.N. Locating multiple tumors by moving shape analysis. Math. Biosci. 2013;245(2):103–110. doi: 10.1016/j.mbs.2013.07.002. [DOI] [PubMed] [Google Scholar]
- 227.Ng E.Y.K., Sudharsan N.M. Numerical computation as a tool to aid thermographic interpretation. J. Med. Eng. Technol. 2001;25(2):53–60. doi: 10.1080/03091900110043621. [DOI] [PubMed] [Google Scholar]
- 228.Ring E.F.J., Ammer K., Jung A., Murawski P., Wiecek B., Zuber J., Zwolenik S., Plassmann P., Jones C., Jones B.F. Engineering in Medicine and Biology Society, 2004 (IEMBS’04) vol. 1. IEEE; 2004. Standardization of infrared imaging; pp. 1183–1185. (26th Annual International Conference of the IEEE). [DOI] [PubMed] [Google Scholar]
- 229.Ring E.F., Ammer K., Wiecek B., Plassmann P., Jones C.D., Jung A., Murawski P. Quality assurance for thermal imaging systems in medicine. Thermol. Int. 2007;17(3):103–106. [Google Scholar]
- 230.Ammer K. The glamorgan protocol for recording and evaluation of thermal images of the human body. Thermol. Int. 2008;18(4):125–144. [Google Scholar]
- 231.Ring F.J., Ng E.Y.K. Infrared thermal imaging standards for human fever detection. In: Diakides N.A., Bronzino J.D., editors. Medical Infrared Imaging: Principles and Practices. CRC Press; 2007. pp. 22-1–22-5. [Google Scholar]
- 232.SINGAPORE STANDARDS, Thermal imagers for human temperature screening – Part 2: Implementation guidelines, SS 582-2, 2013.
- 233.Ng E.Y.K., Sudharsan N.M. Can numerical simulation adjunct to thermography be an early detection tool. J. Thermol. Int. 2000;10(3):119–127. [Google Scholar]
- 234.Brkljaci B., Mileti D., Sardanelli F. Thermography is not a feasible method for breast cancer screening. Coll. Antropol. 2013;37(2):589–593. [PubMed] [Google Scholar]
- 235.Mainiero M.B., Lourenco A., Mahoney M.C., Newell M.S., Bailey L., Barke L.D., D’Orsi C., Harvey J.A., Hayes M.K., Huynh P.T., Jokich P.M., Lee S.J., Lehman C.D., Mankoff D.A., Nepute J.A., Patel S.B., Reynolds H.E., Sutherland M.L., Haffty B.G. Acr appropriateness criteria breast cancer screening. J. Am. Coll. Radiol. 2013;10(1):11–14. doi: 10.1016/j.jacr.2012.09.036. [DOI] [PubMed] [Google Scholar]
- 236.Amalu W.C., DC D., DIACT F. International Academy of Clinical Thermology; CA, USA: 2002. (A review of breast thermography). [Google Scholar]
- 237.Kuhl C.K. Current status of breast mr imaging: Part 2. Clinical applications. Radiology. 2007;244(3):672–691. doi: 10.1148/radiol.2443051661. [DOI] [PubMed] [Google Scholar]
- 238.Glasziou P., Houssami N. The evidence base for breast cancer screening. Preventive Med. 2011;53(3):100–102. doi: 10.1016/j.ypmed.2011.05.011. [DOI] [PubMed] [Google Scholar]
- 239.Guidi A.J., Schnitt S.J. Angiogenesis in preinvasive lesions of the breast. Breast J. 1996;2(6):364–369. [Google Scholar]
- 240.Stark A.M., Way S. The screening of well women for the early detection of breast cancer using clinical examination with thermography and mammography. Cancer. 1974;33(6):1671–1679. doi: 10.1002/1097-0142(197406)33:6<1671::aid-cncr2820330630>3.0.co;2-4. [DOI] [PubMed] [Google Scholar]
- 241.Vreugdenburg T.D., Willis C.D., Mundy L., Hiller J.E. A systematic review of elastography, electrical impedance scanning, and digital infrared thermography for breast cancer screening and diagnosis. Breast Cancer Res. Treat. 2013;137(3):665–676. doi: 10.1007/s10549-012-2393-x. [DOI] [PubMed] [Google Scholar]
- 242.EtehadTavakol M., Sadri S., Ng E.Y.K. Application of k-and fuzzy c-means for color segmentation of thermal infrared breast images. J. Med. Syst. 2010;34(1):35–42. doi: 10.1007/s10916-008-9213-1. [DOI] [PubMed] [Google Scholar]
- 243.EtehadTavakol M., Ng E.Y.K., Lucas C., Sadri S., Gheissari N. Estimating the mutual information between bilateral breast in thermograms using nonparametric windows. J. Med. Syst. 2011;35(5):959–967. doi: 10.1007/s10916-010-9516-x. [DOI] [PubMed] [Google Scholar]
- 244.Johnson R., Jalleh G., Pratt I.S., Donovan R.J., Lin C., Saunders C., Slevin T. Online advertising by three commercial breast imaging services: message takeout and effectiveness. Breast. 2013;22(5):780–786. doi: 10.1016/j.breast.2013.01.013. [DOI] [PubMed] [Google Scholar]
- 245.SPRING Singapore, Standardisation Dept, Technical Reference for Thermal Imagers for Human Temperature Screening: Implementation guidelines. Part 2, Technical reference, SPRING Singapore, 2004. <http://books.google.com.sg/books?id=z5ZDAAAACAAJ>.
- 246.G.R. Peacock, Human radiation thermometry and screening for elevated body temperature in humans, in: Defense and Security, International Society for Optics and Photonics, 2004, pp. 48–53.
- 247.Cheung B.M., Chan L.S., Lauder I.J., Kumana C.R. Detection of body temperature with infrared thermography: accuracy in detection of fever. Hong Kong Med. J. 2012;18:31–34. Suppl. 3. [PubMed] [Google Scholar]
- 248.Y.M. Wu, Stop outbreak of sars with infrared cameras, in: Defense and Security, International Society for Optics and Photonics, 2004, pp. 98–105.
- 249.Bitar D., Goubar A., Desenclos J.C. International travels and fever screening during epidemics: a literature review on the effectiveness and potential use of non-contact infrared thermometers. Euro Surveill. 2009;14(6):19115. [PubMed] [Google Scholar]
- 250.Wong J.J., Wong C.Y. Non-contact infrared thermal imagers for mass fever screening – state of the art or myth? Hong Kong Med. J. = Xianggang yi xue za zhi/Hong Kong Acad. Med. 2006;12(3):242. [PubMed] [Google Scholar]
- 251.Faust O., Acharya U R., Sputh B.H., Min L.C. Systems engineering principles for the design of biomedical signal processing systems. Comput. Methods Progr. Biomed. 2011;102(3):267–276. doi: 10.1016/j.cmpb.2010.05.002. [DOI] [PubMed] [Google Scholar]
- 252.Faust O., Shetty R., Sree S.V., Acharya S., Acharya R., Ng E.Y.K., Poo C.K., Suri J. Towards the systematic development of medical networking technology. J. Med. Syst. 2011;35(6):1431–1445. doi: 10.1007/s10916-009-9420-4. [DOI] [PubMed] [Google Scholar]
- 253.Faust O., Acharya U.R., Sputh B.H., Tamura T. Design of a fault-tolerant decision-making system for biomedical applications. Comput. Methods Biomech. Biomed. Eng. 2012;16:725–735. doi: 10.1080/10255842.2011.635592. [DOI] [PubMed] [Google Scholar]
- 254.Song Z., Ji Z., Ma J.-G., Sputh B., Acharya U.R., Faust O. A systematic approach to embedded biomedical decision making. Comput. Methods Progr. Biomed. 2012;108(2):656–664. doi: 10.1016/j.cmpb.2011.11.002. [DOI] [PubMed] [Google Scholar]
- 255.Faust O., Acharya U., Tamura T. Formal design methods for reliable computer aided diagnosis: a review. IEEE Rev. Biomed. Eng. 2011;5:15–28. doi: 10.1109/RBME.2012.2184750. [DOI] [PubMed] [Google Scholar]
- 256.Acharya U.R., Faust O., Ghista D.N., Sree S.V., Alvin A.P.C., Chattopadhyay S., Lim T.-C., Ng E.Y.-K., Yu W. A systems approach to cardiac health diagnosis. J. Med. Imag. Health Inform. 2013;3(2):261–267. [Google Scholar]
- 257.Fujita K., Noguchi M., Yuzuriha S., Yanagisawa D., Matsuo K. Usefulness of infrared thermal imaging camera for screening of postoperative surgical site infection after the nuss procedure. Case Rep. Surg. 2013;2013:946156. doi: 10.1155/2013/946156. [DOI] [PMC free article] [PubMed] [Google Scholar]
- 258.Weinstein S. Standards for neuromuscular thermographic examination. Modern Med.: Suppl. 1986;1:5–7. [Google Scholar]
- 259.Gratt B., Graff-Radford S., Shetty V., Solberg W., Sickles E. A 6-year clinical assessment of electronic facial thermography. Dentomaxillofacial Radiol. 1996;25(5):247–255. doi: 10.1259/dmfr.25.5.9161178. [DOI] [PubMed] [Google Scholar]