Abstract
The increase in superconducting transition temperature (TC) of Sn nanostructures in comparison to bulk, was studied. Changes in the phonon density of states (PDOS) of the weakly coupled superconductor Sn were analyzed and correlated with the increase in TC measured by magnetometry. The PDOS of all nanostructured samples shows a slightly increased number of low-energy phonon modes and a strong decrease in the number of high-energy phonon modes in comparison to the bulk Sn PDOS. The phonon densities of states, which were determined previously using nuclear resonant inelastic X-ray scattering, were used to calculate the superconducting transition temperature using the Allen-Dynes-McMillan (ADMM) formalism. Both the calculated as well as the experimentally determined values of TC show an increase compared to the bulk superconducting transition temperature. The good agreement between these values indicates that phonon softening has a major influence on the superconducting transition temperature of Sn nanostructures. The influence of electron confinement effects appears to be minor in these systems.
Subject terms: Magnetic properties and materials, Superconducting properties and materials
Introduction
In conventional superconductors phonons bind the electrons into Cooper pairs below a critical temperature (TC). Hence, the spectrum of lattice vibrations, described by the phonon density of states (PDOS), plays a crucial role in conventional superconductivity.Tin is known in two stable phases: Below 285 K, α-Sn a semiconductor with quasi zero bandgap and a diamond cubic structure is the stable phase. Above 285 K, Sn crystallises into the body-centred-tetragonal β-Sn phase. Due to the low transformation rate from the β-Sn phase to the α-Sn phase, the β-Sn phase can be stabilised at low temperatures where it becomes superconducting below 3.72 K1. It belongs to the group of weakly-coupled superconductors (λ < 1). We recently studied the α-Sn to β-Sn transition in thin films through the observation of the PDOS2.
When reducing the dimensions of weakly-coupled superconductors (e.g. Al, In, Sn etc), TC is found to increase. For Sn nanostructures an increase in TC of up to 10% has been observed3–10. The mechanism of this TC enhancement is not well understood and is suggested to be caused by changes in the phonon density of states3,5,11– 14, changes in the electron density of states15–23 or a combination of these effects24–30.
In Sn nanowires and nanoparticles the increase in TC was attributed to electron confinement effects6,7,21,23, whereas in granular films, the origin of the increase in TC was speculated to be a change in the phonon density of states5,12. In our recent work we could explain the increase in λ and TC of Sn nanowires with diameters of 18, 35 and 110 nm by phonon softening and an increase in the electron - phonon coupling31.
In general, to determine whether an increase in TC is caused by the phonon or electron behaviour it is necessary to disentangle their contributions to TC. However, by measuring α2(E)g(E) through tunneling measurements, the electron- and phonon-related effects can not be disentangled. Hence, this approach does not allow a clear determination of the effect of phonon softening on the superconducting properties of nanosized Sn structures.
In this work, we determine the superconducting properties of different Sn nanostructures using the ADMM formalism, from the PDOS extracted earlier32 from nuclear resonant inelastic X-ray scattering measurements.
Results and Discussion
Structural characterisation
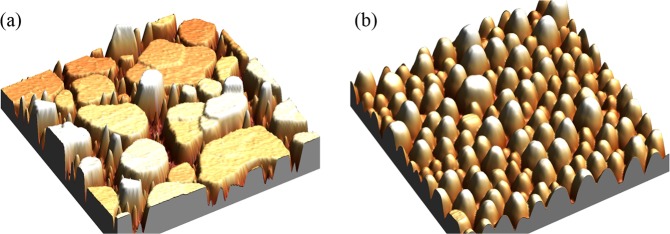
The structural characterisation using atomic force microscopy (AFM) and grazing incidence X-ray diffraction (XRD) of the Sn nanostructures shown here, was presented in detail in ref. 32. The relevant results of these measurements are summarised in Table 1 and Fig. 1. Figure 1 shows AFM images of the two types of nanostructures highlighting their different morphologies: Fig. 1(a) shows a 53 nm thick, granular cluster-assembled film grown on amorphous SiO2 while Fig. 1(b) shows Sn islands, grown on Si(111), with an average island height of 68 ± 17 nm (Fig. 1(b)). To avoid oxidation the nanostructures were capped with Si and Ge respectively. Figure 1 shows clearly that the morphology of the two types of nanostructures is very different. While the Sn islands are textured, with a preferred orientation perpendicular to the substrate, the cluster-assembled film is polycrystalline, consisting of randomly oriented grains formed by coalescence of much smaller deposited clusters. These conclusions are further supported by XRD measurements (not shown). Further details on the sample fabrication and characterisation processes can be found in32.
Table 1.
Characteristics of the investigated samples. For the island samples, the thickness refers to the nominal thickness of Sn (amount of material) deposited on Si(111). For the cluster-assembled film, the thickness is obtained by Rutherford backscattering spectometry. The average crystallite size is obtained from Rietveld refinement of the GIXRD measurements.
| Sample | Type | Nominal thickness (nm) | Average island height (nm) | Average β-Sn crystallite size (nm) |
|---|---|---|---|---|
| isl60 | nano islands | 60 | 100 ± 21 | 68 ± 9 |
| isl40 | nano islands | 40 | 68 ± 17 | 54 ± 6 |
| clus46 | cluster film | 46 | — | 123 ± 14 |
Figure 1.
(a) AFM image of Sn islands (height scale = 139 nm, nominal thickness = 40 nm, image size = 7 μm × 7 μm) ; (b) AFM image of Sn cluster-assembled film, (height scale = 53 nm, thickness = 50 nm, image size = 1 μm × 1 μm).
Superconducting properties
Superconducting quantum interference device (SQUID) magnetometry measurements were carried out to investigate the superconducting properties of the Sn nanostructures. TC was identified as the onset of the diamagnetic response33. The samples were measured in an out-of-plane configuration (i.e., applied magnetic field perpendicular to the sample surface). As a bulk reference, a 119Sn foil was measured in addition to the nanostructures. The m(T) curves of a 119Sn reference foil and sample clus46 are shown in Fig. 2 for different applied fields.
Figure 2.
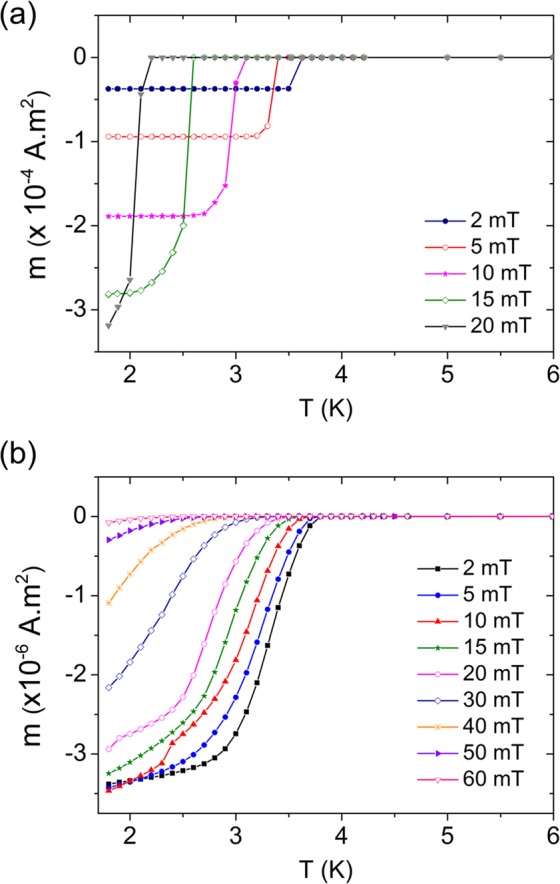
Magnetic moment (m) as a function of temperature after zero-field cooling for different applied magnetic fields for: (a) 119Sn reference foil and (b) clus46.
For the 119Sn foil, a TC of 3.85 ± 0.05 K was found (see Fig. 2(a)), in good agreement with TC (= 3.72 K) found for bulk Sn34. For sample clus46, an increase in TC of 5% (see Fig. 2(b)) was found, TC = 3.93 ± 0.05 K. For isl60 and isl40, an increase in TC was found as well, TC = 4.17 ± 0.05 K (11% increase) and 4.38 ± 0.05 K (16% increase) respectively. SQUID measurements of the Sn islands with and without capping layer were compared (not shown), and no difference in the superconducting behaviour was found. The superconducting phase boundaries were constructed from the m(T) curves at different magnetic fields, see Fig. 3.
Figure 3.
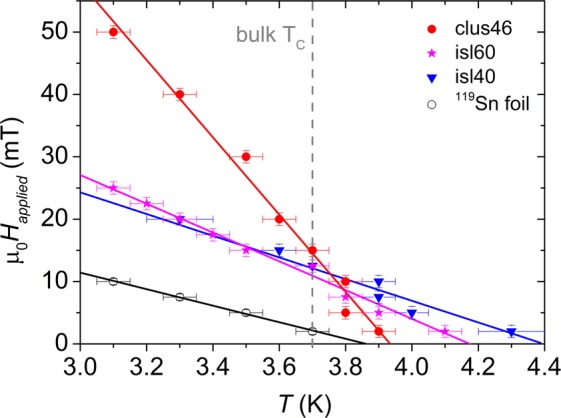
The boundaries of the superconducting phase for the different nanostructures extracted from magnetometry data shown together with the phase boundary of the 119Sn foil. The solid lines are linear fits to the measured data points.
From the phase boundaries in Fig. 3, the upper critical magnetic field, HC2, was determined which is listed in Table 2 for all samples. From HC2 the superconducting coherence length (ξ(0)) was calculated. The slope of the superconducting phase boundary for the Sn island samples is larger than for the Sn reference foil, and the slope for the cluster-assembled film is larger still. This increase in slope of the superconducting phase boundary originates in the reduction of mean free path in the nanostructures which is due to the increased scattering and disorder. This disorder leads to a reduced coherence length (ξ(0) = 0.855 35) and an increased critical field (HC2(0) = 35). Here, ξ(T) and ξ0 are the temperature dependent and independent coherence lengths ( = 230 nm), and ϕ0 is the magnetic flux quantum (2.0678 × 10⁻¹⁵ Wb)34). The Sn foil and Sn nanostructures show a linear behaviour of the critical field near T ≈ TC (HC2 = HC2 (0)(1 − T/TC)). This is consistent with the behaviour of a dirty type-II superconductor (with mean free path l ≪ ξ0). In addition to the m(T) curves, the magnetic moment as a function of applied magnetic field at a fixed temperature, m(Happlied), was measured for the different samples (Fig. 4).
Table 2.
Sample characteristics extracted from the superconducting phase boundaries: critical temperature (TC), critical magnetic field (HC2), coherence length (ξ(0)) and mean free path (l).
| Sample | TC (K) | HC2 (mT) | ξ(0) (nm) | l (nm) |
|---|---|---|---|---|
| 119Sn foil | 3.85 ± 0.05 | 26 ± 6 | 113 ± 13 | 75 ± 17 |
| isl60 | 4.17 ± 0.05 | 35 ± 8 | 97 ± 11 | 56 ± 12 |
| isl40 | 4.38 ± 0.05 | 41 ± 6 | 90 ± 7 | 48 ± 7 |
| clus46 | 3.93 ± 0.05 | 61 ± 5 | 74 ± 3 | 32 ± 3 |
Figure 4.
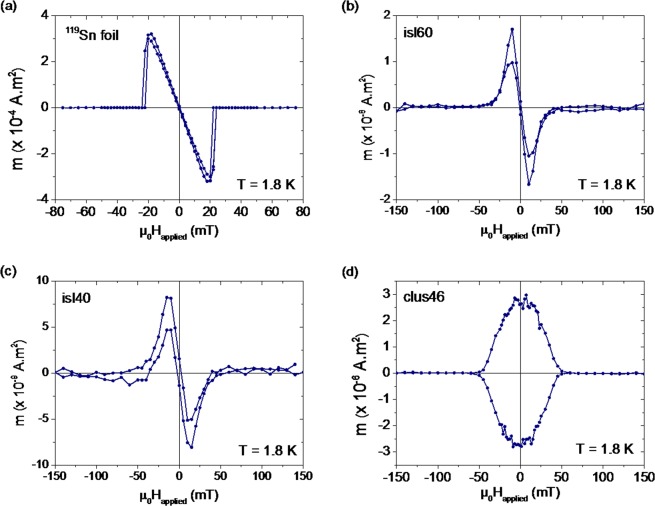
Magnetic moment (m) as a function of applied magnetic field at 1.8 K for the different Sn samples.
The m(Happlied) curve of the Sn foil, measured at 1.8 K, is fully reversible, indicating the absence of magnetic flux pinning (see Fig. 4(a)). Figure 4(b,c) show the results of the m(Happlied) curves for isl60 and isl40 measured at 1.8 K, respectively. The slight hysteresis observed for these samples indicates a limited pinning of magnetic flux lines in these samples. In Fig. 4(d), the m(Happlied) curve for sample clus46 at 1.8 K is shown. This curve shows a pronounced hysteresis, and even flux jumps, or flux avalanches, can be distinguished. Before looking into the role of phonons on the observed enhancement of TC, several other mechanisms which could be invoked to explain this TC increase will be excluded. The isotope effect in Sn is excluded as a potential cause for the observed increase in TC. The former is estimated by:
| 1 |
For Sn, α ≈ 0.4636. Natural Sn has a mass of 118.7 amu, and a TC of 3.72 K. Our enriched 119Sn samples have a mass of 119 amu, which would result in a decrease in TC of 0.1%. The order of magnitude of this effect is by far too small to account for the observed change in TC and the sign of the effect is opposite of what is observed.
Moreover, due to the fact that the samples studied in this work behave as dirty type-II superconductors, anisotropy of the superconducting gap as a cause for the enhancement of the critical temperature37–39 can be excluded as well. The short electron mean free path in dirty type-II superconductors washes out the anisotropy of the superconducting energy gap38,40. This effect could otherwise result in an increase in TC of up to 8%.
Furthermore, it has been predicted that quantum size effects, quantization of the electron spectrum due to dimensional confinement in one direction, also result in an increase of TC20,21. Size dependent behaviour of the critical temperature has been attributed to the shape resonance effect22, which causes the electron density of states near the Fermi level to change as a function of the sample thickness or nanoparticle size7,17,23,41,42. For Sn nanoparticles23 quantum size effects have been observed up to a particle size of 20 nm, whereas for Sn nanowires a 1D-like behaviour has been observed up to a nanowire diameter of 40 nm22. The crystallite size of the samples which were studied here is 50 nm and larger, which is larger than the typical dimensions of Sn nanostructures for which electron confinement effects have been observed. This suggests that electron confinement effects play a minor role and that the changes in the PDOS are dominating the changes in TC in the current study.
For the remainder of this work, we will fully concentrate on the role of phonons in the modification of TC in nanoscale Sn.
Phonon density of states
We have studied the PDOS of different Sn nanostructures by nuclear resonant inelastic X-ray scattering32 and compared them to the PDOS of a bulk Sn foil. We found a decrease of high-energy phonon modes, a small enhancement of low-energy phonon modes and a general broadening of the PDOS features, see Fig. 5 and ref. 32 for a more thorough discussion of the PDOS measurements. These observations can be attributed to the high density of grain boundaries in the investigated nanostructures. Sn atoms at the grain boundaries are in a position of reduced symmetry and coordination. They are held in place by weaker forces than Sn atoms in the bulk, leading to the observed modifications in the PDOS of the nanostructures with respect to bulk.
Figure 5.
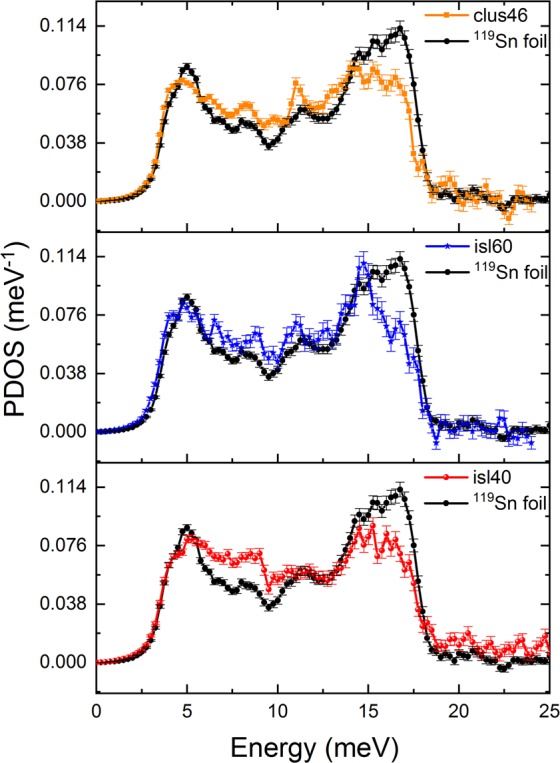
Phonon density of states for the Sn cluster-assembled film and the Sn island samples in comparison to bulk Sn. Data have been reproduced with permission from32.
Allen-dynes-mcMillan formalism
The previously measured phonon spectra were used to determine the critical superconducting temperature, the characteristic phonon frequency and electron - phonon coupling constant (λ) within the Allen-Dynes-McMillan formalism based on the Eliashberg equations43. Besides the Coulomb repulsion, also the retarded electron - phonon interaction is explicitly included in the ADMM equation via the electron phonon spectral function α2(E)g(E), which includes the PDOS and the electron - phonon interaction α2(E)43. We have used the following ADMM equation for TC, a correction to the McMillan expression used for the calculation of TC in conventional superconductors44.
| 2 |
with μ* the Coulomb pseudopotential which corresponds to a renormalised Coulomb repulsion43 and
| 3 |
Allen and Dynes introduced the correction factors f1 and f2 as defined below43 to account for strong coupling corrections. These correction factors go towards unity in the weak coupling limit.
| 4 |
| 5 |
f2 depends on the characteristic phonon frequency:
| 6 |
The logarithmic average frequency used in Eq. (2) is defined as:
| 7 |
Also a slightly different analytical expression for TC derived from the Eliashberg equations45 was applied to calculate TC. It revealed similar results as will be shown below (see also Supplementary information). In order to calculate TC, , ωln using Eqs. (2–7), the electron - phonon interaction, α2(E), and the Coulomb pseudopotential, μ*, need to be estimated.
α2(E) g(E) was taken from literature46, where it was obtained from tunneling measurements on 200 nm thick granular Sn films on glass substrates. α2(E) g(E) is subsequently divided by our experimentally obtained PDOS, g(E), of the reference Sn foil to obtain α2(E). The thus obtained α2(E) is an estimation since α2(E) g(E) and the PDOS of the Sn foil were not measured on the same Sn sample. However, no information is available in literature on α2(E) of Sn directly. Nonetheless, this approach, which has been used before47,48 to determine α2(E) for Nb3Sn, provides the best available estimation for α2(E).
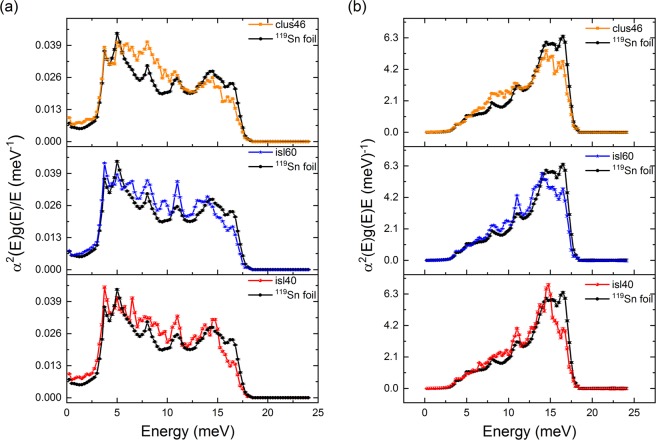
In Fig. 6 α2(E)g(E)/E and α2(E)g(E)E are shown, which are integrated for the calculation of λ and respectively (see Table 3). The effect of phonon softening can be seen from the larger values of these functions at low energies and their reduced values at high energies compared to bulk Sn.
Figure 6.
(a) The phonon density of states was combined with α2(E) to obtain α2(E) g(E)/E for the Sn cluster-assembled film and the island samples in comparison to bulk Sn. (b) The phonon density of states was combined with α2(E) and replotted as α2(E) g(E)E for the different Sn nanostructures and the 119Sn reference foil.
Table 3.
λ, , ∫g(E)EdE, ωln, calculated for all samples, using μ* = 0.117 and calculated for all samples, using μ* = 0.119. The last column shows the experimentally obtained critical temperature, TC,exp *(the error on TC,exp is 0.05 K for all samples and is determined by the temperature stability of the SQUID magnetometer, the errors indicated for the other quantities are based on the statistical error of the PDOS).
| Sample | λ | ∫g(E)EdE | ωln | TC,exp* | |||
|---|---|---|---|---|---|---|---|
| (meV) | (meV) | (meV) | (K) | (K) | (K) | ||
| 119Sn foil | 0.76 ± 0.04 | 10.4 ± 0.2 | 11.62 ± 0.03 | 8.1 ± 0.2 | 3.7 ± 0.2 | 3.7 ± 0.2 | 3.85 |
| isl60 | 0.82 ± 0.03 | 9.9 ± 0.3 | 10.82 ± 0.04 | 7.8 ± 0.2 | 4.1 ± 0.2 | 4.2 ± 0.2 | 4.17 |
| isl40 | 0.84 ± 0.06 | 9.8 ± 0.4 | 10.74 ± 0.05 | 7.6 ± 0.3 | 4.3 ± 0.4 | 4.4 ± 0.3 | 4.38 |
| clus46 | 0.82 ± 0.04 | 9.8 ± 0.3 | 10.36 ± 0.03 | 7.6 ± 0.2 | 4.1 ± 0.2 | 4.1 ± 0.2 | 3.93 |
The only unknown which is left at this point in Eq. (2) is the Coulomb pseudopotential μ*. For bulk Sn, TC is known to be 3.72 K. By equating TC in Eq. (2) to 3.72 K and using the phonon spectrum of bulk Sn, μ* is estimated to be 0.117. The value of μ* agrees well with values reported in literature5,45,49 and it is known that for most metals, μ* should be ≤0.250.
These empirical values for μ* and α2(E) were fixed (μ* and α2(E) were taken to have the same values for all Sn samples) and were used to calculate TC,cal using the experimentally determined phonon spectrum of the corresponding sample. In Table 3, λ, , ωln, TC,cal and TC,exp are listed for all samples. Table 3 shows the obtained values for λ, and ωln as well as the intuitive average phonon frequency (energy) obtained by integrating g(E)EdE without taking the electron phonon coupling into account. It can be seen that this average frequency (energy) is significantly reduced (7–11%) for the nanostructured samples compared to the bulk Sn foil. Furthermore, the characteristic phonon frequencies and ωln for all the nanostructured samples are up to 6% lower than for the bulk Sn foil, which indicates that the phonon spectra of all nanostructures are softer than that of the bulk Sn foil. This is indeed expected from the high density of grain boundaries present in all Sn nanostructures, which causes a decrease in the high-energy phonon modes and a slight enhancement in the low-energy phonon modes. This clear trend of phonon softening goes along with an increase of the electron - phonon coupling parameter λ of up to 10 % in the nanostructured samples. Table 3 also displays the experimental and calculated (using Eq. (2)) critical temperatures TC,exp and TC,calc. Clearly, TC,calc in the nanostructured samples is enhanced up to 19% compared to the bulk sample as a result of the modifications in the PDOS, i. e. due to phonon softening.
From the agreement between TC,cal and TC,exp ( < 5%) it was concluded that the phonon softening observed for the nanostructures is the main contribution to the increase in TC. The contribution of electron confinement effects to the change in TC is minimal and of secondary importance.
To further confirm these results TC was also calculated using an analytical experssion based on the Eliashberg formalism shown by Kresin45 (see Supplementary information). We further refer to these results as the Eliashberg results and compare them with the TC obtained using the ADMM formalism. Both these formalisms are extensions of the original Bardeen - Cooper - Schrieffer theory for a larger range of electron - phonon coupling strengths (λ) and are expected to give comparable results for the low λ found for Sn. We indeed find the same values of TC for all samples within error bars independent of the used expression as can be seen in Fig. 7 (T, for the ADMM results and T for the Eliashberg results).
Figure 7.
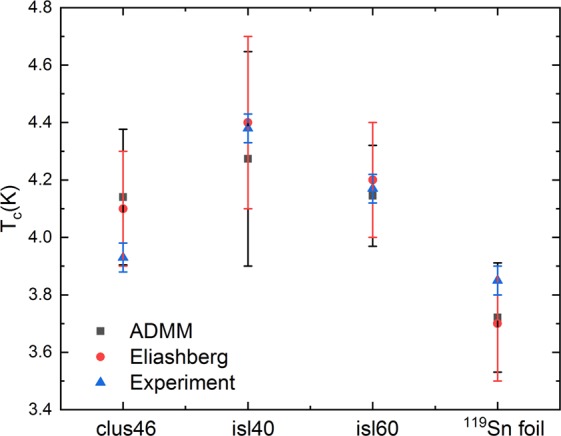
Comparison of TC,exp and TC,calc for the ADMM as well as the Eliashberg formalism.
The dominance of phonon softening in the increase of TC is different to what has been observed previously in the case of Nb3Sn thin films48. For Nb3Sn, a strong coupling superconductor, the phonon induced effects were found to induce a slight decrease in TC with decreasing film thickness. This phonon-related decrease in TC was found to be only a small fraction of the experimentally observed decrease in TC, the main cause being electron confinement effects. This difference in behaviour of TC of Nb3Sn films and Sn nanostructures can be explained by the fact that Nb3Sn is a strongly coupled superconductor, while Sn is a weakly coupled superconductor.
Conclusions
We determined the characteristic phonon frequency (), the electron - phonon coupling strength (λ) as well as the superconducting critical temperature TC from the PDOS of nanostructured Sn samples using the Allen-Dynes-McMillan43 and Eliashberg45 formalisms. The PDOS of the samples were experimentally obtained in our previous work using nuclear resonant inelastic X-ray scattering and showed clear phonon softening in the nanostructured samples32. The softening of the characteristic phonon frequency is accompanied by an increase of the electron - phonon coupling strength (λ). We compared the calculated values of TC to SQUID magnetometry measurements on the same samples. Both methods show an increase in TC for the nanostructures. The possible causes of this increase in TC was discussed. The isotope effect, the anisotropy of the superconducting gap as well as quantum size effects could be excluded. Electron confinement effects were considered unlikely and playing only a secondary role in the enhancement of TC observed here. The good agreement between the experimentally obtained critical temperature of the Sn nanostructures and the TC calculated based on the measured PDOS confirms that phonon softening effects play the dominate role in the observed enhancement of TC.
Methods
Details on the growth and structural characterization of the Sn nanostructures can be found in ref. 32. The Sn islands were grown using molecular beam epitaxy on Si(111) substrates. The Sn cluster-assembled film was grown on a SiO2 substrate using a laser-vaporization cluster source51. The AFM images were recorded using a Nanowizard 3 system (JPK, Germany) and a Multimode 8 system (Bruker, USA) and processed using WSxM52. The superconducting behaviour of the different Sn samples was probed by SQUID magnetization measurements (LOT-Quantum Design, MPMS-XL). The phonon density of states of all Sn samples was measured using nuclear resonant inelastic X-ray scattering53–55 at sector 3-ID of the Advanced Photon Source (Argonne National Laboratory, USA). Measurements were carried out at 35 ± 20 K in a grazing incidence geometry. The data were analyzed using the PHOENIX software56. A more elaborate discussion of the nuclear resonant inelastic X-ray scattering measurements can be found elsewhere32.
Supplementary information
Acknowledgements
This work was supported by the Research Foundation-Flanders (FWO) and the Concerted Research Action (GOA/14/007). K.H., S.C. and T.P. thank the FWO for financial support. This research used resources of the Advanced Photon Source, a U.S. Department of Energy (DOE) Office of Science User Facility operated for the DOE Office of Science by Argonne National Laboratory under Contract No. DE-AC02-06CH11357. The authors thank Ward Brullot for fruitful discussions.
Author contributions
M.J.V.B., K.T. and A.V. conceived and designed the work. K.H., T.P., S.C., E.M. and J.K.J. performed data acquisition and data analysis. K.H. and J.K.J. wrote the manuscript. M.Y.H., J.Y.Z., and E.E.A. supervised the NRIXS measurements. All authors have reviewed and edited the text. M.J.V.B. supervised the analysis and editing of the work.
Competing interests
The authors declare no competing interests.
Footnotes
Publisher’s note Springer Nature remains neutral with regard to jurisdictional claims in published maps and institutional affiliations.
Supplementary information
is available for this paper at 10.1038/s41598-020-62617-4.
References
- 1.Jesser W. A theory of pseudomorphism in thin films. Mat. Sci. Eng. A-Struct. 1969;4(5):279–286. doi: 10.1016/0025-5416(69)90004-4. [DOI] [Google Scholar]
- 2.Houben, K. In situ study of the α -sn to β -sn phase transition in low-dimensional systems: Phonon behavior and thermodynamic properties. Phys. Rev. B 100 075408 (Aug 2019).
- 3.Abeles, B., Cohen, R. W. & Cullen, G. W. Enhancement of superconductivity in metal films. Phys. Rev. Lett. 17 632–634 (Sep 1966).
- 4.Strongin M, et al. Enhanced superconductivity in layered metallic films. Phys. Rev. Lett. 1968;21(18):1320–1323. doi: 10.1103/PhysRevLett.21.1320. [DOI] [Google Scholar]
- 5.Knorr K, Barth N. Superconductivity and phonon spectra of disordered thin films. Solid State Commun. 1970;8(13):1085–1088. doi: 10.1016/0038-1098(70)90265-6. [DOI] [Google Scholar]
- 6.Jankovic L, et al. Carbon nanotubes encapsulating superconducting single-crystalline tin nanowires. Nano lett. 2006;6(6):1131–1135. doi: 10.1021/nl0602387. [DOI] [PubMed] [Google Scholar]
- 7.Tian M, et al. Dissipation in quasi-one-dimensional superconducting single-crystal Sn nanowires. Phys. Rev. B. 2005;71(10):104521. doi: 10.1103/PhysRevB.71.104521. [DOI] [Google Scholar]
- 8.Strongin M, Thompson RS, Kammerer OF, Crow Destruction of superconductivity in disordered near-monolayer films. Phys. Rev. B. 1970;1(3):1078. doi: 10.1103/PhysRevB.1.1078. [DOI] [Google Scholar]
- 9.Felsch W, GloverChange RE. of superconducting transition temperature caused by adsorption of noble gases. Solid State Commun. 1972;10(11):1033–1037. doi: 10.1016/0038-1098(72)90890-3. [DOI] [Google Scholar]
- 10.Houben K, et al. Coexistence of superconductivity and ferromagnetism in cluster-assembled Sn-Co nanocomposites. J. Alloys Compd. 2015;637:509–516. doi: 10.1016/j.jallcom.2015.03.007. [DOI] [Google Scholar]
- 11.Tamura A. Phonon effect on enhancement and reduction of the superconducting transition temperature of a small particle and amorphous thin films. Z. Phys. D. At., Mol. Clusters. 1993;26(1):240–242. doi: 10.1007/BF01425677. [DOI] [Google Scholar]
- 12.Strongin M. Superconductivity in thin films and small particles. Physica. 1971;55:155–172. doi: 10.1016/0031-8914(71)90249-7. [DOI] [Google Scholar]
- 13.Allen PB. Effect of soft phonons on superconductivity: A re-evaluation and a positive case for Nb3Sn. Solid State Commun. 1974;14(10):937–940. doi: 10.1016/0038-1098(74)90397-4. [DOI] [Google Scholar]
- 14.Leavens CR, Fenton EW. Superconductivity of small particles. Phys. Rev. B. 1981;24(9):5086. doi: 10.1103/PhysRevB.24.5086. [DOI] [Google Scholar]
- 15.Parmenter RH. Size effect in a granular superconductor. Phys. Rev. 1968;166(2):392. doi: 10.1103/PhysRev.166.392. [DOI] [Google Scholar]
- 16.Chen TT, Chen JT, Leslie JD, Smith HJT. Phonon spectrum of superconducting amorphous bismuth and gallium by electron tunneling. Phys. Rev. Lett. 1969;22(11):526. doi: 10.1103/PhysRevLett.22.526. [DOI] [Google Scholar]
- 17.Guo Y, et al. Superconductivity modulated by quantum size effects. Science. 2004;306(5703):1915–1917. doi: 10.1126/science.1105130. [DOI] [PubMed] [Google Scholar]
- 18.Chen B, Zhu Z, Xie XC. Quantum size effects in thermodynamic superconducting properties of ultrathin films. Phys. Rev. B. 2006;74(13):132504. doi: 10.1103/PhysRevB.74.132504. [DOI] [Google Scholar]
- 19.Komnik YF, Bukhshtab EI, Mankovsky KK. Quantum size effect in superconducting tin films. Sov. Phys. JETP. 1970;30(5):807–812. [Google Scholar]
- 20.Shanenko AA, Croitoru MD, Peeters FM. Quantum-size effects on Tc in superconducting nanofilms. EPL (Europhysics Letters) 2006;76(3):498. doi: 10.1209/epl/i2006-10274-6. [DOI] [Google Scholar]
- 21.Croitoru MD, Shanenko AA, Peeters FM. Dependence of superconducting properties on the size and shape of a nanoscale superconductor: From nanowire to film. Phys. Rev. B. 2007;76(2):024511. doi: 10.1103/PhysRevB.76.024511. [DOI] [Google Scholar]
- 22.Shanenko AA, Croitoru MD, Zgirski M, Peeters FM, Arutyunov K. Size-dependent enhancement of superconductivity in Al and Sn nanowires: Shape-resonance effect. Phys. Rev. B. 2006;74(5):052502. doi: 10.1103/PhysRevB.74.052502. [DOI] [Google Scholar]
- 23.Bose S, et al. Observation of shell effects in superconducting nanoparticles of sn. Nat. Mater. 2010;9(7):550–554. doi: 10.1038/nmat2768. [DOI] [PubMed] [Google Scholar]
- 24.Bose S, et al. Competing effects of surface phonon softening and quantum size effects on the superconducting properties of nanostructured Pb. J. Phys.: Condens. Matter. 2009;21(20):205702. doi: 10.1088/0953-8984/21/20/205702. [DOI] [PubMed] [Google Scholar]
- 25.Garland JW, Bennemann KH, Mueller FM. Effect of lattice disorder on the superconducting transition temperature. Phys. Rev. Lett. 1968;21(18):1315. doi: 10.1103/PhysRevLett.21.1315. [DOI] [Google Scholar]
- 26.Hwang EH, Sarma SD, Stroscio MA. Role of confined phonons in thin-film superconductivity. Phys. Rev. B. 2000;61(13):8659. doi: 10.1103/PhysRevB.61.8659. [DOI] [Google Scholar]
- 27.Bose S, Raychaudhuri P, Banerjee R, Vasa P, Ayyub P. Mechanism of the size dependence of the superconducting transition of nanostructured Nb. Phys. Rev. Lett. 2005;95(14):147003. doi: 10.1103/PhysRevLett.95.147003. [DOI] [PubMed] [Google Scholar]
- 28.Li WH, Yang CC, Tsao FC, Lee KC. Quantum size effects on the superconducting parameters of zero-dimensional pb nanoparticles. Phys. Rev. B. 2003;68(18):184507. doi: 10.1103/PhysRevB.68.184507. [DOI] [Google Scholar]
- 29.Croitoru M. et al. Phonon limited superconducting correlations in metallic nanograins. Sci. Rep. 5 (2015). [DOI] [PMC free article] [PubMed]
- 30.Croitoru M, et al. Influence of disorder on superconducting correlations in nanoparticles. J. Supercond. Nov. Magn. 2016;29(3):605–609. doi: 10.1007/s10948-015-3319-8. [DOI] [Google Scholar]
- 31.Lozano, D. P. et al. Experimental observation of electron-phonon coupling enhancement in sn nanowires caused by phonon confinement effects. Phys. Rev. B 99 064512 (Feb 2019).
- 32.Houben K, et al. Lattice dynamics in sn nanoislands and cluster-assembled films. Phys. Rev. B. 2017;95(15):155413. doi: 10.1103/PhysRevB.95.155413. [DOI] [Google Scholar]
- 33.Cuppens J, Romero CP, Lievens P, Van Bael MJ. Superconductivity in Pb cluster assembled systems with different degrees of coagulation. Phys. Rev. B. 2010;81(6):064517. doi: 10.1103/PhysRevB.81.064517. [DOI] [Google Scholar]
- 34.Ashcroft, N. W. & Mermin, D. Introduction to solid state physics. Saunders, Philadelphia (1976).
- 35.Tinkham, M. Introduction to superconductivity. Courier Dover Publications (2012).
- 36.Serin, B., Reynolds, C. A. & Lohman, C. The isotope effect in superconductivity. ii. tin and lead. Phys. Rev. 86 162–164 (Apr 1952).
- 37.Markowitz D, Kadanoff LP. Effect of impurities upon critical temperature of anisotropic superconductors. Phys. Rev. 1963;131(2):563. doi: 10.1103/PhysRev.131.563. [DOI] [Google Scholar]
- 38.Richards PL. Anisotropy of the superconducting energy gap in pure and impure tin. Phys. Rev. Lett. 1961;7(11):412. doi: 10.1103/PhysRevLett.7.412. [DOI] [Google Scholar]
- 39.Clem JR. Effects of energy gap anisotropy in pure superconductors. ANN. PHYS. 1966;40(2):268–295. doi: 10.1016/0003-4916(66)90028-5. [DOI] [Google Scholar]
- 40.Townsend P, Sutton J. Investigation by electron tunneling of the superconducting energy gaps in Nb, Ta, Sn, and Pb. Phys. Rev. 1962;128(2):591. doi: 10.1103/PhysRev.128.591. [DOI] [Google Scholar]
- 41.Orr BG, Jaeger HM, Goldman AM. Transition-temperature oscillations in thin superconducting films. Phys. Rev. Lett. 1984;53(21):2046. doi: 10.1103/PhysRevLett.53.2046. [DOI] [Google Scholar]
- 42.Paskin A, Strongin M. Comment on ransition-temperature oscillations in thin superconducting films. Phys. Rev. Lett. 1985;55(1):139. doi: 10.1103/PhysRevLett.55.139. [DOI] [PubMed] [Google Scholar]
- 43.Allen, P. B. & Dynes, R. C. Transition temperature of strong-coupled superconductors reanalyzed. Phys. Rev. B 12 905–922 (Aug 1975).
- 44.McMillan, W. L. Transition temperature of strong-coupled superconductors. Phys. Rev. 167 331–344, (Mar 1968).
- 45.Kresin VZ. On the critical temperature for any strength of the electron-phonon coupling. Phys. Lett. A. 1987;122(8):434–438. doi: 10.1016/0375-9601(87)90744-4. [DOI] [Google Scholar]
- 46.Rowell JM, McMillan WL, Feldmann WL. Superconductivity and lattice dynamics of white tin. Phys. Rev. B. 1971;3(12):4065. doi: 10.1103/PhysRevB.3.4065. [DOI] [Google Scholar]
- 47.Markiewicz WD. Elastic stiffness model for the critical temperature Tc of Nb3 Sn including strain dependence. Cryogenics. 2004;44(11):767–782. doi: 10.1016/j.cryogenics.2004.03.019. [DOI] [Google Scholar]
- 48.Couet S, et al. Interplay between lattice dynamics and superconductivity in Nb3Sn thin films. Phys. Rev. B. 2013;88(4):045437. doi: 10.1103/PhysRevB.88.045437. [DOI] [Google Scholar]
- 49.Morel P, Anderson PW. Calculation of the superconducting state parameters with retarded electron-phonon interaction. Phys. Rev. 1962;125(4):1263. doi: 10.1103/PhysRev.125.1263. [DOI] [Google Scholar]
- 50.Poole, C. K., Farach, H. A. & Creswick, R. J. Handbook of superconductivity. Academic Press (1999).
- 51.Vandamme N, Janssens E, Vanhoutte F, Lievens P, Van Haesendonck C. Scanning probe microscopy investigation of gold clusters deposited on atomically flat substrates. J. Phys.: Condens. Matter. 2003;15(42):S2983. [Google Scholar]
- 52.Horcas I, et al. Wsxm: a software for scanning probe microscopy and a tool for nanotechnology. Rev. Sci. Instrum. 2007;78(1):013705. doi: 10.1063/1.2432410. [DOI] [PubMed] [Google Scholar]
- 53.Röhlsberger, R. Nuclear Condensed Matter Physics with Synchrotron Radiation: Basic Principles, Methodology and Applications. No. 208, (Springer, 2004).
- 54.Chumakov AI, Sturhahn W. Experimental aspects of inelastic nuclear resonance scattering. Hyperfine Interact. 1999;123(1–4):781–808. doi: 10.1023/A:1017052730094. [DOI] [Google Scholar]
- 55.Sturhahn W, et al. Phonon density of states measured by inelastic nuclear resonant scattering. Phys. Rev. Lett. 1995;74(19):3832. doi: 10.1103/PhysRevLett.74.3832. [DOI] [PubMed] [Google Scholar]
- 56.Sturhahn W. CONUSS and PHOENIX: Evaluation of nuclear resonant scattering data. Hyperfine Interact. 2000;125(1–4):149–172. doi: 10.1023/A:1012681503686. [DOI] [Google Scholar]
Associated Data
This section collects any data citations, data availability statements, or supplementary materials included in this article.


