

Abstract
Objective:
Adults with established diagnoses of serious mental illness (bipolar disorder and schizophrenia) exhibit structural brain abnormalities, yet less is known about how such abnormalities manifest earlier in development.
Method:
Cross-sectional data publicly available from the Philadelphia Neurodevelopmental Cohort (PNC) were analyzed. Structural magnetic resonance neuroimaging data were collected on a subset of the PNC (N = 989; 9–22 years old). Cortical thickness, surface area (SA), and subcortical volumes were calculated. Study participants were assessed for psychiatric symptomatology using a structured interview and the following groups were created: typically developing (n = 376), psychosis spectrum (PS; n = 113), bipolar spectrum (BP; n = 117), and BP + PS (n = 109). Group and developmental differences in structural magnetic resonance neuroimaging measures were examined. In addition, the extent to which any structural aberration was related to neurocognition, global functioning, and clinical symptomatology was examined.
Results:
Compared with other groups, PS youth exhibited significantly decreased SA in the orbitofrontal, cingulate, precentral, and postcentral regions. PS youth also exhibited deceased thalamic volume compared with all other groups. The strongest effects for precentral and posterior cingulate SA decreases were seen during early adolescence (13–15 years old) in PS youth. The strongest effects for decreases in thalamic volume and orbitofrontal and postcentral SA were observed in mid-adolescence (16–18 years) in PS youth. Across groups, better overall functioning was associated with increased lateral orbitofrontal SA. Increased postcentral SA was associated with better executive cognition and less severe negative symptoms in the entire sample.
Conclusion:
In a community-based sample, decreased cortical SA and thalamic volume were present early in adolescent development in youth with PS symptoms, but not in youth with BP symptoms or with BP and PS symptoms. These findings point to potential biological distinctions between PS and BP conditions, which could suggest additional biomarkers relevant to early identification.
Keywords: schizophrenia, neuroimaging, development, surface area, cortical thickness
The transition from adolescence to adulthood is a unique period of development supported by specialized brain maturation and is a time when the prevalence of psychiatric disorders markedly increases.1 Severe psychiatric disorders, such as bipolar disorder and schizophrenia, likely arise through deviations from typical neurodevelopmental trajectories, although the exact nature of these changes remains unknown. Although structural brain alterations in adults with bipolar disorder and psychosis are well established,2–7 less is known about the manner in which these differences emerge, and whether youth experiencing a broad spectrum of psychosis- and bipolar-associated symptomatology exhibit similar differences.
Importantly, structural brain volume can be decomposed into cortical thickness (CT) and surface area (SA), which are driven by distinct genetic and neurobiological mechanisms.8–10 Compared with healthy controls, a recent large-scale meta-analysis found widespread SA deficits across the cortex in adult patients with schizophrenia,4 which were not observed in a large-scale meta-analysis of cortical structure in bipolar disorder.5 This pattern also was observed in a study that directly compared structural brain alterations in adult participants with schizophrenia and bipolar disorder.6 Similarly, adults with schizophrenia exhibited widespread CT decreases,4 whereas cortical thinning was restricted to frontal and temporal regions in bipolar disorder.5 Bipolar disorder and schizophrenia are associated with smaller volumes in the hippocampus and thalamus, but the effects are of greater magnitude in schizophrenia.2,3 Collectively, these findings suggest that widespread cortical SA and CT deficits are unique to schizophrenia, although subcortical structural abnormalities are present in schizophrenia and bipolar disorder, albeit to a greater extent in schizophrenia. It is not known to what extent these differences are present in youth experiencing a range in severity of bipolar spectrum (BP) and psychosis spectrum (PS) symptoms.
In addition, there are commonalities between the 2 disorders in clinical characteristics, such as psychotic symptoms and genetic risk variants.11,12 For these disorders, medication effects can contribute to the observed brain alterations.4,5 As such, it would be informative to investigate individuals at earlier stages of symptom emergence, before the effects of chronic illness, and those who experience subclinical levels of symptomatology and thus are not medicated. Furthermore, many patients display mixed mood and psychotic symptoms,13 yet it is not clear to what extent similar neuroanatomic differences are observed in those who have PS and BP symptoms compared with those with only PS or BP symptoms.
An initial investigation into volumetric abnormalities in youth with PS symptoms drawing from the same population sample used in the present study, the Philadelphia Neurodevelopmental Cohort (PNC),14,15 found that youth with PS symptoms exhibited decreased whole-brain gray matter, particularly in the medial temporal lobe and in the frontal, temporal, and parietal cortices.16 Smaller-scale studies of youth experiencing subclinical PS symptoms found a similar pattern: decreased gray matter in the frontal and temporal regions.17 Furthermore, progressive medial orbitofrontal CT decreases were observed in clinical high-risk youth who converted to a psychotic disorder, indicating that these CT patterns might emerge before the onset of psychosis.18 However, the impact of mood symptoms, such as BP symptoms, on structural brain alterations has not yet been investigated. Furthermore, we do not know whether individuals who exhibit PS and BP symptoms have distinct neuroanatomic alterations from these 2 groups.
To our knowledge, no studies have investigated the independent contributions of CT and SA to brain structure in PS and BP youth. Existing evidence shows that these indices are driven by different genetic and neurobiological mechanisms.8–10 Furthermore, these subcomponents of brain volume offer a potentially meaningful window into the developmental course of brain structure. Early childhood brain development in healthy infants indicates cortical SA and CT develop separately, with CT achieving 97% of adult values on average by 2 years of age; in contrast, SA achieves only 69% of adult values by 2 years and continues to develop and expand.19 As a result, these researchers suggested that SA explains most of cortical volume variation after 2 years and proposed that early identification and prevention of neuropsychiatric illnesses focus on SA. However, this notion has not been fully explored, particularly with regard to youth who could be exhibiting early signs of serious mental illness.
As such, this study leveraged cross-sectional neuroimaging data from the PNC to examine CT, SA, and subcortical volumes of PS, BP, PS and BP (BP + PS), and typically developing (TD) youth to determine common and distinct brain differences in youth with PS + BP symptoms; age-associated differences compared with TD youth; and whether dimensional symptom severity is related to observed structural differences. Importantly, the criteria used to define the BP and PS groups reflect a broader range of symptomatology than those applied in adult case-control studies, given the young age of the sample and our interest in investigating a wider spectrum of mood and psychosis symptoms in this non-clinically ascertained cohort. We hypothesized that PS youth would exhibit the most severe deficits, with the largest effect sizes occurring in the prefrontal and temporal regions; and within regions that exhibited group differences, PS youth would show the greatest age-associated differences compared with TD youth.
METHOD
Sample
All data were obtained from the publicly available PNC (first release, number 7147) through the Database of Genotypes and Phenotypes (dbGap) platform. The data and analyses in the present publication are based on study data downloaded from the dbGaP web site under phs000607.v1.p1 (eg, https://www.ncbi.nlm.nih.gov/projects/gap/cgi-bin/study.cgi?study_id=phs000607.v1.p1). The PNC is a population sample consisting of 9,498 youth (9–22 years old) who participated in neurocognitive and genetic assessments after providing written informed consent or assent with parental consent (youth <18 years old). A subset of these youth (N = 997) also underwent neuroimaging. Study participants were assessed for psychiatric symptoms using the GOASSESS interview,20 which incorporates questions from the Schedule for Affective Disorders and Schizophrenia for School-Age Children (KSADS),21 the Structured Interview for Prodromal Syndromes (SIPS),22 and the PRIME Screen Revised.23 The TD group consisted of youth who denied clinically significant symptoms of psychopathology based on responses to the GOASSESS interview. Similar to previous publications on the PNC,16,20,24–26 psychopathology was considered significant if symptoms endorsed were consistent with the frequency and duration of a DSM-IV psychiatric disorder and correspondingly accompanied by significant distress or impairment (rating ≥ 5 on scale of 0–10). Individuals who endorsed symptoms meeting these criteria were excluded from the TD group, resulting in a final sample of 376 youth.
The PS group was defined as in prior PNC publications.16,20,24–26 Specifically, it included participants who had a score of 6 on any PRIME Screen Revised item, had a score of 5 or 6 on at least 3 items on the PRIME Screen Revised, or scored at least 2 standard deviations above the total score of age-cohort mean on the SIPS; or answered yes to hallucination-related questions on the KSADS and endorsed experiencing significant impairment or distress as a result and not using drugs at the time of the experience of the symptom; or scored at least 2 standard deviations above the age-cohort mean total score on 6 SIPS negative symptom items: attention and focus, disorganized speech, perception of self, experience of emotion, occupational function, and volition. We defined a BP group that included participants who endorsed at least 2 primary depressive symptoms on the KSADS and at least 2 primary manic or hypomanic symptoms lasting at least 1 day outside the context of substance use, illness, or medication use, with significant impairment or distress as a result of symptoms. The BP criteria were chosen based on the existing literature examining precursors to bipolar disorder, which consistently found that the presence of subsyndromal depression and mania significantly predicted the development of bipolar disorder.27–30
When defining clinical groups, the word “prodrome” was omitted for several reasons. First, the “prodrome” has been defined as “the early symptoms and signs that precede the acute clinical phase of an illness”31 and we do not know how many PNC participants will go on to develop a full-blown psychiatric disorder. Second, the original design of the PNC study was to take a population-based sample, not a help-seeking group. Third, researchers focusing on early intervention of psychosis and bipolar disorder caution against the use and interpretation of “prodrome.”32 Instead, our focus was to sample symptoms dimensionally from subclinical to fully symptomatic to better understand the underlying neuroanatomic abnormalities that might be associated with BP and/or PS symptomatology.
Clinical Symptoms and Functioning
Responses to the PRIME Screen Revised questionnaire were summed as a dimensional measure of positive symptoms. Responses were rated on a Likert scale (0 definitely disagree, 1 = somewhat disagree, 2 = slightly disagree, 3 = not sure, 4 = slightly agree, 5 = somewhat agree, 6 = definitely agree). Responses to mood-related symptoms on dimensional measure of mood. The exact items used for positive, negative, and mood symptoms are presented in Table S1, available online.
As part of the clinical testing, all participants were rated on the Global Assessment of Functioning (GAF), a widely used clinical scale to rate the social, occupational, and psychological functioning of an individual.33 The scale ranges from 0 to 100, with higher scores indicating better overall functioning. We used current GAF scores as our measure of functioning.
Neurocognitive Factor Scores
PNC participants underwent cognitive testing using the Penn Computerized Neurocognitive Battery. Descriptions of the metrics and calculation of efficiency scores for 4 domains were calculated according to a confirmatory factor analysis (N = 9,13834) for complex cognition (language reasoning, nonverbal reasoning, and spatial ability), executive control (mental flexibility, attention, and working memory), episodic memory (verbal memory, face memory, and spatial memory), and social cognition (emotion identification, emotion differentiation, and age differentiation).
Imaging Processing and Analysis
All neuroimaging data (N = 997) were acquired on the same 3-T Siemens TIM Trio magnetic resonance neuroimaging (MRI) scanner at the Children’s Hospital at the University of Pennsylvania. The following imaging sequence was used for T1-weighted images (magnetization-prepared rapid acquisition gradient echo): repetition time 1,810 ms, echo time 3.5 ms, inversion time 1,000 ms, flip angle 9, slice thickness 1 mm, and right-to-left/anterior-to-posterior field of view 180/240 (as described by Satterthwaite et al.14). The FreeSurfer Image Analysis Suite 5.3.0 (https://surfer.nmr.mgh.harvard.edu/fswiki/FreeSurferMethodsCitation) was used to derive bilateral measures of CT, cortical SA, and subcortical volume. FreeSurfer is a well-validated neuroimaging processing protocol that has previously been described in detail.35,36 We extracted values based on the Desikan FreeSurfer atlas37 and averaged the values from 2 hemispheres (34 regions for CT and SA; 6 subcortical volume regions). We implemented a quality assessment pipeline developed for the Enhancing Neuroimaging Genetics through Meta-Analysis (ENIGMA) consortium38 to assess individual scan quality (Supplement 1, available online). This pipeline has been implemented in multiple large-scale studies of psychiatric disorders and of typical development.2–5,39–46 We used a well-established fully automated processing pipeline for the analysis of neuroimaging data, because a previous publication showed that mean effect sizes for manually edited regions of interest (ROIs) did not differ from most unedited ROIs.47
Statistical Analyses
Data were analyzed using a mixed-effects regression with lme448 in R.49 For all analyses, family membership (Supplement 2, available online) was included as a random effect and sex was included as a covariate. For regional SA, total SA of the estimated intracranial volume (ICV) was included as a covariate. For subcortical measures, the total estimated ICV was included as a covariate. For CT measures, overall mean CT was included as a covariate. We adjusted for these global measures because there was a significant main effect of group on all global structural MRI (sMRI) measures (Table S2, available online). False discovery rate correction was applied to p values at a .05 level to control for multiple comparisons.50 Equations for all analyses are presented in Supplement 3, available online.
Analysis 1: Group Differences in CT, SA, and Subcortical Volume.
To determine an omnibus main effect across the 4 groups, we examined the overall main effects of group (TD, PS, BP, and PS + BP) for each sMRI measure and included age and the aforementioned variables as covariates. We followed up any significant main effects using the R package lsmeans51 to investigate pairwise comparisons between groups.
Analysis 2: Age-Associated Differences in PS, BP, and/or PS + BP.
First, we examined linear, inverse, and quadratic forms of age within the TD group only. We used the Akaike information criterion, a commonly used measure for model selection,52 to determine the model with the best fit (ie, lowest Akaike information criterion). For each sMRI measure (ie, each ROI examined), the inverse form of age (1/age) was considered the best fit. Second, to determine age-associated differences between groups (PS, BP, PS + BP, TD), we examined an omnibus age-by-group interaction among the 4 groups for each sMRI measure. As in analysis 1, we followed up any significant main effects by conducting pairwise comparisons of the least-squares means in each group (lsmeans51).
For any significant structural abnormalities identified in analysis 1, we conducted an exploratory analysis by binning age groups using methods similar to those previously used to characterize changes in late childhood (10–12 years old), early adolescence (13–15 years old), late adolescence (16–18 years old), and adulthood (19–22 years old). This parsing of groups is consistent with previous developmental publications.53,54 After conducting a linear mixed model at each developmental stage for each region that significantly differed from controls, we estimated the R2 contribution of diagnosis using the R package r2glmm.55
Analysis 3: Effects of Dimensional Measures.
For any sMRI measure that exhibited a significant overall group difference in analysis 1 or 2, we examined relations with dimensional measures of symptoms and functioning, specifically positive symptoms, negative symptoms, neurocognitive factor scores,34 and current global functioning (GAF score). For any statistically significant relations with false discovery rate correction (q = .05), we confirmed that this relation remained present when group status was included as a factor in the model to confirm that the relation was still present once diagnosis status was taken into account. We also confirmed that there was no significant age-by-group interaction with any of the dimensional factors.
RESULTS
Participant information, including mean symptom measures and overall functioning scores, is presented in Table 1. Overall group differences in neurocognitive factor scores and corresponding pairwise contrasts are presented in Table S2, available online.
TABLE 1.
Demographic and Clinical Information for All Cohorts
| TD (n = 376) | BP (n = 117) | BP + PS (n = 109) | PS (n = 113) | ||
|---|---|---|---|---|---|
| Age (y), mean ± SD (range) | 15.1 ± 3.7 (9–22) | 16.8 ± 3.5 (9–22) | 15.9 ± 3.0 (10–22) | 15.0 ± 2.8 (9–22) | p = 1.5e-05, BP > TD, BP > PS |
| Boys/girls (% girls) | 194/182 (48) | 56/61 (52) | 52/57 (52) | 57/56 (50) | p = .84 |
| Positive symptoms, mean (SD) | 2.5 (4.9) | 6.5 (7.2) | 24.5 (14.8) | 18.5 (12.1) | p = 2.2e-16, BP + PS > BP, BP + PS > TD, BP + PS > PS, BP > TD, PS > BP, PS > TD |
| Negative symptoms, mean (SD) | 1.0 (1.4) | 2.1 (2.0) | 4.3 (3.8) | 3.9 (3.7) | p = 2.2e-16, BP + PS > BP, BP + PS > TD, BP > TD, PS > BP, PS > TD |
| Depression symptoms, mean (SD) | 0.4 (1.1) | 4.1 (3.0) | 4.3 (2.9) | 1.2 (2.2) | p = 2.2e-16, BP + PS > TD, BP + PS > PS, BP > TD, BP > PS, PS > TD |
| Mania symptoms, mean (SD) | 0.7 (1.8) | 4.4 (2.8) | 6.0 (2.8) | 2.0 (2.9) | p = 2.2e-16, BP + PS > BP, BP + PS > TD, BP + PS > PS, BP > PS, BP > PS, PS > TD |
| Current global functioning, mean (SD) | 85.0 (8.4) | 76.6 (11.8) | 72.3 (14.0) | 73.8 (11.9) | p = 2.2e-16, TD > BP; BP + PS, PS; BP > BP + PS |
Note:BP = bipolar spectrum youth; BP + PS = bipolar and psychosis spectrum youth; PS = psychosis spectrum youth; TD = typically developing youth.
Global Neuroanatomic Measures
TD youth had significantly larger estimated ICVs (χ2 = 13.4, p = .004) and larger total SA (χ2 = 12.9, p = .005) than all clinical groups (BP, PS, BP + PS). Compared with the other 3 groups, the BP + PS group exhibited significantly decreased overall mean CT (χ2 = 10.5, p = .01; Table S3, Figure S1, available online).
Analysis 1: Decreased SA in Multiple Regions and Decreased Thalamic Volume Are Specific to PS Youth
Compared with all other groups (TD, BP, BP + PS), individuals in the PS group exhibited significantly decreased SA in the lateral orbitofrontal (χ2 = 16.67, p = .0008, q = .02), medial orbitofrontal (χ2 = 17.48, p = .0.0006, q = .02), poster cingulate (χ2 = 13.18, p = .004, q = .05), precentral (χ2 = 20.53, p = .0001, q = .01), and postcentral (χ2 = 13.49, p = . 004, q = .05; Figure 1A–E, Table 2) regions and significantly decreased thalamic volume χ2 = 13.55, p = .004, q = .05; Figure 1F, Table 3). BP + PS youth had a larger medial orbitofrontal SA compared with TD and BP youth (Figure 1B). For all other sMRI measures, there were no significant pairwise differences among the TD, BP, and BP + PS groups (Table 4).
FIGURE 1.
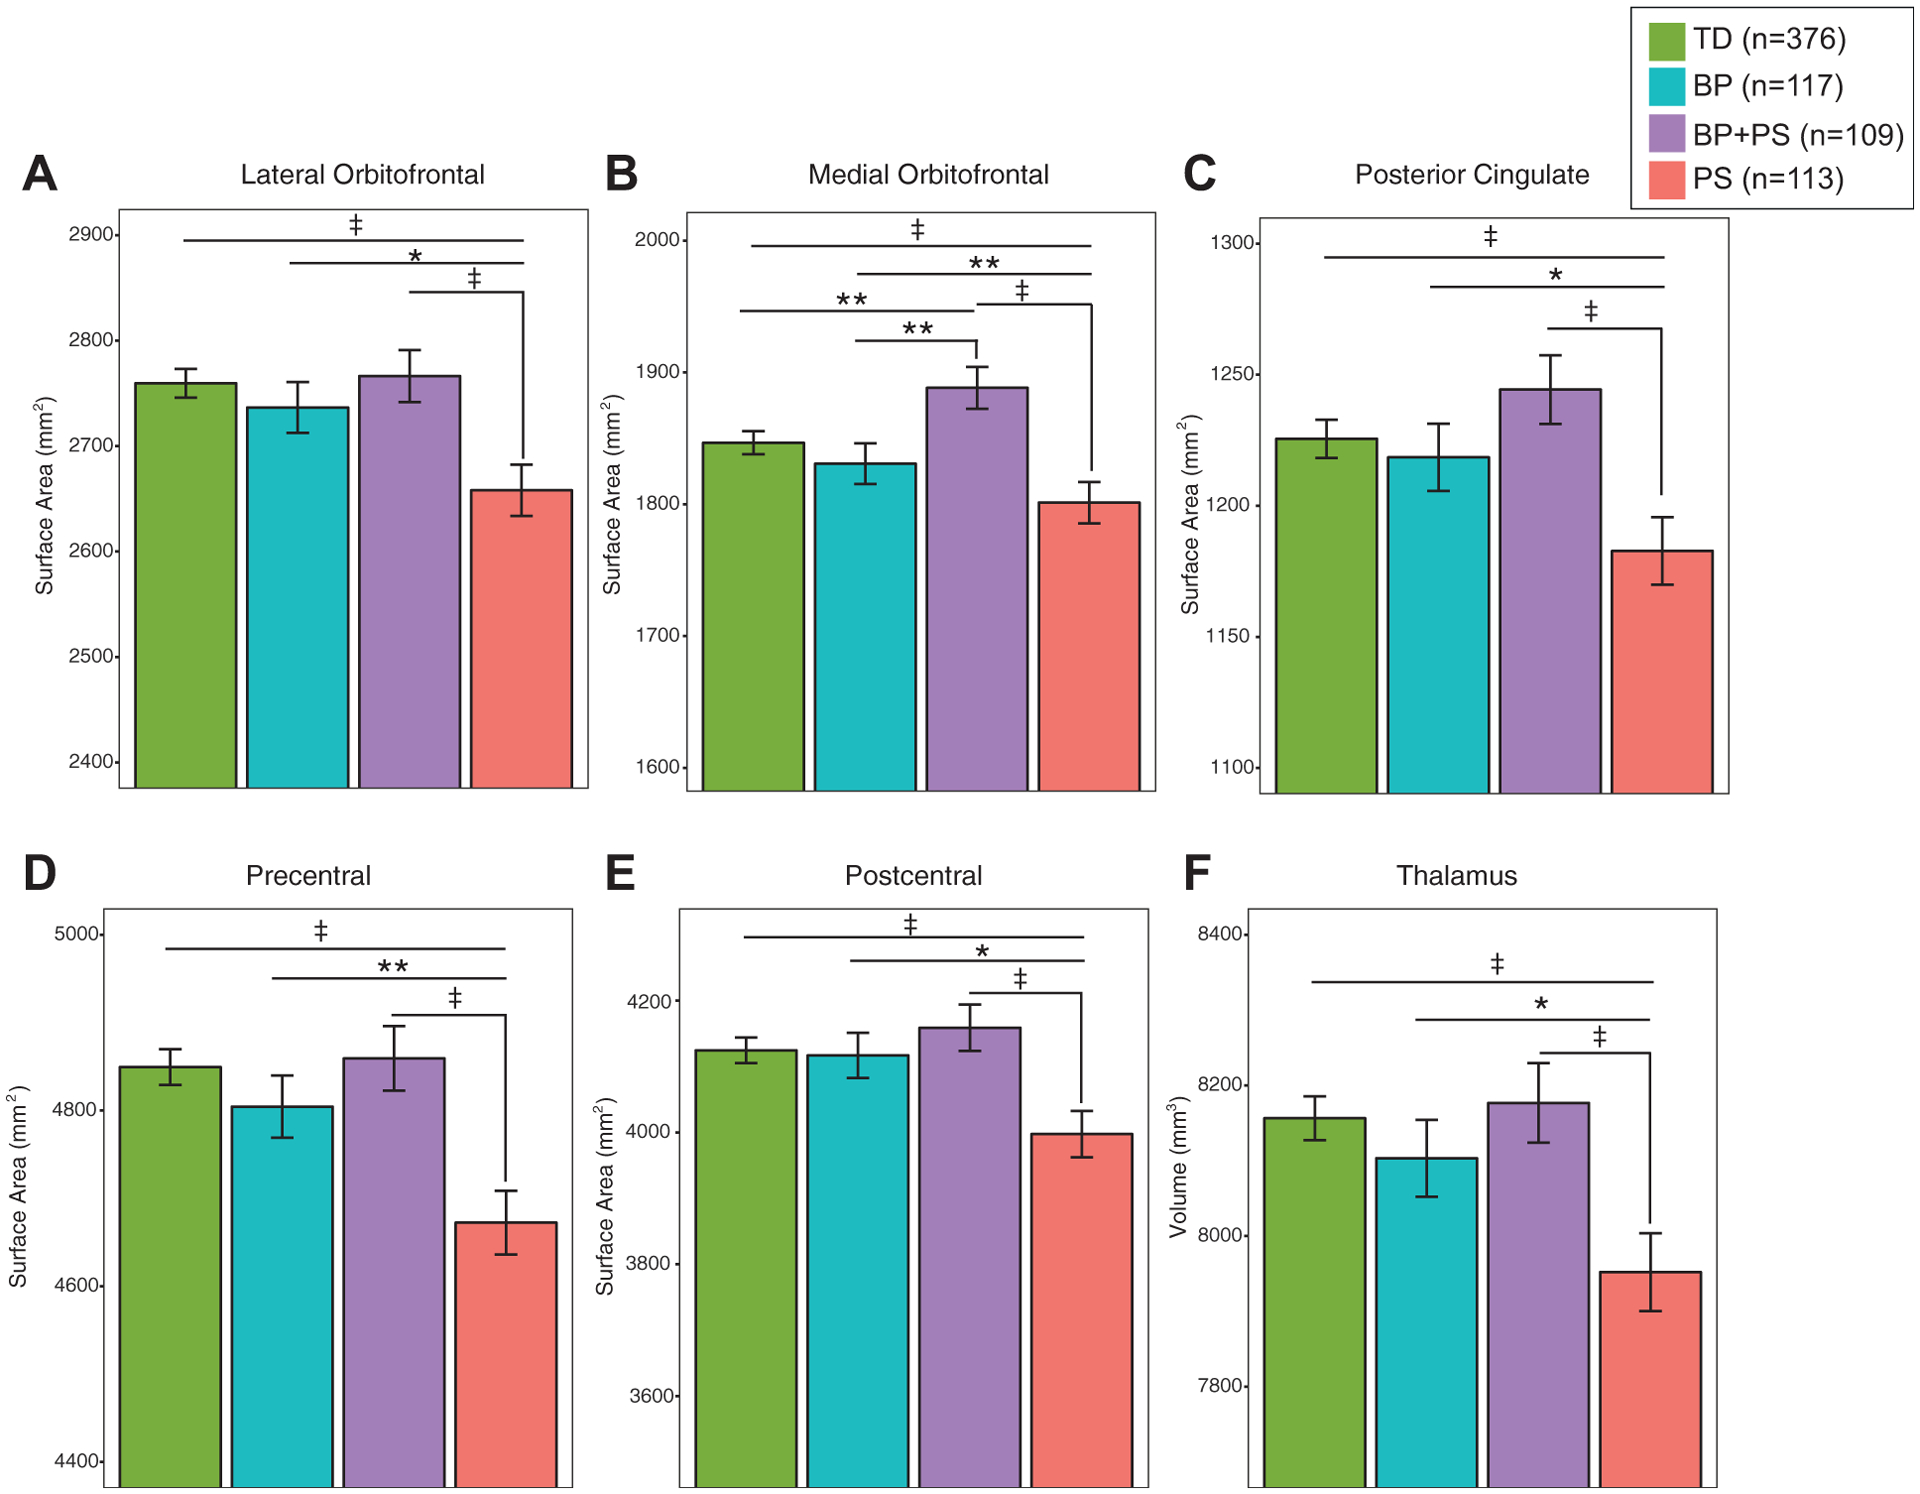
Surface Area Decreases in Psychosis Spectrum (PS) Youth
Note: Psychosis spectrum youth exhibited decreased (A) lateral orbitofrontal, (B) medial orbitofrontal, (C) posterior cingulate, and (D) precentral and (E) postcentral surface areas and (F) thalamic volume compared with typically developing youth (TD), bipolar spectrum youth (BP), and youth with BP and PS.
*p < .05; **p < .01; ‡p < .005.
TABLE 2.
Overall Statistics Examining Main Effect of Group on Cortical Thickness and Surface Area Measures
| Cortical Thickness | Surface Area | |||||
|---|---|---|---|---|---|---|
| Brain Region | χ2 | p | q | χ2 | p | q |
| Banks of superior temporal sulcus | 2.31 | .51 | .69 | 9.80 | .02 | .19 |
| Caudal anterior cingulate | 5.34 | .15 | .38 | 4.77 | .19 | .42 |
| Caudal middle frontal | 6.53 | .09 | .27 | 7.35 | .06 | .26 |
| Cuneus | 4.88 | .18 | .42 | 1.44 | .70 | .83 |
| Entorhinal | 0.59 | .90 | .92 | 2.14 | .54 | .72 |
| Fusiform | 1.65 | .65 | .81 | 6.80 | .08 | .26 |
| Inferior parietal | 4.01 | .26 | .53 | 6.81 | .08 | .26 |
| Inferior temporal | 0.28 | .96 | .96 | 4.18 | .24 | .52 |
| Isthmus cingulate | 0.55 | .91 | .92 | 3.27 | .35 | .53 |
| Lateral occipital | 7.75 | .05 | .26 | 3.42 | .33 | .53 |
| Lateral orbitofrontal | 3.85 | .28 | .53 | 16.67 | .0008 | .02 |
| Lingual | 3.73 | .29 | .53 | 3.27 | .35 | .53 |
| Medial orbitofrontal | 6.57 | .09 | .27 | 17.48 | .0006 | .02 |
| Middle temporal | 0.86 | .83 | .89 | 8.47 | .04 | .25 |
| Parahippocampal | 5.02 | .17 | .41 | 3.32 | .35 | .53 |
| Paracentral | 0.60 | .90 | .92 | 3.25 | .35 | .53 |
| Pars opercularis | 0.88 | .83 | .89 | 6.73 | .08 | .26 |
| Pars orbitalis | 1.95 | .58 | .74 | 7.35 | .06 | .26 |
| Pars triangularis | 1.24 | .74 | .85 | 7.26 | .06 | .26 |
| Peri-calcarine | 2.30 | .51 | .69 | 2.29 | .52 | .69 |
| Postcentral | 9.20 | .03 | .20 | 13.49 | .004 | .05 |
| Posterior cingulate | 2.05 | .56 | .73 | 13.18 | .004 | .05 |
| Precentral | 3.40 | .33 | .53 | 20.53 | .0001 | .01 |
| Precuneus | 3.38 | .34 | .53 | 4.73 | .19 | .42 |
| Rostral anterior cingulate | 2.84 | .42 | .60 | 6.05 | .11 | .32 |
| Rostral middle frontal | 5.50 | .14 | .37 | 5.86 | .12 | .33 |
| Superior frontal | 3.68 | .30 | .53 | 7.54 | .06 | .26 |
| Superior parietal | 1.34 | .72 | .84 | 9.51 | .02 | .19 |
| Superior temporal | 3.92 | .27 | .53 | 3.44 | .33 | .53 |
| Supramarginal | 4.03 | .26 | .53 | 7.06 | .07 | .26 |
| Frontal pole | 2.95 | .40 | .59 | 0.87 | .83 | .89 |
| Temporal pole | 1.15 | .76 | .86 | 1.61 | .66 | .81 |
| Transverse temporal | 3.61 | .31 | .53 | 10.08 | .02 | .19 |
| Insula | 0.61 | .89 | .92 | 7.10 | .07 | .26 |
Note: Boldface type indicates measures that reached statistical significance after correction for multiple comparisons (q < .05). For all measures, 1/age, sex, and family membership were included in the model as covariates. For surface area measures, total surface area was included as an additional covariate. For cortical thickness measures, total mean cortical thickness was included as an additional covariate.
TABLE 3.
Overall Statistics Examining Main Effect of Group on Subcortical Volume Measures
| Subcortical Structure | X2 | p | q |
|---|---|---|---|
| Thalamus | 13.55 | .004 | .05 |
| Caudate | 1.44 | .70 | .75 |
| Putamen | 2.64 | .45 | .53 |
| Pallidum | 1.28 | .73 | .77 |
| Hippocampus | 5.24 | .16 | .27 |
| Amygdala | 7.75 | .05 | .17 |
| Nucleus accumbens | 8.13 | .04 | .15 |
Note: Boldface types indicates measures that reached statistical significance after correction for multiple comparisons (q < .05). For all measures, 1/age, sex, family membership, and total intracranial volume were included in the model as covariates.
TABLE 4.
Pairwise Contrasts Between Groups
| Cortical surface area | Contrast | Z Ratio | p |
|---|---|---|---|
| Lateral orbitofrontal | TD > PS | 3.6 | .0003 |
| BP > PS | 2.3 | .02 | |
| BP + PS > PS | 3.1 | .002 | |
| Medial orbitofrontal | TD > PS | 2.5 | .01 |
| BP + PS > PS | 3.9 | .0001 | |
| BP + PS > BP | 2.6 | .009 | |
| BP + PS > TD | 2.3 | .02 | |
| Posterior cingulate | TD > PS | 2.9 | .004 |
| BP > PS | 2 | .04 | |
| BP + PS > PS | 3.4 | .0007 | |
| Precentral gyrus | TD > PS | 4.3 | .0001 |
| BP > PS | 2.6 | .009 | |
| BP + PS > PS | 3.6 | .0003 | |
| Postcentral gyrus | TD > PS | 3.2 | .002 |
| BP > PS | 2.4 | .02 | |
| BP + PS > PS | 3.2 | .001 | |
| Subcortical volume Thalamus | TD > PS | 3.5 | .0005 |
| BP > PS | 2.1 | .04 | |
| BP + PS > PS | 3 | .002 |
Overall group differences forþall measures without global covariates (ie, overall mean CT, total SA, or estimated ICV) are reported in Tables S4 and S5, available online.
Analysis 2: Structural Differences Are Greatest in Early and Late Adolescence in PS Youth
For all models, inverse age was the best fit (Tables S6 and S7, available online). Consistent with previous publications,56–58 22 of the 34 regions exhibited cortical thinning with increasing age in TD youth (q < .05). In this sample, the largest effect sizes were observed for the cingulate (isthmus and posterior) and temporal (middle and superior) regions. Eighteen of 34 regions exhibited SA changes with age (q < .05). In most of these regions, SA decreased with increasing age. However, SA of the rostral anterior cingulate cortex increased with increasing age in TD youth (q = .01). In subcortical regions, TD youth exhibited increasing thalamic volume with increasing age (q = 2e-6). The caudate, putamen, palladium, and nucleus accumbens decreased in volume with increasing age (q < .05). However, across all groups, no significant age-by-group interaction remained statistically significant for any ROI measure (CT, SA, or subcortical volume) after false discovery rate correction (q > 0.37 for all comparisons; Tables S8 and S9, available online).
Because only the PS group exhibited neuroanatomic differences compared with the TD group, we focused our exploratory analyses on these 2 groups. Within separate developmental stages, we found that the largest estimated effect size for group differences was during early adolescence for precentral (R2 = 0.04) and posterior cingulate (R2 = 0.04) regions, whereas the largest estimated effect sizes for group differences in the thalamus (R2 = 0.09), postcentral (R2 = 0.07), and orbitofrontal (lateral R2 = 0.04, medial R2 = 0.04) regions were during late adolescence (Table S10, available online).
Analysis 3: SA Is Related to Cognition, Functioning, and Clinical Symptoms Across Diagnostic Groups
Better functioning was associated with increased lateral orbitofrontal SA (χ2 = 7.1, p = .008, q = .02; Figure 2A). Higher complex cognition scores were associated with larger precentral SA (χ2 = 19.0, p = 1.0e-5, q = .0001; Figure 2B). Higher executive functioning scale scores were associated with larger postcentral SA (χ2 = 7.1, p = .008, q = .02; Figure 2C), and increased negative symptom severity was associated with decreased postcentral SA (χ2 = 8.0, p = .004, q = .02; Figure 2D). All associations remained statistically significant (q < .05) when group status was included as a factor in the model. There were no statistically significant relations between neuroanatomic measures and positive symptoms of psychosis or mood symptoms (p > .2 for all comparisons).
FIGURE 2.
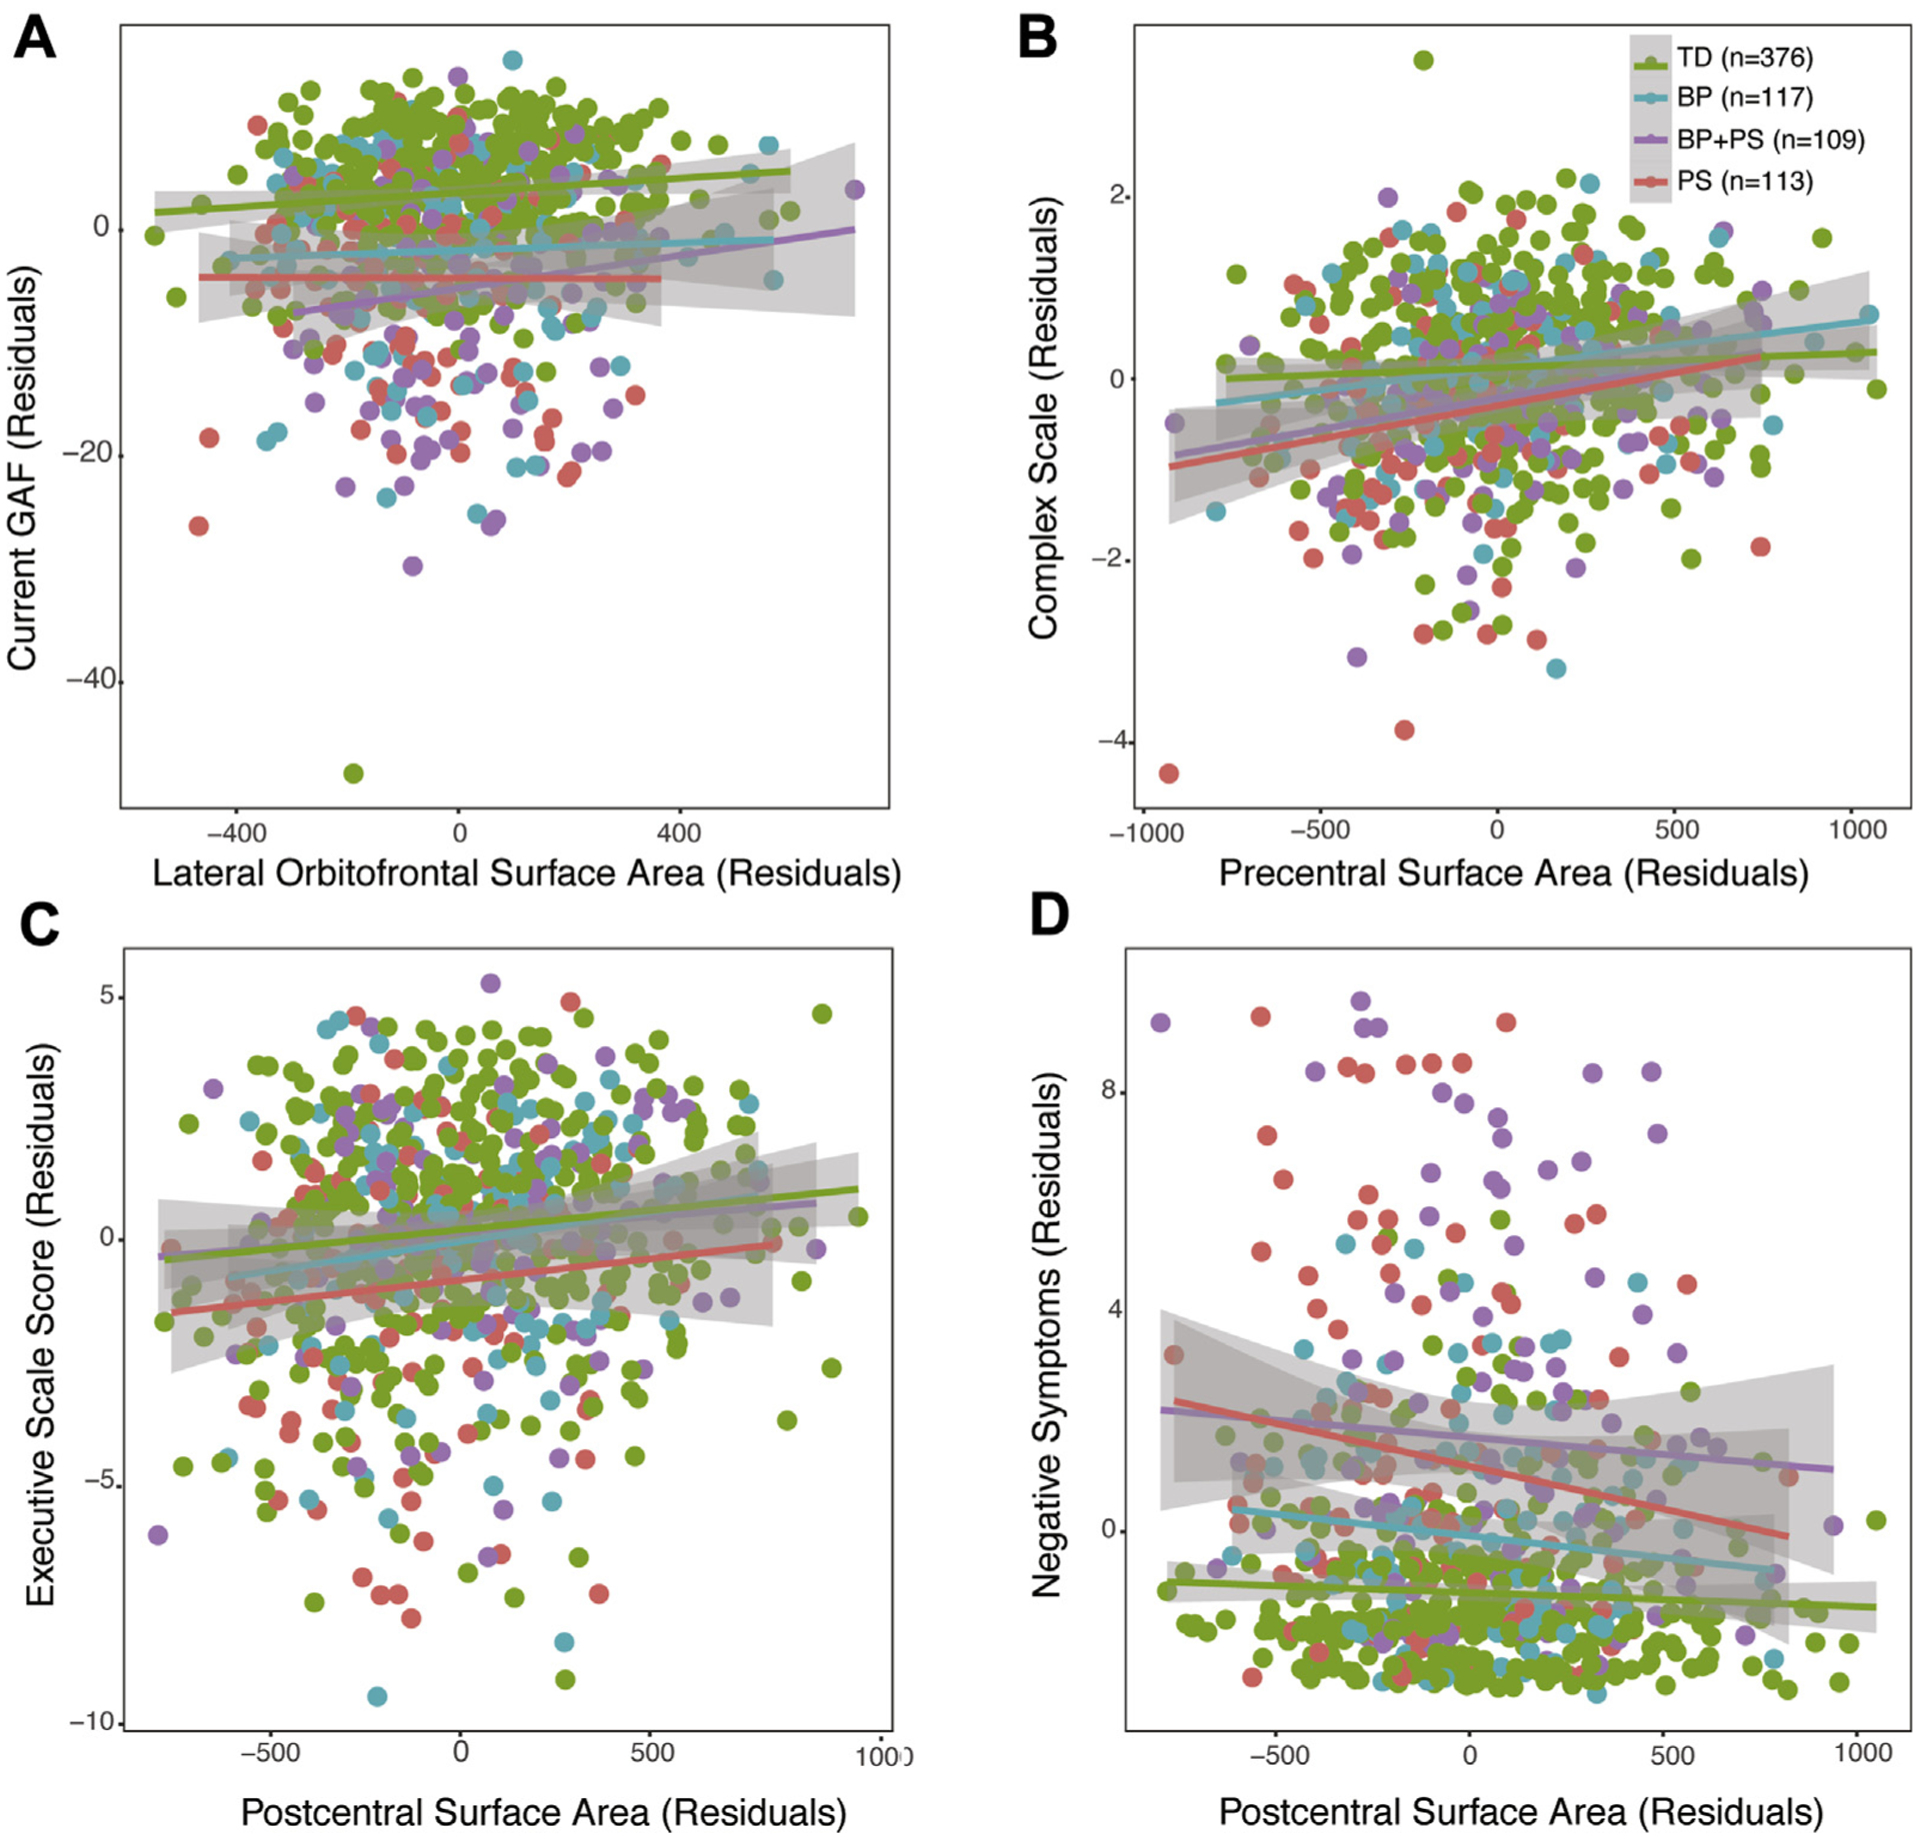
Relations Between Surface Area and Dimensional Measures
Note: Across the entire sample, (A) larger lateral orbitofrontal surface area was associated with higher global functioning scores, (B) larger precentral surface was associated with higher complex cognition scores, (C) larger postcentral surface area was associated with higher executive function scores, and (D) larger postcentral surface area was associated with decreased negative symptoms. BP = bipolar spectrum; GAF = Global Assessment of Functioning; PS = psychosis spectrum; TD = typically developing.
Post hoc analyses showed that all results remained statistically significant when only 1 unique family member was included in the model.
DISCUSSION
The goal of this study was to examine patterns of structural brain aberrations in youth experiencing subclinical symptoms of severe mental illness to help us better understand abnormal developmental processes in distinct brain regions and determine more informative early biomarkers of illness. This analysis showed several novel findings; specifically, in a cross-sectional sample from the PNC, we found that decreased SA in multiple cortical regions (orbitofrontal, posterior cingulate, pre- and postcentral) was specific to PS youth compared with TD youth, BP youth, and youth with BP PS. Among subcortical structures, we found decreasedþvolume specifically in the thalamus in the PS group compared with the other 3 groups. These findings provide support for the growing literature that neuroanatomic alterations are observable across the psychosis spectrum and potentially before the onset of full-blown illness.16,25 Moreover, we found that—across groups—higher overall functioning, less negative symptoms, and better higher-order cognition were associated with increased SA in some of these regions (specifically, lateral orbitofrontal and postcentral regions), providing support for the notion that structural brain abnormalities reflect real-world behavior in youth. These dimensionally measured brain-behavior relations highlight the importance of examining neural changes in a non–help-seeking cohort, because our findings show that these neural differences still have functional consequence, regardless of whether an individual develops a severe mental illness.
Structural Brain Differences Are Present in PS Youth Before Adulthood
Consistent with multiple studies of youth at clinical high risk for developing psychosis,59–61 we found that youth with PS symptoms (without co-occurring BP symptoms) exhibited decreased thalamic volume. Together, these findings suggest that decreased thalamic volumes are present in help-seeking and non–help-seeking youth with PS symptoms. Furthermore, these findings suggest that thalamic decreases, although prominent in schizophrenia,62–64 are not specific to the full-blown disorder and perhaps indicative of the extended psychosis phenotype.
In a prior study examining a larger cohort of PS youth (N = 391), Satterthwaite et al.16 found that PS youth exhibited volumetric decreases in the posterior cingulate, orbitofrontal, and parietal cortices. We extend these findings by showing that the previously observed volumetric decreases in these regions are driven by SA decreases and that they are specific to PS youth who do not have concurrent BP symptoms. By examining separate components of volume (ie, SA and CT), we can better understand the underlying neural dysfunction of PS symptoms. Specifically, converging evidence suggests that cortical SA is determined by the proliferation of radial unit progenitors, which consist of neuroepithelial cells and radial glial cells.65 Thus, the decreased SA observed in the orbitofrontal, precentral, postcentral, and posterior cingulate regions in PS youth could reflect decreased production of radial unit progenitors in these areas of the cortex. Given that, in this sample of TD youth, orbitofrontal SA was not significantly associated with age, which could be indicative of an early insult to brain development. Intriguingly, in youth with PS, SA differences are more circumscribed and not as widespread as in adults with schizophrenia.4,6 Furthermore, the effect sizes for SA when comparing TD with PS youth were stronger (Cohen d range 0.2–0.4) than the effect sizes identified in a recent multisite consortium-wide meta-analysis comparing subjects with schizophrenia with healthy controls (Cohen’s d range 0.05–0.1).4 These results suggest that SA decreases in orbitofrontal, pre- and postcentral, and posterior cingulate regions might reflect the earliest risk markers of severe psychopathology and/or extended psychosis phenotype.
Lack of CT Differences
Inconsistent with studies of adults with established schizophrenia and bipolar disorder diagnoses,4–6,66 we did not identify statistically significant differences in CT in youth with PS, BP, or BP + PS symptoms. The lack of findings could mean that cortical thinning observed in adults with schizophrenia and bipolar disorder reflects neuroanatomic changes that occur after the onset of overt psychiatric illness because of the effects of medications and/or neurotoxic effects of chronic psychiatric illness. Alternatively, the absence of CT decreases in youth with subclinical PS and BP symptomatology could represent a marker of resilience. The lack of CT decreases observed in youth with PS and BP might be due to the highly heterogeneous nature of these “broader spectrum” groups.
Lack of Differences in BP Youth
Surprisingly, we did not observe any neuroanatomic differences between TD youth and BP youth. There are multiple reasons for the lack of differences. Other neuroimaging modalities, such as task-based functional MRI, might be more sensitive to differentiating those with BP symptoms from those without. For example, using a whole-brain pattern analysis of task-based working memory functional MRI data, researchers differentiated individuals with bipolar disorder from relatives with major depressive disorder or no psychopathology with high specificity and accuracy.67 Another study found that, during an affective labeling task, youth at high risk for developing bipolar disorder and youth with a bipolar disorder diagnosis exhibited decreased activation in the inferior and middle temporal gyrus but increased activation in the dorsolateral prefrontal cortex.68 Because the PNC has several task-based imaging studies, including working memory and emotion recognition tasks, it might be a useful endeavor to examine potential neural abnormalities in BP youth compared with TD and/or PS youth.
Of note, in addition to the criteria that we used to define the BP groups, 2 studies focusing on high-risk youth with a first-degree relative with bipolar disorder reported that the presence of externalizing symptoms, anxiety, and mood lability were significant predictors of the development of bipolar disorder.27,28 However, we did not include these as criteria for the BP group because these factors are not specific to bipolar outcome.29,30 Future prospective studies of BP youth might want to test the effect of including these variables as part of the BP criteria in population-based samples.
Unexpected Patterns Observed in PS + BP Youth
Unexpectedly, we found structural differences in youth with PS symptoms, but not in those with BP + PS symptoms. One proposed hypothesis is that the combination of mood and psychotic symptoms is associated with different underlying neurobiological mechanisms.69 Is the experience of PS symptoms within the context of BP symptoms different than PS symptoms on their own, without prominent mood abnormalities? Intriguingly, individuals with mood and psychotic symptoms have higher levels of functioning and better long-term outcome than those with schizophrenia, although these individuals are still impaired compared with healthy controls.70,71 In this sample, we found that BP + PS youth and PS youth had similar levels of global functioning. Thus, these groups are not functioning well but show different biological patterns, suggesting that there might be different mechanisms driving this impairment.
Developmental Implications
The age-associated cortical thinning observed in the TD group in this sample is consistent with previous longitudinal and cross-sectional studies of structural brain development during adolescence.56–58,72 However, it is important to note that other longitudinal studies have identified different developmental trajectories of CT, including, nonlinear CT changes from late childhood adolescence into adulthood.72–74 Given that we studied a cross-sectional sample of TD youth, the ability to detect nonlinear changes in structural brain development is limited. Importantly, there is work showing that, in a broader sample of PNC youth, implementation of general additive models identified nonlinear age-associated changes in a few discrete brain regions.72 However, this publication included youth who would have been included in our PS, BP, or BP + PS groups. Given the importance of nonlinear developmental changes in structural brain development, it will be important for future investigations to bring together multiple samples of TD youth and use MRI harmonization methods to account for site effects75,76 to allow for a more fine-grained analysis of age-associated disruption in youth at risk for and with psychiatric disorders.
In addition to identifying specific structural alterations in PS youth, we observed preliminary evidence that the strongest effect sizes for group differences between TD youth and PS youth occurred during early and late adolescence. In regions that exhibited significant age-associated changes in typical development (thalamic volume, posterior cingulate and postcentral SA), the period of early and late adolescence could be a particularly plastic or vulnerable stage in which an at-risk youth could “fall off” the normative developmental trajectory and be at greater risk for developing a psychiatric illness. Alternatively, these findings could be attributable to distinct developmental brain alterations, depending on the age at which one first begins to experience psychotic symptoms. It is important to note that this is an initial descriptive analysis. Longitudinal studies of PS youth are necessary to probe these intriguing hypotheses. Growth charts, typically used as references for early identification of atypical development for metrics such weight and head circumference,77 have recently been extended to assess how psychiatric disorders are related to deviations from normative development.26,78 In the future, multisite sample characterization of typical structural neurodevelopment will provide a template to further assess abnormal development of brain function in those with PS.
Brain-Behavior Relations
We found that larger lateral orbitofrontal SA is related to global functioning across groups. Functions associated with the lateral orbitofrontal cortex include evaluating possible outcomes based on contingencies and suppressing goal-irrelevant information to enable decision making or action.79–82 It is plausible that lateral orbitofrontal structural aberrations contribute to impaired decision making, affecting one’s overall functioning. There is a wealth of evidence examining decision making in adults with an established diagnosis of schizophrenia and bipolar disorder83–88; however, the nature and extent of the relation between brain maturation and the development of decision making in youth, and across the broader psychosis spectrum, has yet to be explored. We also found that increased SA in the postcentral gyrus was associated with less severe negative symptoms and better executive cognition. The presence of this relation suggests that decreased postcentral SA is a common underlying neural mechanism that contributes to cognitive functioning and negative symptoms. Furthermore, because these relations were identified in the entire sample, these findings suggest that structural alterations in the postcentral region could be an important area for further study of trans-diagnostic brain-behavior relations.
This study was not without limitations. Importantly, we could not examine within-subject change over time in this cross-sectional sample. Furthermore, despite the large overall sample, the number of individuals within each discrete developmental stage was more limited, particularly in the youngest and oldest groups. Although age-associated changes can be small, albeit meaningful, continued development of methods for combining data from different sites and scanners is warranted to fully map developmental changes in brain structure and function and their relevance to emerging psychiatric disorders. Furthermore, because we used data from a publicly available source, we were limited by the provided data. Data on socioeconomic status and/or family history of a psychiatric disorder were unavailable, 2 variables that significantly contribute to increased risk for psychiatric disorders89–91 and should be examined in future studies examining adolescent neurodevelopment and BP and PS phenotyping. Because the focus of the original PNC study was on psychosis risk, there was more detailed phenotyping on clinical symptoms associated with psychosis. Given the high overlap in genetics, neurobiology, and symptomatology in psychosis and bipolar disorder, future studies should incorporate semistructured interviews that assist with identifying precursors to bipolar disorder (eg, Bipolar Prodrome Symptom Interview92).
By examining a population-based, non–help-seeking sample, we could rule out possible confounds, such as illness chronicity and medication use; however, at the same time, we do not know whether youth exhibiting PS and/or BP symptoms are destined to develop a full-blown major mental illness. However, the presence of subthreshold psychotic experiences (ie, hallucinatory and delusional experiences) increases the likelihood that one will develop subsequent psychopathology.93–95 Furthermore, although most help-seeking youth deemed at risk for psychosis do not go on to develop overt psychosis, many continue to experience significant occupational and social impairment.96,97 Thus, we could be tapping into an identification of a cohort at risk for general psychopathology. These sorts of questions can only be answered with long-term follow-up of participants as they mature.
Taken together, our results provide compelling novel evidence for structural brain differences specific to PS youth in adolescent neurodevelopment. These findings suggest potential biological distinctions between PS and BP conditions, which could suggest additional biomarkers relevant to early identification. In future studies, data-driven factor analytic approaches.15,98 could provide an alternative approach to investigating neurobiological associations with cognition and behavior in adolescent neuroimaging cohorts. Future longitudinal studies focusing on typical “neurodevelopmental growth charts” and the extent and specific developmental periods during which youth at risk for serious mental illnesses deviate from these trajectories78 are necessary to address many remaining questions regarding brain alterations relevant to emergent psychopathology in vulnerable youth.
Supplementary Material
Acknowledgments
This project was funded by the following funding sources from the National Institute of Mental Health: R01 MH107250, Genetic Risk for Developmental Expression of Neuropsychiatric Intermediate Traits (Drs. Bearden and Ophoff, University of California, Los Angeles); K01 MH112774, Neurodevelopmental Variation of Intrinsic Functional Connectivity and Its Relationship to Psychosis Risk and Gene Expression (Dr. Jalbrzikowski, University of Pittsburgh); RC2 MH089983, Neurodevelopmental Genomics: Trajectories of Complex Pheno-types (Dr. Gur, University of Pennsylvania); K99 MH116115, Accelerating the Diagnosis of Bipolar Disorder Using Genetic and Phenotypic Signatures (Dr. Olde Loohuis, University of California, Los Angeles).
The authors thank the participants and their families who participated in the study.
Footnotes
This study was presented at the International Congress on Schizophrenia Research Meeting; San Diego, CA; March 24e28, 2017.
Disclosure: Drs. Jalbrzikowski, Freedman, Hegarty, Mennigen, Karlsgodt, Olde Loohuis, Ophoff, Gur, and Bearden report no biomedical financial interests or potential conflicts of interest.
REFERENCES
- 1.Paus T, Keshavan M, Giedd JN. Why do many psychiatric disorders emerge during adolescence? Nat Rev Neurosci. 2008;9:947–957. [DOI] [PMC free article] [PubMed] [Google Scholar]
- 2.van Erp TGM, Hibar DP, Rasmussen JM, et al. Subcortical brain volume abnormalities in 2028 individuals with schizophrenia and 2540 healthy controls via the ENIGMA consortium. Mol Psychiatry. 2016;21:547–553. [DOI] [PMC free article] [PubMed] [Google Scholar]
- 3.Hibar DP, Westlye LT, van Erp TGM, et al. Subcortical volumetric abnormalities in bipolar disorder. Mol Psychiatry. 2016;21:1710–1716. [DOI] [PMC free article] [PubMed] [Google Scholar]
- 4.van Erp TGM, Walton E, Hibar DP, et al. Cortical brain abnormalities in 4474 individuals with schizophrenia and 5098 control subjects via the Enhancing Neuro Imaging Genetics Through Meta Analysis (ENIGMA) Consortium. Biol Psychiatry. 2018; 84:644–654. [DOI] [PMC free article] [PubMed] [Google Scholar]
- 5.Hibar DP, Westlye LT, Doan NT, et al. Cortical abnormalities in bipolar disorder: an MRI analysis of 6503 individuals from the ENIGMA Bipolar Disorder Working Group. Mol Psychiatry. 2018;23:932–942. [DOI] [PMC free article] [PubMed] [Google Scholar]
- 6.Rimol LM, Hartberg CB, Nesvag R, et al. Cortical thickness and subcortical volumes in schizophrenia and bipolar disorder. Biol Psychiatry. 2010;68:41–50. [DOI] [PubMed] [Google Scholar]
- 7.Sugihara G, Oishi N, Son S, Kubota M, Takahashi H, Murai T. Distinct patterns of cerebral cortical thinning in schizophrenia: a neuroimaging data-driven approach. Schizophr Bull. 2017;43:900–906. [DOI] [PMC free article] [PubMed] [Google Scholar]
- 8.Winkler AM, Kochunov P, Blangero J, et al. Cortical thickness or grey matter volume? The importance of selecting the phenotype for imaging genetics studies. Neuroimage. 2010;53:1135–1146. [DOI] [PMC free article] [PubMed] [Google Scholar]
- 9.Panizzon MS, Fennema-Notestine C, Eyler LT, et al. Distinct genetic influences on cortical surface area and cortical thickness. Cereb Cortex. 2009;19: 2728–2735. [DOI] [PMC free article] [PubMed] [Google Scholar]
- 10.Rakic P Specification of cerebral cortical areas. Science. 1988;241:170–176. [DOI] [PubMed] [Google Scholar]
- 11.Network and Pathway Analysis Subgroup of Psychiatric Genomics Consortium. Psychiatric genome-wide association study analyses implicate neuronal, immune and histone pathways. Nat Neurosci. 2015;18:199–209. [DOI] [PMC free article] [PubMed] [Google Scholar]
- 12.Wang T, Zhang X, Li A, et al. Polygenic risk for five psychiatric disorders and cross-disorder and disorder-specific neural connectivity in two independent populations. Neuroimage Clin. 2017;14:441–449. [DOI] [PMC free article] [PubMed] [Google Scholar]
- 13.Muneer A Mixed states in bipolar disorder: etiology, pathogenesis and treatment. Chonnam Med J. 2017;53:1–13. [DOI] [PMC free article] [PubMed] [Google Scholar]
- 14.Satterthwaite TD, Elliott MA, Ruparel K, et al. Neuroimaging of the Philadelphia Neurodevelopmental Cohort. Neuroimage. 2014;86:544–553. [DOI] [PMC free article] [PubMed] [Google Scholar]
- 15.Calkins ME, Merikangas KR, Moore TM, et al. The Philadelphia Neurodevelopmental Cohort: constructing a deep phenotyping collaborative. J Child Psychol Psychiatry. 2015;56:1356–1369. [DOI] [PMC free article] [PubMed] [Google Scholar]
- 16.Satterthwaite TD, Wolf DH, Calkins ME, et al. Structural brain abnormalities in youth with psychosis spectrum symptoms. JAMA Psychiatry. 2016;73:515–524. [DOI] [PMC free article] [PubMed] [Google Scholar]
- 17.Jacobson S, Kelleher I, Harley M, et al. Structural and functional brain correlates of subclinical psychotic symptoms in 11–13 year old schoolchildren. Neuroimage. 2010;49: 1875–1885. [DOI] [PubMed] [Google Scholar]
- 18.Cannon TD, Chung Y, He G, et al. Progressive reduction in cortical thickness as psychosis develops—a multisite longitudinal neuroimaging study of youth at elevated clinical risk. Biol Psychiatry. 2015;77:147–157. [DOI] [PMC free article] [PubMed] [Google Scholar]
- 19.Lyall AE, Shi F, Geng X, et al. Dynamic development of regional cortical thickness and surface area in early childhood. Cereb Cortex. 2015;25:2204–2212. [DOI] [PMC free article] [PubMed] [Google Scholar]
- 20.Calkins ME, Moore TM, Merikangas KR, et al. The psychosis spectrum in a young U.S. community sample: findings from the Philadelphia Neurodevelopmental Cohort. World Psychiatry. 2014;13:296–305. [DOI] [PMC free article] [PubMed] [Google Scholar]
- 21.Kaufman J, Birmaher B, Brent D, et al. Schedule for Affective Disorders and Schizophrenia for School-Age Children—Present and Lifetime Version (K-SADS-PL): initial reliability and validity data. J Am Acad Child Adolesc Psychiatry. 1997;36: 980–988. [DOI] [PubMed] [Google Scholar]
- 22.Miller TJ, McGlashan TH, Rosen JL, et al. Prodromal assessment with the structured interview for prodromal syndromes and the scale of prodromal symptoms: predictive validity, interrater reliability, and training to reliability. Schizophr Bull. 2003;29:703. [DOI] [PubMed] [Google Scholar]
- 23.Kobayashi H, Nemoto T, Koshikawa H, et al. A self-reported instrument for prodromal symptoms of psychosis: testing the clinical validity of the PRIME Screen—Revised (PSR) in a Japanese population. Schizophr Res. 2008;106:356–362. [DOI] [PubMed] [Google Scholar]
- 24.Calkins ME, Moore TM, Satterthwaite TD, et al. Persistence of psychosis spectrum symptoms in the Philadelphia Neurodevelopmental Cohort: a prospective two-year follow-up. World Psychiatry. 2017;16:62–76. [DOI] [PMC free article] [PubMed] [Google Scholar]
- 25.Wolf DH, Satterthwaite TD, Calkins ME, et al. Functional neuroimaging abnormalities in youth with psychosis spectrum symptoms. JAMA Psychiatry. 2015;72:456–465. [DOI] [PMC free article] [PubMed] [Google Scholar]
- 26.Gur RC, Calkins ME, Satterthwaite TD, et al. Neurocognitive growth charting in psychosis spectrum youths. JAMA Psychiatry. 2014;71:366–374. [DOI] [PubMed] [Google Scholar]
- 27.Hafeman DM, Merranko J, Goldstein TR, et al. Assessment of a person-level risk calculator to predict new-onset bipolar spectrum disorder in youth at familial risk. JAMA Psychiatry. 2017;74:841–847. [DOI] [PMC free article] [PubMed] [Google Scholar]
- 28.Hafeman DM, Merranko J, Axelson D, et al. Toward the definition of a bipolar prodrome: dimensional predictors of bipolar spectrum disorders in at-risk youths. Am J Psychiatry. 2016;173:695–704. [DOI] [PMC free article] [PubMed] [Google Scholar]
- 29.Van Meter AR, Burke C, Youngstrom EA, Faedda GL, Correll CU. The bipolar prodrome: meta-analysis of symptom prevalence prior to initial or recurrent mood episodes. J Am Acad Child Adolesc Psychiatry. 2016;55:543–555. [DOI] [PubMed] [Google Scholar]
- 30.Faedda GL, Marangoni C, Serra G, et al. Precursors of bipolar disorders: a systematic literature review of prospective studies. J Clin Psychiatry. 2015;76:614–624. [DOI] [PubMed] [Google Scholar]
- 31.Fava GA, Kellner R. Prodromal symptoms in affective disorders. Am J Psychiatry. 1991; 148:823–830. [DOI] [PubMed] [Google Scholar]
- 32.Geoffroy PA, Scott J. Prodrome or risk syndrome: what’s in a name? Int J Bipolar Disord. 2017;5:7. [DOI] [PMC free article] [PubMed] [Google Scholar]
- 33.Castillo RJ, Carlat DJ, Millon T, et al. Diagnostic and Statistical Manual of Mental Disorders. Washington, DC: American Psychiatric Association Press; 2007. [Google Scholar]
- 34.Moore TM, Reise SP, Gur RE, Hakonarson H, Gur RC. Psychometric properties of the Penn Computerized Neurocognitive Battery. Neuropsychology. 2015;29:235–246. [DOI] [PMC free article] [PubMed] [Google Scholar]
- 35.Dale AM, Fischl B, Sereno MI. Cortical surface-based analysis. I. Segmentation and surface reconstruction. Neuroimage. 1999;9:179–194. [DOI] [PubMed] [Google Scholar]
- 36.Fischl B, Sereno MI, Dale AM. Cortical surface-based analysis. II: Inflation, flattening, and a surface-based coordinate system. Neuroimage. 1999;9:195–207. [DOI] [PubMed] [Google Scholar]
- 37.Desikan RS, Segonne F, Fischl B, et al. An automated labeling system for subdividing the human cerebral cortex on MRI scans into gyral based regions of interest. Neuroimage. 2006;31:968–980. [DOI] [PubMed] [Google Scholar]
- 38.Thompson PM, Stein JL, Medland SE, et al. The ENIGMA Consortium: large-scale collaborative analyses of neuroimaging and genetic data. Brain Imaging Behav. 2014;8: 153–182. [DOI] [PMC free article] [PubMed] [Google Scholar]
- 39.van Rooij D, Anagnostou E, Arango C, et al. Cortical and subcortical brain morphometry differences between patients with autism spectrum disorder and healthy individuals across the lifespan: results from the ENIGMA ASD Working Group. Am J Psychiatry. 2018; 175:359–369. [DOI] [PMC free article] [PubMed] [Google Scholar]
- 40.Hoogman M, Bralten J, Hibar DP, et al. Subcortical brain volume differences in participants with attention deficit hyperactivity disorder in children and adults: a cross-sectional mega-analysis. Lancet Psychiatry. 2017;4:310–319. [DOI] [PMC free article] [PubMed] [Google Scholar]
- 41.Sun D, Ching CRK, Lin A et al. Large-scale mapping of cortical alterations in 22q11.2 deletion syndrome: convergence with idiopathic psychosis and effects of deletion size [published online ahead of print June 2018]. Mol Psychiatry 10.1038/s41380-018-0078-5. [DOI] [PMC free article] [PubMed] [Google Scholar]
- 42.Kong X-Z, Mathias SR, Guadalupe T, et al. Mapping cortical brain asymmetry in 17,141 healthy individuals worldwide via the ENIGMA Consortium. Proc Natl Acad Sci U S A. 2018;115:E5154–E5163. [DOI] [PMC free article] [PubMed] [Google Scholar]
- 43.Boedhoe PSW, Schmaal L, Abe Y, et al. Cortical abnormalities associated with pediatric and adult obsessive-compulsive disorder: findings from the ENIGMA Obsessive-Compulsive Disorder Working Group. Am J Psychiatry. 2018;175:453–462. [DOI] [PMC free article] [PubMed] [Google Scholar]
- 44.Schmaal L, Veltman DJ, van Erp TGM, et al. Subcortical brain alterations in major depressive disorder: findings from the ENIGMA Major Depressive Disorder working group. Mol Psychiatry. 2016;21:806–812. [DOI] [PMC free article] [PubMed] [Google Scholar]
- 45.Whelan CD, Altmann A, Bot ıa JA, et al. Structural brain abnormalities in the common epilepsies assessed in a worldwide ENIGMA study. Brain. 2018;141:391–408. [DOI] [PMC free article] [PubMed] [Google Scholar]
- 46.Nunes A, Schnack HG, Ching CRK et al. Using structural MRI to identify bipolar disorders—13 site machine learning study in 3020 individuals from the ENIGMA Bipolar Disorders Working Group [published online ahead of print August 2018]. Mol Psychiatry. doi: 10.1038/s41380-018-0228-9 [DOI] [PMC free article] [PubMed] [Google Scholar]
- 47.McCarthy CS, Ramprashad A, Thompson C, Botti J-A, Coman IL, Kates WR. A comparison of FreeSurfer-generated data with and without manual intervention. Front Neurosci. 2015;9:109. [DOI] [PMC free article] [PubMed] [Google Scholar]
- 48.Bates D, Mächler M, Bolker B, Walker S. Fitting linear mixed-effects models using lme4. J Stat Softw. 2015;67:1–48; https://www.jstatsoft.org/article/view/v067i01. Accessed August 1, 2018. [Google Scholar]
- 49.R Core Team. R: A Language and Environment for Statistical Computing; https://www.R-project.org/. Published 2018. Accessed August 1, 2018.
- 50.Benjamini Y, Hochberg Y. Controlling the false discovery rate: a practical and powerful approach to multiple testing. J R Stat Soc Series B Stat Methodol. 1995;289–300. [Google Scholar]
- 51.Lenth RV. Least-squares means: the R Package lsmeans. J Stat Softw. 2016;69:1–33; https://www.jstatsoft.org/article/view/v069i01. Accessed August 1, 2018. [Google Scholar]
- 52.Akaike H A new look at the statistical model identification In: Parzen E, Tanabe K, Kitagawa G, eds. Selected Papers of Hirotugu Akaike. New York, NY: Springer New York; 1998:215–222. [Google Scholar]
- 53.Marek S, Hwang K, Foran W, Hallquist MN, Luna B. The contribution of network organization and integration to the development of cognitive control. PLoS Biol. 2015; 13:e1002328. [DOI] [PMC free article] [PubMed] [Google Scholar]
- 54.Luna B, Garver KE, Urban TA, Lazar NA, Sweeney JA. Maturation of cognitive processes from late childhood to adulthood. Child Dev. 2004;75:1357–1372. [DOI] [PubMed] [Google Scholar]
- 55.Jaeger B r2glmm: Computes R Squared for Mixed (Multilevel) Models. 2017; https://CRAN.R-project.org/package=r2glmm. Accessed August 10, 2018.
- 56.Raznahan A, Lerch JP, Lee N, et al. Patterns of coordinated anatomical change in human cortical development: a longitudinal neuroimaging study of maturational coupling. Neuron. 2011;72:873–884. [DOI] [PMC free article] [PubMed] [Google Scholar]
- 57.Tamnes CK, Østby Y, Fjell AM, Westlye LT, Due-Tønnessen P, Walhovd KB. Brain maturation in adolescence and young adulthood: regional age-related changes in cortical thickness and white matter volume and microstructure. Cereb Cortex. 2010;20:534–548. [DOI] [PubMed] [Google Scholar]
- 58.Wierenga LM, Langen M, Oranje B, Durston S. Unique developmental trajectories of cortical thickness and surface area. Neuroimage. 2014;87:120–126. [DOI] [PubMed] [Google Scholar]
- 59.Harrisberger F, Buechler R, Smieskova R, et al. Alterations in the hippocampus and thalamus in individuals at high risk for psychosis. NPJ Schizophr. 2016;2:16033. [DOI] [PMC free article] [PubMed] [Google Scholar]
- 60.Fusar-Poli P, Borgwardt S, Crescini A, et al. Neuroanatomy of vulnerability to psychosis: a voxel-based meta-analysis. Neurosci Biobehav Rev. 2011;35:1175–1185. [DOI] [PubMed] [Google Scholar]
- 61.Fusar-Poli P Voxel-wise meta-analysis of fMRI studies in patients at clinical high risk for psychosis. J Psychiatry Neurosci. 2012;37:106–112. [DOI] [PMC free article] [PubMed] [Google Scholar]
- 62.Adriano F, Spoletini I, Caltagirone C, Spalletta G. Updated meta-analyses reveal thalamus volume reduction in patients with first-episode and chronic schizophrenia. Schizophr Res. 2010;123:1–14. [DOI] [PubMed] [Google Scholar]
- 63.Haijma SV, Van Haren N, Cahn W, Koolschijn PCMP, Hulshoff Pol HE, Kahn RS. Brain volumes in schizophrenia: a meta-analysis in over 18 000 subjects. Schizophr Bull. 2013;39:1129–1138. [DOI] [PMC free article] [PubMed] [Google Scholar]
- 64.Harms MP, Wang L, Mamah D, Barch DM, Thompson PA, Csernansky JG. Thalamic shape abnormalities in individuals with schizophrenia and their nonpsychotic siblings. J Neurosci. 2007;27:13835–13842. [DOI] [PMC free article] [PubMed] [Google Scholar]
- 65.Pontious A, Kowalczyk T, Englund C, Hevner RF. Role of intermediate progenitor cells in cerebral cortex development. Dev Neurosci. 2008;30:24–32. [DOI] [PubMed] [Google Scholar]
- 66.Rimol LM, Nesvåg R, Hagler DJ Jr, et al. Cortical volume, surface area, and thickness in schizophrenia and bipolar disorder. Biol Psychiatry. 2012;71:552–560. [DOI] [PubMed] [Google Scholar]
- 67.Frangou S, Dima D, Jogia J. Towards person-centered neuroimaging markers for resilience and vulnerability in Bipolar Disorder. Neuroimage. 2017;145(Pt B):230–237. [DOI] [PMC free article] [PubMed] [Google Scholar]
- 68.Wiggins JL, Brotman MA, Adleman NE, et al. Neural markers in pediatric bipolar disorder and familial risk for bipolar disorder. J Am Acad Child Adolesc Psychiatry. 2017; 56:67–78. [DOI] [PMC free article] [PubMed] [Google Scholar]
- 69.Frangou S A systems neuroscience perspective of schizophrenia and bipolar disorder. Schizophr Bull. 2014;40:523–531. [DOI] [PMC free article] [PubMed] [Google Scholar]
- 70.Harrow M, Grossman LS, Herbener ES, Davies EW. Ten-year outcome: patients with schizoaffective disorders, schizophrenia, affective disorders and mood-incongruent psychotic symptoms. Br J Psychiatry. 2000;177:421–426. [DOI] [PubMed] [Google Scholar]
- 71.Tsuang MT, Michael Dempsey G. Long-term outcome of major psychoses: II. Schizo-affective disorder compared with schizophrenia, affective disorders, and a surgical control group. Arch Gen Psychiatry. 1979;36:1302–1304. [DOI] [PubMed] [Google Scholar]
- 72.Vandekar SN, Shinohara RT, Raznahan A, et al. Topologically dissociable patterns of development of the human cerebral cortex. J Neurosci. 2015;35:599–609. [DOI] [PMC free article] [PubMed] [Google Scholar]
- 73.Vijayakumar N, Allen NB, Youssef G, et al. Brain development during adolescence: a mixed-longitudinal investigation of cortical thickness, surface area, and volume. Hum Brain Mapp. 2016;37:2027–2038. [DOI] [PMC free article] [PubMed] [Google Scholar]
- 74.Tamnes CK, Herting MM, Goddings A-L, et al. Development of the cerebral cortex across adolescence: a multisample study of inter-related longitudinal changes in cortical volume, surface area, and thickness. J Neurosci. 2017;37:3402–3412. [DOI] [PMC free article] [PubMed] [Google Scholar]
- 75.Fortin J-P, Cullen N, Sheline YI, et al. Harmonization of cortical thickness measurements across scanners and sites. Neuroimage. 2018;167:104–120. [DOI] [PMC free article] [PubMed] [Google Scholar]
- 76.Fortin J-P, Parker D, Tunç B, et al. Harmonization of multi-site diffusion tensor imaging data. Neuroimage. 2017;161:149–170. [DOI] [PMC free article] [PubMed] [Google Scholar]
- 77.Cole TJ. The development of growth references and growth charts. Ann Hum Biol. 2012;39:382–394. [DOI] [PMC free article] [PubMed] [Google Scholar]
- 78.Kessler D, Angstadt M, Sripada C. Growth charting of brain connectivity networks and the identification of attention impairment in youth. JAMA Psychiatry. 2016;73: 481–489. [DOI] [PMC free article] [PubMed] [Google Scholar]
- 79.Elliott R, Dolan RJ, Frith CD. Dissociable functions in the medial and lateral orbitofrontal cortex: evidence from human neuroimaging studies. Cereb Cortex. 2000;10: 308–317. [DOI] [PubMed] [Google Scholar]
- 80.O’Doherty J, Kringelbach ML, Rolls ET, Hornak J, Andrews C. Abstract reward and punishment representations in the human orbitofrontal cortex. Nat Neurosci. 2001;4:95. [DOI] [PubMed] [Google Scholar]
- 81.O’Doherty J, Critchley H, Deichmann R, Dolan RJ. Dissociating valence of outcome from behavioral control in human orbital and ventral prefrontal cortices. J Neurosci. 2003;23:7931–7939. [DOI] [PMC free article] [PubMed] [Google Scholar]
- 82.Noonan MP, Walton ME, Behrens TEJ, Sallet J, Buckley MJ, Rushworth MFS. Separate value comparison and learning mechanisms in macaque medial and lateral orbitofrontal cortex. Proc Natl Acad Sci U S A. 2010;107:20547–20552. [DOI] [PMC free article] [PubMed] [Google Scholar]
- 83.Rosenfeld B, Turkheimer E, Gardner W. Decision making in a schizophrenic population. Law Hum Behav. 1992;16:651–662. [Google Scholar]
- 84.Struglia F, Stratta P, Gianfelice D, Pacifico R, Riccardi I, Rossi A. Decision-making impairment in schizophrenia: Relationships with positive symptomatology. Neurosci Lett. 2011;502:80–83. [DOI] [PubMed] [Google Scholar]
- 85.Krug A, Cabanis M, Pyka M, et al. Attenuated prefrontal activation during decision-making under uncertainty in schizophrenia: a multi-center fMRI study. Schizophr Res. 2014;152:176–183. [DOI] [PubMed] [Google Scholar]
- 86.Martino DJ, Strejilevich SA. A comparison of decision making in patients with bipolar disorder and schizophrenia. Schizophr Res. 2014;156:135–136. [DOI] [PubMed] [Google Scholar]
- 87.C aceda R, Nemeroff CB, Harvey PD. Toward an understanding of decision making in severe mental illness. J Neuropsychiatry Clin Neurosci. 2014;26:196–213. [DOI] [PubMed] [Google Scholar]
- 88.Culbreth AJ, Westbrook A, Daw ND, Botvinick M, Barch DM. Reduced model-based decision-making in schizophrenia. J Abnorm Psychol. 2016;125:777–787. [DOI] [PMC free article] [PubMed] [Google Scholar]
- 89.Agerbo E, Sullivan PF, Vilhjalmsson BJ, et al. Polygenic risk score, parental socioeconomic status, family history of psychiatric disorders, and the risk for schizophrenia: a Danish population-based study and meta-analysis. JAMA Psychiatry. 2015;72:635–641. [DOI] [PubMed] [Google Scholar]
- 90.Post RM, Altshuler LL, Kupka R, et al. Multigenerational transmission of liability to psychiatric illness in offspring of parents with bipolar disorder. Bipolar Disord. 2018;20: 432–440. [DOI] [PubMed] [Google Scholar]
- 91.McLaughlin KA, Gadermann AM, Hwang I, et al. Parent psychopathology and offspring mental disorders: results from the WHO World Mental Health Surveys. Br J Psychiatry. 2012;200:290–299. [DOI] [PMC free article] [PubMed] [Google Scholar]
- 92.Correll CU, Olvet DM, Auther AM, et al. The Bipolar Prodrome Symptom Interview and Scale–Prospective (BPSS-P): description and validation in a psychiatric sample and healthy controls. Bipolar Disord. 2014;16:505–522. [DOI] [PMC free article] [PubMed] [Google Scholar]
- 93.McGrath JJ, Saha S, Al-Hamzawi A, et al. The bidirectional associations between psychotic experiences and DSM-IV Mental Disorders. Am J Psychiatry. 2016;173: 997–1006. [DOI] [PMC free article] [PubMed] [Google Scholar]
- 94.Kaymaz N, Drukker M, Lieb R, et al. Do subthreshold psychotic experiences predict clinical outcomes in unselected non-help-seeking population-based samples? A systematic review and meta-analysis, enriched with new results. Psychol Med. 2012;42:2239–2253. [DOI] [PubMed] [Google Scholar]
- 95.Armando M, Nelson B, Yung AR, et al. Psychotic-like experiences and correlation with distress and depressive symptoms in a community sample of adolescents and young adults. Schizophr Res. 2010;119:258–265. [DOI] [PubMed] [Google Scholar]
- 96.Schlosser DA, Jacobson S, Chen Q, et al. Recovery from an at-risk state: clinical and functional outcomes of putatively prodromal youth who do not develop psychosis. Schizophr Bull. 2012;38:1225–1233. [DOI] [PMC free article] [PubMed] [Google Scholar]
- 97.Addington J, Cornblatt BA, Cadenhead KS, et al. At clinical high risk for psychosis: outcome for nonconverters. Am J Psychiatry. 2011;168:800–805. [DOI] [PMC free article] [PubMed] [Google Scholar]
- 98.Xia CH, Ma Z, Ciric R, et al. Linked dimensions of psychopathology and connectivity in functional brain networks. Nat Commun. 2018;9:3003. [DOI] [PMC free article] [PubMed] [Google Scholar]
Associated Data
This section collects any data citations, data availability statements, or supplementary materials included in this article.