Abstract
During our daily life, we depend on memories of past experiences to plan future behaviour. These memories are represented by the activity of specific neuronal groups or 'engrams'1,2. Neuronal engrams are assembled during learning by synaptic modification, and engram reactivation represents the memorized experience1. Engrams of conscious memories are initially stored in the hippocampus for several days and then transferred to cortical areas2. In the dentate gyrus of the hippocampus, granule cells transform rich inputs from the entorhinal cortex into a sparse output, which is forwarded to the highly interconnected pyramidal cell network in hippocampal area CA33 This process is thought to support pattern separation4 (but see refs.5,6). CA3 pyramidal neurons project to CA1, the hippocampal output region. Consistent with the idea of transient memory storage in the hippocampus, engrams in CA1 and CA2 do not stabilize over time7–10. Nevertheless, reactivation of engrams in the dentate gyros can induce recall of artificial memories even after weeks2. Reconciliation of this apparent paradox will require recordings from dentate gyrus granule cells throughout learning, which has so far not been performed for more than a single day6,11,12. Here, we use chronic two-photon calcium imaging in head-fixed mice performing a multiple-day spatial memory task in a virtual environment to record neuronal activity in all major hippocampal subfields. Whereas pyramidal neurons in CA1-CA3 show precise and highly context-specific, but continuously changing, representations of the learned spatial sceneries in our behavioural paradigm, granule cells in the dentate gyrus have a spatial code that is stable over many days, with low place- or context-specificity. Our results suggest that synaptic weights along the hippocampal trisynaptic loop are constantly reassigned to support the formation of dynamic representations in downstream hippocampal areas based on a stable code provided by the dentate gyms.
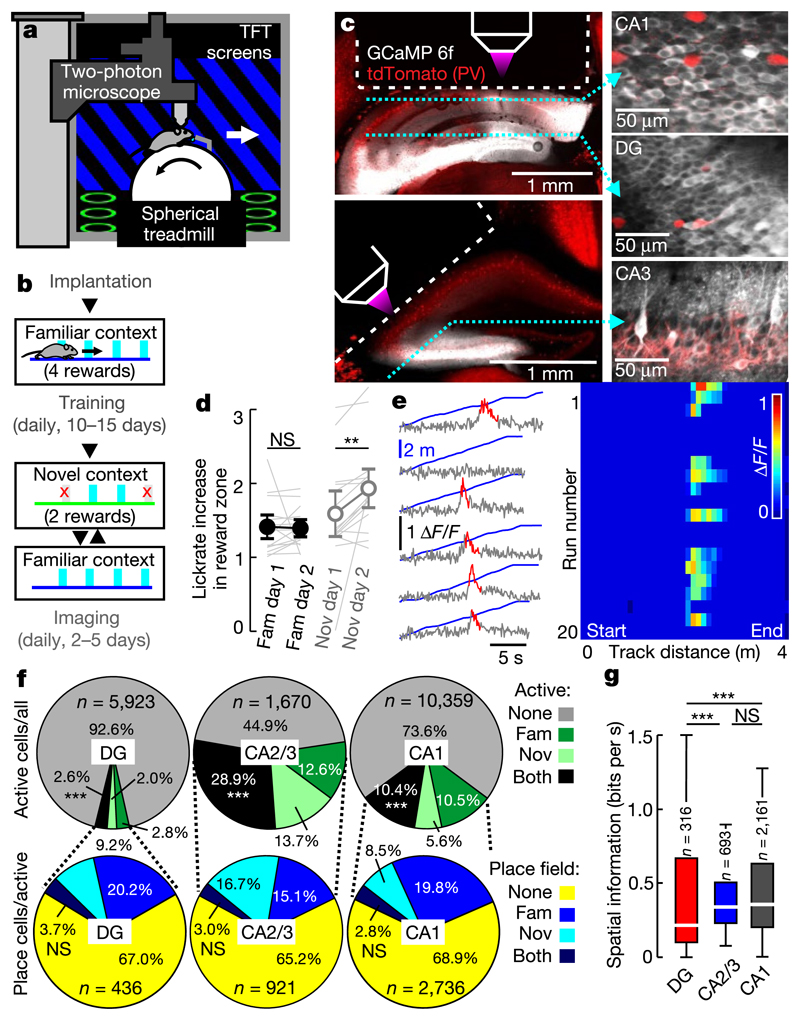
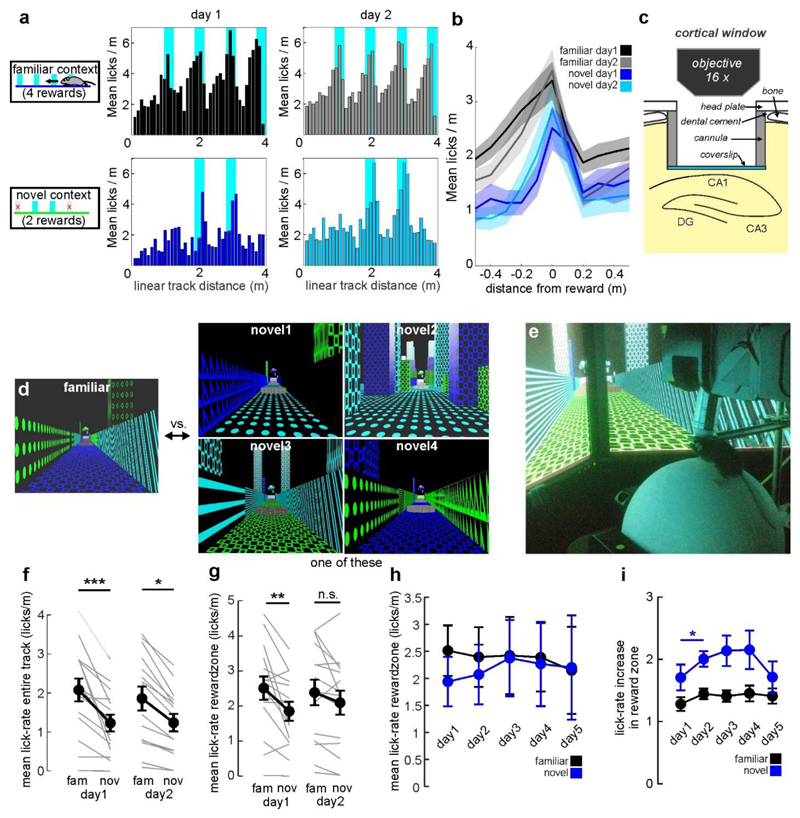
To study hippocampal memory engrams during long-term learning, we designed a goal-oriented learning task for head-fixed mice. Mice ran on a spherical treadmill to collect soy milk rewards on a 4-m-long virtual linear track displayed on monitors around the animal. After at least 10 days of familiarization to this track (familiar context), imaging sessions started in which mice ran alternatingly on this familiar and a visually different, novel track with different reward sites (Fig. la, b, Supplementary Video 1). Animals consistently licked more often inside than outside reward zones on both tracks (Fig. 1d). Initially, overall licking and reward-related licking were lower in the novel context than in the familiar context (Extended Data Fig. 1c, d). These differences vanished with learning. On the novel track, the ratio of rewarded to erroneous licks increased markedly on the second training day (Fig. 1d), indicating that mice remembered the rewarded locations.
Fig. 1. Two-photon calcium imaging of hippocampal place cell activity in a virtual environment.
a, Experimental schematic. b, Behaviour timeline (see Methods). c, Left, CA1 and DG (top) and CA2/3 (bottom) implantation sites. GCaMP6f (white) and td-Tomato (tdT;red) in parvalbumin (PV)-expressing intemeurons. Dotted lines, imaging planes. Right, GCaMP6f and tdT fluorescence in vivo. d, Ratio between rewarded and non-rewarded licks in the familiar (fam, filled circles) and novel (nov, open circles) contexts (n = 15 mice; two-sided signed rank-sum test). e, Calcium traces (grey) with significant transients (red; see Methods) of a GC and linear-track position (blue) over time. Right, calcium activity over track distance of the same GC. f, Top, fraction of active (more than 0.05 transients per s) cells among all neurons. Test for population overlap (χ2 test). Bottom, cells with place fields among active cells. g, Spatial information for all familiar-track-active neurons (ANOVA on ranks, Dunn’stest). Boxes, 25th to 75th percentiles; bars, median; whiBkers, 99% range. NS, not significant; ***P < 0.001. Error bars denote s.e.m. For exact P values see Supplementary Table 1.
To measure hippocampal neuronal activity, mice were injected with adeno-associated viruses designed to express the fluorescent calcium indicator GCaMP6f pan-neuronally in CA1 and the dentate gyrus (DG) or CA3 (Fig. 1). A chronic transcortical imaging window was implanted above CA1 to perform two-photon imaging of CA1 or DG neurons13 (Supplementary Video 2). Implantation did not impair spatial learning in a Barnes maze (Extended Data Fig. 1h, i). CA1 and DG neurons were imaged at depths of around 150 μm and around 700 μm, respectively. To image CA3, we implanted a more lateral window14 (Fig. 1c). Data were obtained predominantly from CA3 (Extended Data Fig. 2d), but some CA2 cells may also have been included14. In all cases, we used fast volumetric scanning to simultaneously record about 500 neurons (see Methods, Supplementary Videos 3–5).
We first analysed neuronal activity in the familiar and novel contexts (Fig. 1). Consistent with previous findings11,12,15,16, pyramidal cells (PYRs) in CA1–CA3 were substantially more active than granule cells (GCs) (Fig. 1f, Extended Data Fig. 3a, b). We also determined the fraction of cells that was active in the familiar, novel or both contexts with more than 0.05 calcium transients per second. Activation of hippocampal neurons might be predetermined by intrinsic properties17. In line with this idea, we found a marked overlap of active neuronal ensembles between contexts (Fig. 1f, upper row). About 35% of these active neurons had a clearly defined place field (see Methods) on the first recording day in either the novel or the familiar context, or both (Fig. 1f, lower row). Because many neurons were active in both contexts, we investigated whether active neurons were more likely to have a place field in both contexts. However, the familiar- and novel-context place cells appeared to form independent subgroups within the active cell population (Fig. 1f, lower row) indicating that a separate place-coding group or 'engram' might exist for each context. Further comparison of spatial coding properties revealed lower average spatial information (see Methods) per active cell (Fig. 1g) and wider place fields (Extended Data Fig. 3c) in GCs compared to CA1–3 PYRs. Thus, GC activity is sparse and has broader and less precise spatial tuning than PYR activity.
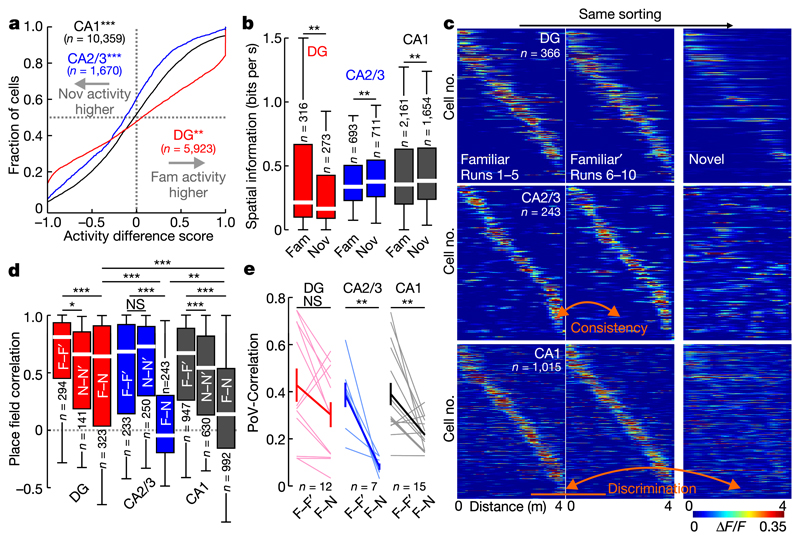
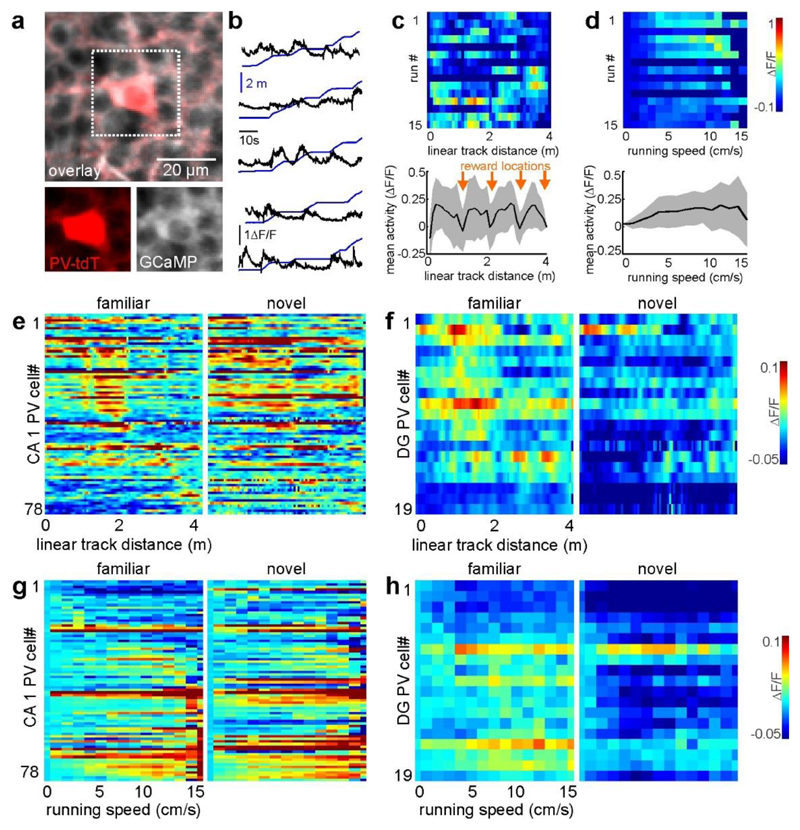
Next, we compared neuronal activity between contexts (Fig. 2). Consistent with a previous study15 and their inputs from the entorhinal contex18, mean activity in GCs decreased in the novel context, whereas mean activity of CA1 and CA2/3 PYRs increased (Fig. 2a). Similarly, novel-context spatial information was markedly lower in the DG, but higher in both CA regions (Fig. 2b). Additionally, there was a trend towards higher place cell numbers on the familiar track than on the novel track, particularly in the DG (n = 30.50 versus 16.42 place cells per experiment, 12 experiments, P = 0.066, paired t-test; Extended Data Fig. 3f). We next investigated the cause of these activity differences between contexts. Hippocampal γ-aminobutyric acid (GABA) interneurons contribute to separation of memory engrams19 and formation of place fields13. We therefore analysed the activity of parvalbumin (PV)-expressing interneurons (PVIs; Extended Data Fig. 4), the most abundant subtype of interneurons in the hippocampus. PVI activity in CA1 and the DG correlated positively with running speed13,20 (Extended Data Fig. 4c–h). PVls in the DG, but not in CA1, showed decreased activity in the novel context (Extended Data Fig. 4i-l), contrasting with reports from unidentified DG interneurons15. Thus, our data argue against suppression of GCs by enhanced PVI activity, and are instead consistent with predominant recruitment of DG PVIs by local GC inputs.
Fig. 2. Pyramidal cells in CA1 and CA2/3 cliacriminate between contexts.
a, Activity difference scores (see Methods) between novel and familiar contexts for all cells (two-sided signed rank-sum test: novel versus familiar activity). b, Mean spatial information of active cells (two-sided rank-sum test). c, Familiar-trade place cell activity plotted for the first (left) and second (middle) block of familiar-context runs and for the novel context (right). d, Mean activity correlations of place cells within familiar (left) and novel context (middle) runs and between contexts (right bars; ANOVA on ranks, Dunn's test). e, PoV correlations (see Methods) for all experiments within familiar-context runs and between contexts (thin lines). Thick lines denote mean ±s.e.m. (two-sided paired t-test). Boxes, 25th to 75th percentiles; bars, median; whiskers, 99% range. *P < 0.05, **P<0.01, ***P<0.001; NS, not significant. For exact P values see Supplementary Table 1.
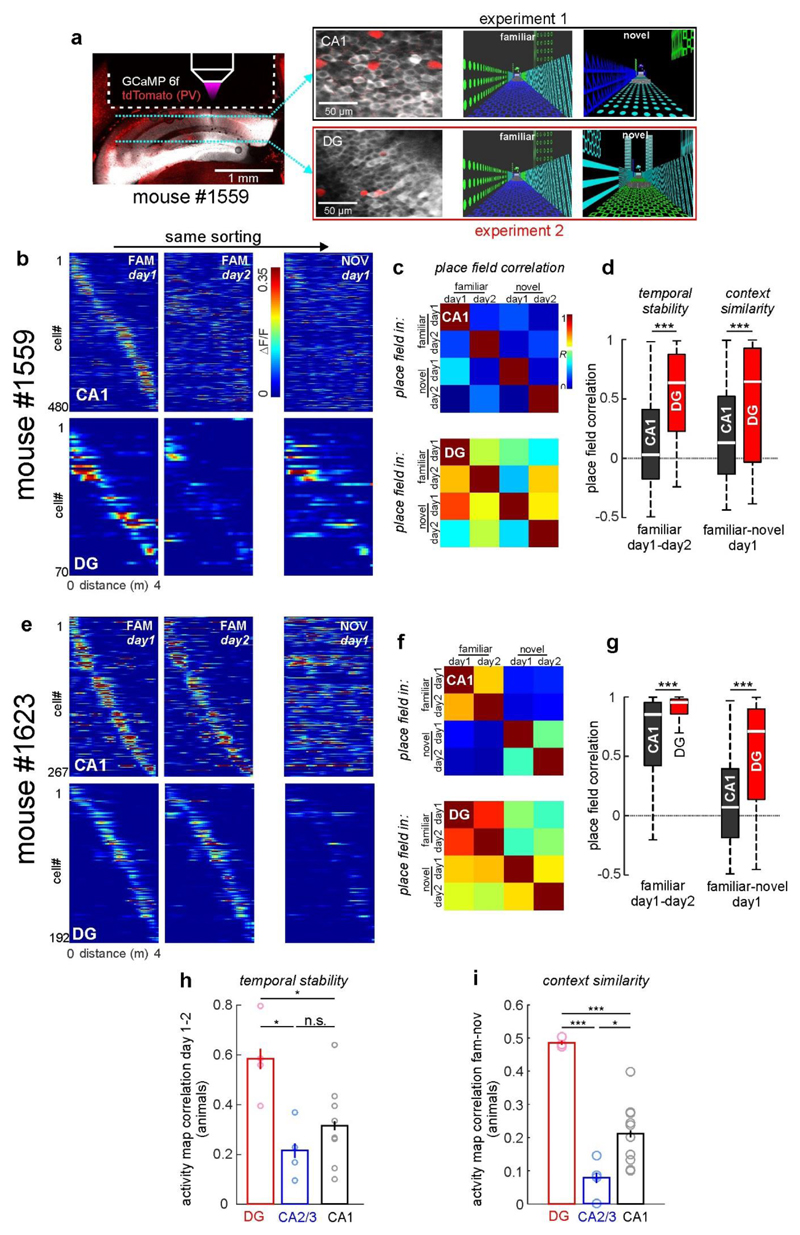
To probe neuronal discrimination between contexts, we first determined the consistency of place cell firing on the same track between the first vs. the second block of five consecutive runs. Place cell consistency in the familiar context was high in all hippocampal subfields (Fig. 2c, d; F–F'). The same measure and trial-to-trial reliability were generally lower for novel-context runs, indicating an initially less reliable representation (Fig. 2c, d; N–N'; Extended Data Fig. 3i). Next, we quantified place cell remapping between the familiar and novel contexts. Unexpectedly, activity map correlations between contexts were substantially higher for DG place cells than in CA1 and CA2/3 (Fig. 2c, d; F–N). We confirmed this finding separately in two mice by imaging neuronal activity in CA1 and DG of the same mice (Extended Data Fig. 5). Thus DG place cell activity was similar between contexts, while that of CA1–3 place cells was highly discriminative. We also calculated population vectors (PoVs) for both contexts from the mean calcium activity maps of all cells. PoVs were significantly more dissimilar between contexts as compared to independent runs within the familiar context in CA1 and CA2/3 (P = 0.004, both regions, paired t-test), but not in the DG (P = 0.051, Fig. 2e). Indeed, activity map correlations between contexts were markedly lower in CA1 and CA2/3 than in the DG, indicating stronger remapping in CA1–3. GCs might encode travelled distance and therefore show low context-selectivity.To test this possibility, we let mice run on a simplified linear track with striped walls but no further contextual information (Extended Data Fig. 6a). Under these conditions, GC activity and spatial information were low, and GCs did not show consistent place fields (Extended Data Fig. 6b, c), indicating that they encode the general task layout rather than mere distance. Thus, GCs show reliable place representations and low context discrimination, whereas CA2/3 PYRs and CA1 PYRs prominently encode contextual differences.
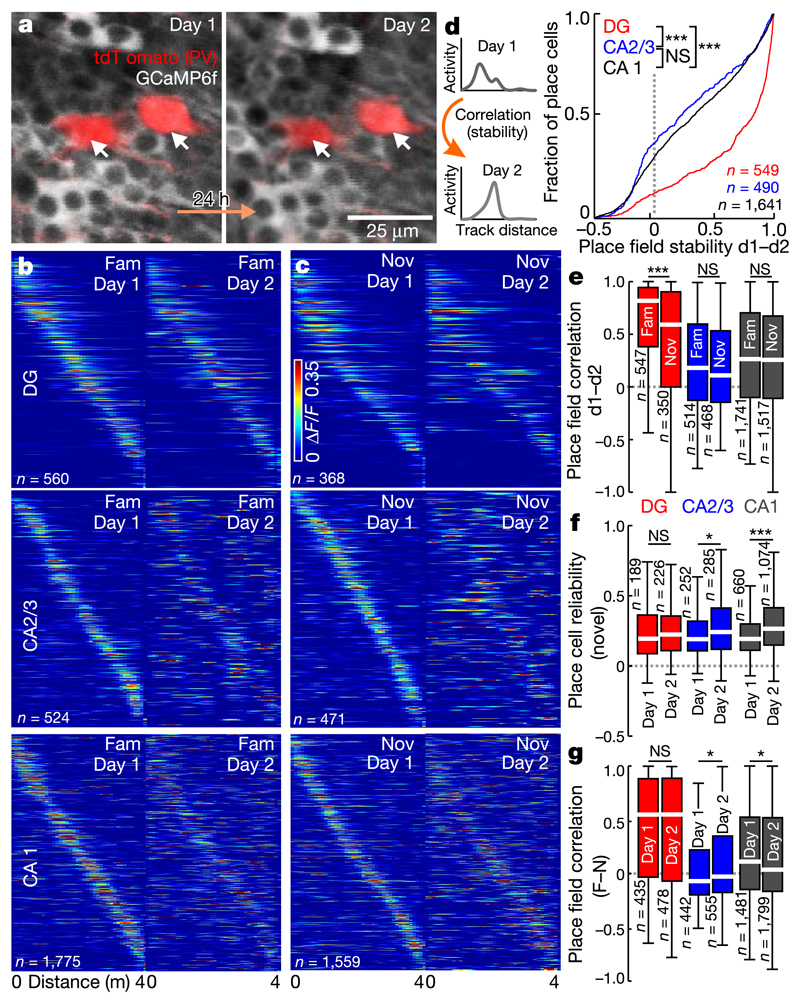
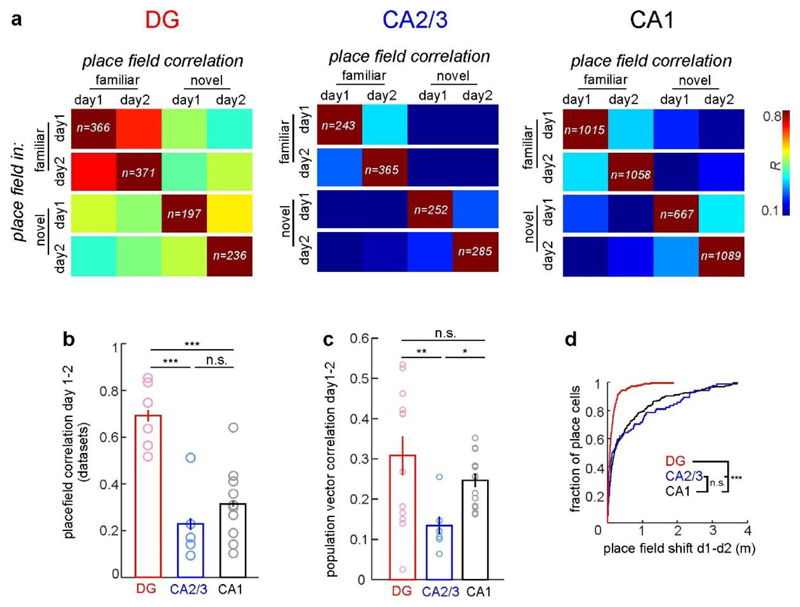
To investigate place field stability throughout learning, we imaged the same cells in both contexts on two subsequent days (Fig. 3, Extended Data Fig. 7). Whereas GCs maintained their place field locations in the same context, CA1 PYRs and CA2/3 PYRs displayed substantial remapping (Fig. 3b–d). This was characterized by lower activity map correlations (Fig. 3d, e) and larger shifts of the preferred firing location (Extended Data Fig. 7c). Despite the generally high GC place field stability, activity map correlations between days were lower for GCs encoding the novel context than for those encoding the familiar context. By contrast, hippocampal PYRs showed similarly low stability in both contexts (Fig. 3e). Thus, GCs have stable place fields, while place fields in other hippocampal subfields change over days.
Fig. 3. GC place fielch are highly stable across days.
a, lliustrative example of CA1 cells imaged on subsequent days. b, Activity of famillar-track place cells sorted for day 1. c, As in b for novel-track place cells. d, Left. experimental schematic. Right, activity map correlations between days for all day 1(dl) place cells (ANOVA on ranks, Dunn's test). e, Activity map correlations between days for familiar-context (left) and novel-context (right) place cells. f, Mean trial-to-trial reliability of novel-track place cell responses on days 1 and 2. g, Activity map correlations between contexts of day 1 (left) and day 2 (right) place cells. e–g, Two-sided rank-sum test. Boxes, 25th to 75th percentiles; bars, median; whiskers, 99% range. *P<0.05, ***P<0.001; NS, not significant. For exact P values see Supplementary Table 1.
Place cell stability in CA1 may depend on environmental complexity9. We therefore repeated our experiments in a virtual context without distal visual cues ('poor') and ahighly enriched, multisensory track ('rich'; Supplementary Video 6). Notably, the number of place cells was similar between all tracks, but their firing rate, spatial information and day-to-day stability were markedly reduced on the 'poor' track (Extended Data Fig. 8). We observed no differences between the 'rich' track and our standard contexts, indicating that CA1 place cell representations are also dynamic over days in complex environments.
Next, we investigated learning-induced changes in spatial coding. From day 1 to day 2, there was a substantial increase in the trial-to-trial reliability of place cells in CA1–3, but not in the DG (Fig. 3f, Extended Data Fig. 7d). The DG is required for context discrimination5,6. We therefore tested whether neuronal activity became more distinct between contexts with learning. Unexpectedly, activity correlations between contexts were unchanged in GCs from day I to day 2 but were lower for CA1 place cells on day 2 and remained negative in CA2/3 (Fig. 3g). Thus, improved behavioural context discrimination was accompanied by a decorrelation of place cell activity in CA1, but not in the DG.
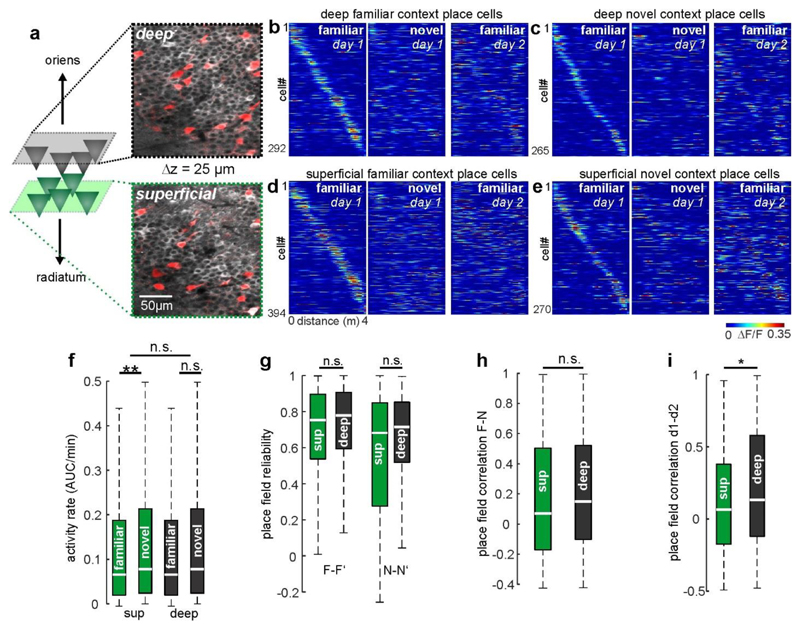
In light of recent findings20, we compared place coding between the deep and superficial sublayers of CA1. Notably, place field stability across days was slightly higher in deep-layer PYRs (45% difference, P = 0.046; Extended Data Fig. 9i), albeit at generally low levels. Place field reliability and context discrimination were comparable between sublayers (Extended Data Fig. 9g, h).
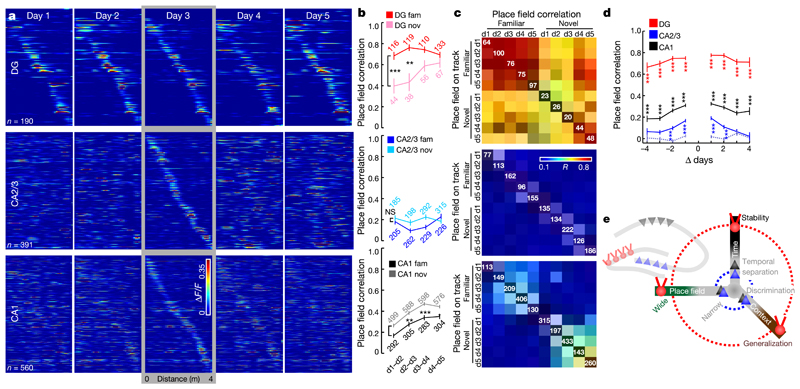
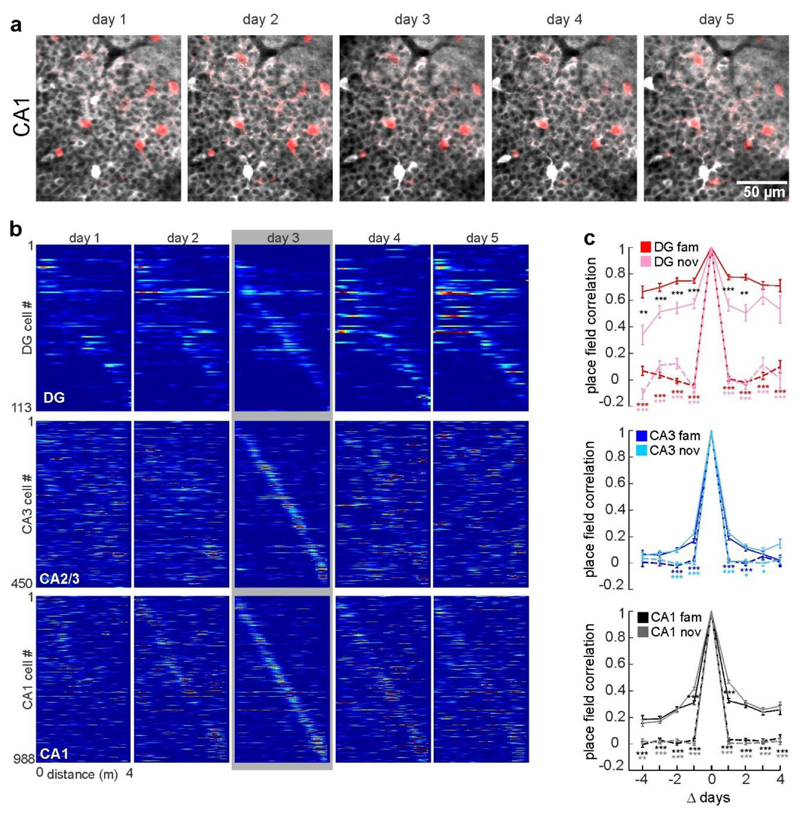
To investigate the development of spatial representations over the time-course of hippocampus-dependent memory2, we continued imaging sessions for five subsequent days (Fig. 4, Extended Data Fig. 10). Whereas the number of place cells was similar for each context and day (Fig. 4c, white numbers), their firing locations changed markedly in some hippocampal sub-areas. Familiar-context place fields of GCs remained stable throughout all days (Fig. 4a–c) and novel-context place cells showed gradually increasing stability (Fig. 4b, c, Extended Data Fig. 10b). By contrast, CA1 and CA2/3 activity in the same contexts became rapidly more dissimilar over days. For CA2/3 cells, activity map correlations over more than two days dropped below chance levels (Fig. 4d), demonstrating that these neurons constantly remap their place fields.
Fig. 4. Stable coding of GCs persists throughout multiple days, whereas CA2/3 PYRs constantly remap over time.
a, Activity maps of all familiar-context place cells sorted by days 3. b, Development of activity map correlations between subsequent days for familiar- (dark) and novel-context (light) place cells (numbers show n; ANOVA on ranks, Dunn’s test; mean±s.e.m). c, Mean activity map correlations (colour coded; Pearson’s R) over 5 days and two contexts as indicated on the x-axis. Each row shows mean correlation values for cells that had a place field on the day and track indicated on the y-axis (white numbers show n). d, Mean activity map correlations for familiar-context place cells over days passed. Grey dotted line, chance level correlations for CA2/3 cells obtained by shuffling cell IDs (two-sided rank-sum test, actual versus shuffled correlations, Bonferroni correction; mean±s.e.m). e, Schematic: GCs show a highly stable environment representation with low spatial and context selectivity. By contrast, PYRs form highly context-, place- and time-specific ensembles. *P<0.05; **P<0.01; ***P<0.001. For exact P and n values in d see Supplementary Table 1.
Dynamic coding has been described in CA17–9,21, CA210 and other associative areas22,23. A gradual variation of activeCA1 ensembles links contextual memories acquired close in time7,8,21 and remapping of individual PYRs is driven by synaptic plasticity13,24. By contrast, neuronal ensemble activity in motor areas stabilizes throughout learning25. In the hippocampus, temporally stable coding of GCs may induce heterosynaptic plasticity at CA3 PYR dendrites by associating their activity with temporally dynamic inputs from the entorhinal cortex23 or other CA3 PYRs26. This hypothesis would explain why CA3 ensembles can trigger memory recall independent of GC input even when the DG is required for initial task learning27,28. Our results, together with previous findings8,10, indicate that CA3 coding can be dynamic or stable, potentially depending on the behaviour, proximo-distal location within CA3 (Extended Data Fig. 2e), virtual versus real-world navigation or species-differences in entorhinal cortex innervation29. When CA3 is stable, a mechanism similar to that described above may apply at CA3–CA1 synapses.
Traditionally, similar memories are thought to be represented by largely non-overlapping populations of GCs4. However, recent findings indicate that GCs remap only between widely dissimilar environments11, while other cell types (for example, mossy cells) discriminate between similar contexts12. Accordingly, CA2/3 PYR activity was most discriminative between our virtual contexts (Fig. 2d, e). The high similarity of our—mostly mature6—GC activity between contexts may explain why mature GCs mediate generalization between similar contexts rather than pattern separation5.
Our results further suggest that the hippocampus combines stable and dynamic coding and reunites findings of temporally varying neuronal ensembles encoding the same environment7,8 with reports of stable behavioural output upon DG engram reactivation over weeks2,27 Given that the DG is required for the extinction or modification of existing memories acquired in the same scenery28,30, our data support the hypothesis that GCs provide a simplistic but stable representation of the global environment11,12 that serves as a blueprint for spatially and contextually precise, but temporally varying, CA1–3 engrams (Fig. 4e). Such an encoding scheme would allow one to associate memories acquired in the same global environment but still to discriminate between slightly different or temporally separate instances of these momories.
Online content
Any Methods, including any statements of data availability and Nature Research reporting summaries, along with any additional references and Source Data files, are available in the online version of the paper at https://doi.org/10.1038/s41586-018-0191-2.
Extended Data
Extended Data Figure 1. Virtual environment behavioural paradigm for head-fixed mice (related to Fig. 1).
(a) Left, schematic illustration of the virtual linear tracks (side view). Four of the reward locations were offered in the familiar context, but only two in the novel one. Right, Mean number of licks per spatial bin (10 cm wide) for one example mouse on day 1 (left) and day 2 (right) on the familiar (top, grey) and novel (bottom, blue) linear track. (b) Mean lick rate per bin as a function of distance from the next reward location for the familiar (black traces) and novel context (blue traces). Shaded areas denote SEM. (c) Schematic of the transcortical window implantation. A stainless steel cannula (3 mm diameter) with a circular coverslip attached to its bottom is implanted into the brain and resting on the external capsule on top of the hippocampus (Methods) (d) Screenshots of the familiar and the four different novel context sceneries. One novel context was randomly selected for each experiment from this set and maintained through all days. Note: If more than one experiment was performed in a given animal, a different novel context was chosen for each of the experiments. (e) Photograph of the mouse in the virtual environment setup. Depicted is an animal in the CA2/3 recording group with tilted objective for lateral access view (Methods) (f) Mean lick rate over the entire familiar (left) or novel (right) track on day 1 (left group) or day 2 (right group). Grey lines denote individual experiments and black circles with error bars the mean. (g) Same as in (d) but for mean lick rate in the reward zones only. (h) Reward related licking plotted for the experiments continued over 5 days. In this subset of the data (n=5 experiments) no significant differences in licking between contexts was observed on any day (ANOVA), although there was a trend for lower lick rates on the novel context. (i) Lick rate increase in the reward zone (as compared to licking on the remaining track). An increase in the fraction of reward-related licks was observed only between day 1 and 2. (* p<0.05; one way ANOVA). (d,e) ** p<0.01, *** p<0.001, n.s. not significant; paired t-test between contexts. Error bars denote SEM.
Extended Data Figure 2. Properties of place coding in the familiar and novel virtual context (related to Fig. 2).
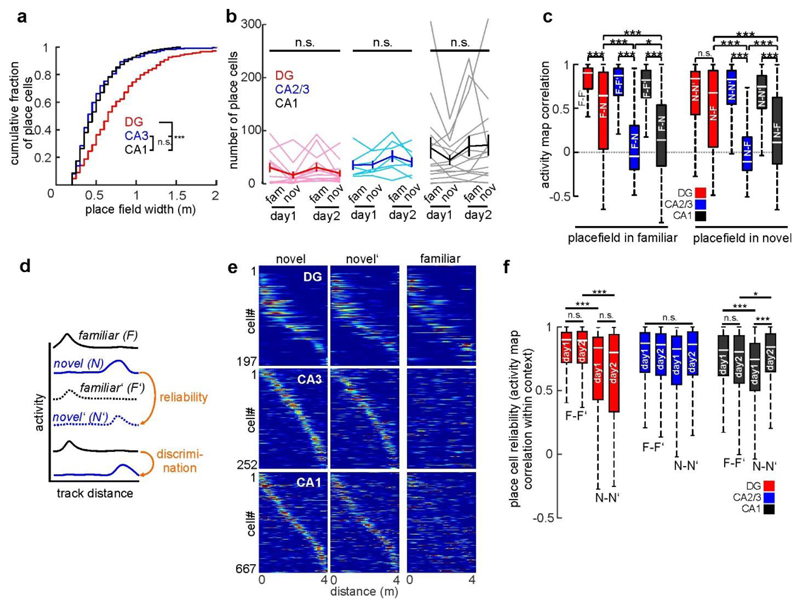
(a) Cumulative distribution of place field widths for GCs (red), CA2/3 PYR (blue) and CA1 PYR (black). *** p<0.001, n.s. not significant; one-way ANOVA on ranks with Dunn’s test. (b) Number of cells with significant place fields (Methods) in each experiment. Thin lines denote individual experiments, thick lines with error bars the means. n.s not significant; one-way repeated measures ANOVA. (c) Correlation of place related activity for cells that had a place field in the familiar context (left group) or novel context (right group) on day 1. Left bar of each duplet shows correlation of activity maps for trials on the same track, right bar correlation with trials on the other track in the same session. Correlations within the same context were always significantly higher than between contexts, except for GCs that had newly acquired a place field on the novel track. * p<0.05, *** p<0.001, n.s. not significant; one-way ANOVA with Dunn’s test was performed for the right or left group. (d) Experimental schematic: Place field reliability was measured as the correlation of activity maps on different runs in the same context (familiar: F-F’ or novel: N-N’). Place field discrimination was assessed by measuring activity map correlations between trials in different contexts (F-N). (e) Activity over distance for cells with a place field on the novel track. Cells were sorted according to their peak activity in one half of the runs (left) and are plotted in the same order for the other half of the novel track runs (middle) and for the runs on the familiar track (right). For the same plots with familiar context place cells see Fig. 2g. (f) Activity map correlations (=reliability) of place cells within the familiar (left bars of each group) and novel context (right bars of each group) on day 1 and day 2. Note: Place cells activity is more reliable for familiar-context place cells in DG and CA1 on both days of the experiment. There is a significant increase of novel-context place cells reliability from day 1 to day 2 in CA1. * p<0.05, *** p<0.001, n.s. not significant; one-way ANOVA on Ranks with Dunn’s test; for comparison with Fig. 3: The increase in reliability for novel-context place cells in CA2/3 is significant when tested pairwise. (c,f) Boxes: 25th to 75th percentiles; white bars: median; whiskers, 99% range.
Extended Data Figure 3. Place field remapping between days.
(a) Mean cellular activity map correlations over two days and contexts as indicated on the x-axis. Each row shows mean correlation values for cells (n is shown as white number) that had a place field on the day and track indicated on the y-axis. (b) For all cells that had a place field in the familiar context on either day, the activity map correlations for the familiar context was determined between days and averaged for all experiment with at least 20 place cells (light circles). The means of these per-experiment measures were compared statistically (bars). * p<0.05, *** p<0.001; one-way ANOVA with Holm-Sidak test. (c) Population vector correlations between days were determined for each context and averaged between the novel and familiar context for each experiment. Population vector stability between days was high in GCs, intermediate for CA1 PYR and low for CA2/3 PYR. * p<0.05, ** p<0.01, n.s. not significant; one-way ANOVA on Ranks with Dunn’s test. (d) For all cells that had a place field in the familiar context on both days of the experiment, the centres of mass for the activity in these place fields was determined. The graph shows the cumulative distribution of the distances between these centres (shift) between day 1 and 2, which gives a measure for the relocation of place fields between days. *** p<0.001, n.s. not significant; one-way ANOVA on Ranks with Dunn’s test.
Extended Data Figure 4. Differential stability of hippocampal place fields over extended time spans.
(a) The same place cells were imaged over multiple days. Pictures show the time-averaged fluorescence of GCaMP6f (pseudo colour white) expressed panneuronal and td-Tomato (red) expressed in PV-interneurons (PVIs) for the same field of view in CA1 on five subsequent days. (b) Activity maps for cells that had a place field on the novel track on any of the five days. Cells are sorted by their activity peaks on day three (grey shading). (C) Activity map correlations as function of days passed for cells with place field on the familiar (dark colours) or novel track (light colours). Dotted lines show corresponding levels of random correlations that were generated by shuffling cell IDs. Dark and light coloured asterisks underneath the dotted lines indicate significant differences of the actual vs. random correlations for the familiar- and novel-context place cells, respectively. Black asterisks between traces indicate significant differences between the mean correlation values of novel- vs. familiar-context place cells. * p<0.05, ** p<0.01, *** p<0.001; Mann-Whitney U test for each Δdays with Bonferroni correction. Error bars denote SEM.
Extended Data Figure 5. Superficial and deep layer CA1 pyramidal cells differ in their task related coding properties.
(a) Experimental schematic: Cells with somata close to the border of stratum oriens (= deep CA1-PYR) and those close to the border of stratum radiatum (= superficial CA1-PYR) were identified in different z-planes and separated for analysis. Pictures to the right show time averaged fluorescence of GCaMP6f (white) and td-Tomato (red) in PV expressing interneurons (PVIs). (b) Calcium activity over distance for deep CA1-PYR with a place field on the familiar track. Cells were sorted according to their peak activity on the familiar track (left) and are plotted in the same order for runs on day 1 on the novel track (middle) and for the runs on the familiar track on the second day (right). (c) Same as in (b), but for novel-context place cells on the familiar context (middle) and novel context on the second day (right). (d, e) Same as in (b and c), but for superficial PYR. (f) Calcium activity rate for superficial and deep CA1- PYR in the familiar and novel context. Activity rates were significantly higher in the novel context in superficial, but not deep PYR. (g) Place field reliability, i.e. activity map correlations on trials on the same day and context (see Extended Data Fig. 2d for detailed description) were compared between layers for familiar context (left) and novel context runs (right). (h) Activity map correlations between contexts for cells with a place field in the familiar context on day 1. (i) Same as in (h), but for activity map correlations between day 1 and 2 for familiar context runs. (f,g) ** p<0.01, n.s. not significant; one-way ANOVA on Ranks with Dunn’s test. (h,i) * p<0.05, n.s. not significant; Mann-Whitney U test. (f-i) Boxes: 25th to 75th percentiles; white bars: median; whiskers, 99% range.
Extended Data Figure 6. Task related activity of parvalbumin (PV) expressing interneurons in CA1 and DG.
(a) Time-averaged fluorescence image of GCaMP6f (pseudocolor white) and td-Tomato (tdT; red) expressed in parvalbumin (PV) expressing interneurons (PVIs). Insets below show each fluorescence channel separately for the area indicated with the dotted line. (b) Calcium trace of a representative PVI in CA1 (black) and distance on the virtual linear track (blue) over time. Note: This PVI is active particularly at times when the animal moves fast. (c) Calcium activity (colour coded) of the cell shown in (b) as a function of linear track distance for multiple runs (rows). Graph at the bottom shows the average of activity over distance for this cell in the familiar context. Shaded areas denote standard deviation (STD). (d) Same as in c, but activity was plotted as a function of running speed. (e, f) Mean activity maps over distance for all recorded CA1 (e) or DG (f) PVIs in the familiar and novel context. (g, h) Same as in (e and f), but mean activity was plotted over running speed. Note: Activity in most DG PVIs is suppressed in the novel context (for quantification see Fig. 2c-f).
Extended Data Figure 7. Differential stability and context discrimination properties of principal cells in CA1 and DG are not due to interindividual differences.
(a) Experimental schematic: Left, fluorescence image of GCaMP6f (white) and td-Tomato in PV cells (red) in a post mortem coronal brain section. Dotted line indicates position of the imaging window. In this particular mouse, recordings were made from CA1-PYR or DG-GCs in separate, sequential experiments (exemplary image planes are shown in middle images). For each experiment, the same familiar and a different novel context (right) were used. Thereby, the coding properties of PYR and GCs of the same animal could be compared. (b) Calcium activity over distance for CA1- PYR (top) and DG-GCs (bottom) with place fields on the familiar track are shown sorted for their peak activity on day 1 in the familiar context. Middle images show the same cells with the same sorting on day 2 in the familiar context and on day 1 in the novel context (right). (c) Mean cellular activity map correlations over two days and contexts as indicated on the x-axis. Data sampled only for place cells recorded in the selected mouse. Each row shows mean correlation values for cells that had a place field on the day and track indicated on the y-axis. (d) Left, Correlations of activity maps in the familiar context between days plotted for cells that had a place field in the familiar context. Cells were sampled only from measurements in this particular mouse. Right, activity map correlations between the familiar and novel context on day 1 for all cells that had a place field in the familiar context on that day. Note: Stability over time as well as activity map similarity between contexts are significantly higher for GCs when compared to CA1-PYR of the same animal. (e-f) Same as in (b-d), but calculated separately on cells from another mouse. (h) Activity map correlations between day 1 and 2 were calculated for familiar-context place cells and averaged for each animal that had a minimum of 20 such place cells (open circles). The means of these per-animal averages (bars) were compared statistically. (i) Same as in (h), but for activity map correlations between the familiar and novel context on day 1. Note: Higher temporal stability and higher inter-context similarity are a feature of GCs that is consistently observed in different animals. (h,i) * p<0.05, ** p<0.01, *** p<0.001, n.s. not significant; one-way ANOVA with Holm-Sidak test. Error bars denote ±SEM. (d,g) Boxes: 25th to 75th percentiles; white bars: median; whiskers, 99% range.
Acknowledgements
We thank H.-J. Weber,C.Paun and C. Schmidt-Hieber for advice and help with setting up the virtual environment system; K. Winterhalter and K. Semmler for technical support; and J. Sauer, M. Strueber and M. Eyre for comments on earlier versions of the manuscript. This work was funded by the German Research Foundation (FOR2143, M.B.) and ERC-AdG 787450 (M.B.). This work was supported in part by the Excellence Initiative of the Genman Research Foundation (GSC-4, Spemann Graduate School; T.H.).
Footnotes
Reviewer information Nature thanks M. Brecht and S. Leutgeb for their contribution to the peer review of this work.
Author contributions T.H. and M.B. conceived the study, designed the experiments and wrote the manuscript. T.H. performed experiments and analysed data.
Competing interests The authors declare no competing interests.
Additional information
Supplementary information is available for this paper at https://doi.org/10.1038/s41586-018-0191-2.
Reprints and permissions information is available at http://www.nature.com/reprints.
Publisher's note: Springer Nature remains neutral with regard to jurisdictional claims in published maps and institutional affiliations.
References
- 1.Ramirez S, et al. Creating a false memory in the hippocampus. Science. 2013;341:387–391. doi: 10.1126/science.1239073. [DOI] [PubMed] [Google Scholar]
- 2.Kitamura T, et al. Engrams and circuits crucial for systems consolidation of a memory. Science. 2017;356:73–78. doi: 10.1126/science.aam6808. [DOI] [PMC free article] [PubMed] [Google Scholar]
- 3.Pernía-Andrade AJ, Jonas P. Theta-gamma-modulated synaptic currents in hippocampal granule cells in vivo define a mechanism for network oscillations. Neuron. 2014;81:140–152. doi: 10.1016/j.neuron.2013.09.046. [DOI] [PMC free article] [PubMed] [Google Scholar]
- 4.Chawla MK, et al. Sparse, environmentally selective expression of Arc RNA in the upper blade of the rodent fascia dentata by brief spatial experience. Hippocampus. 2005;15:579–586. doi: 10.1002/hipo.20091. [DOI] [PubMed] [Google Scholar]
- 5.Nakashiba T, et al. Young dentate granule cells mediate pattern separation, whereas old granule cells facilitate pattern completion. Cell. 2012;149:188–201. doi: 10.1016/j.cell.2012.01.046. [DOI] [PMC free article] [PubMed] [Google Scholar]
- 6.Danielson NB, et al. Distinct contribution of adult-born hippocampal granule cells to context encoding. Neuron. 2016;90:101–112. doi: 10.1016/j.neuron.2016.02.019. [DOI] [PMC free article] [PubMed] [Google Scholar]
- 7.Rubin A, Geva N, Sheintuch L, Ziv Y. Hippocampal ensemble dynamics timestamp events in long-term memory. eLife. 2015;4:e12247. doi: 10.7554/eLife.12247. [DOI] [PMC free article] [PubMed] [Google Scholar]
- 8.Mankin EA, et al. Neuronal code for extended time in the hippocampus. Proc Natl Acad Sci USA. 2012;109:19462–19467. doi: 10.1073/pnas.1214107109. [DOI] [PMC free article] [PubMed] [Google Scholar]
- 9.Kentros CG, Agnihotri NT, Streater S, Hawkins RD, Kandel ER. Increased attention to spatial context increases both place field stability and spatial memory. Neuron. 2004;42:283–295. doi: 10.1016/s0896-6273(04)00192-8. [DOI] [PubMed] [Google Scholar]
- 10.Mankin EA, Diehl GW, Sparks FT, Leutgeb S, Leutgeb JK. Hippocampal CA2 activity patterns change over time to a larger extent than between spatial contexts. Neuron. 2015;85:190–201. doi: 10.1016/j.neuron.2014.12.001. [DOI] [PMC free article] [PubMed] [Google Scholar]
- 11.GoodSmith D, et al. Spatial representations of granule cells and mossy cells of the dentate gyrus. Neuron. 2017;93:677–690.e5. doi: 10.1016/j.neuron.2016.12.026. [DOI] [PMC free article] [PubMed] [Google Scholar]
- 12.Senzai Y, Buzsáki G. Physiological properties and behavioral correlates of hippocampal granule cells and mossy cells. Neuron. 2017;93:691–704.e5. doi: 10.1016/j.neuron.2016.12.011. [DOI] [PMC free article] [PubMed] [Google Scholar]
- 13.Sheffield MEJ, Adoff MD, Dombeck DA. Increased prevalence of calcium transients across the dendritic arbor during place field formation. Neuron. 2017;96:490–504.e5. doi: 10.1016/j.neuron.2017.09.029. [DOI] [PMC free article] [PubMed] [Google Scholar]
- 14.Rajasethupathy P, et al. Projections from neocortex mediate top-down control of memory retrieval. Nature. 2015;526:653–659. doi: 10.1038/nature15389. [DOI] [PMC free article] [PubMed] [Google Scholar]
- 15.Nitz D, McNaughton B. Differential modulation of CA1 and dentate gyrus interneurons during exploration of novel environments. J Neurophysiol. 2004;91:863–872. doi: 10.1152/jn.00614.2003. [DOI] [PubMed] [Google Scholar]
- 16.Leutgeb JK, Leutgeb S, Moser M-B, Moser EI. Pattern separation in the dentate gyrus and CA3 of the hippocampus. Science. 2007;315:961–966. doi: 10.1126/science.1135801. [DOI] [PubMed] [Google Scholar]
- 17.Diamantaki M, Frey M, Berens P, Preston-Ferrer P, Burgalossi A. Sparse activity of identified dentate granule cells during spatial exploration. eLife. 2016;5:e20252. doi: 10.7554/eLife.20252. [DOI] [PMC free article] [PubMed] [Google Scholar]
- 18.Burgalossi A, von Heimendahl M, Brecht M. Deep layer neurons in the rat medial entorhinal cortex fire sparsely irrespective of spatial novelty. Front Neural Circuits. 2014;8:74. doi: 10.3389/fncir.2014.00074. [DOI] [PMC free article] [PubMed] [Google Scholar]
- 19.Stefanelli T, Bertollini C, Lüscher C, Muller D, Mendez P. Hippocampal somatostatin interneurons control the size of neuronal memory ensembles. Neuron. 2016;89:1074–1085. doi: 10.1016/j.neuron.2016.01.024. [DOI] [PubMed] [Google Scholar]
- 20.Lee S-H, et al. Parvalbumin-positive basket cells differentiate among hippocampal pyramidal cells. Neuron. 2014;82:1129–1144. doi: 10.1016/j.neuron.2014.03.034. [DOI] [PMC free article] [PubMed] [Google Scholar]
- 21.Cai DJ, et al. A shared neural ensemble links distinct contextual memories encoded close in time. Nature. 2016;534:115–118. doi: 10.1038/nature17955. [DOI] [PMC free article] [PubMed] [Google Scholar]
- 22.Driscoll LN, Pettit NL, Minderer M, Chettih SN, Harvey CD. Dynamic reorganization of neuronal activity patterns in parietal cortex. Cell. 2017;170:986–999.e16. doi: 10.1016/j.cell.2017.07.021. [DOI] [PMC free article] [PubMed] [Google Scholar]
- 23.Tsao A, et al. Integrating time in the entorhinal cortex. Society for Neuroscience. 2017 084.21.2017. [Google Scholar]
- 24.Bittner KC, Milstein AD, Grienberger C, Romani S, Magee JC. Behavioral time scale synaptic plasticity underlies CA1 place fields. Science. 2017;357:1033–1036. doi: 10.1126/science.aan3846. [DOI] [PMC free article] [PubMed] [Google Scholar]
- 25.Peters AJ, Chen SX, Komiyama T. Emergence of reproducible spatiotemporal activity during motor learning. Nature. 2014;510:263–267. doi: 10.1038/nature13235. [DOI] [PubMed] [Google Scholar]
- 26.Brandalise F, Gerber U. Mossy fiber-evoked subthreshold responses induce timing-dependent plasticity at hippocampal CA3 recurrent synapses. Proc Natl Acad Sci USA. 2014;111:4303–4308. doi: 10.1073/pnas.1317667111. [DOI] [PMC free article] [PubMed] [Google Scholar]
- 27.Roy DS, et al. Memory retrieval by activating engram cells in mouse models of early Alzheimer’s disease. Nature. 2016;531:508–512. doi: 10.1038/nature17172. [DOI] [PMC free article] [PubMed] [Google Scholar]
- 28.Bernier BE, et al. Dentate gyrus contributes to retrieval as well as encoding: evidence from context fear conditioning, recall, and extinction. J Neurosci. 2017;37:6359–6371. doi: 10.1523/JNEUROSCI.3029-16.2017. [DOI] [PMC free article] [PubMed] [Google Scholar]
- 29.van Groen T, Miettinen P, Kadish I. The entorhinal cortex of the mouse: organization of the projection to the hippocampal formation. Hippocampus. 2003;13:133–149. doi: 10.1002/hipo.10037. [DOI] [PubMed] [Google Scholar]
- 30.Kheirbek MA, et al. Differential control of learning and anxiety along the dorsoventral axis of the dentate gyrus. Neuron. 2013;77:955–968. doi: 10.1016/j.neuron.2012.12.038. [DOI] [PMC free article] [PubMed] [Google Scholar]


