Abstract
Replication-dependent histones (RDH) are required for packaging of newly synthetized DNA into nucleosomes during S-phase when their expression is highly upregulated. However, the mechanisms of this upregulation in metazoan cells remain poorly understood. Using iCLIP and ChIP-seq, we found that human cyclin-dependent kinase 11 (CDK11) associates with RNA and chromatin of RDH genes primarily in the S-phase. Moreover, its N-terminal region binds FLASH, RDH-specific 3´end processing factor, which keeps the kinase on the chromatin. CDK11 phosphorylates serine 2 (Ser2) of the C-terminal domain (CTD) of RNA polymerase II (RNAPII), which is initiated at the middle of RDH genes and is required for further RNAPII elongation and 3´end processing. CDK11 depletion leads to decreased number of cells in S-phase, likely due to the function of CDK11 in RDH gene expression. Thus, the reliance of RDH expression on CDK11 could explain why CDK11 is essential for growth of many cancers.
Introduction
Transcription of protein-coding genes is mediated by RNA polymerase II (RNAPII) in several stages including initiation, elongation and termination 1–3. RNAPII contains an unstructured C-terminal domain (CTD) with a series of evolutionarily conserved heptapeptide (YSPTSPS) repeats, where the individual serines (Ser), threonine (Thr), and tyrosine (Tyr) can each be phosphorylated to regulate various RNAPII functions 4–6. Several kinases phosphorylate serine in position 2 (P-Ser2) 6,7. This modification promotes RNAPII elongation and is necessary for coupling transcription with co-transcriptional processes, such as 3´end processing 8–10.
Replication-dependent histone (RDH) proteins are required for packaging of newly synthetized DNA into nucleosomes before each cell division. Thus RDH genes have distinct regulation (and structure) from the rest of protein coding genes; they are expressed predominantly in S-phase and are short and intron-less. In humans there are approximately 80 genes localized in 2 genomic clusters. Their transcripts are the only cellular non-polyadenylated mRNAs, carrying instead a conserved stem loop (SL) at their 3´end 11. Expression of RDH genes is highly regulated by specific transcription and processing factors, including FLASH and SLBP proteins 12. The ongoing transcription is linked with cascade recruitment of mRNA processing factors that form a platform to position the histone cleavage complex (HCC) at the 3´end of the RDH genes 11. The HCC cleaves the pre-mRNA 5 nucleotides after the SL, in a single processing step typical for the intron-less RDH transcripts 13. Inefficient 3´end processing leads to transcriptional read-through and accumulation of small quantities of misprocessed and polyadenylated RDH transcripts (read-through RNAPII uses cryptic polyA sites) 13,14. Notably, depletion of transcription elongation factors or slow elongation by mutant RNAPII results in production of small amounts of RDH polyadenylated transcripts suggesting a link between transcriptional elongation and optimal 3´end processing 15–17.
As with other protein coding genes, the CTD of RNAPII participates in transcription and 3´end processing of RDH genes. Earlier studies suggested that CDK9-dependent P-Ser2 and P-Thr4 regulate RDH-specific 3´end processing without affecting their transcription 15,18,19. However, genome-wide analyses of Thr4/Ala CTD mutants demonstrated that P-Thr4 is needed for the global regulation of transcriptional elongation independently of CDK9 20. Thus it remains unclear if or how any CTD-modifying enzyme (kinase) regulates RDH-specific transcription.
CDK11 (cyclin-dependent kinase 11) acts in complex with cyclins L1 and L2 (CYCL1 and CYCL2) 21 and is expressed as two protein isoforms, CDK11p110 and CDK11p58 22. CDK11p58 is weakly expressed only in G2/M-phase of the cell cycle 23,24. In contrast, abundantly and cell cycle-independently expressed CDK11p110 differs from CDK11p58 in the presence of 380 amino acid long N-terminal region which carries many charged amino acids and has an unknown function 25. CDK11p110 is ubiquitously expressed in all tissues and the CDK11p110 null mouse is lethal at an early stage of development indicating an important role for CDK11p110 in the adult as well as during development 26. CDK11p110 (from here on CDK11) is believed to play a role in RNAPII-directed transcription and co-transcriptional mRNA-processing 27–29. However, its genome-wide function in regulating the human transcriptome is unknown. Notably, numerous recent studies identified CDK11 as a candidate essential gene for growth of several cancers 30–35. Therefore, understanding the molecular mechanism(s) of CDK11-dependent gene expression would be of significant clinical interest.
In this study we find that CDK11 specifically regulates the expression of RDH genes. It binds to RDH RNAs and FLASH and associates with chromatin of RDH genes in a cell cycle-dependent manner. We further demonstrate that CDK11 can phosphorylate Ser2 in the CTD of RNAPII positioned on the RDH genes to specifically control their transcriptional elongation and recruitment of 3´end processing factors.
Results
CDK11 binds chromatin of RDH genes and promotes their transcription
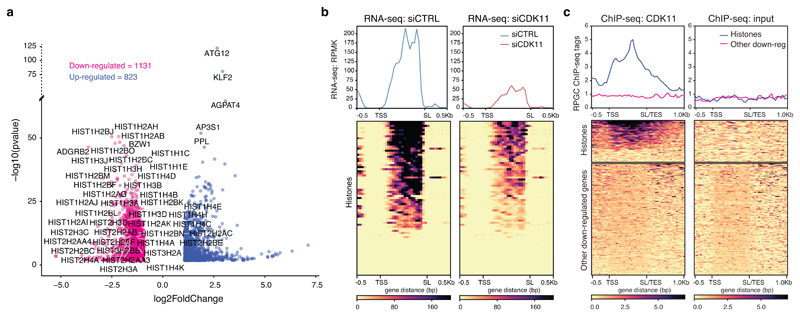
To understand the role of CDK11 in human gene expression, we performed RNA-seq analyses from nuclear extracts of HCT116 cells treated with either control or CDK11 siRNA. CDK11 depletion resulted in down-regulation of 1131 genes (log2FoldChange<-1, p-adj<0.01) (Fig. 1a, Supplementary Table 1), with enrichment in gene ontology (GO) terms for nucleosome and chromatin organization (Extended Data Fig. 1a, b), indicating a role for CDK11 in regulating histone gene expression. Strikingly, 93% of expressed RDH genes (Fig. 1a) were significantly downregulated (Fig. 1b), as confirmed by RT-qPCR for seven genes (Extended Data Fig. 1c, d). Nuclear run-on assays demonstrated a decrease in nascent mRNA of selected RDH genes in CDK11 knockdown cells (Extended Data Fig. 1e), indicating a transcriptional role of CDK11.
Figure 1. CDK11 binds chromatin of RDH genes and promotes their transcription.
a, RNA-seq analysis of HCT116 cells following siRNA-mediated CDK11 knockdown. Down- and up-regulated genes (-1>log2FoldChange>1; p-adj<0.01) are shown in red and blue, respectively. Symbols of 41 down-regulated RDH and 5 most up-regulated genes are shown for n=3 biologically independent experiments.
b, RNA-seq metaplots (top) and heatmaps (bottom) of the RDH genes in control (siCTRL) and CDK11 (siCDK11) siRNA treated cells. TSS=transcription start site; SL=stem loop.
c, CDK11 ChIP-seq on RDH and 200 other down-regulated genes. CDK11 and input data are from n=4 and n=3 biologically independent experiments, respectively. TSS=transcription start site, SL/TES=stem loop/transcription end site.
Next, we performed chromatin immunoprecipitation (ChIP-seq) to identify 393 peaks of CDK11 occupancy across the genome, which were enriched in GO terms for nucleosome and chromatin functions (Extended Data Fig. 1f). The peaks were present in 31 RDH genes, or 71% of expressed RDH genes (see Extended Data Fig. 1g), but not in the remaining down-regulated genes (Fig. 1c, Supplementary Table 2). We confirmed specificity of signal with ChIP-qPCR on selected RDH genes from cells treated with control and CDK11 siRNAs (Extended Data Fig. 1h). These results indicate that CDK11 is recruited to the chromatin of RDH genes to participate in their transcription.
FLASH recruits CDK11 to the RDH genes
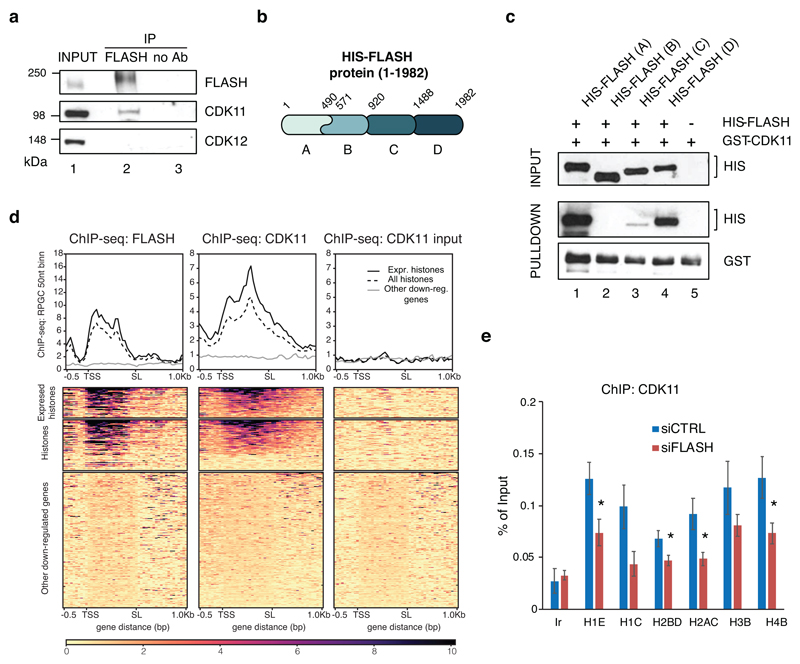
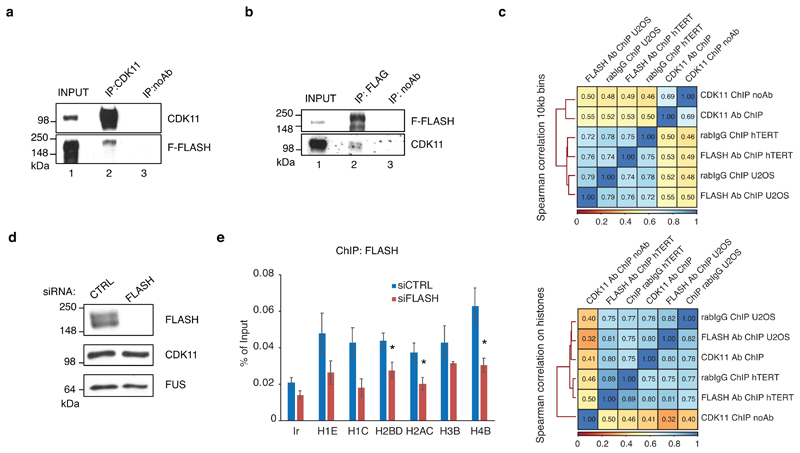
To understand how CDK11 is specifically recruited to the chromatin of RDH genes, we tested whether CDK11 interacts with any known RDH-specific factors. For instance, the serine/threonine-rich FLASH protein associates only with the chromatin of RDH genes to regulate RDH-specific transcription and 3´end processing 36,37. Notably, immunoprecipitation of endogenous FLASH resulted in a specific pulldown of CDK11 protein but not of CDK1238 (Fig. 2a). Reciprocal immunoprecipitation of endogenous CDK11 from a cell line expressing flag-tagged FLASH (F-FLASH) showed an interaction between the proteins (Extended Data Fig. 2a), and F-FLASH also immunoprecipitated endogenous CDK11 (Extended Data Fig. 2b), further confirming the result. To find whether interaction between FLASH and CDK11 is direct, we expressed his-tagged fragments of FLASH (Fig. 2b) in E. coli and performed GST pulldown assay with GST-CDK11 purified from insect cells. The N- and C-terminal fragments of FLASH showed strong binding to CDK11, indicating the direct interaction between both proteins (Fig. 2c). Moreover, we found a strong overlap between the CDK11 and FLASH36 ChIP-seq occupancies solely on RDH genes (Fig. 2d, Extended Data Fig. 2c), indicating that the two proteins interact when present on chromatin. To test if CDK11 recruitment depends on its interaction with FLASH we depleted FLASH from cells and measured CDK11 occupancy on RDH genes by ChIP-qPCR. This resulted in lower recruitment of CDK11 to the RDH genes (Fig. 2e) without affecting CDK11 protein levels (Extended Data Fig. 2d). Notably, the FLASH occupancy on the RDH genes was decreased comparably to the CDK11 occupancy (Extended Data Fig. 2e). Altogether, these results show that interaction with FLASH is needed for CDK11 recruitment to the RDH genes.
Figure 2. FLASH recruits CDK11 to the RDH genes.
a, Western blot analyses of immunoprecipitates of endogenous FLASH from HCT116 cells. The blots were probed with the indicated antibodies.
b, Depiction of human FLASH protein and four his-tagged deletion mutants expressed in bacteria. Deletion mutants A and B have an overlapping region between amino acids 490-571.
c, Western blot analyses of in vitro binding assays of GST-CDK11 purified from insect cells and his-tagged FLASH (HIS-FLASH) deletion mutants expressed in bacteria and depicted in Figure 2b.
d, FLASH ChIP-seq in hTERT cells (GSE69149) 36 (left panel) in comparison to CDK11 ChIP-seq (middle panel) and no Ab input control (right panel) on 44 regulated (expressed) RDH (RDH with base mean expression>10), all RDH and 200 other downregulated genes.
e, Endogenous CDK11 ChIP-qPCR on indicated RDH genes or control intergenic region (Ir) in HCT116 cells treated either with control (CTRL) or FLASH siRNAs for 24 h. n=3 biologically independent experiments, error bars=SEM, *P<0.05, Student´s two-sided t-test. Source Data for graphs in panel e are available with the paper on line.
CDK11 is recruited to RDH genes predominantly in S-phase
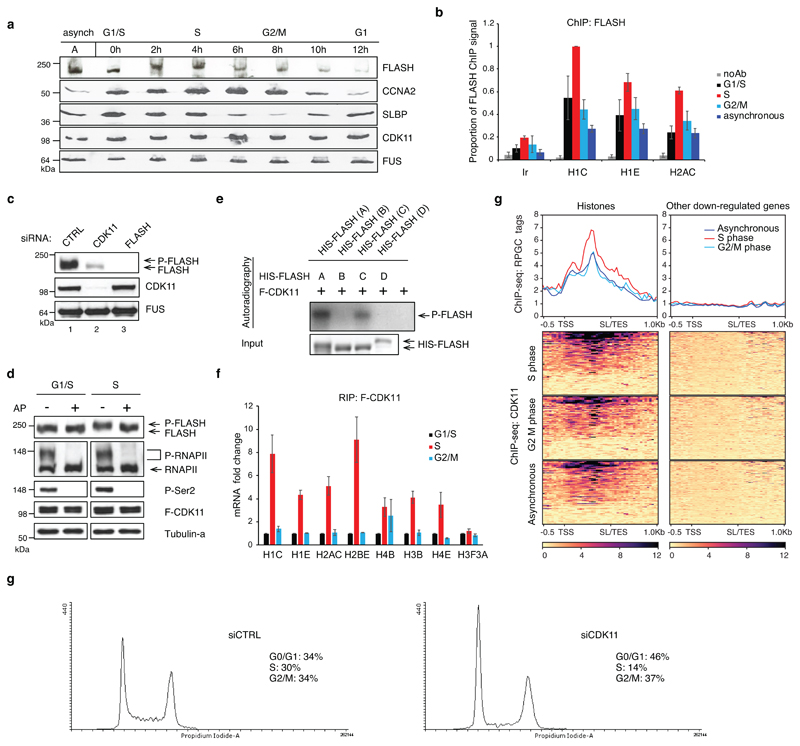
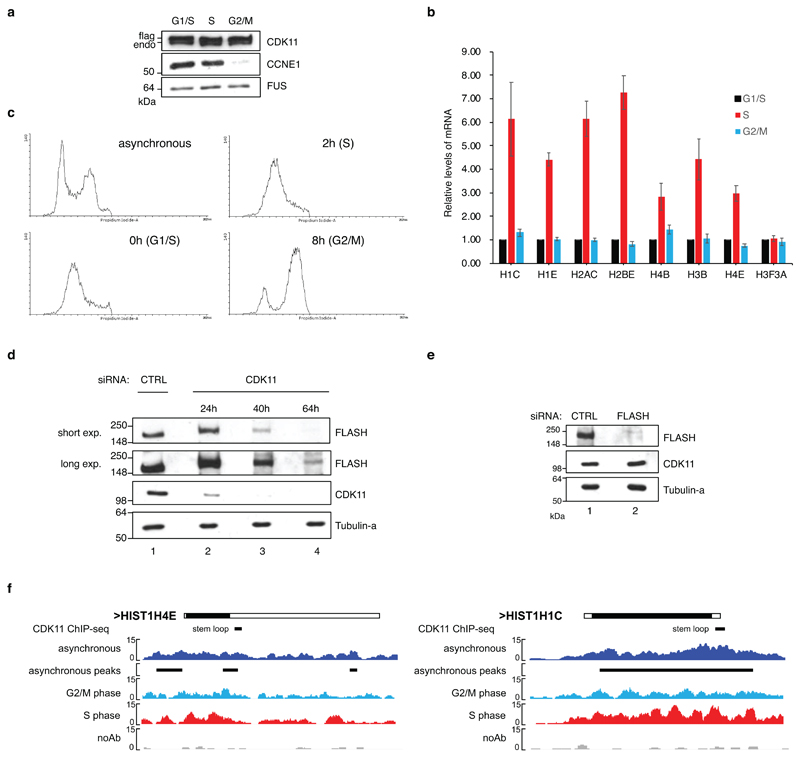
Transcription of RDH genes occurs mostly in S-phase 39. To understand if abundance and associations of FLASH and CDK11 with chromatin are cell cycle-dependent, we synchronized the cells by double thymidine treatment, which was confirmed by expression of cell cycle markers (Extended Data Fig. 3a), RDH transcripts (Extended Data Fig. 3b) and by flow cytometry (Extended Data Fig. 3c). The abundance and phosphorylation of FLASH, as evident by its slower mobility on the gel (Fig. 3a), and its occupancy on RDH genes (Fig. 3b) were highest in S-phase. Strikingly, CDK11 was required for the phosphorylation of FLASH in S-phase (Fig. 3a, c, d). In agreement, F-CDK11 can in vitro phosphorylate the N-terminal and central fragments of FLASH protein purified from bacteria (Fig. 3e). Notably, long treatments with CDK11 siRNA led to a strong decrease of FLASH protein levels (Extended Data Fig. 3d), whereas depletion of FLASH did not affect CDK11 protein levels (Extended Data Fig. 3e). Protein levels of CDK11 did not change during the cell cycle (Extended Data Fig. 3a, Fig. 3a), but it is enriched on RDH transcripts and chromatin in S-phase, as evident through F-CDK11 IP followed by RT-qPCR and ChIP-seq, respectively (Fig. 3f, g). For example, change is seen in HIST1H4E and HIST1H1C RDH genes (Extended Data Fig. 3f), but not on the control non-canonical histone H3F3A mRNA or on the non-RDH down-regulated genes identified from the RNA-seq experiment (Fig. 3f, g). Cell cycle analyses of CDK11-depleted cells manifested decreased numbers of cells in S- and their accumulation in G1-phase (Fig. 3h). The phenotype can result from deficient expression of RDH genes 40. Collectively, our findings demonstrate that interaction with FLASH ensures that CDK11 is recruited to RDH genes specifically in S-phase, CDK11 also phosphorylates and maintains protein levels of FLASH and depletion of CDK11 leads to accumulation of cells in G1-phase at the expense of S-phase.
Figure 3. CDK11 is recruited to RDH genes predominantly in S-phase.
a, Western blot analyses of extracts of HCT116 cells released from double thymidine synchronization. Time points after the release and cell cycle phases are indicated. Cell cycle phase markers: CCNA2=cyclin A2, SLBP. A=asynchronous cells, 0 h=time of the release.
b, FLASH ChIP-qPCR on selected RDH genes in asynchronous and G1/S, S and G2/M synchronised HCT116 cells. FLASH ChIP-qPCR signals are normalised to the maximum signal which was set as 1. n=3 biologically independent experiments, error bars=SEM, Ir=intergenic region.
c, Western blot analyses of FLASH and phosphorylated FLASH (P-FLASH) in cell lysates of HCT116 cells treated with either control or CDK11 or FLASH siRNAs for 48 h.
d, Western blot analyses of lysates of HCT116 cells synchronized by double thymidine treatment in G1/S-phase and released 2 h into the S-phase. The lysates were treated or were not with alkaline phosphatase (AP). The phosphorylated and dephosphorylated forms of FLASH and control RNAPII and Ser2 are indicated at right by clip marks and arrows, respectively. The blots were probed with indicated antibodies. P-FLASH, P-RNAPII and F-CDK11 are phosphorylated FLASH, RNAPII and Flag-tagged CDK11, respectively.
e, IVKA visualized by autoradiography (upper panel). His-tagged deletion mutants of FLASH expressed in bacteria were incubated with purified CDK11 in the presence of [γ-32P] ATP. P-FLASH=phosphorylated FLASH. Western blotting of inputs of FLASH deletion mutants (lower panel).
f, Graph displays RNA immunoprecipitation (RIP) of histone transcripts with F-CDK11 from HCT116 cells synchronized in G1/S-, S- and G2/M-phases. Graph shows fold change of CDK11 binding to RDH mRNA normalized to MAZ mRNA binding. mRNA levels in G1/S were set as 1 for each transcript. n=3 biologically independent experiments, error bars=SEM.
g, CDK11 ChIP-seq on the RDH and 200 other down-regulated genes in either HCT116 cells asynchronous or synchronized in S- or G2/M-phases. For asynchronous and S or G2/M n=4 and 2 biologically independent experiments, respectively.
h, Histograms of cell cycle analyses of HCT116 cells transfected with control (CTRL) or CDK11 siRNA for 36 h. Percentage of cells in G0/G1-, S- and G2/M-phases are displayed.
Source data for panels b and f are available with the paper on line.
RNA promotes CDK11 recruitment to the FLASH-containing RDH chromatin
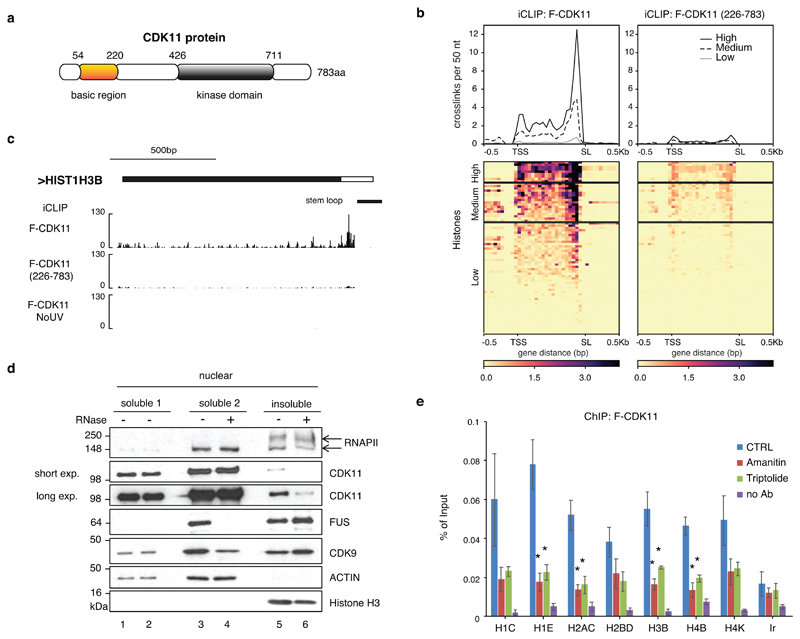
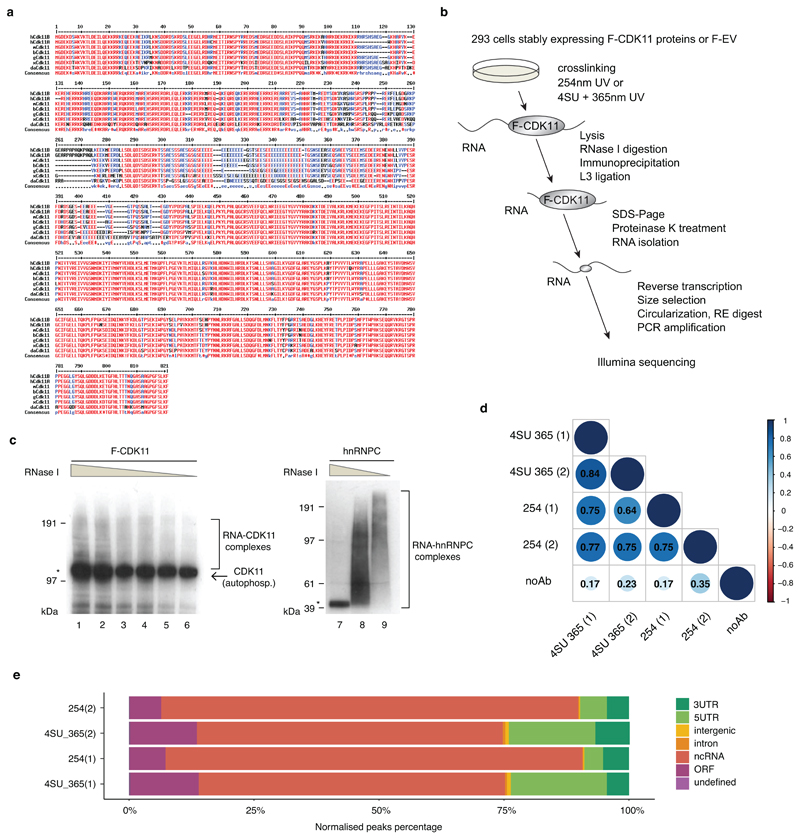
The N-terminal region (corresponding to amino acids 1-220) of human CDK11 is highly conserved, suggesting an important biological function (Extended Data Fig. 4a). It is rich in arginines and lysines, reminiscent of the intrinsically disordered regions that are common in non-canonical RNA-binding proteins 41 (Fig. 4a). Moreover, CDK11 was identified as a candidate RNA-binding protein in two proteome-wide screens 41,42. To examine the potential role of RNA binding in CDK11 functions, we performed individual-nucleotide resolution UV crosslinking and immunoprecipitation (iCLIP) (Extended Data Fig. 4b) 43 with an anti-Flag antibody from 293 cell lines stably expressing Flag-tagged CDK11 (F-CDK11), its N-terminal deletion mutant (F-CDK11226-783), or empty plasmid vector (F-EV) (Extended Data Fig. 4b, c). Two biological replicates of libraries crosslinked with 4-thiouridine (4SU) + 365nm UV or 254nm were prepared from cells carrying F-CDK11 and F-CDK11226-783, with no-antibody or no-UV as negative controls (Extended Data Fig. 4d, Supplementary Table 3). At least 5-15x more cDNAs were obtained from full length F-CDK11 compared to F-CDK11226-783 (FDR<0.05) (Supplementary Table 3), indicating that RNA interaction is mediated primarily by the conserved N-terminal region. The unique cDNA counts of four replicates of F-CDK11 iCLIP revealed high correlation (R2=0.64-0.84) (Extended Data Fig. 4d), and therefore we combined the replicates for further analyses. Largest proportion of binding was observed on noncoding RNAs (especially snRNAs) and 3’ UTRs of mRNAs (Extended Data Fig. 4e).
Figure 4. RNA promotes CDK11 recruitment to the RDH chromatin.
a, Schematic diagram highlighting the kinase domain and basic region of human CDK11 protein.
b, Metagene analyses of F-CDK11 and F-CDK11 (226-783) iCLIP binding at all RDH transcripts from the TSS to the SL. iCLIP data k-means clustered, based on RNA-seq expression (high, medium and low). n=4 biologically independent experiments.
c, Biodalliance genome browser view of F-CDK11, F-CDK11 (226-783) and uncrosslinked control (no UV) iCLIP binding at HIST1H3B transcript. Stem loop (SL) is indicated by a black line.
d, Western blot analysis of association of the indicated factors in soluble and insoluble fractions of chromatin either treated or not treated with RNase A/T1. Arrows mark phosphorylated (upper) and non-phosphorylated (lower) forms of RNAPII. For CDK11, long and short exposures of the film are shown.
e, CDK11 ChIP-qPCR on RDH genes in HCT116 cells expressing stably integrated F-CDK11 and treated either with Amanitin (4 μg/ml) or Triptolide (10 μM) or untreated (CTRL). n=4 biologically independent experiments, error bars=SEM, *P<0.05, Student´s t-test, Ir=intergenic region. Source data for panel e are available with the paper on line.
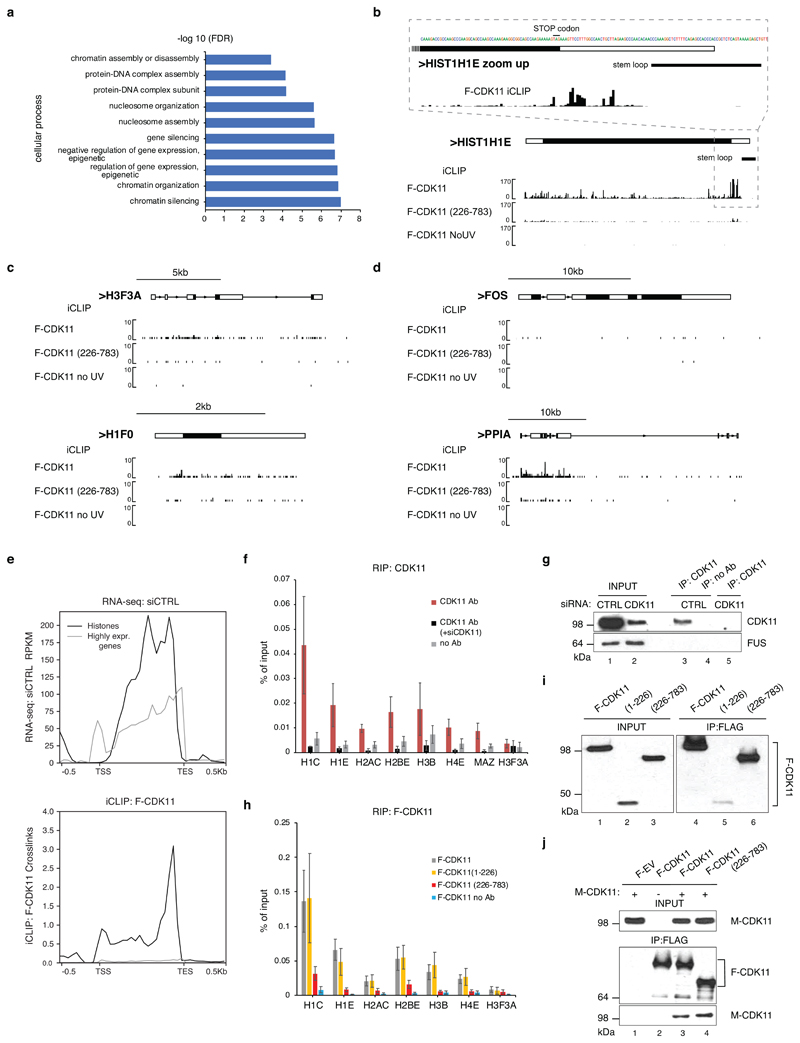
We analysed the density of iCLIP significant crosslink sites (iCount, FDR < 0.05) in mRNAs, which identified 371 mRNAs with highest density (CLIP crosslink density > 0.01, Supplementary Table 4) enriched in GO terms for nucleosome and chromatin organization (Extended Data Fig. 5a). Notably, 30 RDH mRNAs were among the 100 most bound transcripts (Supplementary Table 4). A metaplot of summarised F-CDK11 crosslinking, and examples of HIST1H3B and HIST1H1E mRNAs, show that F-CDK11 binds primarily at the 3’ends of RDH genes, just upstream of the conserved SL sequence (Fig. 4b, c, Extended Data Fig. 5b). Binding was strongly diminished in the F-CDK11226-783 mutant and absent in the uncrosslinked F-CDK11. In contrast, other abundant protein-coding mRNAs, including cell cycle-independent non-canonical histones, either do not bind CDK11 or have much weaker binding as compared to RNA-seq (Extended Data Fig. 5c, d, e), excluding scenario of false positive binding of highly expressed genes, such as RDH genes, in iCLIP assays 44. A comparison of CDK11 iCLIP to eCLIP data from ~200 proteins in the ENCODE database 44 indicates that CDK11 likely binds nascent mRNAs, suggesting it interacts with RDH transcripts during transcription (data not shown). The specificity of CDK11 enrichment on RDH transcripts and the importance of the N-terminal region was further validated with UV-RNA immunoprecipitation (UV-RIP) followed by RT-qPCR, using F-CDK11226-783, CDK11 knockdown, mock IP (no Ab) and the non-canonical histone H3F3A mRNA as controls (Extended Data Fig. 5f-i). We constructed myc-tagged variants to demonstrate that the residual association of F-CDK11226-783 with RDH mRNA (Extended Data Fig. 5h) most likely results from its interaction with full length CDK11 (Extended Data Fig. 5j). We could not identify any strongly enriched unique sequence motif at CDK11-binding sites (data not shown), a situation common for non-canonical RNA-binding proteins.
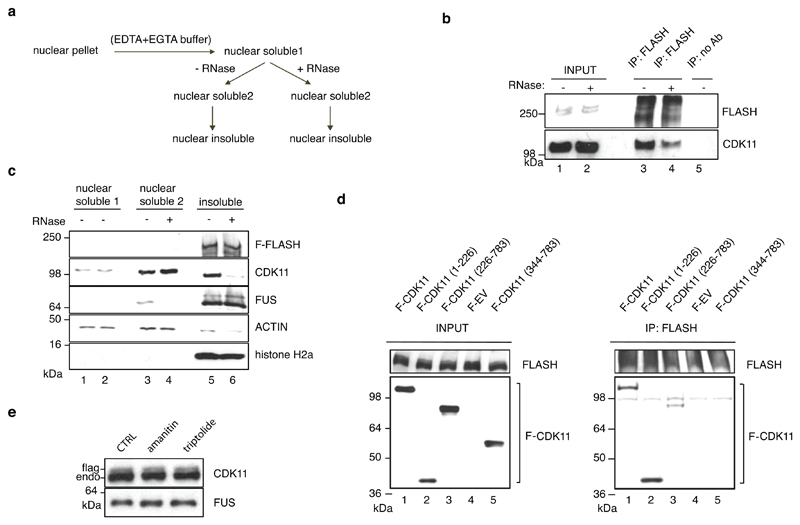
To understand if RNA binding contributes to the association of CDK11 with chromatin, we performed subnuclear fractionation 45, which was then either left untreated or incubated with RNases before further fractionating it into nucleoplasmic (soluble2) and chromatin (nuclear insoluble) fractions (Extended Data Fig. 6a). Optimal fractionation was verified by the presence of phosphorylated RNAPII and histone 3 (H3) only in the chromatin fractions (Fig. 4d). CDK11 was found in both nuclear soluble (1&2) and chromatin fractions (Fig. 4d), in agreement with a previous study 21. Importantly, RNase treatment disengaged CDK11 from the chromatin fraction, in contrast to the proteins CDK9 and FUS, which were disengaged from the soluble2 fraction (Fig. 4d) 45. In agreement with the reliance of the CDK11-chromatin interaction on RNA (Fig. 4d), the interaction between CDK11 and FLASH was partly RNase-sensitive (Extended Data Fig. 6b) even though chromatin association of FLASH was not dependent on RNA (Extended Data Fig. 6c). In concordance, CDK11 binds FLASH via its N-terminal RNA-binding region (Extended Data Fig. 6d). Moreover, RNAPII transcription inhibition with either Amanitin or Triptolide led to considerable dissociation of CDK11 from chromatin (Fig. 4e) without affecting CDK11 proteins levels (Extended Data Fig. 6e). Thus, both RNA and active transcription are essential to bring CDK11 to the FLASH-containing RDH chromatin.
CDK11 promotes elongation of RDH genes
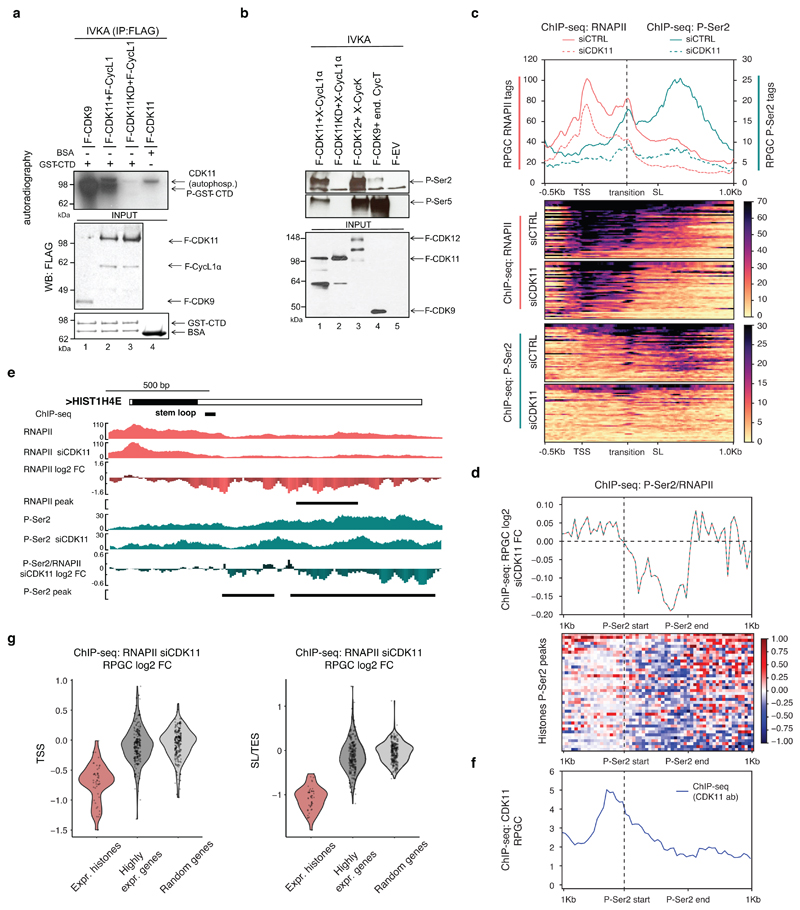
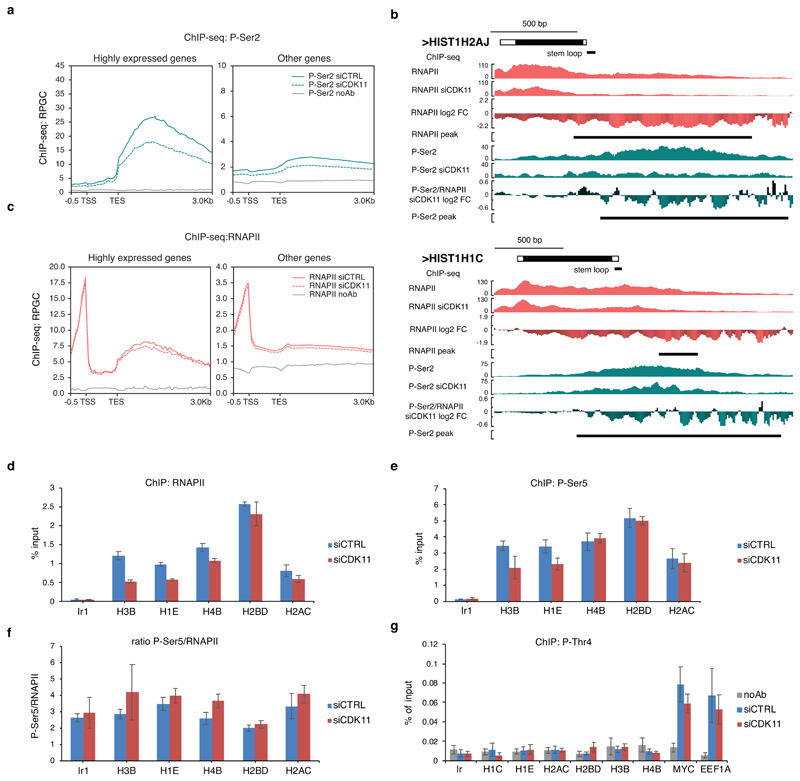
CDK11 can phosphorylate the CTD of RNAPII in vitro 46, and Ser2 in the CTD during HIV transcription 47. We used an in vitro kinase assay (IVKA) to verify that CDK11 phosphorylates GST-CTD, albeit its activity was weaker compared to the canonical and well characterized CDK9 48 (Fig. 5a). Next, we used P-Ser2 and P-Ser5 phospho-specific antibodies to find that CDK11 phosphorylated both Ser2 and Ser5, whereas the negative controls F-EV and CDK11 kinase dead (CDK11 KD) led to no phosphorylation (Fig. 5b). CDK9 primarily phosphorylated Ser5, and CDK12 phosphorylated both Ser2 and Ser5, which agrees with expectations (Fig. 5b) 49. P-Ser2 is associated with elongating RNAPII 4 and P-Ser2 ChIP-seq signal accumulates at the 3´ends of all genes (Extended Data Fig. 7a), including RDH genes (Fig. 5c), resembling CDK11 iCLIP and ChIP-seq profiles on RDH genes (Fig. 4c, Extended Data Fig. 1g, respectively). CDK11 knockdown led to a collapse of the P-Ser2 signal on RDH genes (Fig. 5c-e, Extended Data Fig. 7b, Supplementary Table 5), with a much lower (~30%) decrease on highly expressed genes, and little effect on all other genes (Extended Data Fig. 7a). Notably, P-Ser2 ChIP-seq signal starts accumulating close to the middle of RDH gene bodies (Fig. 5c), which coincides with the peak of CDK11 ChIP-seq signal (Fig. 1c, 5d, f), suggesting that a “transition” point in transcriptional elongation is located approximately in the middle of RDH genes (Fig. 5c). CDK11 depletion led to the decline in P-Ser2 occupancy (Fig. 5c) from this “transition” point onward (Fig. 5c, d, f) and to the decrease of RNAPII occupancy specifically on RDH genes (Fig. 5g, Supplementary Table 6). However, the decrease in total RNAPII levels was smaller than in P-Ser2 levels (Fig. 5c-e, Extended Data Fig. 7b, c) and no significant changes were seen in P-Ser5 or P-Thr4 signal on selected RDH genes (Extended Data Fig. 7d-g) 18. This indicates that CDK11 is required primarily for the onset of Ser2 phosphorylation at the “transition” point in RDH genes, which is essential for their productive elongation (Fig. 5c).
Figure 5. CDK11 promotes transcriptional elongation of RDH genes.
a, GST-CTD or BSA was incubated with the indicated cyclins/CDKs in the presence of [γ- 32P] ATP, the resulting kinase reactions (IVKA) were resolved on SDS-PAGE gel and visualized by autoradiography. Phosphorylated GST-CTD (P-GST-CTD) and autophosphorylated CDK11 is shown (upper panel). Equal input of flag-tagged cyclins/CDKs and GST-CTD to the IVKA were confirmed by western blotting with anti-flag antibody (middle panel) or by Coomassie staining (lower panel), respectively.
b, Displayed cyclins/CDKs purified from HCT116 cells were incubated with GST-CTD in IVKA. Phosphorylation was monitored by the indicated antibodies by Western blotting (upper panel). Input of equal amounts of flag-tagged CDKs into IVKA was validated by flag antibody (lower panel). F=flag tag, X=xpress tag, KD=kinase dead mutant, end=endogenous, EV=empty vector.
c, ChIP-seq analyses of RNAPII and P-Ser2 occupancies on expressed RDH genes in HCT116 cells treated with either control (CTRL) or CDK11 siRNA. Transcription elongation “transition” point is indicated by dashed line. n=3 biologically independent experiments.
d, P-Ser2/RNAPII normalized ChIP-seq log2 fold change on RDH genes after CDK11 knockdown within differential P-Ser2 MACS2 peaks (depicted as P-Ser2 start (vertical dashed line) and P-Ser2 end).
e, HIST1H4E gene tracks with raw RNAPII and P-Ser2 ChIP-seq data and RNAPII, P-Ser2 and P-Ser2/RNAPII log2 fold change after CDK11 depletion. Black line indicates differential peaks identified by MACS2 program (p<0.05).
f, CDK11 ChIP-seq occupancy is most abundant just upstream of the differential P-Ser2 MACS2 peaks in RDH genes. The start of the P-Ser2 peaks is indicated by vertical dashed line (see also Fig. 5d for metaplot and heatmap).
g, Violin-plots measure RNAPII occupancy on the TSS (top panel, flank 500 nt) and SL or TES (bottom panel, 250 nt upstream and 750 nt downstream) of expressed RDH and 200 highly expressed and randomized genes.
CDK11 promotes 3´end processing of RDH genes
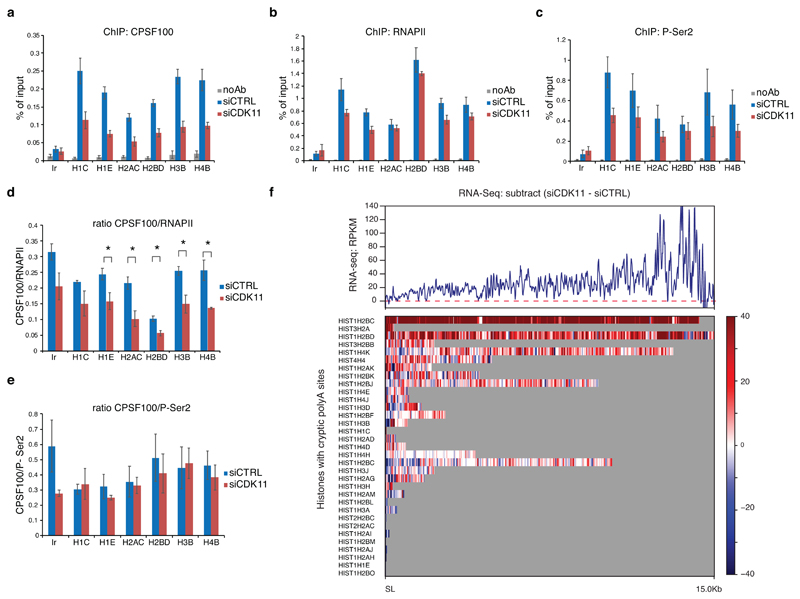
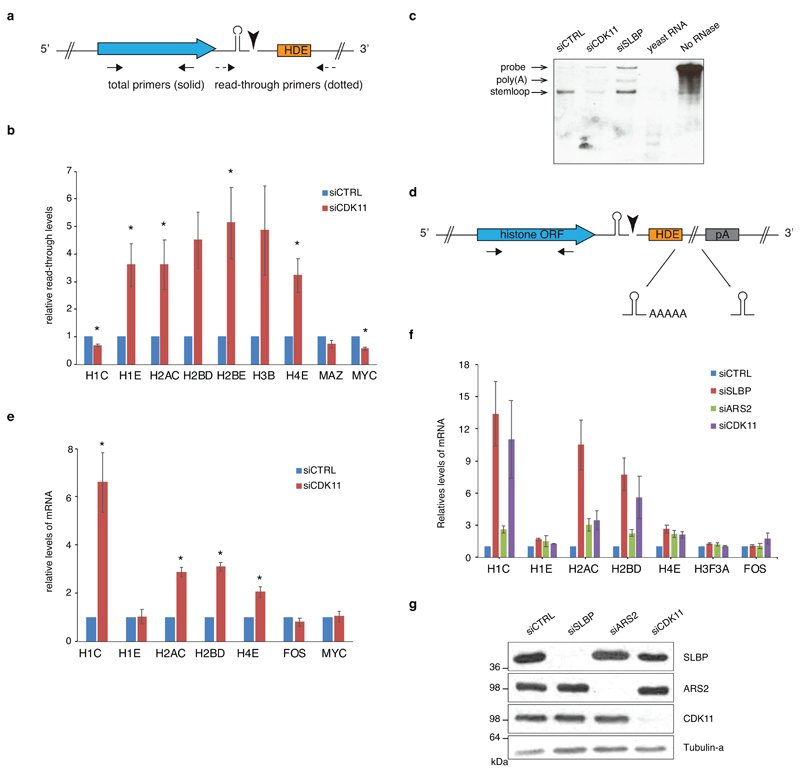
Slow RNAPII elongation disrupts RDH mRNA processing 17 and Ser2-phosphorylated CTD serves as a binding platform for factors involved in 3´end formation and processing 10. Indeed, following CDK11 depletion, the occupancy of CPSF100, a component of the HCC 13, (Fig. 6a) decreased on all tested RDH genes to a similar extent as P-Ser2, and more than RNAPII (Fig. 6a-e). We also observed an increase by a factor of 3-5 in read-through (uncleaved) RDH transcripts (Fig. 6f, Extended Data Fig. 8a, b, Supplementary Table 7). No increase in read-through transcript was seen in non-RDH bound genes (MYC, MAZ) and one RDH gene HIST1H1C, which contains a cryptic polyA signal immediately downstream of the SL 50 that becomes increasingly used upon CDK11 knockdown (Extended Data Fig. 8b). This phenomenon of increased cryptic polyA use was additionally observed in HIST1H2AC, HIST1H2BD and HIST1H4E genes, and could be induced also by depletion or inhibition of CDK9 15, CDK7 51, ARS2 52 and SLBP 53, which contribute to transcription and mRNA processing of RDH genes (Extended Data Fig. 8c-g, Supplementary Table 7). The small changes in read-through and/or use of cryptic polyadenylation sites are thus a likely result of defective 3´end processing upon CDK11 knockdown. We conclude that the CDK11-dependent phosphorylation of Ser2 is required for efficient elongation and 3’ end processing of RDH genes.
Figure 6. Recruitment of 3´ end processing factor CPSF100 to the RDH genes depends on CDK11-mediated phosphorylation of Ser2.
a, b, c, Graphs present ChIP-qPCR data for CPSF100 (a), RNAPII (b) and P-Ser2 (c) in HCT116 cells transfected with control (siCTRL) or CDK11 (siCDK11) siRNA. qPCR primers were designed in coding regions of RDH genes. n=4, n=3 and n=3 biologically independent experiments for (a), (b) and (c), respectively; error bars=SEM, Ir = intergenic region.
d, e. Graphs present ratios of CPSF100/RNAPII (d) and CPSF100/P-Ser2 (e) ChIP-qPCR signals. n=4 and 3 biologically independent experiments for (d) and (e), respectively; error bars=SEM, *P<0.05, Student´s two-sided t-test.
f, Subtracted RNA-seq (siCDK11 - siCTRL) RPKM normalized downstream of the SL until the next conserved polyadenylation site (33 RDH genes; distance from 27 nt to 15 kb) (upper panel). The read-through is depicted for indicated individual RDH genes carrying cryptic polyadenylation site downstream of SL (lower panel).
Source data for panels a-e are available with the paper on line.
Discussion
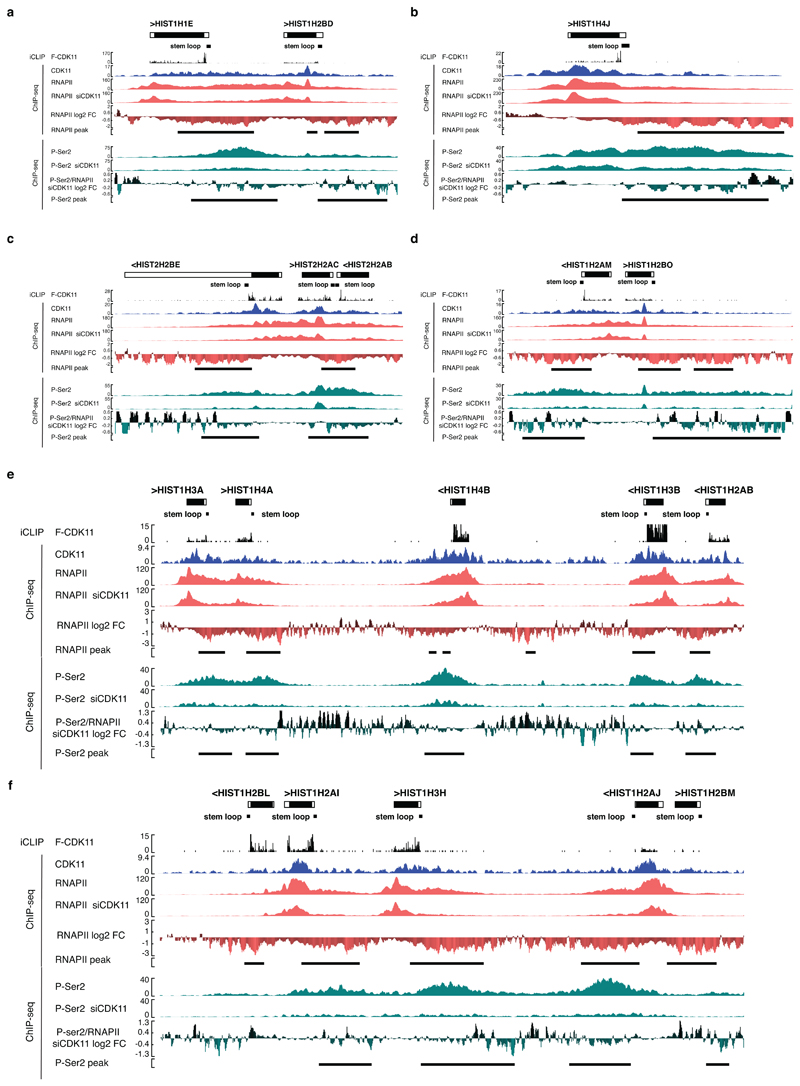
Our study reveals that CDK11 interacts with FLASH, a factor which has been known to be present only at RDH genes36. We show that FLASH promotes selective recruitment of CDK11 to RDH genes predominantly in the S-phase. CDK11 occupies coding regions of RDH genes; the binding is strongest at the “transition” point close to the middle of the RDH genes, where it coincides with accumulation of P-Ser2 (Fig. 5c, d), which in turn promotes efficient elongation and 3´end processing of RDH transcripts (summary of genome-wide data, working model and iCLIP- and ChIP-seq data on example RDH genes are presented in Fig. 7a, b and Extended Data Fig. 9a-f, respectively). CDK11 occupancy on RDH genes does not overlap with promoter-paused RNAPII (Fig. 1c, 5c) hence CDK11 likely does not mediate RNAPII transition to early elongation, the step regulated by CDK9 on most protein-coding genes48. CDK11 phosphorylates GST-CTD in vitro, but less efficiently than CDK9 or CDK12 (Fig. 5a and data not shown), indicating that it might phosphorylate just a subset of CTD repeats, which could ensure an RDH-specific function of CDK11 in RNAPII-mediated transcription. CDK11 also phosphorylates FLASH, perhaps regulating FLASH stability however the exact in vivo function(s) of the phosphorylation(s) remains to be determined. We find that the arginine-rich N-terminus of CDK11 contacts RNA, we used iCLIP to identify its binding to RDH transcripts, particularly strong at their 3´ends, and we show that such RNA binding helps to maintain CDK11 on chromatin (Fig. 7a, b, Extended Data Fig. 9a-f).
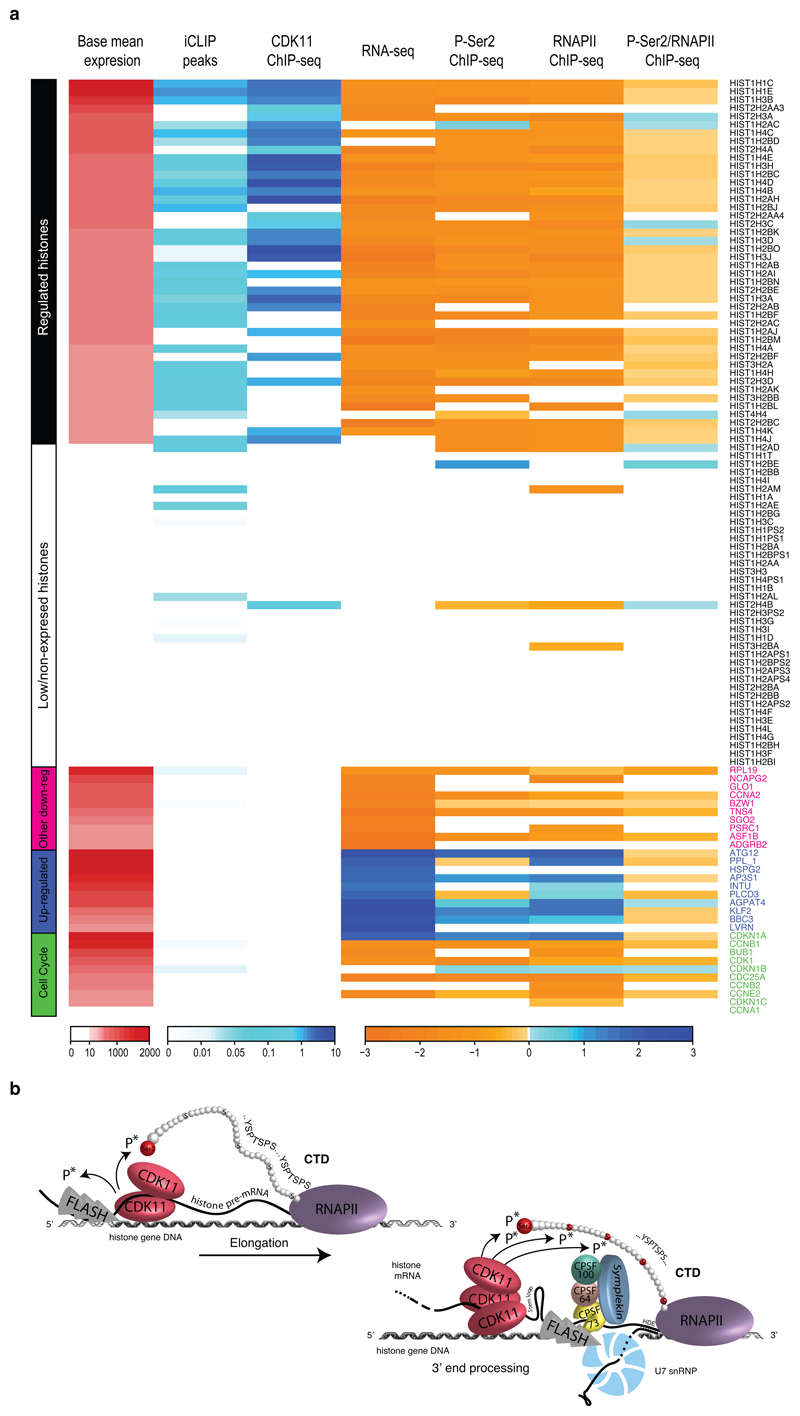
Figure 7. Summary of iCLIP and ChIP-seq data and working model.
a, Each column in the table depicts distribution of iCLIP and ChIP-seq peaks over selected genes either affected or not in CDK11 RNA-seq (Fig. 1a). See Online Methods for further description. The colors of each column represent the following: the density of iCLIP significant cDNA crosslinks (FDR > 0.01), normalized by gene length; the density of CDK11 ChIP–seq bound RPGS inside MACS2 significant peaks (P < 0.05; Supplementary Table 2); log2(fold change) of differentially expressed genes in CDK11 RNA-seq (–1 > log2(fold change) > 1; adjusted P < 0.01; Supplementary Table 1); log2(fold change) of P-Ser2 ChIP–seq RPGC after CDK11 depletion inside the MACS2 differential peaks (P < 0.05; Supplementary Table 5); log2(fold change) of RNAPII ChIP–seq RPGC after CDK11 depletion inside the MACS2 differential peaks (P < 0.05; Supplementary Table 6); and log2(fold change) of P-Ser2/RNAPII-normalized ChIP–seq RPGC after CDK11 depletion inside the MACS2 P-Ser2 differential peaks (P < 0.05; Supplementary Table 5). The groups of genes: 44 regulated RDH (base mean expression>10); 39 low- and non-expressed RDH (base mean expression<10); 10 most down- and up-regulated genes in CDK11 RNA-seq (in fuchsia and blue, respectively), 10 selected cell cycle-related genes (in green). All genes were sorted by base mean expression within each group. Gene symbols are shown on the right.
b, Schematic working model. CDK11 regulates transcription elongation of RDH genes and contributes to their 3´end processing. FLASH (grey flash) recruits CDK11 (red oval) collaboratively with nascent RDH mRNAs (black line) to chromatin of RDH genes (grey double helix) and phosphorylates (arrow) Ser2 (red ball) in the CTD (red and grey balls) of RNAPII (violet oval). The Ser2 phosphorylation promotes the RNAPII elongation on RDH genes. CDK11 also phosphorylates FLASH in S-phase which may be needed for its stability and/or yet unknown function in transcription/3´end processing of RDH genes. CDK11 is bound abundantly at the 3´end of RDH mRNAs and this binding likely occurs on or in the close vicinity of RDH chromatin. CDK11-dependent phosphorylation of Ser2 contributes to the recruitment of 3´end processing HCC complex (SYMPLEKIN (blue oval), CPSF100 (green circle), CstF64 (brown circle) and CPSF73 (yellow circle) allowing CPSF73 to cleave nascent RDH mRNA (black line). FLASH interaction with U7 snRNP (white/blue circular complex) also contributes to the recruitment of the HCC to pre-mRNA 11.
CDK11 homolog is absent from yeast Saccharomyces cerevisiae, while the CDK11 homolog in Schizosaccharomyces pombe contains only the kinase domain without the N-terminus 54. CDK11 is an essential gene in metazoans 26, but not in S. pombe 54,55, possibly because yeast species transcribe RDH genes only in the S-phase, and all RDH mRNAs are polyadenylated 56. Thus, the role of CDK11 in promoting S-phase specific RDH transcriptional elongation and processing appears to have evolved only in metazoans. We conclude that the RNA binding capacity contributes to maintaining metazoan CDK11 close to chromatin, where it further achieves specificity for RDH genes through direct interactions with FLASH.
Downregulation of RDH mRNAs by knockdown of various RDH-specific transcription/3´end processing factors causes a disruption of cell cycle by accumulation of cells in either G1- or early S-phase (this study, Fig. 3h and 12,40,57). Alternatively, the downregulation can be explained by the reduction of number of cells in S-phase (when RDH expression occurs). Although we cannot completely exclude a direct role of CDK11 in regulation of cell cycle progression, it´s binding to RDH chromatin and nascent transcripts and interaction with FLASH strongly suggests direct and specific function in RDH transcription. CDK11-specific inhibitor (when available) will allow to determine whether the kinase also directly regulates cell cycle progression. As P-CTD-specific antibodies have limitations in recognition of the specific epitopes 58, the inhibitor in combination with mass spectrometric analyses 59 can be also used for identification of any CDK11- or RDH- specific-P-CTD pattern.
Altogether, considering the fundamental role of RDH gene expression for cellular replication and proliferation, the mechanism identified in our study could underlie the essential role of CDK11 in many cancers 25,32,33, and could serve as a framework for developing CDK11 inhibitors with therapeutic potential. Indeed, when this paper was in revision, the first potent CDK11 inhibitor was reported, identified as the mischaracterized anticancer agent 60.
Online Methods
Plasmid construction
Plasmid containing human CDK11 (GenBank Accesion number: AAC72077) was obtained from Dr. J. Lahti lab (Memphis, Tennessee). CDK11 cDNA was sub-cloned into HindIII and XhoI restriction sites of doxycycline inducible pcDNA5/FRT/TO plasmid (Thermo Fisher Scientific) in frame with 5’flag or 5’myc tag. CDK11 deletion mutants were prepared using QuikChange II XL Site-Directed Mutagenesis Kit (Agilent, #200522) according to the manufacturer´s protocol. Primers for the mutagenesis were designed to flank the region to be deleted.
Complete list of plasmids used in the study is in the Supplementary Table 8
Cell Culture
Human colorectal HCT116 Flp-in cell line (gift from Dr. B. G. Wouters, Toronto, Canada), 61 293 Flp-in cell line (Thermo Fisher Scientific, R75007) and HCT116 cell line were all maintained in DMEM/high glucose media supplemented with L-glutamine, sodium pyruvate and 5% FBS at 37°C and 5% CO2. Cell lines were not tested for mycoplasma.
To prepare cell lines stably expressing CDK11 proteins, 293 Flp-in or HCT116 Flp-in cells were transfected with corresponding CDK11 plasmids. Resistant colonies were selected with 100 μg/ml (293 Flp-in) or 175 μg/ml (HCT116 Flp-in) of hygromycin (Thermo Fisher Scientific, 10687-010) and two weeks later individual clones were expanded. Expression of transgene was induced with 1 μg/ml of doxycycline (Sigma, D3072) and verified by western blotting. Transgenic CDK11 protein expression levels were always lower or equal when compared to the endogenous CDK11 expression.
Complete list of cell lines used in the study is in the Supplementary Table 8.
Cell synchronization
HCT116 cells were synchronized with a double thymidine block method. Briefly, cells were blocked with 2 mM thymidine (Sigma, T1895) for 16 h, washed twice with PBS, released into fresh media for 8 h and blocked again with 2 mM thymidine for 16 h. Finally, cells were released into fresh media. G1/S, S and G2/M cells were collected at 0 h, 2 h and 8 h after the release from the second thymidine block, respectively. Progression into the different cell cycle phases was verified by flow cytometry (propidium iodide staining). Briefly, cells were trypsinized, washed twice with PBS, fixed with 70% ethanol and stored at -20°C. At the day of measurement the cells were washed twice with PBS, resuspended in Vindal buffer (10 mM Tris-Cl, pH 8, 1 mM NaCl, 0.1% TritonX-100), treated with RNase A (200 μg/ml) and stained with propidium iodide (50 μg/ml) at 37°C for 30 min. Cell cycle profiles (propidium iodide area versus count) were measured with BD FACSVerse and analysed with BD FACSuite software.
siRNA-mediated knockdown
Cells were usually plated at 30% confluency 6-10 h before transfection. Cells were transfected with siRNA at a final concentration of 10 nM (20 nM for FLASH) using Lipofectamine RNAiMax (Thermo Fisher Scientific, 13778-150) according to the manufacturer´s instructions. Briefly, to transfect one well in 6-well plate, we mixed 2.5 μl of siRNA (10 μM stock solution) diluted into 250 μl of Opti-MEM (Thermo Fisher Scientific, 31985-070) together with 5 μl of Lipofectamine diluted into 250 μl of Opti-MEM. After 15 min the mixture was added dropwise into the cultured cells with 2 ml of media. If larger plates were used for transfections, the amount of reagents was scaled up proportionally. Control samples were transfected with non-targeting control siRNA-A (Santa Cruz, sc-37007). The level of protein depletion was always verified by western blotting with appropriate antibodies.
The list of siRNAs used in this study is specified in Supplementary Table 9.
Reverse transcription qPCR (RT-qPCR)
RNA was isolated with Tri-Reagent (MRC, #TR118) according to the manufacturer´s instructions. RNA analysed by reverse transcriptase-quantitative polymerase chain reaction (RT-qPCR) was first treated with 1 μl of DNase (Sigma, AMPD1). Usually 1μg of total RNA was then reverse transcribed using 200 U SuperScript II RT (Thermo Fisher Scientific, 18064-014), 1 μl of either random hexamers (IDTDNA, 50 μM stock) or 5’Phos oligo(dT)20 (IDTDNA, 50 μM stock). Resulting cDNA was further diluted with water (40x) and 5 μl of diluted cDNA served as a template for each qPCR reaction using SYBR Green JumpStart TaqReadyMix (Sigma, S4438) with the following parameters: 95°C for 2 min followed by 45 cycles of denaturation at 95°C for 15 s, annealing at 55°C for 30 s and extension at 72°C for 30 s. All primer sequences used in this study are specified in Supplementary Table 10. The untreated sample (or siRNA-A treated sample) served as a reference and the PPIA mRNA was used for normalization of cDNA synthesis unless stated otherwise in the text. qPCR were performed in triplicate for each biological replicate and error bars represent standard error of the mean of three biological replicates (unless stated otherwise in the text).
CDK11 dimerization assay
293 cells were co-transfected by PEI transfection reagent with 7 μg of M-CDK11 plasmids and 7 μg of plasmid expressing indicated F-CDK11 proteins. Media was changed 3 h after transfection. Cells were harvested 48 h after transfection, washed twice with PBS and lysed in HEPES buffer (20 mM HEPES-KOH, pH 7.9, 150 mM KCl, 0.2% NP-40, 15% glycerol, 1 mM DTT and protease inhibitors, Sigma, P8340). Equal amounts of clarified extracts (10,000g for 10 min) were incubated with 15 μl of packed flag agarose M2 affinity beads (Sigma, A2220) rotating for 2 h at 4°C. Samples were then washed three-times with HEPES buffer (rotating for 5 min at 4°C during each wash). After the last wash the remaining buffer was carefully removed and immunocomplexes were eluted by boiling in 50 μl of 3xLaemmli sample buffer. Following SDS-PAGE, immunoblotting was performed using FLAG (Sigma, F3165), MYC (Sigma, M4439) and FUS (Santa Cruz, sc47711) antibodies.
iCLIP-seq
iCLIP was performed as previously described 62 with only minor modifications described below. Briefly, F-CDK11 293 Flp-in cells as well as F-CDK11 (226-783) 293 Flp-in cells were plated onto 150 cm2 plates to reach 75% confluency at the day of crosslinking. CDK11 was induced with 1 μg/ml of doxycycline 24 h before crosslinking. We used two methods to crosslink RNA and proteins: either by UV-C (254 nm, 200 mJ/cm2) or by UV-A (365 nm, 200 mJ/cm2) after 100 μM final concentration of 4-thiouridine (Sigma, T4509) was added to the cells 6-8 h prior to the crosslinking. Cells from one 150 cm2 plate were used per one immunoprecipitation and two technical replicates were performed for each condition, both of them were mixed together after reverse transcription step. Composition of all buffers was the same as described in 62. Each cell pellet (originally from one 150 cm2 plate) was lysed in 1 ml of lysis buffer and the lysate was homogenized by passing three-times through an insulin syringe (B.BROWN, Omnican U-100, 32G). Lysate was treated with 4 U/ml Turbo DNase (Thermo Fisher Scientific, AM2238), 12 U/ml RNase I (Thermo Fisher Scientific, AM2295) shaking at 1100 rpm and 37°C for 3 min. Clarified extracts (21000g for 30 min) were incubated for 2 h with 2 μg of flag antibody (Sigma, F1804) pre-bound to 50 μl of protein G Dynabeads. After series of stringent washes, adenylated L3 RNA adapter was ligated to the 3’end of crosslinked RNAs. Crosslinked protein-RNA complexes were resolved by SDS-PAGE (NuPAGE 4-12% Bis-Tris Protein Gel, Thermo Fisher Scientific, NP0322) and transferred to nitrocellulose membrane. The region of the membrane containing the radioactively labelled crosslinked protein–RNA complexes was excised, RNA was isolated and reverse transcribed to cDNA (technical replicates were mixed together after this step). cDNA was size-selected using urea denaturing gel electrophoresis and three fractions running between 70-85 nt (L-low), 85-120 nt (M-medium) and 120-200 nt (H-high) were isolated. Each fraction was independently circularized by single-stranded DNA ligase, annealed to an oligonucleotide complementary to the restriction site and cut between the two adapter regions by BamHI. After final PCR amplification using P3 and P5 Solexa primers all three fractions were pooled together in ratio 1:5:5 (L:M:H). Multiplexed libraries were sequenced as 50bp single-end reads on Illumina sequencer (EMBL, Heidelberg).
Chromatin immunoprecipitation (ChIP-qPCR)
ChIP was performed with antibodies indicated in the Supplementary Table 11. Briefly, 20 μl of protein G Dynabeads (Thermo Fisher Scientific, 10009D) per one immunoprecipitation were pre-blocked with 0.2 mg/ml BSA (Thermo Fisher Scientific, AM2616) and 0.2 mg/ml salmon sperm DNA (Thermo Fisher Scientific, 15632-011) for 4 h, washed 3 times with RIPA buffer (50 mM Tris-Cl, pH 8, 150 mM NaCl, 5 mM EDTA, 1% NP-40, 0.5% sodium deoxycholate, 0.1% SDS, supplemented with protease inhibitors, Sigma, P8340), followed by the incubation with specific antibody for at least 4 h at 4°C. HCT116 cells were plated onto 150cm2 plates to reach 75% confluency at the day of experiment. Cells were crosslinked with 1% formaldehyde for 10 min, reaction was quenched with glycine (final concentration 125 mM) for 5 min. Cells were washed twice with ice-cold PBS, scraped, and pelleted. Each 20 μl packed cell pellet was lysed in 650 μl of RIPA buffer and sonicated 20 x 7s (amp 0.85) using 5/64 probe (QSonica Q55A). Clarified extracts (13,000g for 10 min) were precleared with protein G Dynabeads (Thermo Fisher Scientific, 10009D) rotating for 2-4 h at 4°C and then incubated overnight with antibody pre-bound to protein G Dynabeads. We used 600 μl of clarified extract to immunoprecipitate CDK11, CPSF100, FLASH and P-Thr4 and 300 μl of clarified extract for RNAPII, P-Ser5 and P-Ser2. 10% of clarified extract was saved and used as input DNA. Next day beads were washed sequentially with low salt buffer (20 mM Tris-Cl, pH 8, 150 mM NaCl, 2 mM EDTA, 1% TritonX-100, 0.1% SDS), high salt buffer (20 mM Tris-Cl, pH 8, 500 mM NaCl, 2 mM EDTA, 1% TritonX-100, 0.1% SDS), LiCl buffer (20 mM Tris-Cl, pH 8, 250 mM LiCl, 2 mM EDTA, 1% NP-40, 1% sodium deoxycholate) and twice with TE buffer (10 mM Tris-Cl, pH 8, 1 mM EDTA). Bound complexes were eluted with 500 μl of elution buffer (1% SDS and 0.1 M NaHCO3). To reverse formaldehyde crosslinks both immunoprecipitated and input DNAs were incubated at 65°C for at least 4 h and subsequently treated with proteinase K at 42°C for 2 h (10 μg/ml, Sigma P5568) with 2 μl of GlycoBlue added (Thermo Fisher Scientific, AM9516). After phenol:chloroform extraction (Sigma, P3803) both immunoprecipitated DNA and input DNAs were dissolved in 200 μl water and 5 μl of DNA served as a template for each qPCR reaction. Enrichment of specific gene sequences was measured by qPCR (Agilent AriaMx Real-time PCR System) using SYBR Green JumpStart TaqReadyMix (Sigma, S4438) with following parameters: 95°C for 2 min followed by 45 cycles of denaturation at 95°C for 15 s, annealing at 55°C for 30 s and extension at 72°C for 30 s. ChIP enrichment of specific target was always determined based on amplification efficiency and Ct value, and calculated relative to the amount of input material. All primer sequences used in this study are specified in the Supplementary Table 10. qPCR was performed in triplicate for each biological replicate and error bars represent standard error of the mean of three biological replicates (unless stated otherwise in the text).
Chromatin immunoprecipitation coupled with sequencing (ChIP-seq)
The salmon sperm DNA blocking was omitted for all ChIP-seq experiments, otherwise the same protocol as for ChIP-qPCR was used. For one ChIP-seq experiment (CDK11, RNAPII, P-Ser2) we usually performed 3 technical replicates, dissolved each replicate in 17 μl of water and pooled them together to get at least 2.5 ng of immunoprecipitated DNA before library preparation (measured by Qubit). ChIP-seq libraries were generated using the KAPA Biosystems Hyper Prep Kit (KK8502) and NEBNext Multiplex Oligos for Illumina (Index Primers Set 1 and Set 2 (NEB E7335S, E7500S). Libraries were sequenced (50-bp single-end reads) using an Illumina HiSeq 2500 (VBCF Vienna).
RNA-seq
siRNA mediated-CDK11 knockdown (Sigma, SASI_WI_00000026) was performed in HCT116 cells growing in 6-well plate using Lipofectamine RNAiMax (Thermo Fisher Scientific, 13778-150). Cells from one well were washed twice with ice-cold PBS 36h post-transfection, scraped, pelleted at 500g for 3min and treated for 5 min with 150 μl of cytoplasmic lysis buffer (10 mM Tris-Cl, pH 8, 0.32 M Sucrose, 3 mM CaCl2, 2 mM MgCl2, 0.1 mM EDTA, 0.5% TritonX-100, supplemented with 40 U/ml RNase inhibitor, Roche, 3335402001). Cytoplasmic RNA present in the supernatant was removed by centrifugation (500g for 3 min). Nuclear pellet was treated again with 90 μl of cytoplasmic lysis buffer and supernatant was completely removed after centrifugation (500g for 3 min). Nuclear RNA was isolated from the remaining nuclear pellet using Tri-Reagent (MRC, #TR118). 500 ng of RNA was treated with 1μl of DNase (Sigma, AMPD1). Ribosomal RNA was depleted using NEBNext rRNA Depletion Kit (E6310S). Sequencing libraries were prepared using the NEBNext Ultra II Directional RNA Library Prep Kit for Illumina (NEB, E7760) and sequenced on Illumina HiSeq 2500 (50bp single-end).
UV-RIP
UV crosslinking experiments were performed in HCT116 Flp-in cells stably expressing F-CDK11 constructs. One 150cm2 plate at 75% confluency was used for each immunoprecipitation.F-CDK11 expression was induced with 1μg/ml of doxycycline 24 h before crosslinking with UV-C (254nm, 200 mJ/cm2). Cell pellets were lysed in RIPA buffer (50 mM Tris-Cl, pH 8, 150 mM NaCl, 5 mM EDTA, 1% NP-40, 0.5% sodium deoxycholate, 0.1% SDS, supplemented with protease inhibitors, Sigma, P8340 and 40 U/ml RNase inhibitor, Roche, 3335402001). 850 μl of clarified extract (21,000g for 30 min) were incubated for 2-5 h with antibodies (see Supplementary Table 11) pre-bound to 20 μl of protein G Dynabeads. 10% of clarified extract was saved and used as input RNA. Beads were then washed sequentially with low salt buffer (20 mM Tris-Cl, pH 8, 150 mM NaCl, 2 mM EDTA, 1% Triton X-100, 0.1% SDS), high salt buffer (20 mM Tris-Cl, pH 8, 500 mM NaCl, 2 mM EDTA, 1% TritonX-100, 0.1% SDS), LiCl buffer (20 mM Tris-Cl, pH 8, 250 mM LiCl, 2 mM EDTA, 1% NP-40, 1% sodium deoxycholate) and twice with TE buffer (10 mM Tris-Cl, pH 8, 1 mM EDTA). Bound complexes were eluted with 300 μl elution buffer (1% SDS and 0.1 M NaHCO3). Immunoprecipitated and input RNAs were then purified by treatment with proteinase K at 42°C for 1 h (10 μg/ml, Sigma P5568), followed by phenol:chloroform extraction (RNA phenol, Sigma, 77619). Immunoprecipitated RNA as well as input RNA were dissolved in 8 μl of water and treated with 1μl of DNase (Sigma, AMPD1), reverse transcribed using 200 U of SuperScript III RT (Thermo Fisher Scientific, 18080-044) and 1 μl random hexamers (IDTDNA, 50 μM stock). cDNA was further diluted with water (20x) and 5 μl of diluted cDNA served as template for each qPCR reaction using SYBR Green JumpStart TaqReadyMix (Sigma, S4438) with the following parameters: 95°C for 2 min followed by 45 cycles of denaturation at 95°C for 15 s, annealing at 55°C for 30 s and extension at 72°C for 30 s. Enrichment of specific target was always determined based on amplification efficiency and Ct value, and calculated relative to the amount of input material. qPCR was performed in triplicate for each biological replicate and error bars represent standard error of the mean of three biological replicates (unless stated otherwise in the text).
Chromatin association assay
HCT116 cells were plated onto 150 cm2 plate to reach 75% confluency at the day of experiment. Cells were washed twice with ice-cold PBS, scraped and treated for 5 min with 500 μl of buffer I (10 mM Tris-Cl, pH 8, 0.32 M Sucrose, 3 mM CaCl2, 2 mM MgCl2, 0.1 mM EDTA, 0.5% TritonX-100, supplemented with protease inhibitors). Cytoplasmic fraction (supernatant) was removed by centrifugation (500g for 3 min). Nuclei were washed with 1 ml of buffer I, and after the last wash with 1ml of buffer I without TritonX-100 the remaining buffer was carefully removed. Nuclear pellet was lysed in 500 μl of nuclear lysis buffer (3 mM EDTA, 0.2 mM EGTA, 1 mM DTT, protease inhibitors Sigma, P8340). Lysate was equally distributed into two tubes and samples were taken for western blot analysis (nuclear soluble 1). One tube was treated with 5 U of RNase A and 200 U of RNase T1 (Thermo Fisher Scientific, AM2286); the other tube was treated with the same volume of the RNase storage buffer (10 mM HEPES pH 7.5, 20 mM NaCl, 0.1% Triton X-100, 1 mM EDTA, 50% glycerol) for 30 min at RT. Nuclear soluble fractions were separated by centrifugation (1,700g for 5 min) and samples were taken for western blot analysis (nuclear soluble 2). Insoluble chromatin pellet was washed twice with 1 ml of nuclear lysis buffer followed by centrifugation (10,000g for 5 min). The remaining buffer was carefully removed (without disturbing the pellet), solubilized in 100 μl of Laemmli buffer, followed by sonication (10 x 1s pulses). Nuclear soluble and nuclear insoluble (chromatin) fractions were analysed by SDS-PAGE and immunoblotting using RNAPII (Santa Cruz, sc-899), CDK11 (rabbit or rat serum), CDK9 (Santa Cruz, sc-484), FUS (Santa Cruz, sc-47711), ACTIN (Sigma, A3853), FLASH (Abcam, ab8420), FLAG (Sigma, F3165) and histone H3 (Abcam, ab1791) or histone H2A (Abcam, ab18255) antibodies.
IVKA with phospho-specific antibodies
HCT116 cells (50% confluency) grown in DMEM (Sigma, D6429) were transfected on 150cm2 plate using 48 μg of polyethylenimine (Polyscience, 24765) and 12 μg of expression vectors containing flag-tagged (F) F-EV, F-CDK9, F-CDK11, F-CDK11KD or F-CDK12. F-CDK11 and F-CDK11KD were co-transfected with 12 μg of Xpress-tagged-Cyclin L1 (X-CycL1). F-CDK12 was co-transfected with 12 μg of Xpress-tagged-Cyclin K (X-CycK). Growing medium was replaced with the fresh one 3 hours after transfection. Cells were lysed in 1 ml of lysis buffer (20 mM HEPES-KOH, pH 7.9, 15% glycerol, 0.2% Igepal CA-630, 300 mM KCl, 0.2 mM EDTA, 1 mM dithiothreitol, 1 μl/ml Protease Inhibitor Cocktail (Sigma)) 68 hours after transfection. Flag-tagged kinases were immunoprecipitated using 20 μl of Anti-FLAG M2 Affinity Gel (Sigma), washed 3 times with lysis buffer containing 500 mM KCl and once in 20 mM HEPES-KOH, pH 7.9, 15% glycerol, 150 mM KCl, 1 mM dithiothreitol. Kinases were eluted from beads using 40 μl of 20 mM HEPES-KOH, pH 7.9, 150 mM KCl, 1 mM dithiothreitol and 0.238 mg/ml 3xFLAG Peptide (Sigma, F4799). Eluates were stored on ice until use. Kinase reaction consisted of 12 μl of eluted kinase and 48 μl of kinase buffer (20 mM HEPES-KOH, pH 7.9, 2 mM dithiothreitol, 1.67 mM ATP and 400 ng of human GST-CTD per reaction). Reaction was run for 1 hour at 30°C with shaking at 300 rpm. Reaction was terminated by addition of 3× Laemmli buffer and heating to 95°C for 3 min. Samples were resolved on SDS-PAGE followed by western blotting to a nitrocellulose membrane. The membrane was blocked for 1 hour in 5% low-fat milk in PBS-0.05% Tween 20 (PBS-T) and incubated overnight at 4°C in 5% low-fat milk in PBS-T with phospho-specific antibodies – phospho-Ser2 (clone3E10, Active Motif, 61083) diluted 1:500 or phospho-Ser5 (clone 3E8, Active Motif, 61085) diluted 1:4000. Membranes were washed 3×10 min in PBS-T and incubated for 1 hour in 5% low-fat milk in PBS-T with goat anti-rat IgG-HRP (Santa Cruz, sc-2032) diluted 1:3000. Membranes were washed 3×10 min in PBS-T and visualized using Western Blotting Luminol Reagent (Santa Cruz, sc-2048) and UltraCruz Autoradiography film (Santa Cruz, sc-201696) or Amersham Hyperfilm ECL (GE Healthcare, 28906836).
Nuclear Run-On
Nuclear run-ons were performed by using combination of published protocols 63,64. HCT116 cells (60% confluency) grown on 150cm2 plate in DMEM (Sigma, D6429) were transfected with 12.5 nM CDK11 siRNA (Sigma, SASI_WI_00000026) using Lipofectamine RNAiMax (Thermo Fisher Scientific, 13778-150). After 65 hours, cells were harvested on ice, washed twice in ice-cold PBS and pelleted by 400g/4°C/4 min centrifugations. Nuclei were isolated by two washes in 1 ml of 10 mM Tris, pH 8, 10 mM NaCl, 3 mM MgCl2, 0.5% Igepal CA-630 with 300g/4°C/4 min centrifugations (first wash was followed by 5min incubation on ice). Nuclei were resuspended in 40 μl of 50 mM Tris, pH 8, 0.1 mM EDTA, 5 mM MgCl2, 40% glycerol and kept on ice until run-on reaction. Nuclear run-on reaction was carried out by the addition of 50 μl of 2× transcription reaction mix (20 mM Tris, pH 8, 5 mM MgCl2, 300 mM KCl, 4 mM dithiothreitol, 1 mM ATP, 1 mM GTP, 1 mM UTP, 0.6 mM CTP (Roche, 11277057001), 0.4 mM biotin-11-CTP (Thermo Fisher, 19519016), 50 U RNaseOUT Inhibitor (Thermo Fisher, 100000840)) to resuspended nuclei. Reaction was stopped after 30 min at 30°C by addition of 150 μl of nuclease-free water and 750 μl of TriReagent LS (Sigma, T3934). RNA was isolated according to the manufacturer’s protocol. Dynabeads MyOne Streptavidin C1 (Thermo Fisher, 65001) were washed once in 100 mM NaOH, 50 mM NaCl, twice in 100 mM NaCl and stored in binding buffer (10 mM Tris, pH 8, 300 mM NaCl, 0.1% Triton X-100) until use. Washed beads were incubated with 8 μg of isolated RNA and 1μl of RNase OUT Inhibitor (Thermo Fisher, 10777019) in binding buffer for 30 min at RT. Nascent RNA captured on beads was washed twice in 50 mM Tris, pH 8, 2 M NaCl, 0.5% Triton X-100, twice in binding buffer and once in 5 mM Tris, pH 8, 0.1% Triton X-100. All washing buffers contained 1 μl of RNase OUT Inhibitor per 5 ml. Beads were re-suspended in 300 μl of TriReagent (Sigma, T9424), vortexed, vortexed again after addition of 60 μl of chloroform and centrifuged 14000×g/4°C/4 min. Aqueous phase (180 μl) was transferred to new tube, 300 μl of TriReagent was added to leftover organic phase and extraction was repeated. Aqueous phases were pooled, mixed with 360 μl of chloroform and centrifuged 14,000g/4°C/4 min. Aqueous phase was transferred to the new tube, mixed with 1 μl of GlycoBlue (Thermo Fisher, AM9516) and 3 volumes of 99.8% ethanol, and after 10 min at RT centrifuged 14,000g/4°C/20 min. The pellet was washed with 75% ethanol, centrifuged 14,000g/4°C/5 min, dried and dissolved in 5 μl of nuclease-free water (Sigma, W4502). DNase (Sigma, AMPD1) treatment was performed according to manufacturer’s protocol. 2 μl of RNA sample were used for synthesis of cDNA for RT-qPCR. Another 2 μl were processed as no-reverse-transcriptase control. Superscript II (Thermo Fisher, 18064014) was used according to the manufacturer’s protocol for random primers to synthetize cDNA (RNaseOUT inhibitor was added according to optional step of the protocol). Resulting cDNA was 10× diluted and 5 μl were added to qPCR reaction consisting of 0.11 μl of 10 μM forward primer, 0.11 μl of 10 μM reverse primer, 0.28 μl of MilliQ water and 5.5 μl of 2× SYBR Green JumpStart Taq ReadyMix (Sigma, S4438). Measurement was performed on an Aria Mx instrument (Agilent) using following set-up: 94°C for 2 min followed by 45 cycles of 94°C/15 sec, 55°C/30 sec, 72°C/30 sec. At the end of the experiment, melting temperatures of PCR products were measured from 90°C to 55°C and back to 90°C in 0.5°C intervals. Data were analysed by 2-ΔΔCq method 65. PPIA gene was used as a normalizer and data were presented as fold change over untreated control. qPCR was performed in triplicate for each biological replicate and error bars represent standard deviation of three biological replicates.
Primers used in the nuclear-run on are in the Supplementary Table 10
RNase Protection Assay
Genomic DNA from 21cm2 50% confluent dish of HCT116 cells was isolated by Quick-gDNA MicroPrep kit (Zymo Gene, D3020). Template for anti-sense HIST1H1C RNA probe synthesis 66 was created by PCR using 50 ng of genomic DNA, Q5 Hot Start High-Fidelity DNA Polymerase (NEB, M0493L) and primers listed in the Supplementary Table 10. PCR program was as follows: 98°C/30 sec denaturation followed by 35 cycles of 98°C/10 sec, 63°C/10 sec, 72°C/20 sec. Final extension 72°C/2 min. PCR product was purified on a 1.5% agarose gel and extracted using QIAquick Gel Extraction Kit (Qiagen, 28706). Anti-sense RNA probe with 40% Us labelled with biotin was synthetized using MAXIscript T3 Transcription Kit (Thermo Fisher, AM1316) and biotin-16-UTP (Roche, 11388908910).
HCT116 cells in 21cm2 dish and at 40% confluency were transfected by corresponding siRNA (see Supplementary Table 9) using Lipofectamine RNAiMax (Thermo Fisher Scientific, 13778-150) and were grown for another 65 h. Two 21cm2 dishes were transfected for each condition. RNA was isolated with Trizol (Thermo Fisher, 15596026). RNase protection assay was performed using RPA III Ribonuclease Protection Assay Kit (Thermo Fisher, AM1415) according to the manufacturer’s protocol. Briefly, 20 μg of isolated RNA was mixed with 4 μl of anti-sense probe and precipitated using ammonium acetate and ethanol. As a control 5 μg of yeast RNA from the kit was processed in the same way as other samples. RNA sample was re-suspended in 10 μl of hybridization buffer from the kit, heated to 95°C and kept at 42°C overnight in a PCR machine. Samples were then incubated 30 min at 37°C in an RNase Digestion Buffer from the kit mixed with RNase T1 in ratio 150:1. Reaction was stopped and precipitated using reagents from the kit and resulting RNA was dissolved in nuclease-free water (Sigma, W4502). Samples were resolved on a denaturing 6% polyacrylamide/7 M urea gel. Gel and Hybond-N+ hybridization membrane (Sigma, GERPN203B) were soaked in 0.5× Tris-Borate-EDTA buffer (TBE, Sigma, T4415) for 10 min before wet blotting procedure. Wet blotting was done in a western blot apparatus using 0.5× TBE and 400mA for 2 hour. After transfer, the membrane was briefly washed in 1× TBE and RNA was cross-linked to the membrane by 3 min exposure to 302-nm UV light from transilluminator. Membrane was washed twice for 5 min in 0.5% SDS in PBS, twice for 5 min in 0.5% SDS, 0.5% BSA in PBS and once for 30 min in 0.5% SDS, 0.5% BSA in PBS. Membrane was labelled with HRP by 30-min treatment in 0.5% SDS, 0.5% BSA in PBS containing 1:10000 diluted Pierce High Sensitivity Streptavidin-HRP (Thermo Fisher, 21130). The membrane was washed once for 15 min in 0.5% SDS, 0.5% BSA in PBS and three times for 15 min in 0.5% SDS in PBS. Finally, the membrane was briefly washed in PBS and visualized using Western Blotting Luminol Reagent (Santa Cruz, sc-2048) and UltraCruz Autoradiography film (Santa Cruz, sc-201696) or Amersham Hyperfilm ECL (GE Healthcare, 28906836).
IVKA using [γ- 32P]ATP
293 cells were seeded onto 150 cm2 plates at 60% confluence and were transfected with 15 μg of expression vector containing F-CDK9, or co-transfected with 15 μg of DNA in total with 10 μg F-CDK11 + 5 μg of F-CycL1α and 10 μg of F-CDK11KD + 5 μg of F-CycL1α using 45 μl of PEI per transfection (pH = 7.0, 24765, Polysciences Inc). After 48 h, cells were lysed in lysis buffer (20mM HEPES-KOH (pH = 7.9), 15 % glycerol, 0.2 % NP-40, 300 mM KCl, 0.2 mM EDTA, 1 mM DTT, protease inhibitor cocktail (1 μl/ml, P8340, Sigma-Aldrich)), flag-tagged proteins were precipitated from cleared lysates with 20 μl of Flag agarose M2 affinity gel (A2220, Sigma-Aldrich). Beads with bound proteins were washed three times with high salt wash buffer (20mM HEPES-KOH, pH 7.9, 15% glycerol, 0.2% NP-40, 750 mM KCl, 0.2 mM EDTA, 1 mM DTT, protease inhibitor cocktail (1 μl/ml, Sigma-Aldrich)), once with detergent-free buffer (20mM HEPES-KOH, pH 7.9, 15 % glycerol, 150 mM KCl, 1 mM DTT) and 3xFlag tagged proteins were eluted with 45 μl of Flag elution buffer (20mM HEPES-KOH, pH 7.9, 150 mM KCl, 1 mM DTT, 3X FLAG Peptide (0.2 mg/ml, F4799, Sigma-Aldrich). Each kinase reaction (total volume 60 μl) contained 12 μl of eluted 3xFlag tagged kinase and 1 μg of substrate (human full length GST-CTD (gift from Stefl lab, CEITEC), FLASH A (amino acids 1-571), FLASH B (490-919), FLASH C (920-1489), FLASH D (1490-1982) or BSA (K41-001, GE Life Sciences)) in kinase buffer (20 mM HEPES-KOH, pH 7.9, 5 mM MgCl2, 1 mM DTT, 0.1 mM ATP, 0.5 μl [γ- 32P]ATP (0.185 MBq (FP-301, Hartmann Analytic))). Kinase reactions were incubated for 1 h at 30°C. Reactions were stopped by adding 15 μl of 4x NuPAGE loading buffer (NP0007, Thermo Fisher Scientific) and boiling at 80°C for 5 minutes. Phosphoproteins were resolved by SDS-PAGE and detected by autoradiography. For plasmids and antibodies used see Supplementary Table 8 and 11, respectively.
Phosphatase treatment
HCT116 cells were synchronized by a double thymidine block. G1/S and S cells were collected at 0 h and 2 h after the release from the second thymidine block, respectively. Cells were washed twice with ice-cold PBS, scraped and lysed in EDTA-free RIPA buffer (50 mM Tris-Cl, pH 8, 150 mM NaCl, 1% NP-40, 0.5% sodium deoxycholate, 0.1% SDS, supplemented with protease inhibitors, Sigma, P8340, and phosphatase inhibitor cocktail 3, Sigma P0044). During cell lysis extracts were sonicated (5 x 1s, amp 0.30, using 5/64 probe, QSonica Q55A). Protein extracts were clarified by centrifugation at 10,000g for 10 min, 4°C. 30 μl of each cell extract was mixed with either 10 μl of alkaline phosphatase (Thermo Fisher Scientific, EF0651) or 10 μl of RIPA buffer and incubated for 15 min at 37°C. Reactions were ended by mixing with 20 μl of Laemmli buffer and boiled for 2 min. Samples were resolved by SDS-PAGE on 5% acrylamide gels.
Immunoprecipitation
HCT116 cells were plated onto 150 cm2 plate to reach 70% confluency at the day of experiment. Cells were washed twice with ice-cold PBS, scraped and lysed in 1ml of triton containing lysis buffer (20 mM Hepes, pH 7.4, 100 mM NaCl, 0.1% Triton X-100, supplemented with protease inhibitors, Sigma, P8340) for 20 min. During cell lysis extracts were sonicated (5 x 1s, amp 0.30, using 5/64 probe, QSonica Q55A). Protein extracts were clarified by centrifugation at 10,000g for 10 min, 4°C. When performing RNase treatment before FLASH immunoprecipitation, clarified extracts were equally distributed into two tubes, one was treated with 10 μl of RNase cocktail (Thermo Fisher Scientific, AM2286) for 30 min at RT. Extracts were than incubated with 1.5 μg of primary FLASH antibody, rotating for 3 h at 4°C. Subsequently, 15 μl of packed protein G Sepharose (GE Life Sciences, 17-0618-01) was washed three-times with lysis buffer, added to each immunoprecipitation and rotated for 1 h at 4°C. Samples were then washed three-times with lysis buffer (rotating for 5 min at 4°C during each wash). After the last wash all the remaining buffer was carefully removed and proteins were eluted using 25 μl of 3x Laemmli buffer and boiled for 2 min.
For immunoprecipitations with transfected F-FLASH plasmid or with stable F-CDK11 cell lines, protein G Dynabeads were used. 20 μl of the Dynabeads per one immunoprecipitation were washed three times with lysis buffer (20 mM Hepes, pH 7.4, 200 mM NaCl, 0.1% Triton X-100, supplemented with protease inhibitors, Sigma, P8340). Dynabeads were than incubated with specific antibody (FLASH Abcam, ab133899, Flag, Sigma,F1804) for at least 4 h at 4°C. Clarified cell extracts (10,000g for 10 min) were than rotated with antibody coated Dynabeads for 3 hours at 4°C and subsequently washed three times with lysis buffer. Proteins were eluted by adding 25 μl of 3x Laemmli buffer and boiled for 2 min.
GST pulldown experiment
The 6xHis-FLASH protein fragments (amino acids 1-571, 490-919, 920-1489, 1490-1982) were expressed in BL21 (DE3) pLysS Escherichia coli strain using pET28b 3’:6xHis FLASH 1-419, pET28b 3’:6xHis FLASH 490-919, pET28b 3’:6xHis FLASH 920-1489, pET28b 3’:6xHis FLASH 1490-1982, respectively. Cultures were grown in 150 ml of LB media (supplemented with 30 μg/ml kanamycin and 25 μg/ml chloramphenicol) at 37°C with vigorous shaking to an OD600 of 0.5. Cultures were induced for 16 hours at 25°C in the presence of 0.5 mM isopropyl β-D-1-thiogalactopyranoside (Sigma, I5502). Cells were harvested by centrifugation. Extract of cells were prepared by sonication in 5 ml of lysis buffer (50 mM NaH2PO4, pH 8.0, 500 mM NaCl, 10 mM imidazole, 1% Triton X-100, 0.01% NP-40, 1 mM β-mercaptoethanol, 2 mM PMSF). Lysates were clarified by centrifugation, and the resulting supernatant was incubated with 1 ml of Ni-NTA Agarose (Qiagen, 30210) for 1 hour at 4°C. The beads were washed with 10 ml of lysis buffer and 40 ml of wash buffer (50 mM NaH2PO4, pH 8.0, 500 mM NaCl, 35 mM imidazole, 10% glycerol, 1% Triton X-100, 0.01% NP-40, 1 mM β-mercaptoethanol). FLASH fragments were eluted with five fractions of 500 μl of elution buffer (50 mM NaH2PO4, pH 8.0, 500 mM NaCl, 250 mM imidazole, 10% glycerol, 1% Triton X-100, 0.01% NP-40, 1 mM β-mercaptoethanol). Fractions with FLASH fragments were pooled together and concentrated in an Amicon Ultra-4 Centrifugal Filter Unit (Sigma, UFC801024) with PBS. Samples were stored at -80°C until use.
500 μg of His-tagged FLASH fragments FLASH A (amino acids 1-571), FLASH B (490-919), FLASH C (920-1489), FLASH D (1490-1982) were each mixed with 500 μg of GST-tagged CDK11 B (SignalChem, 23-30G) in a buffer consisting of 25 mM Tris, pH 7.5, 10 % glycerol, 0.5 mM EDTA, 150 mM NaCl, 1 mM DTT, 0.5 % NP-40. Samples were incubated on ice for 10 min and mixed with 17 μl of 3x washed Glutathione Sepharose 4 Fast Flow GST-tagged protein purification resin (GE Healthcare, 17513201). After 30-min incubation on ice with occasional mixing the samples were centrifuged 1000g/RT/30 s, supernatant was stored and resin was washed 3x in 1 ml of the buffer. Finally, 30 μl of 3x Laemmli sample buffer was added to resin and supernatant samples and the samples were boiled at 95°C for 3 min and analysed by western blotting. Anti-GST antibody (Santa Cruz, sc-138) and anti-His-tag antibody (Sigma, 70796-3) were used to detect proteins.
Statistics and Reproducibility
Representative experiments shown in the manuscript (western blots, cell cycle profiles) were performed at least as three biologically independent experiments, unless otherwise stated in the text. Statistical comparisons of ChIP-qPCR experiments (Fig 2e, Fig 4e, Fig 6d, ED2e) and RT-qPCR experiments (ED1d, ED8b, ED8e) were assessed with two-tailed paired t-test. Statistical significance was set to P ≤ 0.05.
Bioinformatics is available as a Supplementary Note
Extended Data
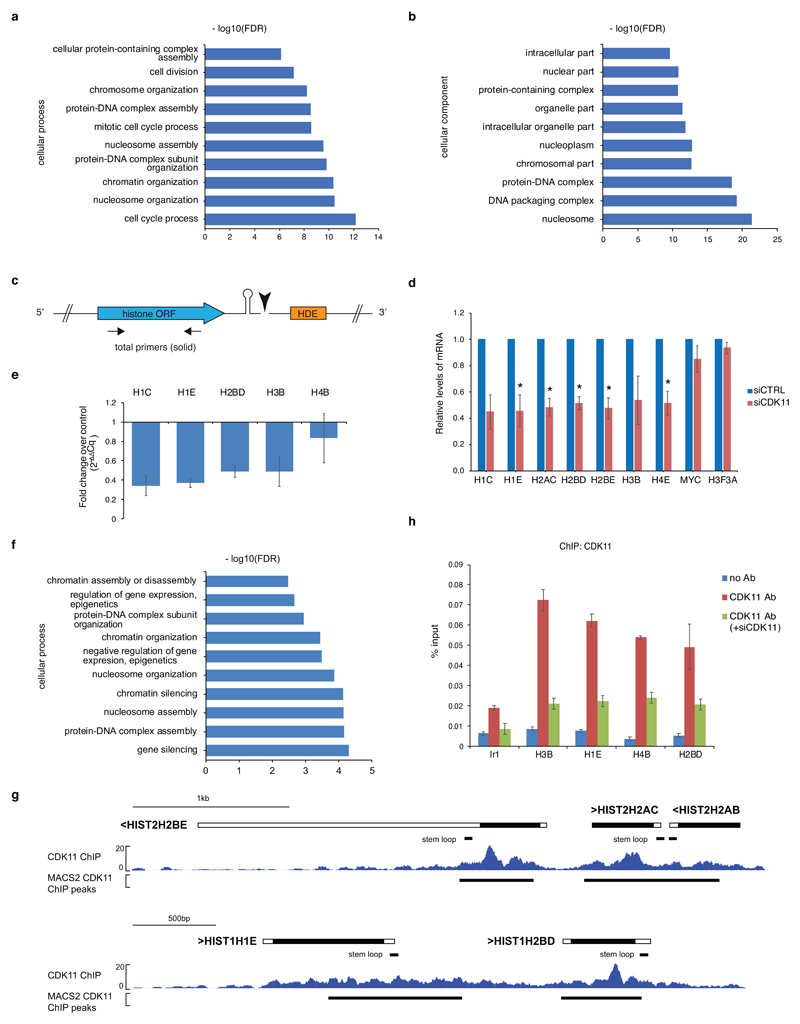
Extended Data Fig. 1. CDK11 is recruited to chromatin of RDH genes to regulate their transcription.
a, b, GO analyses of enriched cellular processes (a) and components (b) in genes down-regulated in the RNA-seq experiment. Total of 401 genes (log2FoldChange<-1.5; p-adj<0.01) were analysed by the Gorilla program.
c, Depiction of histone mRNA and position of RT-qPCR primers. The stem shape and the black triangle depict SL and mRNA cleavage, respectively. Arrows display positions of total RT-qPCR primers. Blue and orange rectangle represents histone open reading frame (ORF) and histone downstream element (HDE), respectively
d, Graph shows relative levels of total mRNAs of described genes in HCT116 cells treated with control (siCTRL) or CDK11 (siCDK11) siRNA. Total RNA was reverse transcribed using random hexamer primers. mRNA levels were normalized to PPIA mRNA expression. n=3 biologically independent experiments, error bars=SEM, *P<0.05, Student´s two-sided t-test.
e, HCT116 cells were transfected with control or CDK11 siRNA and nascent mRNA from nuclear run-ons were measured by RT-qPCR. Graph shows fold change of RDH nascent mRNAs normalized to control knockdown and PPIA housekeeping gene (2-ΔΔCq). Results show mean ± standard deviation of four biological replicates. n=4 biologically independent experiments, error bars=SD.
f, GO analyses of enriched cellular functions of genes occupied by CDK11 in HCT116 cells. 393 genes (log2FoldChange<-1.5; p<0.01) were chosen for the analyses by the Gorilla program.
g, CDK11 ChIP-seq occupancy on HIST2H2BE, HIST2H2AC, HIST2H2AB (upper panel) and HIST1H1E, HIST1H2BD RDH cluster genes (lower panel). Black lines below the RDH schema and the gene tracks show positions of the SL and CDK11 ChIP-seq peaks identified by the MACS2 program (p<0.05), respectively.
h, CDK11 ChIP-qPCR analyses on the indicated RDH genes in HCT116 cells transfected with mock or CDK11 siRNA. ChIP-qPCR was performed with either CDK11 or no antibody (no Ab) control. Ir1 represents intergenic region. n=4, error bars=SEM.
Extended Data Fig. 2. CDK11 and FLASH interact directly and are present on the chromatin of RDH genes.
a, b, Western blot analyses of immunoprecipitates of endogenous CDK11 (a) and flag-tagged FLASH (F-FLASH) (b) from HCT116 cells expressing F-FLASH. The blots were probed against proteins indicated on the side.
c, Correlation analyses of CDK11 and FLASH co-occupancy genome-wide (10 kb bins) (top panel) and on RDH genes (bottom panel). Spearman correlation coefficient between indicated ChIP-seq samples is shown and correlation strength is indicated by colour code. FLASH ChIP-seq from hTERT and U2OS cells.
d, Western blot analyses of FLASH and CDK11 protein levels in cell lysates used for the CDK11 and FLASH ChIP-qPCR experiments in Fig. 2e and Extended Data Fig. 2e, respectively. FUS is a loading control. Representative replicate is shown.
e, Endogenous FLASH ChIP-qPCR on indicated RDH genes or control intergenic region (Ir) in HCT116 cells treated either with control (CTRL) or FLASH siRNAs for 24 h. n=3 biologically independent experiments, error bars=SEM, *P<0.05, Student´s two-sided t-test.
Extended Data Fig. 3. CDK11 is recruited to the RDH genes in S phase and maintains protein levels of FLASH.
a, Western blots show levels of indicated proteins in depicted cell cycle phases. FUS is a loading control and CCNE1 a G1/S phase marker. Endo and flag mark endogenous and F-CDK11, respectively.
b, Graph presents mRNA levels of described histone genes in G1/S, S and G2/M phases. RT-qPCR is normalized relative to MAZ mRNA. n=3 biologically independent experiments, error bars=SEM.
c, Histogram presents cell cycle profiles of either asynchronous or synchronized cells released in the indicated times after double thymidine synchronization. Cells in G1/S, S and G2/M phases were harvested at 0, 2 and 8 h after the release, respectively.
d, Western blot analyses of FLASH protein levels in cells treated with control (CTRL) or CDK11 siRNAs for indicated times.
e, Western blot analyses of CDK11 protein levels in lysates from HCT116 cells treated with control (CTRL) or FLASH siRNA for 72 h.
f, Gene tracks of HIST1H4E and HIST1H1C showing CDK11 occupancy during the cell cycle. CDK11 ChIP-seq in asynchronous cells, synchronized G2/M and S phase and ChIP-seq with no antibody (no Ab) control are depicted.
Extended Data Fig. 4. CDK11 is an evolutionary conserved RNA-binding protein.
a, Alignment of CDK11 protein sequences from different species by the MultAlin program. CDK11 protein sequences from human (Homo-hCDK11B (NP_001778.2) and hCDK11A (NP_001300825.1)), mouse (Mus-mCDK11 (NP_031687.2)), cow (Bos-bCDK11 (NP_001007812.2)), chicken (Gallus-gCDK11 (NP_001026042.2)), frog (Xenopus-xCDK11(NP_001086696.1), and zebra fish (Danio-dCDK11 (NP_001008646.1)) were obtained from the NCBI database. Numbers above the alignment indicate amino acid numbering. Red, blue and black colored letters indicate amino acid consensus, similarity, and difference, respectively.
b, Schema of iCLIP workflow. Big and small grey ovals correspond to a full length F-CDK11 protein and a CDK11 peptide, respectively crosslinked to RNA (black line). RE=restriction enzyme.
c, 293 cell lines stably expressing flag-tag CDK11 (F-CDK11) or endogenous hnRNPC (used as iCLIP procedure positive control with the canonical RNA-binding protein) were treated with 4SU for 6 hr and irradiated with 200mJ/cm2 at 365nm. Lysates were either treated with decreasing concentrations of RNase I or left untreated. The RNA-protein complexes were resolved on SDS-PAGE and visualized by autoradiography. Clamps on the side of the panels and asterisk indicate RNA-protein complexes and collapsed RNA-protein band after high RNase I treatment, respectively. Band corresponding to autophosphorylated CDK11 is shown by the arrow.
d, Significant iCLIP crosslinks (FDR > 0.05) were matched with their transcripts and correlated between the indicated biological replicates of depicted F-CDK11 and no Ab iCLIP libraries. Numbers inside blue balls correspond to R2 (Pearson correlation coefficient).
e, Percentage of significant bound genomic regions (FDR > 0.05) normalized by region length. Biological replicates of F-CDK11 iCLIP libraries are labelled on the left, individual genomic regions are differentiated by a color code.
Extended Data Fig. 5. CDK11 binds predominantly RDH RNAs in cells.
a, GO analyses of enriched cellular processes in CDK11-bound mRNAs. 371 mRNAs (with CDK11 CLIP cDNA density > 0.01) were analysed by the Gorilla program.
b,c,d, Biodalliance genome browser view of F-CDK11, F-CDK11(226-783) and uncrosslinked control (no UV) iCLIP binding at canonical RDH HIST1H1E (b), non-canonical histones H3F3A (upper panel) and H1F0 (lower panel) (c) and protein coding FOS (upper panel) and PPIA (lower panel) transcripts (d). For HIST1H1E, the expanded view of its 3´end sequence (stop codon and stem loop are indicated with black lines) and CDK11 binding there is shown (b).
e, Highly expressed transcripts bind to CDK11 with much lower intensity when compared to RDH transcripts. Comparison of expression (upper panel) and binding to CDK11 (lower panel) of RDH (black line) and highly expressed genes (grey line). Data are based on RNA-seq normalized to reads per kilobase per million (RPKM) and CDK11 iCLIP experiments in 293 cells.
f, g, Graph represents RIP analyses of endogenous CDK11 binding to indicated RNAs in HCT116 cells. Immunoprecipitations were performed with either CDK11 or no antibody (Ab) in cell lysates treated with mock or CDK11 siRNA (siCDK11). n=4 biologically independent experiments, error bars=SEM. (f). Western blot analyses of efficiency of CDK11 depletion with indicated siRNAs (lanes 1, 2) and immunoprecipitations with shown antibodies (lanes 3, 4, 5) in cell lysates used for the RIP experiment. Antibodies used for western blotting are displayed on the right of the panel (g).
h, i, Graph displays RIP analyses carried out in cell lysates from HCT116 cells stably expressing indicated F-CDK11 proteins. Immunoprecipitations were done with flag or no antibody (no Ab); qPCR was performed in triplicate for each biological replicate. n=4 biologically independent experiments, error bars=SEM (h). Western blot analyses of levels of doxycycline induced F-CDK11 proteins in cell lysates input into the RIP (left panel, lanes 1-3); efficiency of immunoprecipitation of the proteins with flag antibody in RIP (lane 4-6, right panel). Anti-flag antibody was used for western blotting (i).
j, Myc-tagged CDK11 (M-CDK11) protein was either expressed (lanes 1, 3, and 4) or not (lane 2) in 293 cells carrying indicated stably integrated flag-tagged proteins. Lysates were immunoprecipitated with anti-flag agarose and immunoprecipitates of M-CDK11 and flag-tagged proteins were identified as presented on the lower and middle western blots, respectively. The upper western blot shows amounts of M-CDK11 proteins in 5% input into the immunoprecipitations (IP). F-EV corresponds to cell line stably expressing flag tag alone.
Extended Data Fig. 6. RNA promotes CDK11 recruitment to the FLASH-containing RDH chromatin.
a, Workflow of nuclear pellet fractionation procedure.
b,c, Western blot analysis of: immunoprecipitates of endogenous FLASH from cell lysates either treated or not with RNase A (b), association of indicated factors in soluble and insoluble fractions of chromatin either treated or not with RNase A/T1 (c) Antibodies are shown on the side of the panels.
d, Western blot analysis of immunoprecipitates of endogenous FLASH from HCT116 cells carrying stably integrated flag-tagged CDK11 (F-CDK11), its indicated deletion mutants and control flag-tagged empty vector (F-EV) (right panel). Western blot analyses of inputs into FLASH immunoprecipitations are shown (left panel). Amounts of flag-tagged CDK11 proteins were monitored by anti-flag antibody.
e, Western blot analysis of endogenous (endo) and flag-tagged CDK11 protein levels in the cells treated with amanitin or triptolide or untreated control (CTRL) used for F-CDK11 ChIP-qPCR (Fig. 4e). Antibodies are shown on the side of the panels.
Extended Data Fig. 7. CDK11 regulates Ser2 phosphorylation and RNAPII elongation specifically on the RDH genes.
a, ChIP-seq analyses of P-Ser2 occupancies on highly expressed (n=200) and other genes (except RDH, up- and down-regulated genes, n= 56751 genomic features) in HCT116 cells treated with either control (siCTRL) or CDK11 (siCDK11) siRNA. P-Ser2 noAb=control input into P-Ser2 ChIP-seq.
b, HIST1H1C and HIST1H2AJ gene tracks as in Fig. 5e.
c, ChIP-seq analyses of RNAPII occupancies as in Extended Data Fig. 7a
d,e,f, ChIP-qPCR analyses of RNAPII (d) and phosphorylated Ser5 (e) occupancies on coding regions of the indicated RDH genes in HCT116 cells transfected with control (siCTRL) or CDK11 (siCDK11) siRNA. Ratio of P-Ser5 and total RNAPII ChIP-qPCR signals is displayed (f). n=3 biologically independent experiments, error bars=SEM, Ir=intergenic region.
g, ChIP-qPCR analyses of P-Thr4 occupancies on coding regions of the indicated RDH and protein coding genes in HCT116 cells transfected with control (siCTRL) or CDK11(siCDK11) siRNA. n=5 biologically independent experiments, error bars=SEM, Ir=intergenic region.
Extended Data Fig. 8. Depletion of CDK11 leads to changes in transcriptional read-through and/or use of cryptic polyadenylation sites in RDH genes.
a, b Depiction of histone mRNA and position of RT-qPCR primers. Blue and orange rectangle represents histone open reading frame (ORF) and histone downstream element (HDE), respectively. The stem shape depicts SL RNA and the black triangle indicates position of mRNA cleavage. Solid and dotted arrows display positions of total and read-through RT-qPCR primers, respectively (a). Graph shows relative levels of read-through mRNA of described genes in HCT116 cells transfected with control (CTRL) or CDK11 siRNA. Total RNA was reverse transcribed using random hexamer primers. Read-through mRNA levels are normalized to the total mRNA levels of the corresponding gene. The read-though transcription in CTRL cells was set as 1. n=4 biologically independent experiments, error bars=SEM. *P<0.05, Student´s two-sided t-test (b).
c, RNase protection assay shows levels of differentially 3’ end processed HIST1H1C transcripts in HCT116 cells treated with control (CTRL), CDK11 or SLBP siRNA. Total HCT116 or yeast RNA was incubated with an antisense RNA probe targeting canonically processed and polyadenylated HIST1H1C transcripts. The mix was treated with RNase T1, resolved on denaturing gel and visualized. The arrows on the left indicate positions of full-length probe (probe) and polyadenylated (polyA) or canonically processed (stem loop) HIST1H1C transcripts. No RNase sample shows full-length anti-sense probe without RNase T1 treatment.
d,e,f,g, Schema of alternative 3´end processing pathways of histone mRNA and position of RT-qPCR primers. The stem shape depicts stem-loop RNA and the black triangle indicates position of mRNA cleavage. Absence of proper cleavage results in polyadenylated histone mRNA, proper cleavage produces mature non-polyadenylated histone mRNA. Solid arrows display positions of total RT-qPCR primers (d). Graphs show relative levels of mRNA of described genes in HCT116 cells treated with either control (CTRL), CDK11, SLBP or ARS2 siRNA. Total RNA was reverse transcribed using oligo(dT) primers. mRNA levels were normalized to PPIA mRNA expression. n=3 biologically independent experiments, *P<0.05, Student´s two-sided t-test (e, f). Depletion of proteins was verified by western blotting with indicated antibodies. Tubulin is a loading control (g).
Extended Data Fig. 9. Presentation of iCLIP and ChIP-seq data on example RDH genes.
a,b,c,d,e,f Biodalliance genome browser view of HIST1H1E, HIST1H2BD (a); HIST1H4AJ (b); HIST2H2BE, HIST2H2AC, HIST2H2AB (c); HIST1H2AM, HIST1H1BO (d); HIST1H3A, HIST1H4A, HIST1H4B, HIST1H3B, HIST1H2AB (e); HIST1H2BL, HIST1H2AI, HIST1H3H, HIST1H2AJ and HIST1H2BM (f) genes with the indicated iCLIP and ChIP-seq data in control and CDK11 depleted cells.
Supplementary Material
Acknowledgements
We thank all members of Blazek and Ule laboratories for discussions throughout the project and helpful comments on the manuscript. We also wish to thank Dr. Jasnovidova (Stefl lab) for the GST-CTD, Dr.Wouters for the HCT116 Flp-in cell line, Zuzana Slaba for preparation of His-FLASH constructs and proteins and Dr. Bartholomeeusen and Dr. Dettenhofer for comments on the manuscript. The work was supported by the following grants from: the Czech Science Foundation (“16-10930S”), the Masaryk University (“MUNI/E/0080/2017”), the CEITEC (Project ‘CEITEC-Central-European Institute of Technology’ [CZ.1.05/1.1.00/02.0068]) to D.B. and the European Research Council (617837-Translate) to J.U. The Francis Crick Institute receives its core funding from Cancer Research UK (FC001002), the UK Medical Research Council (FC001002), and the Wellcome Trust (FC001002).
Footnotes
Reporting summary statement
Further information on experimental design is available in the Nature Research Reporting Summary linked to this article.
Data availability
All next-generation sequencing source and processed data is available at NCBI-GEO (accession number GSE118051). Source data for main Figures 2, 3, 4, 5 and 6 and Extended Data Figures 1, 2, 3, 4, 5, 6, 7 and 8 are available with the paper online as Source Data.
Author contributions
P.G. performed most experiments except for radioactive IVKA, some experiments in cell cycle synchronized cells (M.H.), nuclear run-on, RNase protection assay, GST-pulldown, FLASH ChIP-qPCR and IVKA with P-specific antibodies (M.R.) and CDK11 and P-Ser5 ChIP-qPCR (D.B). I.R.dl.M. performed all bioinformatics analyses under supervision of J.U. and with some input from P.G. and D.B.. D.B. conceived the study, acquired funding and wrote the manuscript with support of P.G, I.R.dl.M. and J.U. All authors discussed the design of experiments, analysed the data and commented on the manuscript.
Competing interests
The authors declare no competing interests.
References
- 1.Adelman K, Lis JT. Promoter-proximal pausing of RNA polymerase II: emerging roles in metazoans. Nat Rev Genet. 2012;13:720–31. doi: 10.1038/nrg3293. [DOI] [PMC free article] [PubMed] [Google Scholar]
- 2.Fuda NJ, Ardehali MB, Lis JT. Defining mechanisms that regulate RNA polymerase II transcription in vivo. Nature. 2009;461:186–92. doi: 10.1038/nature08449. [DOI] [PMC free article] [PubMed] [Google Scholar]
- 3.Proudfoot NJ. Transcriptional termination in mammals: Stopping the RNA polymerase II juggernaut. Science. 2016;352 doi: 10.1126/science.aad9926. aad9926. [DOI] [PMC free article] [PubMed] [Google Scholar]
- 4.Eick D, Geyer M. The RNA polymerase II carboxy-terminal domain (CTD) code. Chem Rev. 2013;113:8456–90. doi: 10.1021/cr400071f. [DOI] [PubMed] [Google Scholar]
- 5.Harlen KM, Churchman LS. The code and beyond: transcription regulation by the RNA polymerase II carboxy-terminal domain. Nat Rev Mol Cell Biol. 2017;18:263–273. doi: 10.1038/nrm.2017.10. [DOI] [PubMed] [Google Scholar]
- 6.Zaborowska J, Egloff S, Murphy S. The pol II CTD: new twists in the tail. Nat Struct Mol Biol. 2016;23:771–7. doi: 10.1038/nsmb.3285. [DOI] [PubMed] [Google Scholar]
- 7.Jeronimo C, Collin P, Robert F. The RNA Polymerase II CTD: The Increasing Complexity of a Low-Complexity Protein Domain. J Mol Biol. 2016;428:2607–2622. doi: 10.1016/j.jmb.2016.02.006. [DOI] [PubMed] [Google Scholar]
- 8.Bentley DL. Coupling mRNA processing with transcription in time and space. Nat Rev Genet. 2014;15:163–75. doi: 10.1038/nrg3662. [DOI] [PMC free article] [PubMed] [Google Scholar]
- 9.Hsin JP, Manley JL. The RNA polymerase II CTD coordinates transcription and RNA processing. Genes Dev. 2012;26:2119–37. doi: 10.1101/gad.200303.112. [DOI] [PMC free article] [PubMed] [Google Scholar]
- 10.Herzel L, Ottoz DSM, Alpert T, Neugebauer KM. Splicing and transcription touch base: co-transcriptional spliceosome assembly and function. Nat Rev Mol Cell Biol. 2017;18:637–650. doi: 10.1038/nrm.2017.63. [DOI] [PMC free article] [PubMed] [Google Scholar]
- 11.Marzluff WF, Koreski KP. Birth and Death of Histone mRNAs. Trends Genet. 2017;33:745–759. doi: 10.1016/j.tig.2017.07.014. [DOI] [PMC free article] [PubMed] [Google Scholar]
- 12.Duronio RJ, Marzluff WF. Coordinating cell cycle-regulated histone gene expression through assembly and function of the Histone Locus Body. RNA Biol. 2017;14:726–738. doi: 10.1080/15476286.2016.1265198. [DOI] [PMC free article] [PubMed] [Google Scholar]
- 13.Sullivan KD, Steiniger M, Marzluff WF. A core complex of CPSF73, CPSF100, and Symplekin may form two different cleavage factors for processing of poly(A) and histone mRNAs. Mol Cell. 2009;34:322–32. doi: 10.1016/j.molcel.2009.04.024. [DOI] [PMC free article] [PubMed] [Google Scholar]
- 14.Kohn M, Ihling C, Sinz A, Krohn K, Huttelmaier S. The Y3** ncRNA promotes the 3' end processing of histone mRNAs. Genes Dev. 2015;29:1998–2003. doi: 10.1101/gad.266486.115. [DOI] [PMC free article] [PubMed] [Google Scholar]
- 15.Pirngruber J, et al. CDK9 directs H2B monoubiquitination and controls replication-dependent histone mRNA 3'-end processing. EMBO Rep. 2009;10:894–900. doi: 10.1038/embor.2009.108. [DOI] [PMC free article] [PubMed] [Google Scholar]
- 16.Narita T, et al. NELF interacts with CBC and participates in 3' end processing of replication-dependent histone mRNAs. Mol Cell. 2007;26:349–65. doi: 10.1016/j.molcel.2007.04.011. [DOI] [PubMed] [Google Scholar]
- 17.Saldi T, Fong N, Bentley DL. Transcription elongation rate affects nascent histone pre-mRNA folding and 3' end processing. Genes Dev. 2018;32:297–308. doi: 10.1101/gad.310896.117. [DOI] [PMC free article] [PubMed] [Google Scholar]
- 18.Hsin JP, Sheth A, Manley JL. RNAP II CTD phosphorylated on threonine-4 is required for histone mRNA 3' end processing. Science. 2011;334:683–6. doi: 10.1126/science.1206034. [DOI] [PMC free article] [PubMed] [Google Scholar]
- 19.Medlin J, et al. P-TEFb is not an essential elongation factor for the intronless human U2 snRNA and histone H2b genes. EMBO J. 2005;24:4154–65. doi: 10.1038/sj.emboj.7600876. [DOI] [PMC free article] [PubMed] [Google Scholar]
- 20.Hintermair C, et al. Threonine-4 of mammalian RNA polymerase II CTD is targeted by Polo-like kinase 3 and required for transcriptional elongation. EMBO J. 2012;31:2784–97. doi: 10.1038/emboj.2012.123. [DOI] [PMC free article] [PubMed] [Google Scholar]
- 21.Loyer P, et al. Characterization of cyclin L1 and L2 interactions with CDK11 and splicing factors: influence of cyclin L isoforms on splice site selection. J Biol Chem. 2008;283:7721–32. doi: 10.1074/jbc.M708188200. [DOI] [PubMed] [Google Scholar]
- 22.Cornelis S, et al. Identification and characterization of a novel cell cycle-regulated internal ribosome entry site. Mol Cell. 2000;5:597–605. doi: 10.1016/s1097-2765(00)80239-7. [DOI] [PubMed] [Google Scholar]
- 23.Hu D, Valentine M, Kidd VJ, Lahti JM. CDK11(p58) is required for the maintenance of sister chromatid cohesion. J Cell Sci. 2007;120:2424–34. doi: 10.1242/jcs.007963. [DOI] [PubMed] [Google Scholar]
- 24.Petretti C, et al. The PITSLRE/CDK11p58 protein kinase promotes centrosome maturation and bipolar spindle formation. EMBO Rep. 2006;7:418–24. doi: 10.1038/sj.embor.7400639. [DOI] [PMC free article] [PubMed] [Google Scholar]
- 25.Zhou Y, Shen JK, Hornicek FJ, Kan Q, Duan Z. The emerging roles and therapeutic potential of cyclin-dependent kinase 11 (CDK11) in human cancer. Oncotarget. 2016;7:40846–40859. doi: 10.18632/oncotarget.8519. [DOI] [PMC free article] [PubMed] [Google Scholar]
- 26.Li T, Inoue A, Lahti JM, Kidd VJ. Failure to proliferate and mitotic arrest of CDK11(p110/p58)-null mutant mice at the blastocyst stage of embryonic cell development. Mol Cell Biol. 2004;24:3188–97. doi: 10.1128/MCB.24.8.3188-3197.2004. [DOI] [PMC free article] [PubMed] [Google Scholar]
- 27.Hu D, Mayeda A, Trembley JH, Lahti JM, Kidd VJ. CDK11 complexes promote pre-mRNA splicing. J Biol Chem. 2003;278:8623–9. doi: 10.1074/jbc.M210057200. [DOI] [PubMed] [Google Scholar]
- 28.Trembley JH, et al. PITSLRE p110 protein kinases associate with transcription complexes and affect their activity. J Biol Chem. 2002;277:2589–96. doi: 10.1074/jbc.M109755200. [DOI] [PubMed] [Google Scholar]
- 29.Valente ST, Gilmartin GM, Venkatarama K, Arriagada G, Goff SP. HIV-1 mRNA 3' end processing is distinctively regulated by eIF3f, CDK11, and splice factor 9G8. Mol Cell. 2009;36:279–89. doi: 10.1016/j.molcel.2009.10.004. [DOI] [PMC free article] [PubMed] [Google Scholar]
- 30.Tiedemann RE, et al. Identification of molecular vulnerabilities in human multiple myeloma cells by RNA interference lethality screening of the druggable genome. Cancer Res. 2012;72:757–68. doi: 10.1158/0008-5472.CAN-11-2781. [DOI] [PMC free article] [PubMed] [Google Scholar]
- 31.Chi Y, et al. Abnormal expression of CDK11p58 in prostate cancer. Cancer Cell Int. 2014;14:2. doi: 10.1186/1475-2867-14-2. [DOI] [PMC free article] [PubMed] [Google Scholar]
- 32.Duan Z, et al. Systematic kinome shRNA screening identifies CDK11 (PITSLRE) kinase expression is critical for osteosarcoma cell growth and proliferation. Clin Cancer Res. 2012;18:4580–8. doi: 10.1158/1078-0432.CCR-12-1157. [DOI] [PubMed] [Google Scholar]
- 33.Kren BT, et al. Preclinical evaluation of cyclin dependent kinase 11 and casein kinase 2 survival kinases as RNA interference targets for triple negative breast cancer therapy. Breast Cancer Res. 2015;17:524. doi: 10.1186/s13058-015-0524-0. [DOI] [PMC free article] [PubMed] [Google Scholar]
- 34.Liu X, et al. Cyclin-Dependent Kinase 11 (CDK11) Is Required for Ovarian Cancer Cell Growth In Vitro and In Vivo, and Its Inhibition Causes Apoptosis and Sensitizes Cells to Paclitaxel. Mol Cancer Ther. 2016;15:1691–701. doi: 10.1158/1535-7163.MCT-16-0032. [DOI] [PMC free article] [PubMed] [Google Scholar]
- 35.Du Y, et al. CDK11(p110) plays a critical role in the tumorigenicity of esophageal squamous cell carcinoma cells and is a potential drug target. Cell Cycle. 2019;18:452–466. doi: 10.1080/15384101.2019.1577665. [DOI] [PMC free article] [PubMed] [Google Scholar]
- 36.Sokolova M, et al. Genome-wide screen of cell-cycle regulators in normal and tumor cells identifies a differential response to nucleosome depletion. Cell Cycle. 2017;16:189–199. doi: 10.1080/15384101.2016.1261765. [DOI] [PMC free article] [PubMed] [Google Scholar]
- 37.Yang XC, Burch BD, Yan Y, Marzluff WF, Dominski Z. FLASH, a proapoptotic protein involved in activation of caspase-8, is essential for 3' end processing of histone pre-mRNAs. Mol Cell. 2009;36:267–78. doi: 10.1016/j.molcel.2009.08.016. [DOI] [PMC free article] [PubMed] [Google Scholar]
- 38.Kohoutek J, Blazek D. Cyclin K goes with Cdk12 and Cdk13. Cell Div. 2012;7:12. doi: 10.1186/1747-1028-7-12. [DOI] [PMC free article] [PubMed] [Google Scholar]
- 39.Marzluff WF, Wagner EJ, Duronio RJ. Metabolism and regulation of canonical histone mRNAs: life without a poly(A) tail. Nat Rev Genet. 2008;9:843–54. doi: 10.1038/nrg2438. [DOI] [PMC free article] [PubMed] [Google Scholar]
- 40.Zhao J, et al. NPAT links cyclin E-Cdk2 to the regulation of replication-dependent histone gene transcription. Genes Dev. 2000;14:2283–97. [PMC free article] [PubMed] [Google Scholar]
- 41.Castello A, et al. Insights into RNA biology from an atlas of mammalian mRNA-binding proteins. Cell. 2012;149:1393–406. doi: 10.1016/j.cell.2012.04.031. [DOI] [PubMed] [Google Scholar]
- 42.Baltz AG, et al. The mRNA-bound proteome and its global occupancy profile on protein-coding transcripts. Mol Cell. 2012;46:674–90. doi: 10.1016/j.molcel.2012.05.021. [DOI] [PubMed] [Google Scholar]
- 43.Konig J, et al. iCLIP reveals the function of hnRNP particles in splicing at individual nucleotide resolution. Nat Struct Mol Biol. 2010;17:909–15. doi: 10.1038/nsmb.1838. [DOI] [PMC free article] [PubMed] [Google Scholar]
- 44.Van Nostrand EL, et al. Robust transcriptome-wide discovery of RNA-binding protein binding sites with enhanced CLIP (eCLIP) Nat Methods. 2016;13:508–14. doi: 10.1038/nmeth.3810. [DOI] [PMC free article] [PubMed] [Google Scholar]
- 45.Beltran M, et al. The interaction of PRC2 with RNA or chromatin is mutually antagonistic. Genome Res. 2016;26:896–907. doi: 10.1101/gr.197632.115. [DOI] [PMC free article] [PubMed] [Google Scholar]
- 46.Trembley JH, Hu D, Slaughter CA, Lahti JM, Kidd VJ. Casein kinase 2 interacts with cyclin-dependent kinase 11 (CDK11) in vivo and phosphorylates both the RNA polymerase II carboxyl-terminal domain and CDK11 in vitro. J Biol Chem. 2003;278:2265–70. doi: 10.1074/jbc.M207518200. [DOI] [PubMed] [Google Scholar]
- 47.Pak V, et al. CDK11 in TREX/THOC Regulates HIV mRNA 3' End Processing. Cell Host Microbe. 2015;18:560–70. doi: 10.1016/j.chom.2015.10.012. [DOI] [PMC free article] [PubMed] [Google Scholar]
- 48.Peterlin BM, Price DH. Controlling the elongation phase of transcription with P-TEFb. Mol Cell. 2006;23:297–305. doi: 10.1016/j.molcel.2006.06.014. [DOI] [PubMed] [Google Scholar]
- 49.Bosken CA, et al. The structure and substrate specificity of human Cdk12/Cyclin K. Nat Commun. 2014;5 doi: 10.1038/ncomms4505. 3505. [DOI] [PMC free article] [PubMed] [Google Scholar]
- 50.Lyons SM, et al. A subset of replication-dependent histone mRNAs are expressed as polyadenylated RNAs in terminally differentiated tissues. Nucleic Acids Res. 2012;44:9190–9205. doi: 10.1093/nar/gkw620. [DOI] [PMC free article] [PubMed] [Google Scholar]
- 51.Larochelle S, et al. Cyclin-dependent kinase control of the initiation-to-elongation switch of RNA polymerase II. Nat Struct Mol Biol. 2012;19:1108–15. doi: 10.1038/nsmb.2399. [DOI] [PMC free article] [PubMed] [Google Scholar]
- 52.Gruber JJ, et al. Ars2 promotes proper replication-dependent histone mRNA 3' end formation. Mol Cell. 2012;45:87–98. doi: 10.1016/j.molcel.2011.12.020. [DOI] [PMC free article] [PubMed] [Google Scholar]
- 53.Sullivan KD, Mullen TE, Marzluff WF, Wagner EJ. Knockdown of SLBP results in nuclear retention of histone mRNA. RNA. 2009;15:459–72. doi: 10.1261/rna.1205409. [DOI] [PMC free article] [PubMed] [Google Scholar]
- 54.Drogat J, et al. Cdk11-cyclinL controls the assembly of the RNA polymerase II mediator complex. Cell Rep. 2012;2:1068–76. doi: 10.1016/j.celrep.2012.09.027. [DOI] [PubMed] [Google Scholar]
- 55.Kim DU, et al. Analysis of a genome-wide set of gene deletions in the fission yeast Schizosaccharomyces pombe. Nat Biotechnol. 2010;28:617–623. doi: 10.1038/nbt.1628. [DOI] [PMC free article] [PubMed] [Google Scholar]
- 56.Kurat CF, et al. Regulation of histone gene transcription in yeast. Cell Mol Life Sci. 2014;71:599–613. doi: 10.1007/s00018-013-1443-9. [DOI] [PMC free article] [PubMed] [Google Scholar]
- 57.Barcaroli D, et al. FLASH is required for histone transcription and S-phase progression. Proc Natl Acad Sci U S A. 2006;103:14808–12. doi: 10.1073/pnas.0604227103. [DOI] [PMC free article] [PubMed] [Google Scholar]
- 58.Chapman RD, et al. Transcribing RNA polymerase II is phosphorylated at CTD residue serine-7. Science. 2007;318:1780–2. doi: 10.1126/science.1145977. [DOI] [PubMed] [Google Scholar]
- 59.Schuller R, et al. Heptad-Specific Phosphorylation of RNA Polymerase II CTD. Mol Cell. 2016;61:305–14. doi: 10.1016/j.molcel.2015.12.003. [DOI] [PubMed] [Google Scholar]
- 60.Lin A, et al. Off-target toxicity is a common mechanism of action of cancer drugs undergoing clinical trials. Sci Transl Med. 2019;11 doi: 10.1126/scitranslmed.aaw8412. [DOI] [PMC free article] [PubMed] [Google Scholar]
- 61.Rouschop KM, et al. Deregulation of cap-dependent mRNA translation increases tumour radiosensitivity through reduction of the hypoxic fraction. Radiother Oncol. 2011;99:385–391. doi: 10.1016/j.radonc.2011.05.047. [DOI] [PubMed] [Google Scholar]
- 62.Huppertz I, et al. iCLIP: protein-RNA interactions at nucleotide resolution. Methods. 2014;65:274–287. doi: 10.1016/j.ymeth.2013.10.011. [DOI] [PMC free article] [PubMed] [Google Scholar]
- 63.Roberts TC, et al. Quantification of nascent transcription by bromouridine immunocapture nuclear run-on RT-qPCR. Nature protocols. 2015;10:1198–1211. doi: 10.1038/nprot.2015.076. [DOI] [PMC free article] [PubMed] [Google Scholar]
- 64.Mahat DB, et al. Base-pair-resolution genome-wide mapping of active RNA polymerases using precision nuclear run-on (PRO-seq) Nature protocols. 2016;11:1455–1476. doi: 10.1038/nprot.2016.086. [DOI] [PMC free article] [PubMed] [Google Scholar]
- 65.Livak KJ, Schmittgen TD. Analysis of relative gene expression data using real-time quantitative PCR and the 2(-Delta Delta C(T)) Method. Methods. 2001;25:402–408. doi: 10.1006/meth.2001.1262. [DOI] [PubMed] [Google Scholar]
- 66.Narita T, et al. NELF interacts with CBC and participates in 3' end processing of replication-dependent histone mRNAs. Molecular cell. 2007;26:349–365. doi: 10.1016/j.molcel.2007.04.011. [DOI] [PubMed] [Google Scholar]
Associated Data
This section collects any data citations, data availability statements, or supplementary materials included in this article.


