Abstract
Cellulose nanocrystals (CNCs) are bio-sourced chiral nanorods that can form stable colloidal suspensions able to spontaneously assemble above a critical concentration into a cholesteric liquid crystal, with a cholesteric pitch usually in the micron range. When these suspensions are dried on a substrate, solid films with a pitch of the order of few hundreds of nanometers can be produced, leading to intense reflection in the visible range. However, the resulting cholesteric nanostructure is usually not homogeneous within a sample and comports important variations of the cholesteric domain orientation and pitch, which affect the photonic properties. In this work, we first propose a model accounting for the formation of the photonic structure from the vertical compression of the cholesteric suspension upon solvent evaporation, starting at the onset of the kinetic arrest of the drying suspension and ending when solvent evaporation is complete. From that assumption, various structural features of the films can be derived, such as the variation of the cholesteric pitch with the domain tilt, the orientation distribution density of the final cholesteric domains and the distortion of the helix from the unperturbed cholesteric case. The angular-resolved optical response of such films is then derived, including the iridescence and the generation of higher order reflection bands, and a simulation of the angular optical response is provided, including its tailoring under external magnetic fields. Second, we conducted an experimental investigation of CNC films covering a structural and optical analysis of the films. The macroscopic appearance of the films is discussed and complemented with angular-resolved optical spectroscopy, optical and electron microscopy, and our quantitative analysis shows an excellent agreement with the proposed model. This allows us to access the precise composition and the pitch of the suspension when it transited into a kinetically arrested phase directly from the optical analysis of the film. This work highlights the key role that the anisotropic compression of the kinetically arrested state plays in the formation of CNC films and is relevant to the broader case of structure formation in cast dispersions and colloidal self-assembly upon solvent evaporation.
I. Introduction
Colloidal self-assembly is a powerful pathway to produce a variety of nanostructures that can display selective optical properties analogous to some biological tissues found in nature.[1–3] Understanding and controlling these self-assembly routes remains however challenging, as many competing phenomena operate simultaneously at different length scales to produce the final structure in the material, and therefore their optical response.
Cellulose Nanocrystals (CNCs) are chiral and negatively charged nanorods that form stable colloidal liquid cristalline suspensions in water and can lead to solid-state, structurally colored films simply by drying the suspension in a dish under specific conditions.[4–8] The biocompatible, low-cost and renewable characteristics of CNCs, as well as the apparent simplicity of their self-assembly into colored photonic structures, motivated the growing interest over the last two decades on applying CNC films in a variety of applications.[9–15]
Producing uniform optical properties in CNC films from cast suspensions (e.g., on a flat substrate or inside a horizontal dish) remains a huge challenge because several macroscopic constraints affect the assembly, inducing concentration gradients, evolving boundary conditions and non-equilibrium effects.[8, 16, 17] Such effects are more prominent in the case of fast evaporation dynamics and result in poorly controlled particle accumulation at the edge of the film (coffee-ring effect, cf.[18, 19]) and structural deformations of the final dried material. While a slow solvent evaporation is key to producing well-ordered structures by reducing convective flows and other liquid crystalline defects, the vertical compression experienced upon drying intervenes eventually in all cases.[20–23]
CNCs are chiral nanorods with typical dimensions of 100-200 nm in length and 5-25 nm in width, stabilized in aqueous media by their negative charge when produced, e.g., by sulfuric acid hydrolysis of cotton-sourced cellulose fibers.[24, 25] Above a threshold concentration, they spontaneously form a cholesteric liquid crystalline phase, whereby they locally align their longer axis along the director, , which describes a left-handed helicoid characterized by its helical axis, , and its full-turn pitch, p. While the pitch is in the micron range in the suspension state, the films obtained by solvent evaporation often display sub-micron pitches, allowing for the reflection of visible light with left-handed circular polarization.[26]
The control of the cholesteric structure in CNC assemblies is essential to their implementation in optical systems, as the final pitch value in a CNC film defines the wavelengths of the reflected light, and the orientation of the cholesteric domain controls its angular dependence. The formation of the CNC film involves however a complex interplay of different interactions intervening at multiple length scales. The formation of the final structure can be separated into several steps described below:[8]
First, the CNC suspension undergoes a phase transition upon concentration increase (triggered by solvent evaporation), understood in the framework of Onsager’s seminal work for spherocylinders as a loss of rotational entropy compensated by a translational entropy gain.[27–30] The chiral nature of the CNCs and their resulting chiral interaction is currently poorly understood, but leads to the formation of a cholesteric phase, where the local twisting arises from the complex mutual interactions between CNCs and decreases with increasing CNC and electrolyte concentrations.[31, 32]
This phase transition usually occurs through a nucleation-growth mechanism, whereby the cholesteric phase forms in small droplets, known as tactoids. These tactoids are surrounded by an isotropic phase and their helical axis is randomly oriented in the suspension.[33] Over time, these tactoids dynamically rearrange, coalesce and slowly sediment. As the suspension evolves from biphasic to fully cholesteric upon solvent evaporation, the cholesteric domains are no longer separated by isotropic suspension but by grain boundaries with a relatively complex cholesteric reorganization and trapping of topological defects.[34–38] Locally, the evaporation conditions can cause additional flow in the drying suspension and lead to macroscopic accumulation of CNCs near the contact line, an example of coffee-ring effect.[18, 19] At the end of that complex stage, the orientation of the cholesteric domains depends on many factors, and can present good vertical alignment through anchoring at the interfaces, or a rather disoriented distribution inherited from the initial random tactoid orientation, e.g., for thicker samples or faster solvent evaporation.
Further solvent evaporation leads to a kinetic arrest of the suspension, whereby the gradual increase of the particle concentration and ionic strength hinders the collective relaxation of the rods.[39] This transition can be due to the percolation of the repulsive particles (a colloidal glass),[40–42] or their salt-mediated aggregation (a colloidal gel).[43, 44] The kinetic arrest typically occurs at volume fractions of Φ ~ 0.1-0.2, but much lower threshold values are observed at very low ionic strengths.[45, 46]
Once the suspension became kinetically arrested, the evaporation front of the remaining solvent and the geometric constraints of the sample (e.g., substrate, free interfaces) leads to a mechanical stress and causes a distortion of the structure.[47] Controlling them can lead to an isotropic,[48] or an anisotropic compression to the cholesteric structure.[8, 49, 50] This significantly influences the order and the morphology of the dried material, as well as the resulting angular optical response.[48, 51] We recently highlighted this key mechanism in the assembly of CNCs in microdroplets. In this particular case, the isotropic compression introduced by the spherical confinement led to a very unique scaling law, resulting in a much larger pitch in the final structure compared to flat CNC films.[48]
In this work, we address the effects of this final compression step during the self-assembly process of a CNC suspension in a planar configuration, combining theoretical modeling and experimental observations. Importantly, the previous stages occuring prior to the onset of the kinetic arrest and involving coalescence, anchoring and cholesteric relaxation are outside the scope of this work.
In the first section, we describe the formation of CNC films as a set of cholesteric domains of given initial orientation that are subject to a linear deformation process. To illustrate different possibilities, we consider an initially isotropic distribution of cholesteric domains, as well as a set of magnetically aligned configurations, while the anchoring effects are not included. Our model is based on a simple assumption that, once the kinetic arrest has taken place, the arrangement in the liquid crystalline phase in suspension is locked and upon further solvent evaporation the structure is subject to a vertical compression that can be described in the limit of affine deformation. This model allows predicting several aspects of the structure of CNC films, namely: the angular dependence of the cholesteric pitch, the reorientation of the domains, the angular distribution of the domains provided the initial one in the arrested suspension is known, the distortion of the helical order and its visualization in film cross-section. In the second section, we model the optical and photonic properties of the resulting structure, addressing the macroscopic and microscopic optical response of the films and the mapping of the angular optical response of films prepared in various conditions. The third section describes the experimental sample analysis, including the optical observations of CNC films at macroscopic and microscopic scales, the angular-resolved optical spectroscopy in specular and off-specular conditions, and the observation of film cross-sections using scanning electron microscopy. Finally, we discuss the implications of our model and its limitations and summarize our main findings in key bullet points.
II. Modeling the Structure
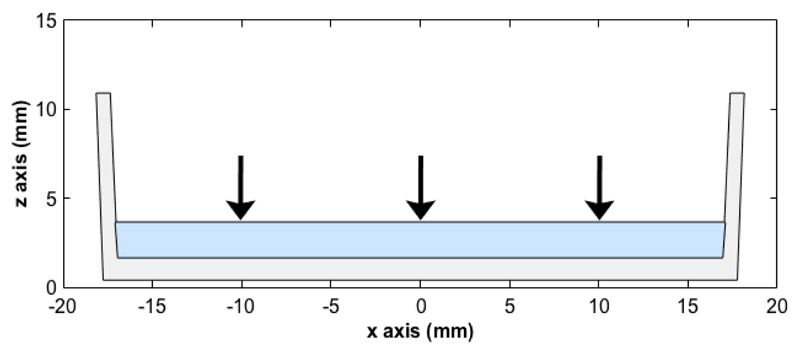
A CNC suspension cast on a flat surface (such as in the petri dish used in this work) and that reached the kinetic arrest is illustrated in Fig. 1. Assuming the system is no longer able to relax towards a minimum energy state, we model the drying process of the arrested suspension as an affine deformation of initially randomly oriented cholesteric domains of identical pitch p. The deformation is assumed to be purely a compression along the vertical direction, with no lateral compression or elongation in the horizontal plane and no shear.
Figure 1.
Schematic of a CNC suspension (in blue) drying in a petri dish. Black arrows represent the vertical compression experienced upon drying after the kinetic arrest has occurred.
A. Cholesteric order before deformation
In the following, we start by defining the initial cholesteric structure of a suspension at the onset of the kinetic arrest, right before the unidirectional anisotropic compression started to affect it.
A cholesteric structure is locally defined by a nematic ordering along a director , which rotates as a periodic function of distance along a helical axis, defined as parallel to (we deliberately distinguish unitary vectors with ^ notation). Both and are symmetric by inversion ( = - , = - ) and can be locally defined in position r as
| (1) |
| (2) |
| (3) |
where φ is the azimuthal angle of describing its rotation about (the negative sign accounting for a left-handed helix), and q = 2π/p, with p the helical pitch before distortion.
Let us consider a polydomain cholesteric phase locally composed of domains with randomized orientation, while the pitch p is considered homogeneous across the sample. In the laboratory framework (, , ) where positions are noted r = (x, y, z), each of such cholesteric domain tilted with respect to the vertical axis can be described without loss of generality by a rotation about ê 2 = ŷ by an angle β ϵ [0, π/2]. The base (ê 1, ê 2, ê 3) is then defined as
| (4) |
In a polydomain cholesteric phase composed of randomly oriented domains, the local vectors and within each domain can be defined by
| (5) |
as illustrated in Fig. 2(a).
Figure 2.
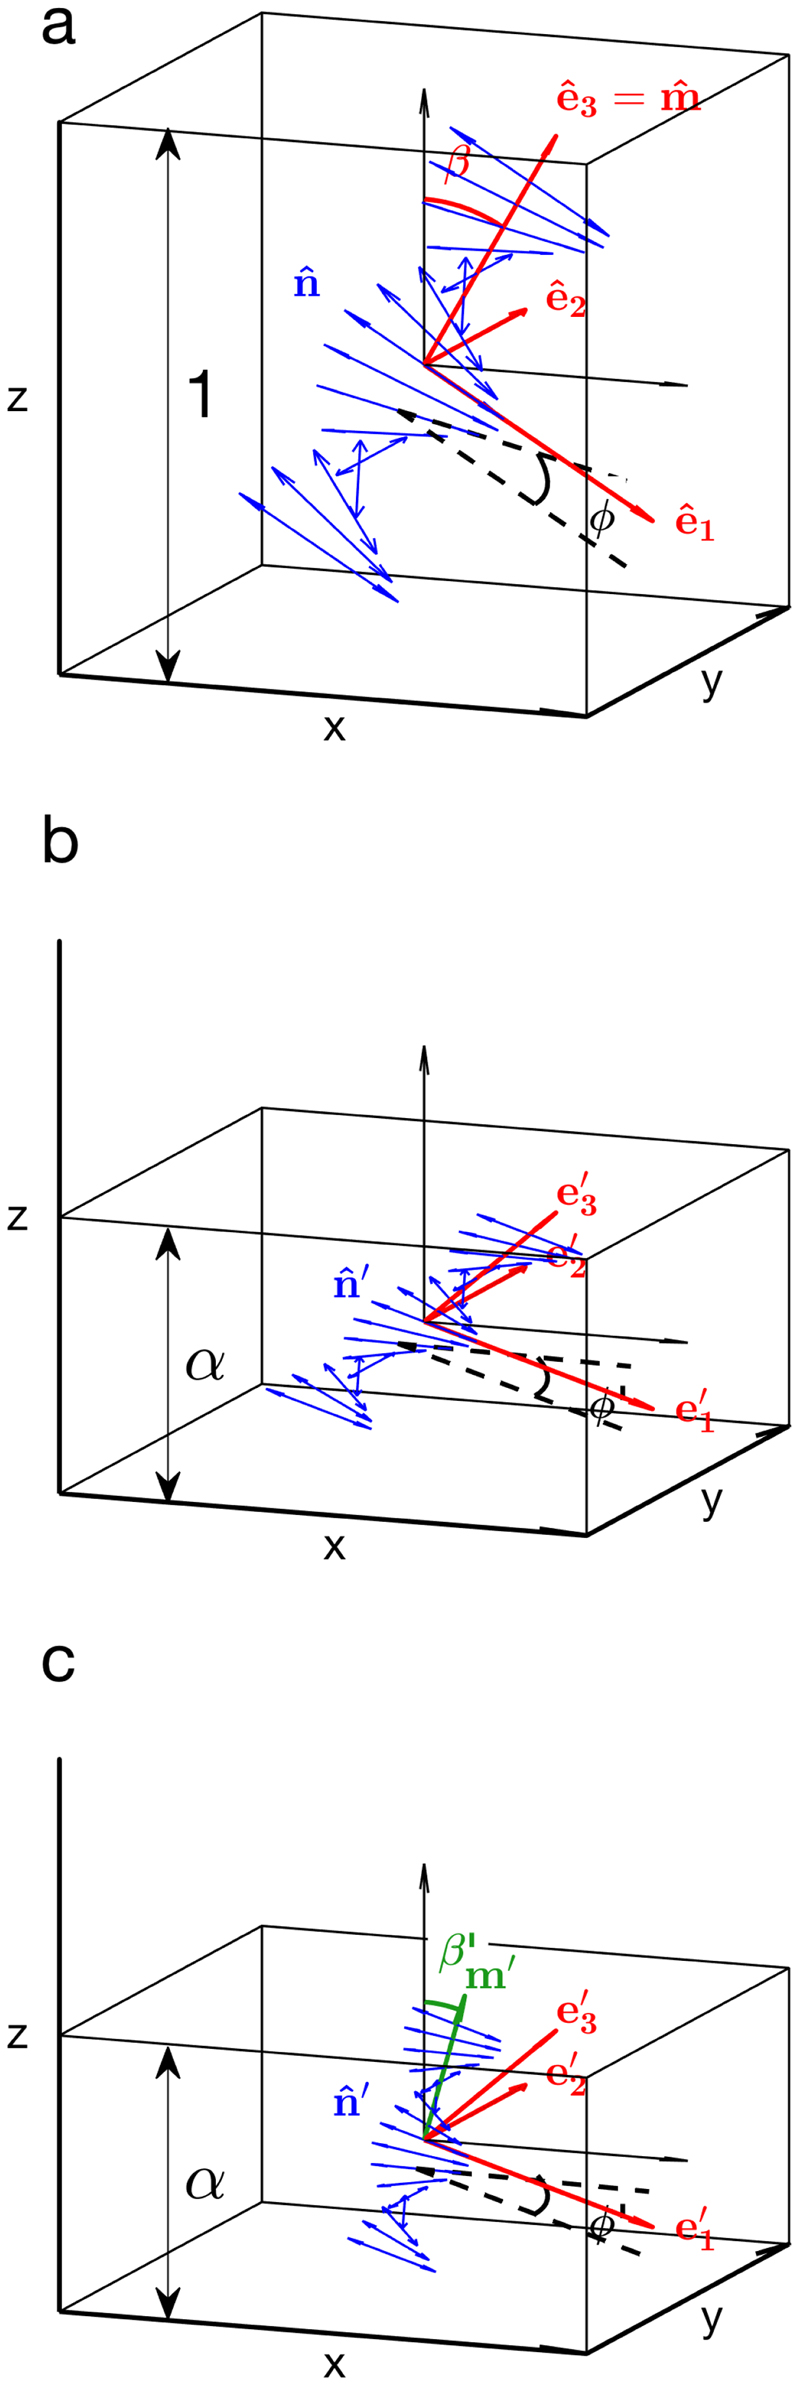
Schematic diagram of a tilted and left-handed cholesteric domain a) before deformation, b) after a unidirectional compression along scaling with a factor , c) after redefining the helical axis as . The directors and are depicted by double-headed arrows (in blue) to account for their symmetry by inversion.
This fully describes the cholesteric order within a tilted domain prior to the vertical compression.
B. Linear deformation upon vertical compression
During solvent evaporation, the capillary forces acting in the center of the drying suspension result in a unidirectional compression stress along ẑ (cf. Fig. 1). While a kinetically trapped cholesteric may have anisotropic mechanical properties along and normal to , we consider them negligible and treat the contraction of each domain as purely along the ẑ axis, i.e., neglecting any lateral deformation in the (, ) plane. This choice is at first motivated by symmetry arguments and the randomization of the domain orientations. The macroscopic boundary conditions impose a fixed lateral surface of the dish. The drying suspension is thus lateraly confined and should have no macroscopic distortions in the (, ) plane. We cannot completely exclude that each individual cholesteric domain that composes the kinetically trapped suspension could locally distort in the (, ) plane as they are compressed. However, the shared boundaries between adjacent domains and the randomization of their mutual orientation should statistically hinder such in-plane deformation, and justify that, on the individual domain length scale, the distortion remains purely uniaxial along the axis. Second, the magnitude of the compression along with respect to the other two directions should dominate most of the distortion. Finally, the absence of reliable data for the compliance tensor that would describe the anisotropic mechanical properties along and normal to within a cholesteric monodomain makes such refinement currently inapplicable and outside the scope of this work.
For a unidirectional compression strain of the liquid crystalline structure along , the deformation tensor acting locally on each cholesteric domain is given by
| (6) |
where is the compression ratio in the ẑ direction (0 < ≤ 1).
The originally orthonormal base (ê 1,ê 2,ê 3) transforms after compression into
| (7) |
which no longer constitutes an orthonormal base for < 1. Their explicit components after deformation are
| (8) |
as expressed in terms of the initial tilt angle β. The elementary volume before deformation is given by (ê1 × ê2) · ê3 = 1 and transforms after deformation into which accounts for the volume contraction.
Since (parallel to the actual rods) is contained into the plane (ê1, ê2), the strained director nʹ must be contained in the plane . However, the helical axis , which is parallel to ê3, has no other physical meaning than being always normal to throughout the cholesteric domain. This means that the new helical axis mʹ after transformation has to be redefined as being always normal to nʹ rather than parallel to Using (8), we first derive
| (9) |
| (10) |
Satisfying the condition and taking benefit of the collinearity of mʹ and the norm of mʹ is given by
| (11) |
which leads to
| (12) |
The norm corresponds to the contraction of the cholesteric pitch pʹ/p, where pʹ is the pitch of the strained helix measured along mʹ. The helix tilt βʹ after deformation is given by , which simplifies into
| (13) |
Combining (11) and (13) allows the pitch compression ratio to be expressed in terms of the original tilt β or the final tilt βʹ as
| (14a) |
| (14b) |
which is in agreement with the expected symmetry of the affine transformation between a compression ( < 1) and a stretch ( −1 > 1), where the initial and final angles are inverted.
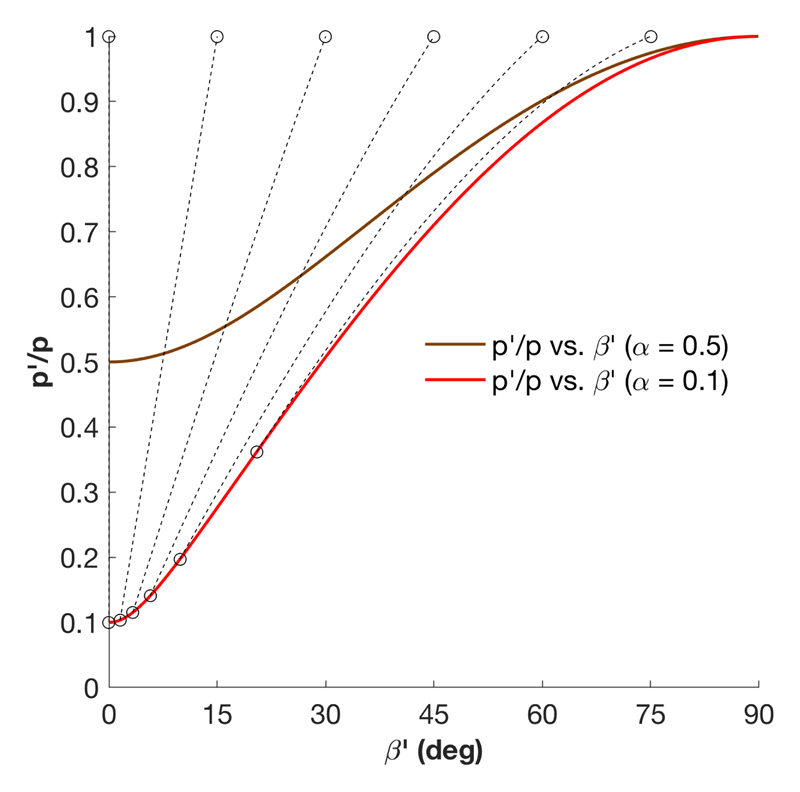
The combined effect of anisotropic pitch compression and domain reorientation is illustrated in Fig. 3. A direct consequence of this effect is that an initial suspension with misaligned domains of identical pitch will produce a film with a distribution of pitch values. The initially vertical domains remain well-aligned and get compressed the most, while initially tilted domains are significantly reoriented towards the vertical axis and present much larger final pitches. For the illustrated case of = 0.1, a final domain tilt of β′ ≈ 5° corresponds to a final pitch pʹ (βʹ) about 50% larger than the pitch of vertically aligned domains.
Figure 3.
Pitch compression ratio pʹ/p for two different values of . The ratio pʹ/p is reported in terms of the final tilt βʹ of the domain. Dashed lines illustrate the trajectories of the combined pitch decrease and domain reorientation as decreases upon compression, examplified for a set of different initial angles (open symbols).
Using (12-14b), mʹ can be reduced to
| (15) |
C. Distortion of the helicoidal order
The director field nʹ after distortion can be written as
| (16) |
However, nʹ is here expressed in terms of the angles β and φ that do not reflect its actual orientation with respect to the (, , ). After defining the unitary vector , it is possible to express it with the angles βʹ and φʹas
| (17) |
The helical angle φʹ after deformation is then obtained from
| (18) |
where Using (16) we get
| (19) |
or, using (14),
| (20) |
Here φ 0 represents the undistorted helical angle of the cholesteric, similar to the initial φ but spatially redefined as
| (21a) |
| (21b) |
| (21c) |
in the coordinates of the compressed film.
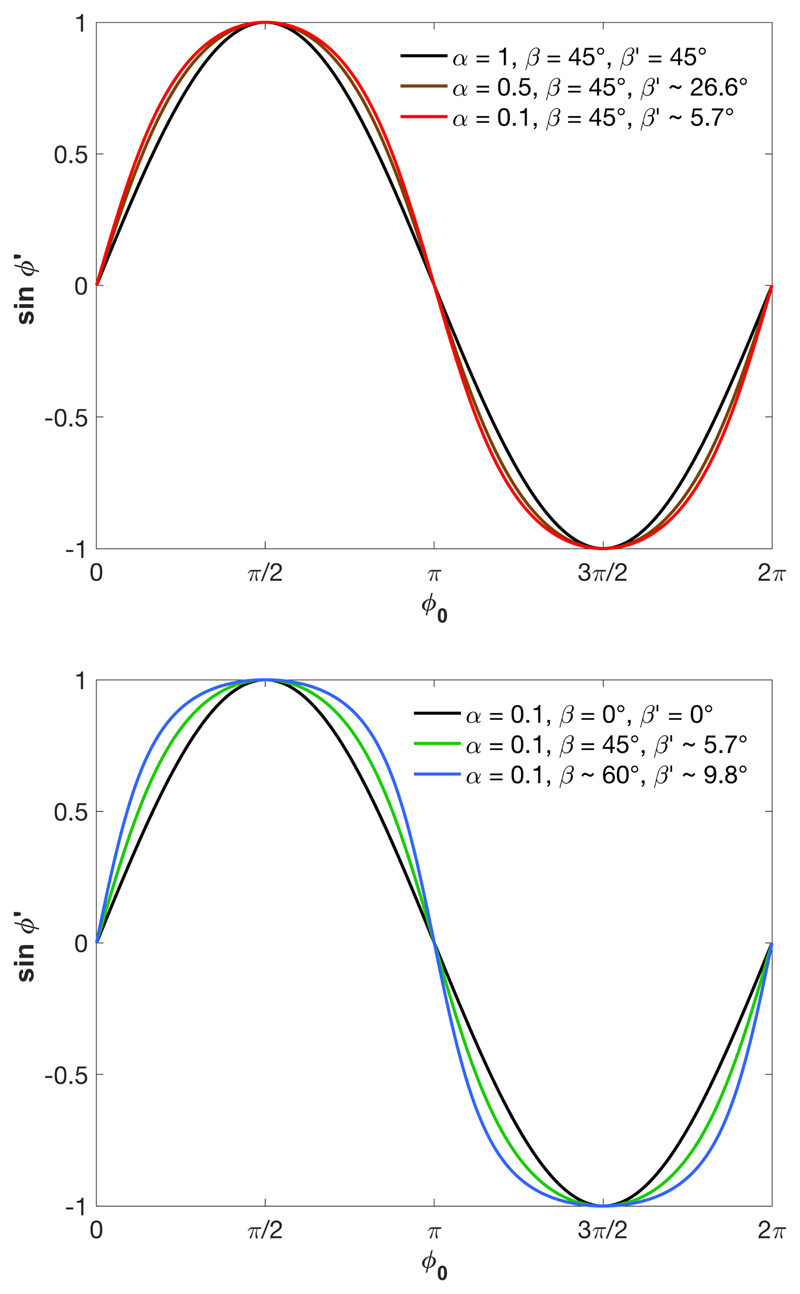
The distortion of the helical order is illustrated in Fig. 4 for different compression ratios and for different initial tilts β. As we can also see from (19), the unidirectional compression induces a distortion of the cholesteric order in originally tilted domains (β ≠ 0), while the helix remains undistorted for β = 0.
Figure 4.
Distortion of the helical order illustrated by the variation of the helical angle φʹ after unidirectional deformation. top: different compression ratios at fixed initial tilt β = 45 degrees; bottom: constant = 0.1 for different initial tilts β.
D. Generalization for any azimuthal angle
While the structure of cholesteric domains is unaffected by a rotation about ẑ, we introduce here for later use the components of and expressed with an additional nonzero azimuthal angle φʹ:
| (22) |
and
| (23) |
E. Cross-section of the structure in the vertical plane (, )
When performing a cross-section of the film (e.g., by TEM microtomes or SEM), the intersection of the cholesteric director with the cross-section plane gives rise to a periodic pattern known as the Bouligand arches.[52] If the cross-section plane of the cholesteric domain includes the helical axis , the apparent periodicity corresponds to half the pitch, pʹ/2. If the domain is cut with a local tilt θ cut, we observe a periodic pattern associated to an apparent pitch given by
| (24) |
Using the general expression (22), we can formally describe observed in the plane (, ) as
| (25) |
where we used the unitary vector obtained from
| (26) |
and Δφʹ = ξ–φʹ is the azimuthal angle between the domain orientation and the cross-section plane (cf. details in Appendix B). The stripes appear on the plane (, ) as tilted by an apparent angle defined as
| (27) |
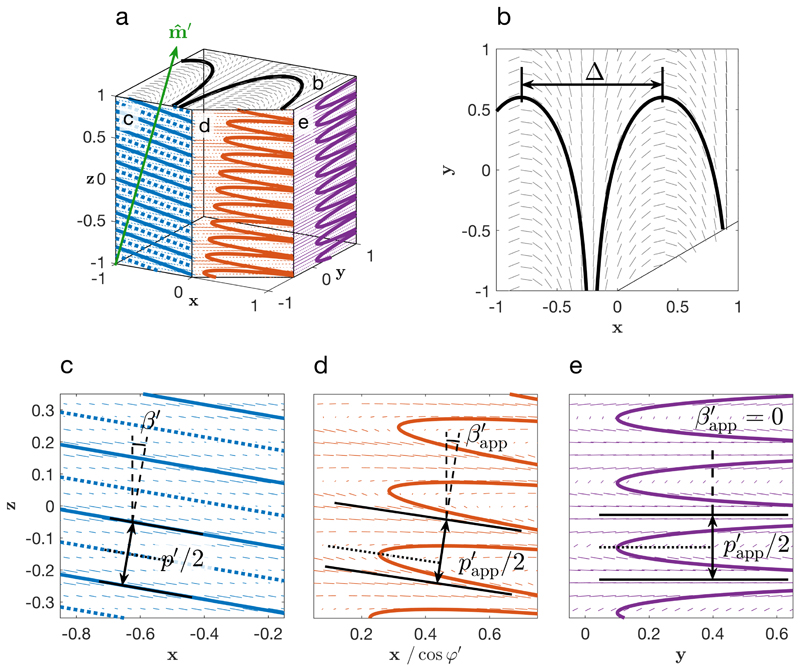
The slope of the local director in the cross-section plane allows deriving the analytic expressions of the curves representing the so-called Bouligand arches, shown in Fig. 5 (details in Appendix B). Interestingly, the distortion of the cholesteric order leads to asymmetric Bouligand arches on the cross-sections, except in the particular cross-sections planes (, ) [cf. Fig. 5(c)], and ( × , ) [cf. Fig. 5(e)].
Figure 5.
Multiple cross-section views of a distorted cholesteric domain with final orientation βʹ ≈ 9.8°, ϕʹ = 0°, after a compression of = 0.1 from an original orientation β = 60°, ϕ = 0°. The local orientation of is depicted by small arrows, while the continuity of across each face leads to the Bouligand arches, depicted by full lines. (a) corner view in perspective; (b) top view, generating periodic variations Δ= pʹ(βʹ) /(2sinβʹ) of , usually in the micron range, (c) cross-section in the plane containing (i.e., at an azimuthal angle Δϕʹ = 0° (d) cross-section at an azimuthal angle Δϕʹ = 30° leading to asymmetric Bouligand arches, arising from the distortion of the cholesteric order (the dotted line highlights the asymmetry), (e) cross-section in the (, ) plane (i.e., at an azimuthal angle Δϕʹ = 90°), leading to symmetric Bouligand arches, in spite of the distortion of the cholesteric order.
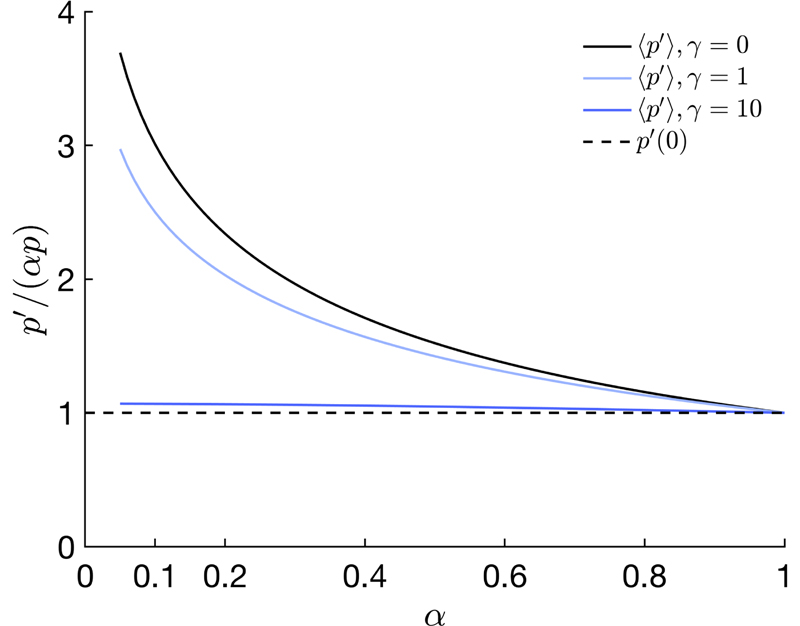
It appears from (24) and (25) that a small tilt in the cross-section angle leads to an apparent pitch in the cross-section that is just slightly larger than the actual pitch pʹ, with the difference being only of the second order in θ cut (e.g., for θ cut ≈ 10° we get pʹapp ≈ p′, with an over-estimation of pʹ by ~ 1.5%). This justifies the use of SEM cross-section imaging as a reliable way to measure pitch values in the films. However, such final tilts indicate that the initial domains were much more tilted prior to the compression, and thus present much larger pitch values than those being well aligned, as exposed in the section II B and Fig. 3. Indeed, a domain with a final tilt βʹ ≈ 10° will have an associated pitch about twice as large compared to those at βʹ ≈ 0° when assuming = 0.1. A systematic pitch comparison between films with tilted domains would benefit from measuring not only their average pʹ values (subject to the variability of observation angles) but also the minimum value of all the measured pitches, for the latter is more likely to capture the value of pʹ(βʹ = 0) that is uniquely defined for each film. If the initial domains were isotropically distributed, the average pitch 〈pʹ〉 is expected to be several times larger than the minimal pitch pʹ(β′ = 0), while the presence of vertical magnetic alignment or anchoring contributes to reduce this statistical bias, as it will be discussed in section II G and Fig. 8.
Figure 8.
Average pitch 〈pʹ〉 compared with the minimal pitch pʹ (0) = p in the film and computed for different ratios using Eq. (C5-C6), assuming different initial distributions of the domains: purely isotropic (γ = 0) and under a vertical magnetic alignment with γ = 1 and 10 and no anchoring. Note that a range of values for 〈pʹ〉/( p) closer to unity than the isotropic case are also possible from the sole effect of anchoring (cf. section II G 3).
F. Periodic perturbations in the horizontal plane (, )
The presence of tilted cholesteric domains with respect to the vertical axis causes in the resulting films a periodic rotation of in any horizontal plane (, ), from which undistorted Bouligand arches are expected [cf. Fig. 5(b)]. However, the edge of a domain might differ from this regular internal structure. Indeed, the need to accommodate for either the planar anchoring at the film-air interface or minimizing the discontinuity of the director field at the junction with another cholesteric domain placed immediately above or below can both lead to periodic structural defects in the director field , either as homeomorphic deformations of the Bouligand arches or as dechiralization lines of the same periodicity Δ.
The expected periodicity of such pattern is illustrated in Fig. 5(a,b) and is given by
| (28) |
where the periodicity Δ(βʹ) appears to be independent of the compression ratio . Figure 5(b) shows that these stripes are perpendicular to the plane containing (, ). Highly tilted domains lead to smaller Δ values, and it follows from (28) that p ≤ 2Δ, i.e., the smallest encountered periodicity Δ represents an upper limit to estimate p/2 in the arrested suspension.
G. Angular distribution of helical axes
1. Orientation Distribution Function (ODF) due to unidirectional compression
As shown in (13), the unidirectional compression leads to an effective decrease of the helical axis tilt, leading to some alignment of the cholesteric domains in the vertical axis.
The ODF in the dried film, f d(β′), resulting from the unidirectional compression, is given by (cf. Appendix C)
| (29) |
where f 0(β) represents the ODF before the distortion took place, i.e., when the liquid crystalline suspension became kinetically arrested.
The determination of the ODF f 0(β) prior to the compression step is complex and is not the primary scope of this work. Addressing the ideal case of an isotropic initial ODF allows for grasping the alignment effect solely due to the compression. This idealized situation corresponds to the absence of anchoring effects, which dominate in thin samples and slow evaporation processes. The initial isotropic ODF can thus be considered as a limiting case for thick films cast under faster evaporation conditions, when the anchoring front does not effectively propagate through the sample thickness (cf. more details in section II G 3).
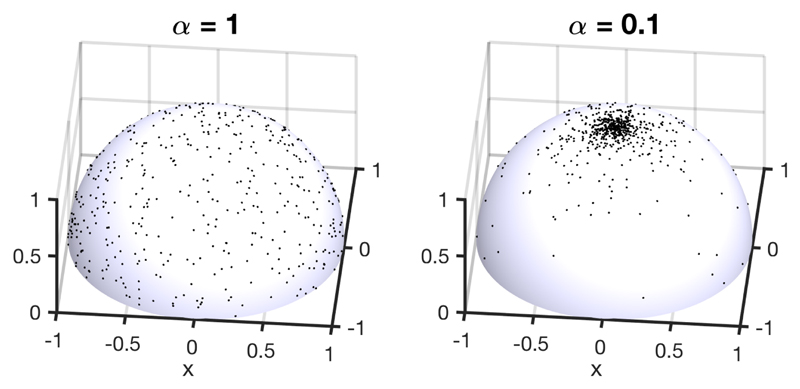
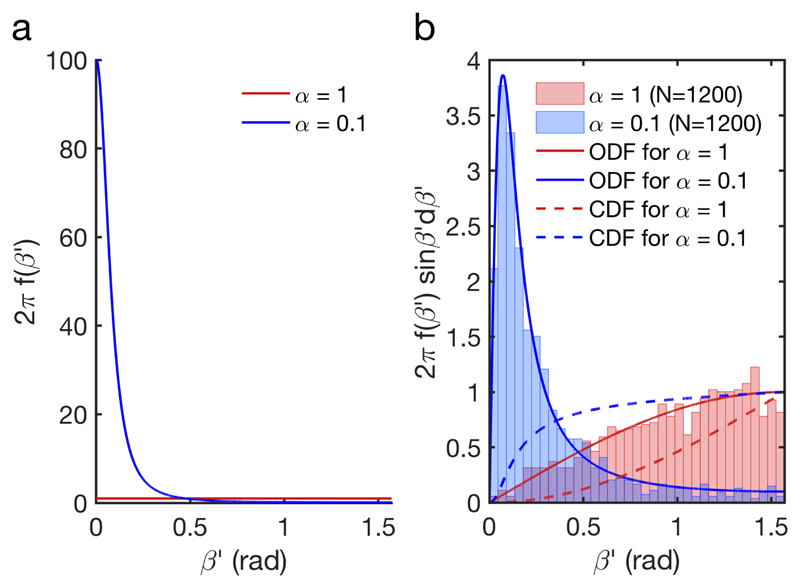
The case of an initially isotropic distribution of randomized helix orientations, f 0(β) = 1/2π, and its evolution after a vertical compression by a factor 10 (i.e., = 0.1) are shown in Fig. 6. Each of the N = 1200 randomly generated initial helix configurations was reoriented according to (13) (NB: we restrict by symmetry the angular space of the helices to the upper hemisphere of total solid angle 2π instead of 4π). The ODF before and after compression are illustrated in Fig. 7 and match the sampling of the configurations from Fig. 6.
Figure 6.
Random sample of N = 1200 configurations illustrating on the left an initially isotropic Orientation Distribution Function (ODF) (i.e., f 0(β) = 1/2π) and on the right its transformation f d(βʹ) after compression (assuming no anchoring at the interfaces).
Figure 7.
a) Orientation Distribution Function (ODF) of the helices in the initial isotropic state (f 0(β) = 1/2π, in red) and its transformation after compression (f d(βʹ), in blue), assuming no anchoring at the interfaces. b) the same ODFs multiplied by the spherical Jacobian (full lines), and their corresponding cumulative distribution functions (CDF, in dashed lines). The histograms correspond to the sampling of the configurations shown in Fig. 6.
The distribution of domains of different tilts βʹ directly leads to a distribution of pitches pʹ (βʹ). Assuming again an isotropic distribution of the domains prior to the compression, the average pitch 〈pʹ〉 can be estimated as a function of , as reported in Fig. 8 (cf. details in Appendix C). The isotropic assumption imply that the average pitch of a random domain in a film is about 2 to 3 times larger than the minimum possible pitch pʹ (0), while this mismatch is expected to decrease when a vertical magnetic field or anchoring is effective, as detailed in the next sections.
2. ODF due to pre-existing magnetic alignment
The alignment of individual CNCs and of their cholesteric domains can be controlled in suspension using various methods such as external fields,[23, 53–61], shear,[21, 62–65] or anchoring.[20, 22, 49] When the suspension is exposed to a sufficient magnetic field prior to the kinetic arrest transition, the CNCs align with their long axis perpendicular to the field. However, the field required to align individually these anisotropic diamagnetic crystals is usually difficult to access (typically μ 0 H ≥ 20 T for micron-long cellulose crystals).[55, 56] When the CNCs are assembled into cholesteric domains, the CNCs are locally all perpendicular to , and a much smaller field (0.5-1.5 T) becomes sufficient to align the cholesteric domains with the helical axis parallel to the external field H.[57–60] If such alignment is induced during the evaporation process, the initial ODF will be altered and thus affect the final ODF in the film.[23, 61]
The Zeeman energy of a monodomain cholesteric tactoid of volume V in a magnetic field H writes then as:[56]
| (30) |
where μ 0 is the vacuum permeability, kB the Boltzmann constant and T the temperature. Δχ = χ||–χ ⊥ is the positive anisotropic magnetic susceptibility of a cholesteric domain along its axis , arising from the negative anisotropic magnetic susceptibility of the CNCs locally aligned normal to it. We estimated Δχ = |ΦΔχ CNC| ~ +6·10−8 taking the volume fraction of CNC of Φ = 0.1 and Δχ CNC = 0.65·10−6.[56]
The local orientation of the cholesteric axis along the magnetic field can be hindered by many phenomena, among which the planar anchoring at the horizontal interfaces or the presence of coalescence dynamics between monodomain cholesteric tactoids.[34, 35] In the following model, we assume that the thermodynamic equilibrium is reached when the magnetic field is applied, the suspension is not yet kinetically trapped, and only the thermal flucturations counteract the magnetic torque orienting the domains.
Under such assumptions, the ODF of the cholesteric domains is obtained from the corresponding Boltzmann factor e−EH /kBT and its normalization after integration over all possible orientations (on the upper hemisphere):[56]
| (31a) |
| (31b) |
| (31c) |
with γ the orientational coupling parameter, Z a normalization constant and the imaginary error function erfi(x) = erf(i x)/i. In the absence of field, the isotropic distribution f H(β,ϕ) = f 0 = 1/2π is recovered.
In the case of a magnetic field applied along the direction defined by (βH,ϕH), we have
| (32) |
which simplifies to ( · Ĥ = cosβ for a vertical field.
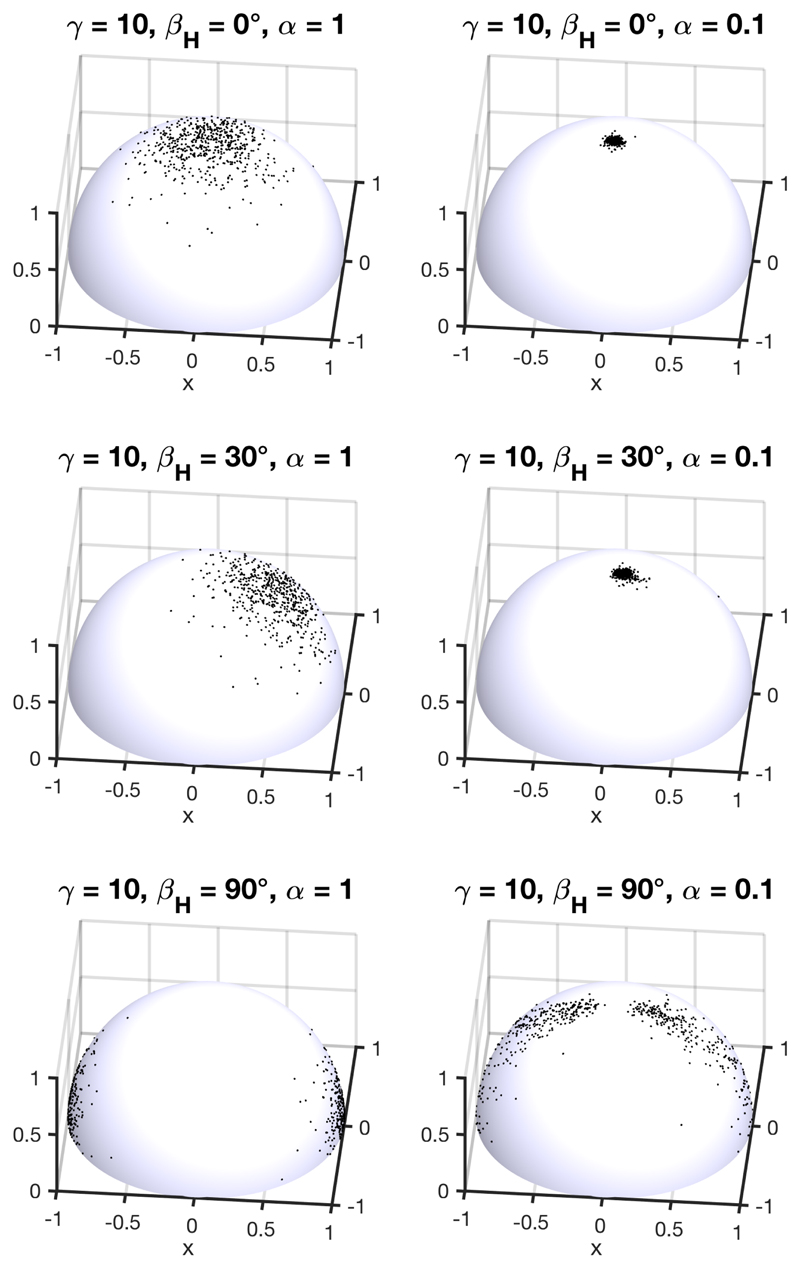
The effect of the magnetic alignment of the domains is illustrated in essence in Fig. 9, where different orientations of magnetic fields leads to different angular distributions of the cholesteric domains in the suspension, as well as in the corresponding films by simply using (13). For vertical magnetic fields, a stronger coupling should lead to an average pitch closer to p(0), as shown in Fig. 8.
Figure 9.
Random sample of N = 1200 configurations with on the left an initially anisotropic ODF (i.e., ) resulting from the magnetic alignment of the helices along an external magnetic field H tilted by an angle βH and on the right its transformation after compression ( = 0.1), assuming no anchoring at the interfaces.
The rotation time required for the alignment of a freely rotating tactoid of volume V immersed a newtonian fluid of viscosity η writes by equilibrating the magnetic (μ 0ΔχV H 2/2) and viscous torque (~ πηV) [66]:
| (33) |
which, remarkably, is independent of the domain volume V. For η ≈ 102 Pa s and μ 0 H = 0.5 T the corresponding τH is about 5 hours, to be compared with the evaporation kinetics before the suspension becomes kinetically trapped. However, these are only crude estimations, as CNC suspension at high concentrations present non-Newtonian behavior and are shear-thinning fluids. The estimation of their rheological response is very sample sensitive, namely from the source of CNCs, their extraction method and the ionic strength of the medium.[31, 67, 68]
While anchoring effects and field alignment may conflict and lead to a type of Fréedericksz transition,[69, 70] we neglect the effect of anchoring in this simplified model, which should be relevant for thicker films.
3. ODF due to pre-existing anchoring
In the two previous examples, we did not include anchoring as an alignment mechanism occurring in our films but in principle this remains possible, provided a predictive theory for the dynamics of coalescing tactoids near interfaces is successfully developed. Indeed, the effect of anchoring varies a lot with the casting conditions and can influence in various degrees the initial ODF. A crude attempt to model different degrees of anchoring can be derived with an associated anisotropic Boltzmann factor exp(–Ea(β)/kBT), where Ea(β) would corresponds to the energy of a domain under the influence of vertical anchoring conditions. By symmetry, it can be expanded as with P 2n (x) being the Legendre polynomials and a 2n ≥ 0 their associated prefactors of decreasing magnitude. If the expansion is limited to the first term [n = 1, i.e., P 2(cosβ) = (3cos2 β – 1)/2] and additional terms (n > 1) are neglected, the initial ODF is then formally equivalent to the one obtained under vertical magnetic alignment of coupling parameter γ ≥ 0, then redefined as an anchoring parameter γa = Ea/kBT [cf. (31b,31c) and (·Ĥ) = (·ẑ) as illustrated in Fig. 8 and 9 for βH = 0°]. The adjustment of the γa parameter allows for an empirical description of the anchoring effect in various conditions.
However, this formalism does not account for the propagating front of the alignment from the interface and its discontinuous nature in the film thickness, which would require a kinetic description of the process. In that regard, the time τ a required for anchoring to take place could be expected to vary as a diffusion process, to be compared to the time elapsed between the initial cholesteric alignment at the interfaces and the onset of the kinetic arrest, as occurring in the casting conditions:
| (34) |
where h is the suspension thickness when the anchoring takes place (much before the kinetic arrest takes place) and Da is a diffusion coefficient related to the propagation front of the domain reorientation under the influence of surface anchoring. The viscoelastic nature of cholesteric CNC suspension could however significantly impede such cooperative reorientation process and lead to a sub-diffusive behavior characterized by an exponent 0 < ν < 1.
Remarkably, this formalism is also compatible with the modeling of a magnetic alignment in any direction,
| (35) |
with ZH,a a normalization constant.
Since our attempts to include anchoring effects open interesting modeling possibilities but also new questions about the adjustment of their controlling parameters and its relevance in real experimental conditions, we prefer not to address here this apparently more accomplished case and believe it would be more suitable in a separate dedicated study.
III. Modeling the Optical Response
A. Fergason’s law
The interaction of light with cholesteric structures depends on the pitch, handedness and helix orientation with respect to the light propagation direction, as well as on the optical indices along and normal to the nematic director . When light propagates along the axis, the spatial modulation of the refractive index leads to the reflection of strongly circularly polarized light for a certain interval of wavelengths, as originally derived by de Vries,[71] and later refined by both analytical approaches ([26, 72, 73]) and numerical ones.[74, 75] The reflected wavelengths are centered around λ̃ = ñ pʹ, where ñ is the average optical index (hereafter, pʹ is used since we consider here the optical properties of dried films). The width of the reflection band scales with the birefringence Δn = ne - no such that Δλ = Δn pʹ, where ne and no are the extraordinary and ordinary optical indices, respectively, and defined in the direction parallel (resp. perpendicular) to the director . Notably, there are no higher-order reflection bands when light is propagating along . When light propagates at different angles, the reflected light is no longer purely circularly polarized, and additional reflection bands may arise.
In the case of low birefringence inside the cholesteric, the maximum reflected intensity observed at a wavelength λ̃ obeys in a good approximation Bragg’s law:
| (36) |
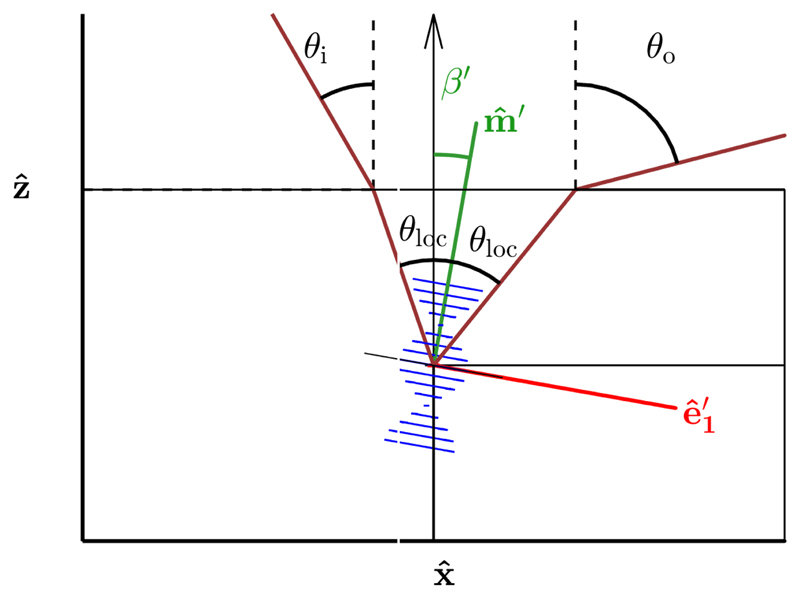
where θ loc is the local angle between the incident beam and , defined inside the medium, as well as the one between and the outgoing beam. The equality of these two angles corresponds to Bragg condition. When accounting for Snell’s law corrections at the medium-air interface, λ̃ is given by the so-called Fergason’s law:[76]
| (37) |
where θ i and θ o are respectively the angles of the incident and outgoing light with respect to the normal incidence, defined algebraicly such that θ i ≥ 0 and the sign of θ o is positive for specular reflection (cf. Figure 10). By attributing the collected light only to the domains locally under Bragg condition and neglecting the width of the optical reflection band, we can derive the local tilt of the helix of the contributing cholesteric domains as
| (38) |
The combinations of the expressions (37) and (38) allows for the calculation of the average reflected wavelength for a given set of incident and outgoing observation angles, where the pitch variation with the local tilt βʹ (i.e., after compression) is accounted for.
Figure 10.
Schematic of the light propagation inside the film in the plane (, ), with the angle definitions used to apply Fergason’s law (i.e., Bragg’s law corrected by Snell’s law).
The outgoing angle θ o and its corresponding wavelength λ̃ can be expressed in terms of the incident light angle θ i and the local tilt βʹ with respect to ẑ :
| (39a) |
| (39b) |
| (39c) |
where the parameter l refers to the order of the diffraction and βʹ is taken positive when pointing toward positive θ o values.
Finally, additional reflections can occur inside the film and become noticeable if the first order is very strong (e.g., after magnetic alignment), as detailed in Appendix D.
B. Generation of higher order reflection bands
When light propagates parallel to the helical axis of an undistorted left-handed cholesteric domain (k i // ), we observe the reflection of the left-circularly polarized (LCP) components of the band of wavelengths such as nop < λ < nep, while the right circularly polarization (RCP) is transmitted. Importantly, such reflection band presents no higher order reflection bands as long as the light propagates strictly parallel to the helical axis .[26] This is no longer the case if the light propagates at locally non-zero incident angles (θ loc ≠ 0), or if the helicoidal angle φ′ is periodically modulated. Since the distorted cholesteric produced by the undirectional drying leads to such modulation, we expect these higher orders to occur even when the light propagates along the helical axis (θ loc = 0).[26]
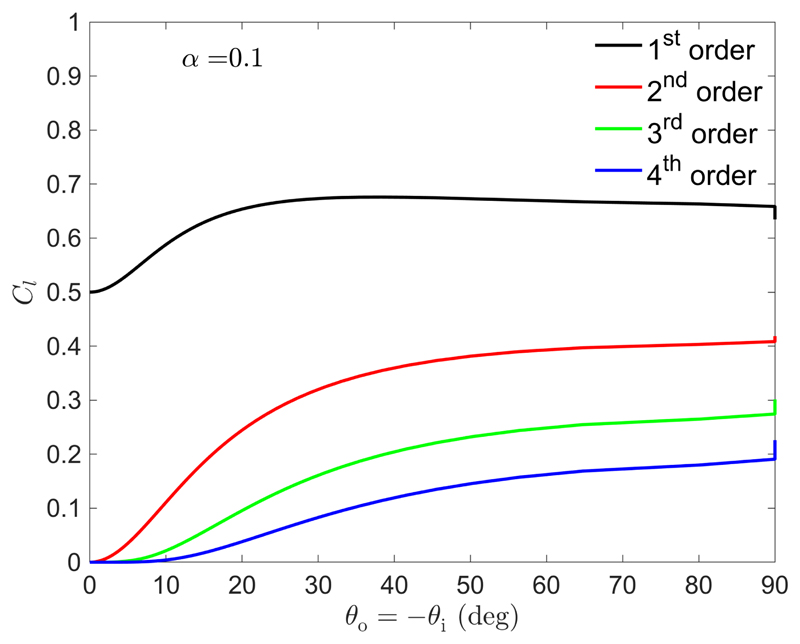
The relative intensity of such higher orders can be estimated by a Fourier analysis of the dielectric tensor modulation, as discussed by Blinov et al. for electro-optic effects on cholesterics where the first helix harmonic was considered.[77] Since the distortion of highly tilted domains can be more pronounced, we generalized such expansion for higher orders (details in Appendix E). The derived intensity of the various orders is represented in Fig. 11. Remarkably, the first order C 1 increases considerably above 0.5, indicating that the sample necessarily reflects a substantial amount of RCP light.
Figure 11.
Intensity factors Cl of the different orders l of the reflected light, as given by Eq. (E7), in the case of incident and outgoing light propagation parallel to , implying θ o = –θ i. The reported intensity is not corrected by the Fresnel transmission factors or the solid angle transformations.
C. Mapping the angular optical response
The scattering response of the films is now modeled by considering in this simulation λ̃ and θ o from the generalized Fergason’s law (i.e., accounting for domains of any azimuthal angle) and by calculating the angular distribution of light intensity based on the distribution provided by the previously mentioned ODFs. The wavelength of the reflected light was computed by taking as input the incident and the outgoing angle, and deducing the corresponding tilt angle of the domains satisfying Bragg condition (i.e., equal local incident and outgoing angles θ loc) as well as their pitch. Finally, the light intensity was weighted by the ODF fd(βʹ,φ′) of the contributing domains in the final film, corrected by the solid angle transformation from the one defined for the ODF to the one of the viewing direction, and Fresnel transmission coefficients for unpolarized light were added to account for the decrease of light transmission at larger tilts. The light intensity is multiplied by a factor 1/cosθ o to scale the radiance, defined so as to compensate the reduced intensity at smaller viewing solid angle.[78] This calculation can be done on an ordinary laptop with a reasonable computation time (≈ 20 min each), and gives a semi-quantitative overview of the diffused iridescence of the film. It is less accurate than applying the Berreman 4 × 4 method,[74] as employed elsewhere for CNC monodomain films with vertical ,[22] but is computationally much more applicable for such angular mapping. The details of the procedure is reported in Appendix F.
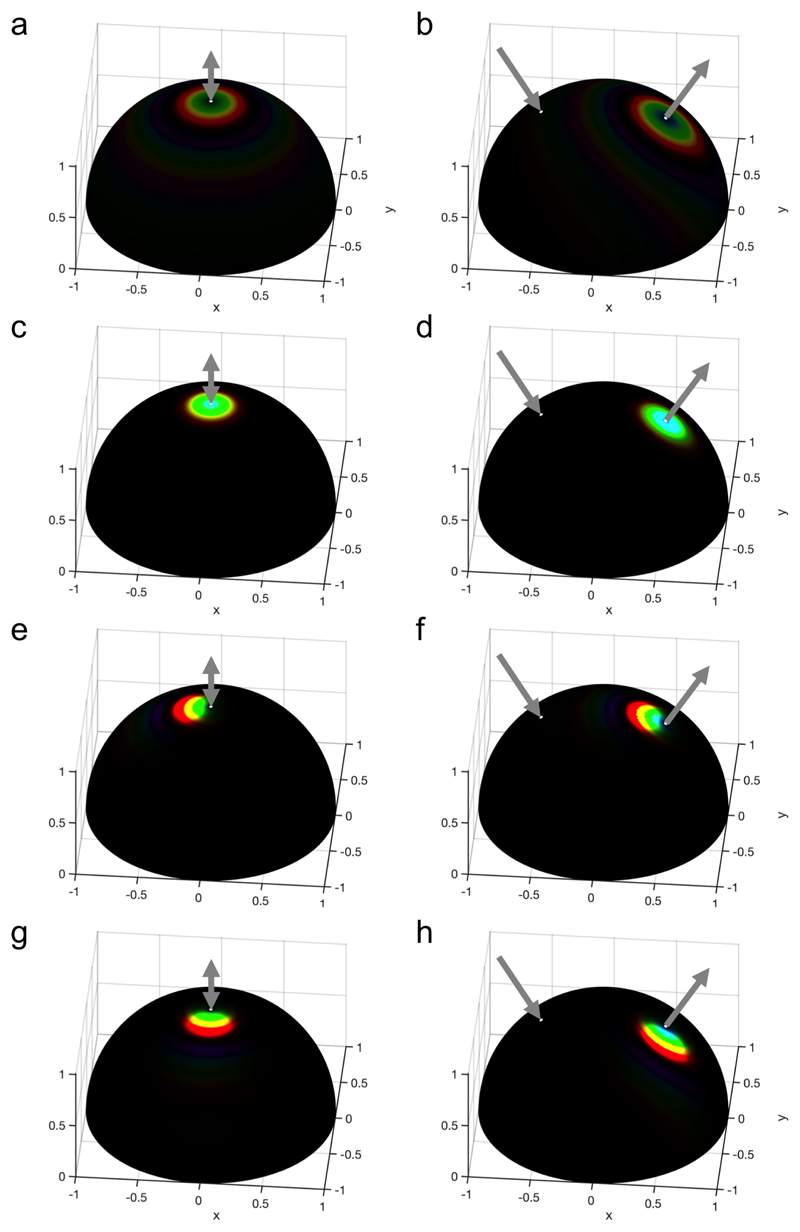
Different examples of angular optical responses of CNC films were simulated and reported in Fig. 13, assuming = 0.1. All films show a clear red-shift of their off-specular response with respect to specular conditions, regardless of the application of a magnetic field during the self-assembly. The application of a magnetic field increases the intensity of the observed light in specific directions, which remains centered around the specular direction when the magnetic field is vertical (Fig. 13c-d). When a tilted field is employed, the angular response is deviated away from the specular direction and towards specific directions, but is also more polychromatic (Fig. 13e-h).
Figure 13.
Simulation of the angular optical response of the films obtained assuming = 0.1 and no anchoring at the interfaces with an incident light at (a,c,e,g) θ i = 0 and (b,d,f,h) θ i = 30°, and a magnetic alignment obtained for (a,b) γ = 0 (no H field), (c,d) γ = 10,βH = 0°,ψH = 0°, (e,f) γ = 10,βH = –30°, ψH = 0° and g-h) γ = 10,βH = –30°, ψH = –90°. The colored regions of the halfpheres visible at specific solid angles indicate the color observed in the direction pointing away from the half-sphere center. The incident and specularly reflected beam directions are represented with gray arrows.
IV. Experimental Section
In order to validate the proposed model, we investigated the structure and the optical properties of CNC films in several conditions. First, we used two different salt concentration regimes, which allows us to shift the reflected wavelengths across the visible spectra.[5] Several reasons motivated this choice: On one hand, the high salt concentration regime produced films with the main features in the visible range, allowing for a discussion of their defects as appearing, e.g., by naked eye or using optical microscopy. On the other hand, low salt concentration regime yields reflection mainly in the near infra-red, allowing for the observation of higher order reflections in the visible range, i.e., both visible by naked eye and within the spectra range of our spectrometer. Additionally, magnetic field alignment was used to prepare samples in both salt regimes as they proved useful to discuss the nature of the stripy pattern observed in optical microscopy (high salt regime), as well as to increase the reflected intensity of the higher orders (low salt regime). The details of the experimental methods are reported in Appendix A.
A. Macroscopic optical properties of CNC films
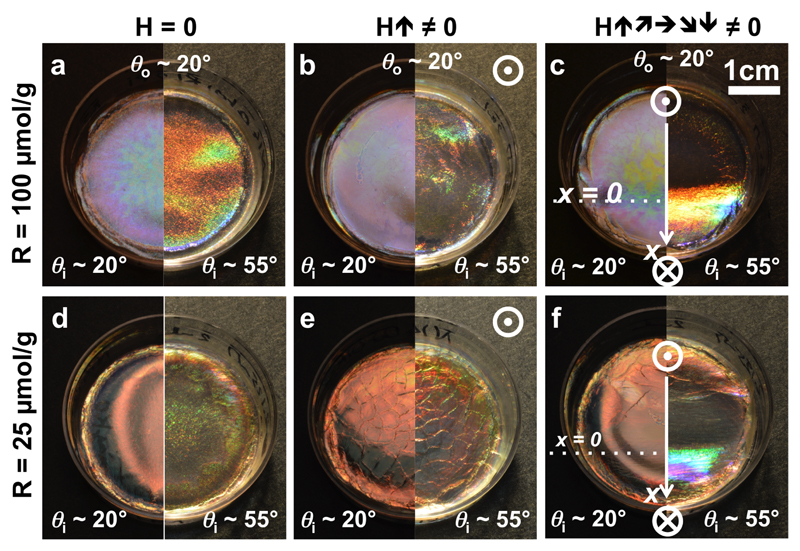
As the illuminating and the viewing angle affects the apparent colour of the films, we showed in Fig. 14 the different produced films, observed in both specular and off-specular conditions.
Figure 14.
Macroscopic photographs of CNC films prepared from a suspension of (a-c) higher salt concentration or (d-f) lower salt concentration, and in absence of magnetic field (a,d), in a vertical field (b,e) and in a field locally exploring different tilts (c,f). Each film was observed in specular (left half) and off-specular (right half) conditions. Pictures (a-e) are adapted with authorization under the terms of the CC-BY 4.0 license.[23].
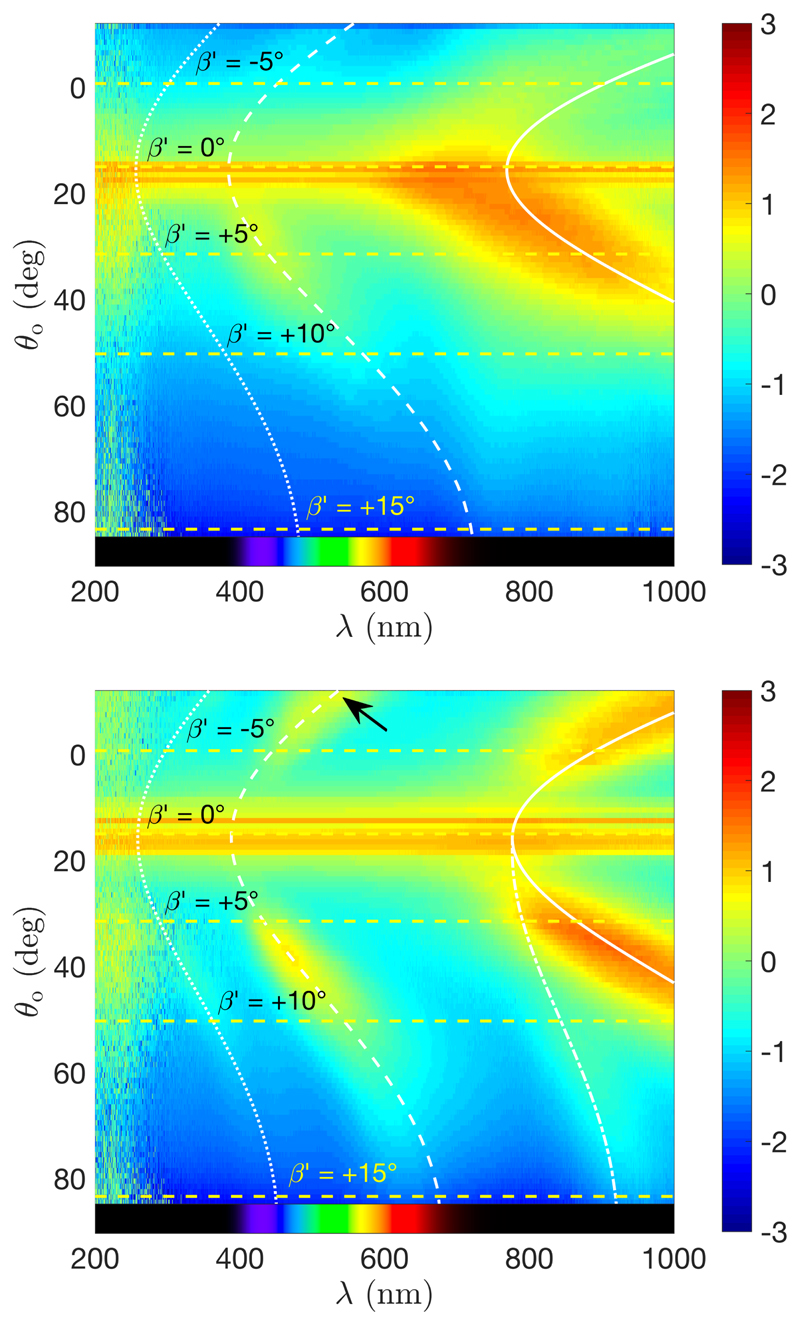
We can see that the reflected color of the films is blue-shifted with addition of salt, as usually observed, but the color in off-specular conditions is red-shifted compared to the specularly reflected light. This observation is inconsistent with a uniform pitch across the film, as we would otherwise expect a blue-shift from the application of Bragg’s law, even after being corrected by Snell’s law (i.e., Fergason’s law). Note that for the sample shown in Fig. 14(d,f), the film appears red in specular conditions, while we observe some green reflection in off-specular conditions: such apparent blue-shift is actually explained by the existence of higher order reflection orders, as we will discuss in section IV C.
Finally, one can notice dessication cracks on the sample in Fig. 14(e) when a vertical magnetic field is applied. Our model does not account for this additional mechanism, and indicates that a small stretch of the surface (i.e., in the (, ) plane) also occurs upon drying. This stretch is however much smaller than the compression along the ẑ axis.
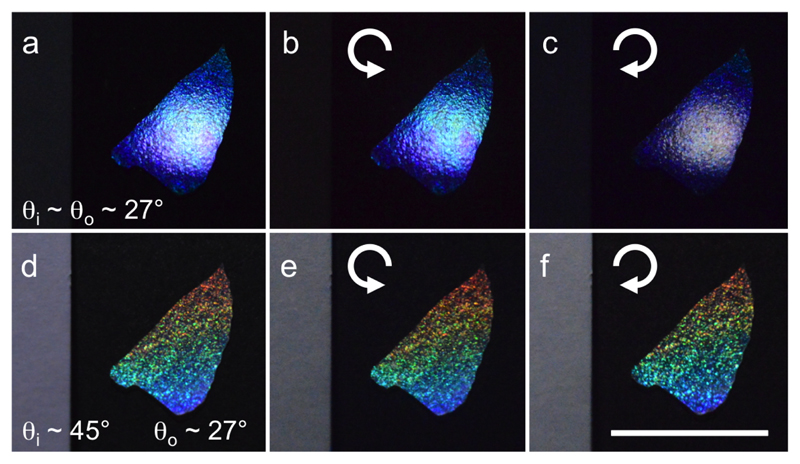
The polarization state of the light reflected by the films can be crudely estimated by observing the samples through LCP and RCP selective filters. In Fig. 15, a single flake taken from the film shown in Fig. 14(a) was imaged in specular and off-specular conditions. A white piece of paper was placed on the left of the flake to confirm that the white balance was correctly taken. In specular conditions, the achromatic contribution of the film-air interface required lower exposure time to avoid saturation, so the white paper appears dark grey. The reflected spot appeared blueish in absence of filter and through a LCP filter while no color was observed through a RCP, as shown in Fig. 15(a-c). This selectivity for LCP is well-known and is a simple test to discriminate the optical response of left-handed cholesteric nanostructures. However, the same flake is observed in off-specular conditions in Fig. 15(d-f) and appears colored through both polarization filters. So far, the presence of defects and grains boundaries in CNC films are the main mechanism reported that could explain this polarization change. These can locally act as a retardation plate and cause incident RCP light to get partially converted into transmitted LCP light, which can then be reflected as LCP by a cholesteric domain and, when passing through the same retardation plate again, get finally reconverted partially into an outgoing RCP light. The efficiency of this mechanism is maximal when the local retardation equals λ/2.[79] In addition to this, we prove here that the distortion of the cholesteric domains also leads to substantial reflection of RCP light, based on our Fourier analysis of the term C 1 in the section III B. Our previous observations of magnetically aligned films observed in LCP and RCP also showed an increase of the RCP component for larger tilts of applied magnetic fields, in agreement with this statement.[23]
Figure 15.
Macroscopic photographs of a single flake of a polydomain CNC film [R = 100 μmol/g, H = 0, cf. Fig. 14(a)]. Reflection in (a-c) specular and (d-f) off-specular conditions using either (a,d) no polarizing filter, (b,e) a Left-Circularly Polarization (LCP) filter and (c,f) a Right-Circularly Polarization (RCP) filter (scale bar 1 cm). The polarization of the reflected light by the cholesteric structure is LCP in specular conditions, whereas in off-specular both polarization states are present.
B. Polarized optical microscopy of CNC films
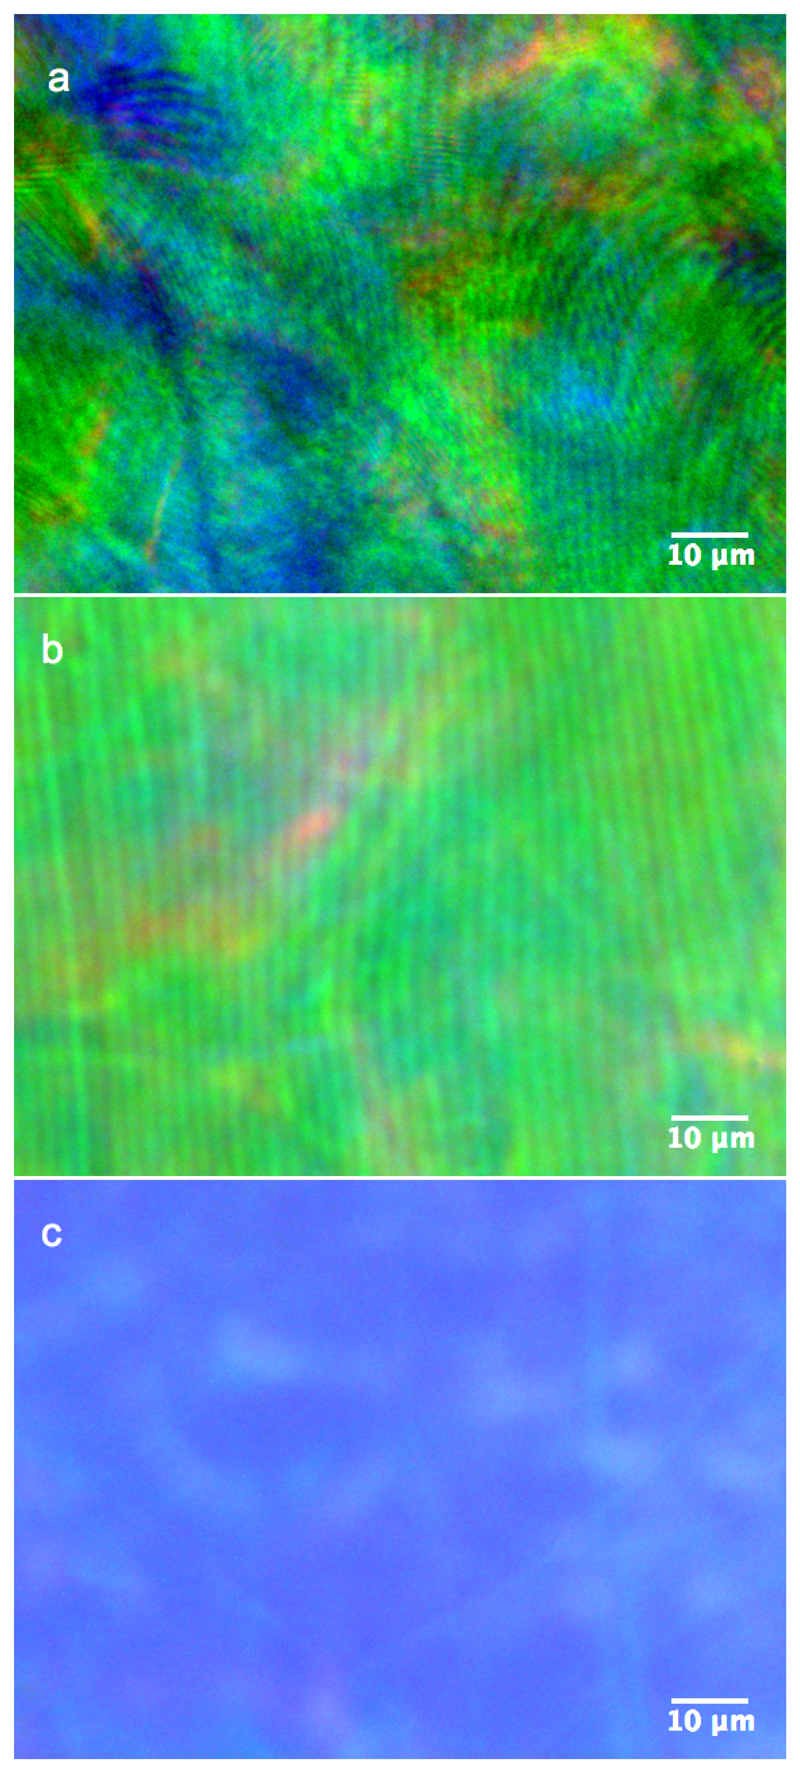
The observations of the CNC films in reflection using optical microscopy allows distinguishing the cholesteric domain orientation via a recognizable stripy pattern very similar to the fingerprint pattern observed in the liquid crystalline suspension before drying. However, these patterns have a periodicity Δ much larger that the pitch pʹ of the final structure, since the reflection of visible light indicates pʹ is much in the submicron domain. This observations support the attribution of such stripes to the distance Δ defined in section II F. This interpretation is also supported by the variability of such pattern, both in their orientation and periodicity, which reflects their initial random tilt β and azimuthal angle ϕ before compression (Fig. 16(a) in H = 0). The observation of superpositions of stripes of different azimuthal orientations and periodicities can be explained by a vertical overlap of domains of different azimuthal orientations, which indicates that these periodic defects are not necessary located at the film interfaces but also inside the film.
Figure 16.
Optical microscopy images of CNC films observed in reflection through a filter selecting left-circularly polarized light (the brightness was enhanced for gray scale printing purposes). a) polydomain film displaying disordered stripy patterns with various periodicities Δ ranging from 0.85 – 2 μm [H = 0, cf. Fig. 14(a)]. b) monodomain film made under a tilted magnetic field, displaying uniform stripy patterns with regular periodicities Δ ≈ 2 μm, (μ 0 H ≈ 0.5 T, βH ≈ 50°, cf. Fig. 14c). c) monodomain film made under vertical field, displaying uniform color with a diverging Δ [μ 0 H ≈ 0.5 T, βH ≈ 0°, cf. Fig. 14(b)].
The films aligned in the presence of a tilted magnetic field also display such stripy pattern, yet in a much ordered fashion. Here the magnetic field was tilted by βH ~ 50° ± 10° and its azimuthal component was perpendicular to the stripes, as can be seen in Fig. 16(b). Finally, a film cast in a vertical field βH ~ 0, shown in Fig. 16(c), displays no such stripes. Instead, it has rather few discontinuities, which is expected in our model with a diverging Δ for . Note that the color of the film is more uniform and also blue-shifted when prepared in a vertical field. This observation is in agreement with a smaller pitch pʹ for smaller domain tilts βʹ (cf. Eq. 14b and 39).
We find it essential to emphasize this interpretation of the stripes, as they are often ascribed in the literature of CNC films to the common fingerprint pattern of cholesterics. Their periodicity is then wrongly expected to correspond to half of the pitch, pʹ/2, that intervenes in Bragg’s law, leading to inconsistent conclusions.
C. Angular optical response of CNC films
While the visual inspection of the films indicates qualitatively that tilted domains have effectively a larger associated pitch than the untilted ones, we investigated quantitatively such effect using angular-resolved optical spectroscopy.
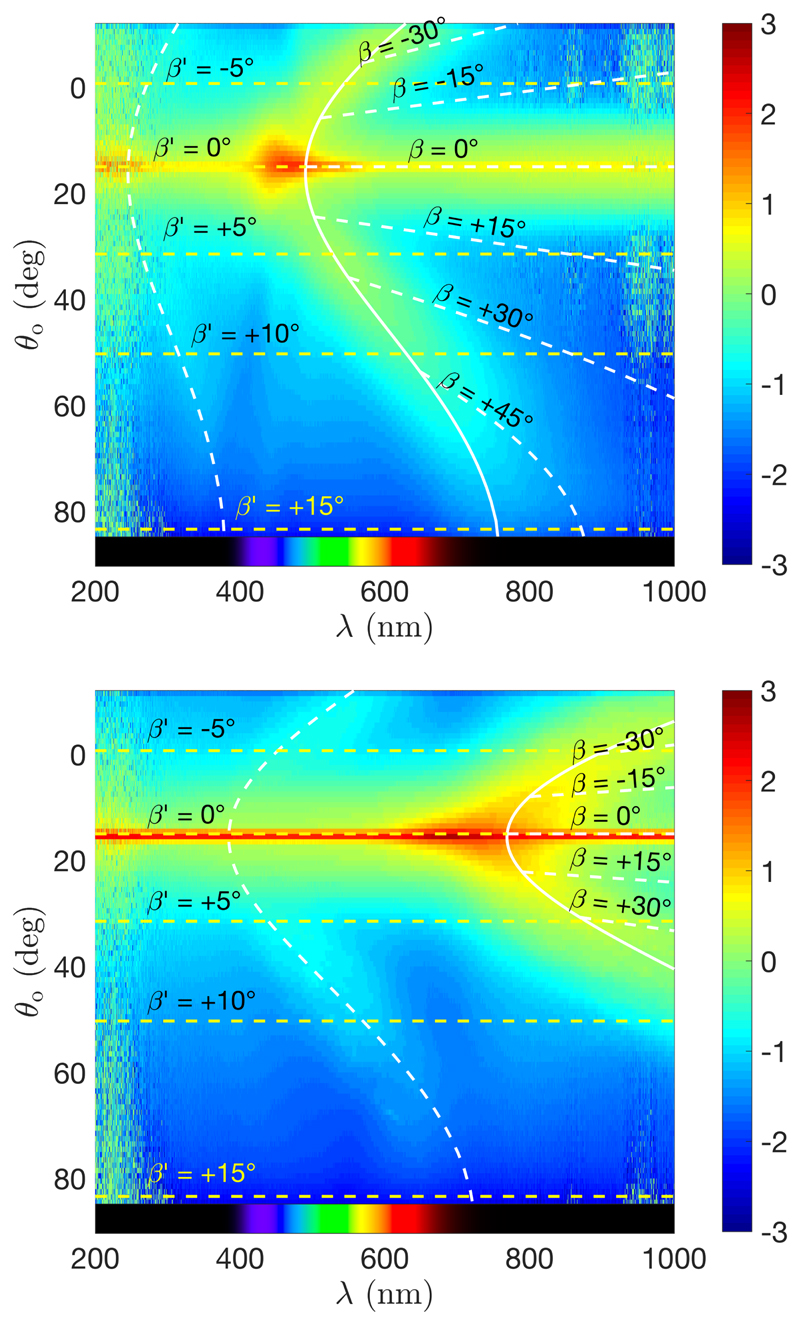
We report in Fig. 17 the analysis of the film produced, resp., from a high and low salt ratio suspension (R = 100 μmol g−1 and R = 25 μmol g−1, resp.) in absence of a magnetic field. First, the incident angle θ i = 15° leads to a specular reflection from the interface, visible as a reflection band at any wavelength at θ o = θ i. The optical response of the cholesteric structure is visible as an arc with a clear red-shift of the outgoing light in off-specular conditions (θ o ≠ θ i). This optical response is in excellent agreement with our model (represented in the graphs by the continuous white line), where we used (39) to fit the higher intensity profile. However, the higher orders (cf. sections E and F) are not much visible, even with the intensity being reported with a heat map in log10 scale. To illustrate the reorientation process happening during the unidirectinal compression stage, we reported only in Fig. 17(a) the trajectory of the domains of initial angles β as well as the final βʹ they adopt in the film (cf. white and yellow dashed lines, respectively).
Figure 17.
Angular-resolved optical spectroscopy performed on samples made in absence of magnetic field (top: sample made with R = 100 μmol g−1, bottom: R = 25 μmol g−1), illuminating at an angle θ i = 15° (intensity reported using a red-yellow-blue heat map in log10 scale). The fits for the first order (plain curve) and the much weaker second order (dashed) correspond to the model from (39). The specular reflection is observed at θ o = θ i = 15° for all wavelengths. The horizontal dashed lines represent the angles βʹ of the probed domains, while their initial angle β are indicated by the curved dashed lines on the right.
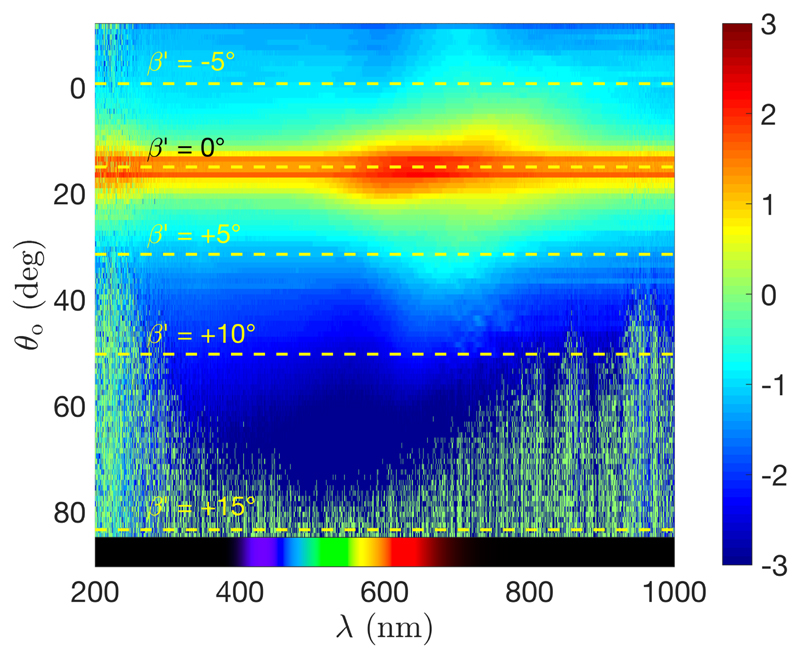
The samples prepared under a vertical magnetic field show no arc in their photonic response, but rather a localized spot in specular reflection. This is examplified in Fig. 18 with the sample made from a suspension at R = 25 μmol g−1 and reported in Fig. 14(e). This is in agreement with what we expect from a successfully aligned cholesteric domain along the ẑ direction.
Figure 18.
Angular-resolved optical spectroscopy performed on samples prepared under a vertical magnetic field (sample made from R = 25 μmol g−1, intensity reported using a heat map in log10 scale).
Finally, the samples prepared in tilted magnetic fields present almost no signal in specular conditions but reflect specific wavelengths at off-specular angles. This is illustrated in Fig. 19 with a sample made from the same suspension as previously, and analyzed at different positions corresponding to different local magnetic field tilts βH. When the tilt of the magnetic field was intermediate between 0° and 90°, the resulting photonic response appears clearly asymmetric. This means that the magnetic field can be used not only to control the homogeneity of the structure, but also the directionality of the photonic response, for specific wavelengths. Moreover, the directionality of the signal increased its intensity with respect to the H = 0 conditions, which allows for the observation of a stronger second order and even third order (cf. Fig. 19). As expected from our model, these higher orders arise from the distortion of the tilted cholesteric domains, and are therefore not observed in presence of only vertically aligned domains.
Figure 19.
Angular-resolved optical spectroscopy performed on samples prepared under a tilted magnetic field (top: position x = 10 mm, 〈βH〉 = 33°; bottom: x = 0 mm, 〈βH〉 = 0°). The fits of the first, second and third orders are represented with full, dashed and dotted lines, respectively. The dash-dot line corresponds to Eq. (D1). Sample made from R = 25 μmol g−1, intensity reported using a heat map in log10 scale. The arrow indicates a second order reflection observed for an angle θ loc ≈ 0°, i.e., parallel to .
The region of the film exposed to a horizontal field (βH ≈ 90°) is illustrated in Fig. 19(b), where the off-specular response is composed of two symmetric parts on each side of the specular band (with distortions arising from different Snell’s law corrections). However, the cross-section of the incident light beam we used (Ø ≈ 6 mm) was much larger than the actual region. Thus, the recorded spectra are more likely due to the superpositions of the nearby strongly tilted domains. Noteworthy, the reflection of the higher orders towards the light source (θ o = -θ i, highlighted with an arrow in Fig. 19) represents an evidence that the second order generation is maintained in the case of light propagation along the helical axis and is truly due to the distortion of the helicoidal order.
D. Observation of film cross-sections
The observation of cross-section of solid cholesteric structures on plant tissues has been initiated with the seminal work of Y. Bouligand, as he recognized the strong analogies they shared with cholesteric liquid crystals.[52] When a CNC film is broken in flakes, the crack propagation through the film thickness produces a 3D texture reproducing the periodic features of the local cholesteric domains. The observation of these cross-sections can be easily imaged using scanning electron microscopy (SEM), a well-established technique introduced by Majoinen et al. to observe the cholesteric order of CNC films and directly measure the cholesteric pitch pʹ.[80]
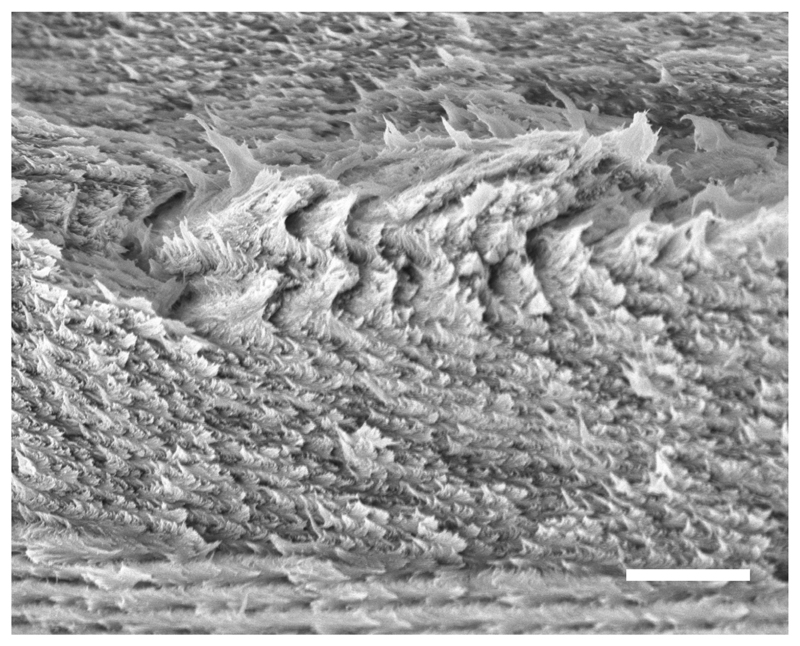
We report in Fig. 20 an observation of the film cross-section examplifying the strong variation of the pitch with the final tilt of the cholesteric domains (for systematic SEM cross-section of the different films, see [23]). In the center of this image we can easily recognize a small cholesteric domain with a horizontal axis. At that orientation, the domain is not expected to change its pitch upon vertical compression (i.e., p(β = 90°) ≈ pʹ(β′ = 90°), and the periodicity of the stripes indicates an apparent pitch . This is in excellent agreement with the pitch p = 1.69 ± 0.15 μm obtained from analyzing the optical angular response of the film, as reported in Table I.
Figure 20.
SEM image of a cross-section of the sample from Fig. 14(a). It can be seen that the pitch varies significantly depending on the tilt of the helical axis (scale bar 2 μm).
Table 1.
Compression ratios β and original pitch at the kinetic arrest p as fitting parameters determined from the analysis of the angular-resolved optical spectroscopy of the samples in Fig. 14 and using Fergason’s law adapted to our anisotropic compression model from Eq. (39)
| R μmol g−1 | 〈x〉a (mm) | 〈βH〉b (deg) | p (μm) | pʹ(0) = p (mm) | |
|---|---|---|---|---|---|
| 100 | – | H = 0 | 0.190 ± 0.015 | 1.67 ± 0.15 | 317 ± 10 |
| 10 | 33 | 0.180 ± 0.015 | 1.69 ± 0.15 | 304 ± 10 | |
| 5 | 52 | 0.180 ± 0.015 | 1.69 ± 0.15 | 304 ± 10 | |
| 0 | 90 | 0.180 ± | 0.015 1.69 ± 0.15 | 304 ± 10 | |
| 25 | – | H = 0 | 0.145 ± 0.015 | 3.45 ± 0.25 | 500 ± 15 |
| 10 | 33 | 0.145 ± 0.020 | 3.45 ± 0.30 | 500 ± 20 | |
| 5 | 52 | 0.145 ± 0.020 | 3.45 ± 0.25 | 500 ± 15 | |
| 0 | 90 | 0.160 ± 0.020 | 3.15 ± 0.20 | 505 ± 15 |
average x position probed in the film
average magnetic tilt of the field H in the probed position x
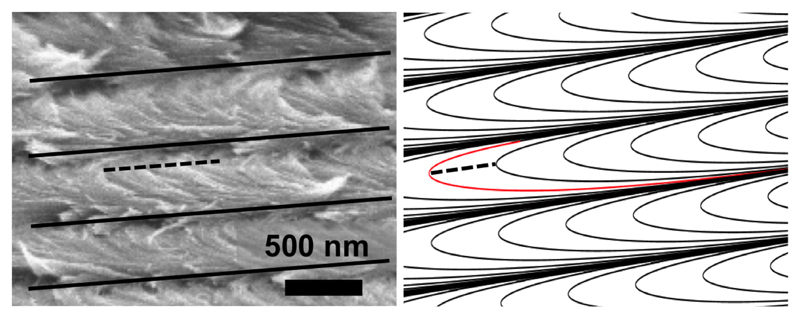
The distortion of the cholesteric order also leads to the observation of asymmetric Bouligand arches, as illustrated in Fig. 21, in agreement with our modeling (cf. details in Appendix B). To the best of our knowledge, such anisotropy represents the first direct observation of the distortion of the helicoidal order in CNC films.
Figure 21.
Asymmetric Bouligand arches resulting from the distortion of the cholesteric order. Left: SEM observation in cross-section of the sample from Fig. 14(a). Right: asymmetric Bouligand arches reproducing similar asymmetric arches (the asymmetry is illustrated by the position of the dashed line, drawn at the apex of the arch highlighted in red; see details in Appendix B).
Finally, the orientation β = 90° is an unstable point in the transformation upon vertical compression, and this led to the apparent buckling of the domain into a wavy pattern. Such buckling phenomena is however not accounted for in our geometrical treatment of the distortion and a more mechanistic treatment of the anisotropic compression of the structure might be required, involving non-diagonal terms of the distortion tensor .[81, 82]
V. Discussion
The unidirectional compression model we propose allows us to explain most of the structural and optical features of the CNC films. The model succesfully predicts the variation of the pitch with the domain tilt, leading to the red-shift of the off-specular response. It also predicts the distortion of the helicoidal order in CNC films that can be experimentally observed in SEM imaging in cross section and leading to higher orders reflections. The stripy pattern of poly-domain films observed in polarized optical microscopy are interpreted as periodic defects at the grain boundaries between domains or at the film interfaces, clarifying the confusion between their periodicity and the cholesteric pitch.
This compression scenario of the CNC film formation also explains why the addition of non-volatile co-solvent or co-species usually leads to dramatic pitch increase in the final structure. In our model, the initial pitch p and the dimensionless compression parameter represent, respectively, the pitch p k.a. and the volume fraction Φk.a. of the suspension at the kinetic arrest transition, assuming the final volume fraction of CNCs in the films can be approximated to Φfilm ~ 1. The effective compression ratio then writes as = Φk.a. + Φco, where Φco stands for the co-solvent volume fraction, and therefore leads to a larger pitch pʹ and a red-shift of the optical response. The same general effect was systematically observed with the addition of glycerol,[4] glucose,[47] sol-gel precursors,[9] non-adsorbing polymers (e.g., polyethylene glycol),[83] surfactants,[84] etc., and generally dominates any additional twisting effect that the cosolvent might induce between individual CNCs (e.g., a reported pitch decrease in the CNC suspension for the case of d-glucose.[47]).
The analysis of the Table I indicates that the kinetic arrest occurs at a higher volume fraction when more salt is added in the initial suspension, when comparing 25 and 100 mmol/g. This indicates that in the low salt regime explored here (25 mmol/g), the kinetic arrest is caused by the formation of a colloidal glass of repulsive particles rather than a gel of attractive particles: the addition of salt decreases the Debye length and thus the effective volume fraction of the rods, which decreases the percolation threshold, in agreement with a kinetic arrest shifted to higher concentrations. An opposite trend would have been observed if aggregation was the driving mechanism, where an excess of ionic strength would destabilize the colloidal suspension and favor an early kinetic arrest at lower concentrations.[40–42]
It is interesting to review the possible limitations of this model, first at the individual cholesteric level, then at the level of the multidomain description.
On the monodomain length scale, the variation of the optical indices in the different directions were not accounted for. The local optical indices ne and no defined according to the director orientation should lead, for s- and p-polarized waves, to slightly different maximal optical indices , as well as average optical indices (ñp ≠ ñs, cf. Appendix G for details). This could contribute to some dispersion of the reflected signal. Note the range of tilts βʹ (usually less than 15°) of the domains involved in the optical response should contain the impact of this discrepancy. A polarization-resolved analysis could be conducted to investigate this specific effect.
The affine geometric compression along ẑ can also be problematic as a cholesteric monodomain may respond anisotropically to a local mechanical stress. Moreover, the CNC themselves are incompressible and cannot easily pack when compressed along the director . The description of the buckling of the cholesteric structure, observed when the compression arises perpendicular to , is not covered by this model. A possible refinement for these two phenomena could be a description of the finite deformation of the drying suspension, through the free energy minimization of a compressible non-linear anisotropic medium.[81, 82, 85–90] Indeed, a tilted cholesteric domain in the plane (, ) and compressed along the axis might display an additional distortion in the (, ) plane (e.g., a compression along compensated by a stretch along ). Such description would account for a compression-dependent anisotropic compliance tensor and could lead to different compression behaviors of a drying suspension as a function of the local tilt in magnetically tilted structures when the symmetry argument does not hold.
Lateral strain of the drying suspension were not considered either, as they are usually several orders of magnitude smaller in comparison to the vertical deformations. When the suspension is left to dry in a dish with wetting walls, the contact line gets usually pinned. Upon solvent evaporation, the total liquid-air interface increases and becomes concave, while the substrate-liquid interface remains constant. This leads to a stretching of the liquid-air interface and even to the appearance of dessicating cracks (observed in one of the reported samples), and to a significant shear near the meniscus, in any vertical plane. The presence of such shear is cancelled by symmetry in the central area of the films, whereas it can become significant where the films are affected by the meniscus shape, explaining the usual shift of the optical response at the edge of a dish-cast film.[6, 65]
On the macroscopic level, the examples of initial ODF illustrated here were either purely isotropic or only biaised by an external field, without the effects of anchoring at the top and bottom interfaces. To complement this, we also proposed an empirical description of the anchoring effect and introduced a crude modeling of the magnitude of its alignment via an adjustable term γa, introduced as an energy balance between anchoring and thermal energy. However, the main criteria between strong and weak anchoring alignment might be kinetic rather than energetic, and controlled by the competition between the anchorng alignment propagation front and the onset of the kinetic arrest. Furthermore, the dynamics of the coalescence of cholesteric tactoids and of their reorientation, leading to trapped defects, is also not considered.[34, 35] This means that in presence of strong alignment conditions, a transition from a polydomain to a monodomain cholesteric should be expected, potentially narrowing the ODF of the helices throughout the sample. For a similar reason, the average pitch computed in Fig. 8 represents an upper limit.
A closer look at the Table I reveals that the volume fraction at the kinetic arrest may depend on the local orientation of the cholesteric domain, especially for the low salt/CNC ratio samples, which is probably the result of these effects. Moreover, the polydispersity of the CNC suspension is not taken into account: the phase transition from isotropic to cholesteric in the suspension can lead, in this case, to the size fractionation of the CNCs, with longer rods transiting into the cholesteric phase before the shorter ones, affecting the pitch evolution.[31, 44] The sedimentation and fractionation can become important when films are cast very slowly (e.g., over 6 weeks as in [91]), leading to the existence of an effective planar anchoring but also to a bimodal pitch distribution throughout the film thickness.
Finally, no kinetic criteria is clearly provided to define the threshold of the kinetic arrest. Prior to the arrest, the relaxation time of cholesteric domains should be short enough to allow for the pitch to adjust upon concentration increase. Since this requires a collective rearrangement of the CNC nanorods, its time scale should depends on the domain size. This size dependence could possibly explain the higher parameters obtained for both H = 0 and H ≠ 0, βH = 90° cases favoring small domains with respect to the two other cases shown in Table I. Note that it could also require insights of the non-newtonian rheological behavior of such anisotropic glasses.[40]
VI. Conclusions
In this work combining theory and experiments, we successfully formulate a simple geometric-based model for the formation of CNC-based photonic films, based on the unidirectional compression upon drying of the suspension after it has undergone a kinetic arrest transition, and evolved into a solid-state nanostructured film. The important findings are summarized below:
A film is usually made of domains of different final tilts βʹ, corresponding to different pitches pʹ (βʹ). The pitch increases drastically with βʹ. This explains the observed red-shift of the reflected color in off-specular conditions, as well as the large “error bars” usually reported when measuring the pitch in poly-domain film cross-sections.
The vertical compression causes an important reorientation of the cholesteric helical axes, inducing alignment in the vertical direction, and the orientation distribution function (ODF) fd(βʹ) of the domains in the films can be calculated from the ODF f 0(β) when the kinetic arrest occured. This was illustrated in this manuscript with initially isotropic or magnetic aligned ODFs where anchoring effects were neglected (more relevant to thick films and fast drying). An empirical method to model anchoring is also proposed and treated as equivalent to a vertical magnetic alignment.
The helical order of tilted domains is distorted, leading to the distortion of the Bouligand arches (observed in cross-section) and to the generation of higher order reflection bands, which can be enhanced using tilted magnetic alignment. The final structure is, as such, not purely cholesteric anymore. As a result, the reflected light is no longer purely LCP and a substantial mixture of LCP and RCP components is instead reflected, as also supported by a Fourier analysis.
The different tilts of the domains explain the presence of the “stripy” pattern observed in polarized optical microscopy when imaging CNC films, whose periodicity Δ must not be confused with the cholesteric half-pitch pʹ/2 of the domains.
The proposed model for the compression is quantitative and provides an estimation of the CNC concentration and the cholesteric pitch at the onset of the kinetic arrest. The analysis of the angular response offers a simple and elegant way to study the onset of the kinetic arrest in CNC suspensions, avoiding the usual complications from common rheological approaches such as in [39].
Reciprocally, modifying the kinetic arrest concentration directly affects the angular properties of the films, which justifies dedicating a future study of its control using various additives.
The angular optical response of the films can be qualitatively computed, for a given incident light and a given initial cholesteric alignment (achieved, e.g., using magnetic fields).
CNC films illustrate a fascinating example of functional colloidal self-assembly where the complex interplay between colloidal particles at different length scales leads to specific alteration of the optical response. While the self-assembly of CNCs into photonic films has been studied for more than two decades, the key role of the anisotropic compression upon solvent evaporation, once it has undergone a kinetic arrest, has not so far been well investigated. This work constitutes a comprehensive attempt in this direction and brings a new understanding on the mechanisms involved in producing the final solid-state structure. A similar approach can be developed to account for additional shear experienced near the edge of the drying suspension.[18, 65, 92] Besides CNC self-assembly, it will be relevant to other liquid crystalline suspensions that recently triggered interest for their ability to form complex structures upon drying,[17] and can be easily adapted to incompressible liquid crystalline systems subject to a unidirectional mechanical strain.[93] The application of these general ideas can also be relevant to understand alternative self-assembly mechanisms involving unidirectional removal of the solvent such as in vacuum filtration or open ended capillaries.[94, 95]
Supplementary Material
Figure 12.
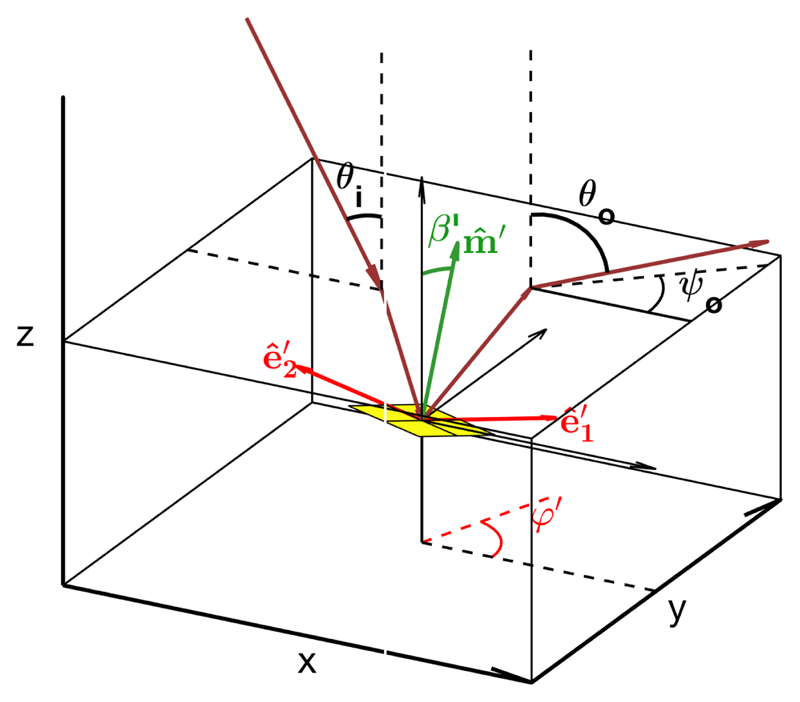
Schematic of the optical path inside the film, linking the local cholesteric orientation of a given domain after deformation (βʹ, ϕʹ) and the external angles of incident and outgoing beams (θ i,θ o,ψ o).
Acknowledgments
This work was supported by a BBSRC David Phillips fellowship [BB/K014617/1], the EPSRC grants [1525292], [EP/R511675/1], [EP/N016920/1] and [EP/K503757/1], The Isaac Newton Trust Cambridge 76933 and the European Research Council [ERC-2014-STG H2020 639088]. B. F.-P. thanks Dr. Villads Egede Johansen for helpful discussion regarding radiance computation, as well as Dr. Richard M. Parker and Thomas Parton for critical reading of the manuscript. The authors declare no competing interests. Additional data related to this publication is available free of charge at the University of Cambridge data repository (https://dx.doi.org/10.17863/CAM.37436).
References
- [1].Neville A, Caveney S. Biological Reviews. 1969;44:531. doi: 10.1111/j.1469-185x.1969.tb00611.x. [DOI] [PubMed] [Google Scholar]
- [2].Vignolini S, Rudall PJ, Rowland AV, Reed A, Moyroud E, Faden RB, Baumberg JJ, Glover BJ, Steiner U. Proceedings of the National Academy of Sciences. 2012;109:15712. doi: 10.1073/pnas.1210105109. [DOI] [PMC free article] [PubMed] [Google Scholar]
- [3].Mitov M. Soft Matter. 2017;13:4176. doi: 10.1039/c7sm00384f. [DOI] [PubMed] [Google Scholar]
- [4].Revol J-F, Godbout DL, Gray DG. Solidified liquid crystals of cellulose with optically variable properties. u.S. Patent 5,629,055. 1997
- [5].Revol J-F, Godbout L, Gray D. Journal of pulp and paper science. 1998;24:146. [Google Scholar]
- [6].Dumanli AG, Kamita G, Landman J, van der Kooij H, Glover BJ, Baumberg JJ, Steiner U, Vignolini S. Advanced optical materials. 2014;2:646. doi: 10.1002/adom.201400112. [DOI] [PMC free article] [PubMed] [Google Scholar]
- [7].Lagerwall JPF, Schütz C, Salajkova M, Noh J, Hyun Park J, Scalia G, Bergström L. NPG Asia Materials. 2014;6:e80. [Google Scholar]
- [8].Parker RM, Guidetti G, Williams CA, Zhao T, Narkevicius A, Vignolini S, Frka-Petesic B. Advanced Materials. 2018;30 doi: 10.1002/adma.201704477. 1704477. [DOI] [PubMed] [Google Scholar]
- [9].Shopsowitz KE, Qi H, Hamad WY, MacLachlan MJ. Nature. 2010;468:422. doi: 10.1038/nature09540. [DOI] [PubMed] [Google Scholar]
- [10].Zhang YP, Chodavarapu VP, Kirk AG, Andrews MP. Journal of Nanophotonics. 2012;6 063516. [Google Scholar]
- [11].Kelly JA, Shukaliak AM, Cheung CC, Shopsowitz KE, Hamad WY, MacLachlan MJ. Angewandte Chemie International Edition. 2013;52:8912. doi: 10.1002/anie.201302687. [DOI] [PubMed] [Google Scholar]
- [12].Bardet R, Roussel F, Coindeau S, Belgacem N, Bras J. Carbohydrate polymers. 2015;122:367. doi: 10.1016/j.carbpol.2014.10.020. [DOI] [PubMed] [Google Scholar]
- [13].Kontturi E, Laaksonen P, Linder MB, Nonappa, Gröschel AH, Rojas OJ, Ikkala O. Advanced Materials. 2018 doi: 10.1002/adma.201703779. 1703779. [DOI] [PubMed] [Google Scholar]
- [14].Espinha A, Guidetti G, Serrano MC, Frka-Petesic B, Dumanli AG, Hamad WY, Blanco Á, López C, Vignolini S. ACS Applied Materials & Interfaces. 2016;8:31935. doi: 10.1021/acsami.6b10611. [DOI] [PMC free article] [PubMed] [Google Scholar]
- [15].Grey P, Fernandes SN, Gaspar D, Fortunato E, Martins R, Godinho MH, Pereira L. Advanced Functional Materials. 2018 1805279. [Google Scholar]
- [16].Franks GV, Tallon C, Studart AR, Sesso ML, Leo S. Journal of the American Ceramic Society. 2017;100:458. [Google Scholar]
- [17].Davidson ZS, Huang Y, Gross A, Martinez A, Still T, Zhou C, Collings PJ, Kamien RD, Yodh AG. Nature Communications. 2017;8:15642. doi: 10.1038/ncomms15642. [DOI] [PMC free article] [PubMed] [Google Scholar]
- [18].Mu X, Gray DG. Cellulose. 2015;22:1103. [Google Scholar]
- [19].Gençer A, Schütz C, Thielemans W. Langmuir. 2016;33:228. doi: 10.1021/acs.langmuir.6b03724. [DOI] [PubMed] [Google Scholar]
- [20].Dumanli AG, van der Kooij HM, Kamita G, Reisner E, Baumberg JJ, Steiner U, Vignolini S. ACS applied materials & interfaces. 2014;6:12302. doi: 10.1021/am501995e. [DOI] [PMC free article] [PubMed] [Google Scholar]
- [21].Park JH, Noh J, Schütz C, Salazar-Alvarez G, Scalia G, Bergström L, Lagerwall JP. ChemPhysChem. 2014;15:1477. doi: 10.1002/cphc.201400062. [DOI] [PubMed] [Google Scholar]
- [22].Wilts BD, Dumanli AG, Middleton R, Vukusic P, Vignolini S. APL Photonics. 2017;2 040801. [Google Scholar]
- [23].Frka-Petesic B, Guidetti G, Kamita G, Vignolini S. Advanced Materials. 2017;29 doi: 10.1002/adma.201701469. 1701469. [DOI] [PubMed] [Google Scholar]
- [24].Rånby BG. Acta Chemica Scandinavica. 1949;3:649. [Google Scholar]
- [25].Elazzouzi-Hafraoui S, Nishiyama Y, Putaux J-L, Heux L, Dubreuil F, Rochas C. Biomacromolecules. 2007;9:57. doi: 10.1021/bm700769p. [DOI] [PubMed] [Google Scholar]
- [26].Belyakov VA, Dmitrienko VE, Orlov VP. Sov Phys Uspekhi. 1979;22:64. [Google Scholar]
- [27].Onsager L. Annals of the New York Academy of Sciences. 1949;51:627. [Google Scholar]
- [28].Lee S-D. The Journal of Chemical Physics. 1987;87:4972. [Google Scholar]
- [29].Wensink HH, Vroege GJ. Journal of Chemical Physics. 2003;119:6868. [Google Scholar]
- [30].Xiao X, Sheng P. Physical Review E. 2013;88 doi: 10.1103/PhysRevE.88.062501. 062501. [DOI] [PubMed] [Google Scholar]
- [31].Dong XM, Kimura T, Revol J-F, Gray DG. Langmuir. 1996;12:2076. [Google Scholar]
- [32].Dong XM, Gray DG. Langmuir. 1997;13:2404. [Google Scholar]
- [33].Revol J-F, Bradford H, Giasson J, Marchessault R, Gray D. International Journal of Biological Macromolecules. 1992;14:170. doi: 10.1016/s0141-8130(05)80008-x. [DOI] [PubMed] [Google Scholar]
- [34].Wang P-X, Hamad WY, MacLachlan MJ. Nature Communications. 2016;7:11515. doi: 10.1038/ncomms11515. [DOI] [PMC free article] [PubMed] [Google Scholar]
- [35].Wang P-X, MacLachlan MJ. Phil Trans R Soc A. 2018;376 doi: 10.1098/rsta.2017.0042. 20170042. [DOI] [PMC free article] [PubMed] [Google Scholar]
- [36].Tran A, Hamad WY, MacLachlan MJ. Langmuir. 2017;34:646. doi: 10.1021/acs.langmuir.7b03920. [DOI] [PubMed] [Google Scholar]
- [37].Klockars KW, Tardy BL, Borghei M, Tripathi A, Greca LG, Rojas OJ. Biomacromolecules. 2018;19:2931. doi: 10.1021/acs.biomac.8b00497. [DOI] [PMC free article] [PubMed] [Google Scholar]
- [38].O’Keeffe O, Wang P-X, Hamad WY, MacLachlan MJ. The Journal of Physical Chemistry Letters. 0(0):278. doi: 10.1021/acs.jpclett.8b03733. [DOI] [PubMed] [Google Scholar]
- [39].Honorato-Rios C, Kuhnhold A, Bruckner JR, Dannert R, Schilling T, Lagerwall JPF. Frontiers in Materials. 2016;3:21. [Google Scholar]
- [40].Dhont JKG, Kang K, Kriegs H, Danko O, Marakis J, Vlassopoulos D. Physical Review Fluids. 2017;2 043301. [Google Scholar]
- [41].Kang K, Dhont JKG. Phys Rev Lett. 2013;110 doi: 10.1103/PhysRevLett.110.015901. 015901. [DOI] [PubMed] [Google Scholar]
- [42].Kang K. Soft Matter. 2014;10:3311. doi: 10.1039/c3sm53131g. [DOI] [PubMed] [Google Scholar]
- [43].Zaccarelli E. Journal of Physics: Condensed Matter. 2007;19 323101. [Google Scholar]
- [44].Honorato-Rios C, Lehr C, Schütz C, Sanctuary R, Osipov MA, Baller J, Lagerwall JP. NPG Asia Materials. 2018;10:455. [Google Scholar]
- [45].Araki J, Kuga S. Langmuir. 2001;17:4493. [Google Scholar]
- [46].Nordenström M, Fall A, Nyström G, Wågberg L. Langmuir. 2017;33:9772. doi: 10.1021/acs.langmuir.7b01832. [DOI] [PubMed] [Google Scholar]
- [47].Mu X, Gray DG. Langmuir. 2014;30:9256. doi: 10.1021/la501741r. [DOI] [PubMed] [Google Scholar]
- [48].Parker RM, Frka-Petesic B, Guidetti G, Kamita G, Consani G, Abell C, Vignolini S. ACS Nano. 2016;10:8443. doi: 10.1021/acsnano.6b03355. [DOI] [PMC free article] [PubMed] [Google Scholar]
- [49].Zhao TH, Parker RM, Williams CA, Lim K, Frka-Petesic B, Vignolini S. Advanced Functional Materials. 2018 doi: 10.1002/adfm.201804531. [DOI] [PubMed] [Google Scholar]
- [50].Rofouie P, Alizadehgiashi M, Mundoor H, Smalyukh II, Kumacheva E. Advanced Functional Materials. 2018 1803852. [Google Scholar]
- [51].Mendoza-Galván A, Muñoz-Pineda E, Ribeiro SJL, Santos MV, Järrendahl K, Arwin H. Journal of Optics. 2018;20 024001. [Google Scholar]
- [52].Bouligand Y. Tissue cell. 1972;4:189. doi: 10.1016/s0040-8166(72)80042-9. [DOI] [PubMed] [Google Scholar]
- [53].Frka-Petesic B, Jean B, Heux L. EPL (Europhysics Letters) 2014;107:28006. [Google Scholar]
- [54].Frka-Petesic B, Radavidson H, Jean B, Heux L. Advanced Materials. 2017;29 doi: 10.1002/adma.201606208. 1606208, 1606208. [DOI] [PubMed] [Google Scholar]
- [55].Sugiyama J, Chanzy H, Maret G. Macromolecules. 1992;25:4232. [Google Scholar]
- [56].Frka-Petesic B, Sugiyama J, Kimura S, Chanzy H, Maret G. Macromolecules. 2015;48:8844. [Google Scholar]
- [57].Revol J-F, Godbout L, Dong X-M, Gray DG, Chanzy H, Maret G. Liquid Crystals. 1994;16:127. [Google Scholar]
- [58].Kimura F, Kimura T. Science and technology of advanced materials. 2008;9 doi: 10.1088/1468-6996/9/2/024212. 024212. [DOI] [PMC free article] [PubMed] [Google Scholar]
- [59].Kimura F, Kimura T, Tamura M, Hirai A, Ikuno M, Horii F. Langmuir. 2005;21:2034. doi: 10.1021/la0475728. [DOI] [PubMed] [Google Scholar]
- [60].De France KJ, Yager KG, Hoare T, Cranston ED. Langmuir. 2016;32:7564. doi: 10.1021/acs.langmuir.6b01827. [DOI] [PubMed] [Google Scholar]
- [61].Kimura F, Kimura T. Science and Technology of Advanced Materials. 2008;9 doi: 10.1088/1468-6996/9/2/024212. 024212. [DOI] [PMC free article] [PubMed] [Google Scholar]
- [62].Orts W, Godbout L, Marchessault R, Revol J-F. Macro-molecules. 1998;31:5717. [Google Scholar]
- [63].Ličen M, Majaron B, Noh J, Scütz C, Bergström L, Lager-wall J, Drevenšek-Olenik I. Cellulose. 2016;23:3601. [Google Scholar]
- [64].Alizadehgiashi M, Khabibullin A, Li Y, Prince E, Abolhasani M, Kumacheva E. Langmuir. 2018;34:322. doi: 10.1021/acs.langmuir.7b03648. [DOI] [PubMed] [Google Scholar]
- [65].Pospisil M, Saha P, Abdulquddos S, Noor MM, Davis VA, Green MJ. Langmuir. 2018 doi: 10.1021/acs.langmuir.8b02350. [DOI] [PubMed] [Google Scholar]
- [66].O’Konski CT, Yoshioka K, Orttung WH. The Journal of Physical Chemistry. 1959;63:1558. [Google Scholar]
- [67].Wu Q, Meng Y, Wang S, Li Y, Fu S, Ma L, Harper D. Journal of Applied Polymer Science. 2014;131:40525. [Google Scholar]
- [68].Hubbe M, Tayeb P, Joyce M, Tyagi P, Kehoe M, Dimic-Misic K, Pal L. BioResources. 2017;12:9556. [Google Scholar]
- [69].Fréedericksz V, Zolina V. Transactions of the Faraday Society. 1933;29:919. [Google Scholar]
- [70].Pincus P. Journal of Applied Physics. 1970;41:974. [Google Scholar]
- [71].De Vries H. Acta Crystallographica. 1951;4:219. [Google Scholar]
- [72].Kats EI. Sov Phys JETP. 1971;32:1004. [Google Scholar]
- [73].Nityananda R. Molecular Crystals and Liquid Crystals. 1973;21:315. [Google Scholar]
- [74].Berreman DW. J Opt Soc Am. 1972;62:502. [Google Scholar]
- [75].John WD, Fritz WJ, Lu ZJ, Yang D-K. Phys Rev E. 1995;51:1191. doi: 10.1103/physreve.51.1191. [DOI] [PubMed] [Google Scholar]
- [76].Fergason JL. Molecular Crystals. 1966;1:293. [Google Scholar]
- [77].Blinov LM, Palto SP. Liquid Crystals. 2009;36:1037. [Google Scholar]
- [78].Harvey JE, Krywonos A. The Nature of Light: Light in Nature. Vol. 6285. International Society for Optics and Photonics; 2006. p. 628503. [Google Scholar]
- [79].Wu T, Li J, Li J, Ye S, Wei J, Guo J. Journal of Materials Chemistry C. 2016;4:9687. [Google Scholar]
- [80].Majoinen J, Kontturi E, Ikkala O, Gray DG. Cellulose. 2012;19:1599. [Google Scholar]
- [81].Warner M, Terentjev EM, Meyer RB, Mao Y. Phys Rev Lett. 2000;85:2320. doi: 10.1103/PhysRevLett.85.2320. [DOI] [PubMed] [Google Scholar]
- [82].Mao Y, Terentjev EM, Warner M. Physical Review E. 2001;64 doi: 10.1103/PhysRevE.64.041803. 041803. [DOI] [PubMed] [Google Scholar]
- [83].Yao K, Meng Q, Bulone V, Zhou Q. Advanced Materials. 2017;29 doi: 10.1002/adma.201701323. [DOI] [PubMed] [Google Scholar]
- [84].Guidetti G, Atifi S, Vignolini S, Hamad WY. Advanced Materials. 2016;28:10042. doi: 10.1002/adma.201603386. [DOI] [PMC free article] [PubMed] [Google Scholar]
- [85].Bermel PA, Warner M. Phys Rev E. 2002;65 056614. [Google Scholar]
- [86].Hashin Z. Journal of Applied Mechanics. 1983;50:481. [Google Scholar]
- [87].Triantafyllidis N, Abeyaratne R. Journal of Applied Mechanics. 1983;50:149. [Google Scholar]
- [88].Merodio J, Ogden R. International Journal of Non-Linear Mechanics. Vol. 40. special Issue in Honour of C.O. Horgan; 2005. p. 213. [Google Scholar]
- [89].Byun M, Santangelo CD, Hayward RC. Soft Matter. 2013;9:8264. [Google Scholar]
- [90].Nardinocchi P, Pezzulla M, Teresi L. Soft Matter. 2015;11:1492. doi: 10.1039/c4sm02485k. [DOI] [PubMed] [Google Scholar]
- [91].Fernandes SN, Almeida PL, Monge N, Aguirre LE, Reis D, de Oliveira CL, Neto AM, Pieranski P, Godinho MH. Advanced Materials. 2017;29 doi: 10.1002/adma.201603560. 1603560. [DOI] [PubMed] [Google Scholar]
- [92].Chu G, Vilensky R, Vasilyev G, Martin P, Zhang R, Zussman E. The Journal of Physical Chemistry Letters. 2018;9:1845. doi: 10.1021/acs.jpclett.8b00670. [DOI] [PubMed] [Google Scholar]
- [93].Kamita G, Frka-Petesic B, Allard A, Dargaud M, King K, Dumanli AG, Vignolini S. Advanced Optical Materials. 2016;4:1950. [Google Scholar]
- [94].Chen Q, Liu P, Nan F, Zhou L, Zhang J. Biomacromolecules. 2014;15:4343. doi: 10.1021/bm501355x. [DOI] [PubMed] [Google Scholar]
- [95].Cherpak V, Korolovych VF, Geryak R, Turiv T, Nepal D, Kelly J, Bunning TJ, Lavrentovich OD, Heller WT, Tsukruk VV. Nano Letters. 2018 doi: 10.1021/acs.nanolett.8b02522. [DOI] [PubMed] [Google Scholar]
- [96].Foster EJ, Moon RJ, Agarwal UP, Bortner MJ, Bras J, Camarero-Espinosa S, Chan KJ, Clift MJ, Cranston ED, Eichhorn SJ, et al. Chemical Society Reviews. 2018;47:2609. doi: 10.1039/c6cs00895j. [DOI] [PubMed] [Google Scholar]
Associated Data
This section collects any data citations, data availability statements, or supplementary materials included in this article.


