Abstract
Synucleinopathies are human neurodegenerative diseases that include multiple system atrophy (MSA), Parkinson’s disease, Parkinson’s disease dementia (PDD) and dementia with Lewy bodies (DLB) (1). Existing treatments are at best symptomatic. These diseases are characterised by the presence in brain cells of filamentous inclusions of α-synuclein, the formation of which is believed to cause disease (2,3). However, the structures of α-synuclein filaments from human brain are not known. Here we show, using electron cryo-microscopy, that α-synuclein inclusions from MSA are made of two types of filament, each of which consists of two different protofilaments. Non-proteinaceous molecules are present at the protofilament interfaces. By two-dimensional class averaging, we show that α-synuclein filaments from the brains of patients with MSA and DLB are different, suggesting that distinct conformers (or strains) characterise synucleinopathies. As was the case of tau assemblies (4–9), the structures of α-synuclein filaments extracted from the brains of individuals with MSA differ from those formed in vitro using recombinant proteins, with implications for understanding the mechanisms of aggregate propagation and neurodegeneration in human brain. These findings have diagnostic and potential therapeutic relevance, especially in view of the unmet clinical need to be able to image filamentous α-synuclein inclusions in human brain.
A causal link between α-synuclein assembly and disease was established by the findings that missense mutations in SNCA, the α-synuclein gene, and multiplications thereof, give rise to rare inherited forms of Parkinson’s disease and PDD (3,10). Some mutations also cause DLB. Missense mutations G51D (11,12) and A53E (13) in SNCA can give rise to atypical synucleinopathies, with mixed Parkinson’s disease and MSA pathologies. Sequence variation in the regulatory region of SNCA is associated with increased expression of α-synuclein and heightened risk of developing idiopathic Parkinson’s disease (14), which accounts for over 90% of disease cases.
MSA is a sporadic synucleinopathy of adult onset, with symptoms of parkinsonism, cerebellar ataxia and autonomic failure (15–17). Cases of MSA are classified as MSA-P, with predominant parkinsonism caused by striatonigral degeneration, and MSA-C, with cerebellar ataxia associated with olivopontocerebellar atrophy. Autonomic dysfunction is common to both subtypes. Neuropathologically, MSA is defined by regional nerve cell loss and the presence of abundant filamentous α-synuclein inclusions in oligodendrocytes: glial cytoplasmic inclusions (GCIs) or Papp-Lantos bodies (18–21). Smaller numbers of α-synuclein inclusions are also present in nerve cells (22). Mean disease duration is 6-10 years, but survival times of 18-20 years have been reported. Late appearance of autonomic dysfunction correlates with prolonged survival (23).
α-synuclein is a 140 amino acid protein, over half of which consists of seven imperfect repeats, with the consensus sequence KTKEGV (residues 7-87). They encompass the lipid-binding domain (24). The repeats partially overlap with a hydrophobic region (residues 61-95), also known as the non-β-amyloid component (NAC) (25), which is necessary for assembly of recombinant α-synuclein into filaments (26). The carboxy-terminal region (residues 96-140) is negatively charged and its truncation results in increased filament assembly (27). Upon assembly, recombinantly expressed α-synuclein undergoes conformational changes and takes on a cross-β structure characteristic of amyloid (28,29). The cores of α-synuclein filaments extracted from the cerebellum of MSA patients or assembled from recombinant protein in vitro encompass around 70 amino acids, extending approximately from residues 30-100 (30).
Seeded assembly of α-synuclein, propagation of inclusions and nerve cell death have been demonstrated in a variety of systems (31–34). Assemblies of recombinant α-synuclein with different morphologies displayed distinct seeding capacities (35). Moreover, GCI α-synuclein has been reported to be approximately three orders of magnitude more potent than Lewy body α-synuclein in seeding aggregation of α-synuclein (36). Indirect evidence has also suggested that distinct conformers of assembled α-synuclein may characterise MSA and disorders with Lewy pathology (37–43). Solubility in SDS distinguishes α-synuclein filaments of MSA from those of DLB (44).
Neuropathological Characteristics
Filaments were extracted using sarkosyl from the putamen of 5 individuals with a neuropathologically confirmed diagnosis of MSA. For cases 1, 2, 3 and 5, filaments were also extracted from frontal cortex; the same was true of cerebellum from case 1. Most sarkosyl-insoluble α-synuclein phosphorylated at S129 was soluble in SDS. More than 90% of α-synuclein inclusions are phosphorylated at S129 (45). One case (number 1) was diagnosed as MSA-P (age at death 85 years) and four cases (numbers 2-5) as MSA-C (ages at death 68, 59, 64 and 70 years). Disease durations for MSA cases 1-5 were: 9, 18, 9, 10 and 19 years.
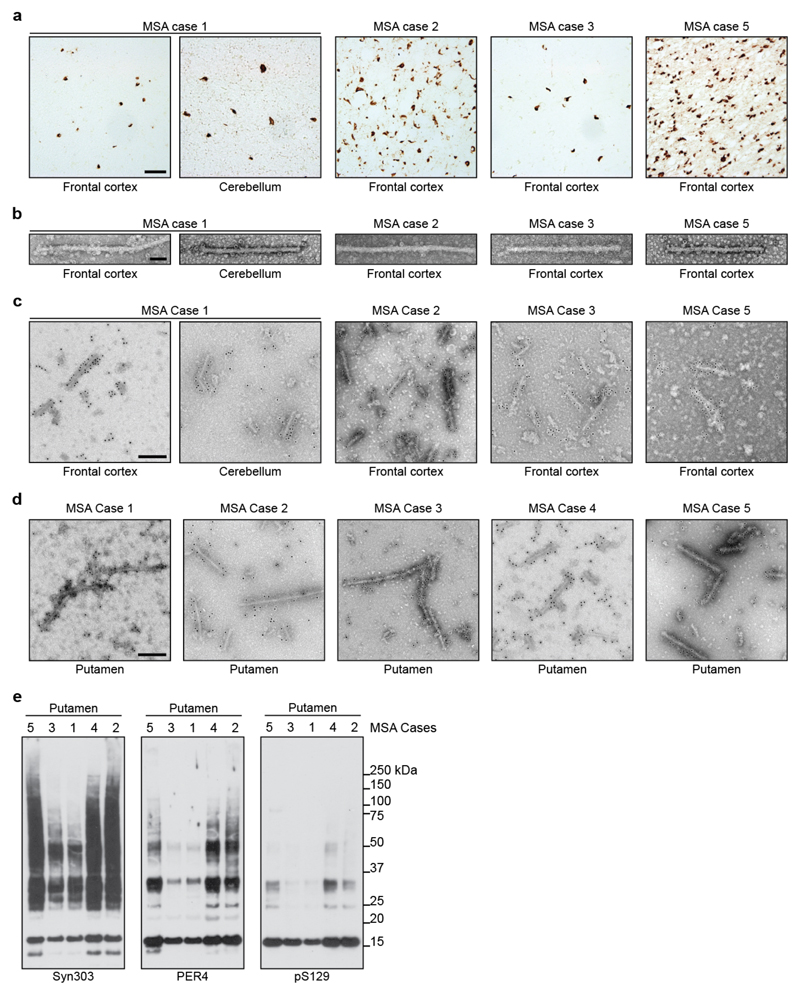
Abundant GCIs and neuronal inclusions were stained by an antibody specific for α-synuclein phosphorylated at S129 [Figure 1a; Extended Data Figure 1a]. By negative-stain electron microscopy (EM), all 5 cases of MSA showed a majority of twisted filaments, with a diameter of 10 nm and a periodicity of 80-100 nm [Figure 1b; Extended Data Figure 1b]. Immunogold negative-stain EM with anti-α-synuclein antibody PER4 showed decoration of MSA filaments [Extended Data Figure 1c,d], in confirmation of previous findings (20). By immunoblotting of sarkosyl-insoluble material from putamen with antibodies Syn303 and PER4, monomeric α-synuclein and high-molecular weight aggregates were in evidence [Extended Data Figure 1e]. Truncated α-synuclein was also present. When antibody pS129 was used, full-length α-synuclein was the predominant species. Consistent with immunostaining [Figure 1a], putamen from MSA cases 1 and 3 contained lower levels of α-synuclein than that from cases 2, 4 and 5.
Figure 1. Filamentous α-synuclein pathology of MSA.
(a), Staining of neuronal and glial inclusions in the putamen of MSA cases 1-5 by an antibody specific for α-synuclein phosphorylated at S129 (brown). Scale bar, 50 μm. (b), Negative stain electron micrographs of filaments from the putamen of MSA cases 1-5. Spherical densities likely correspond to ferritin that purified with the filaments. Scale bar, 50 nm.
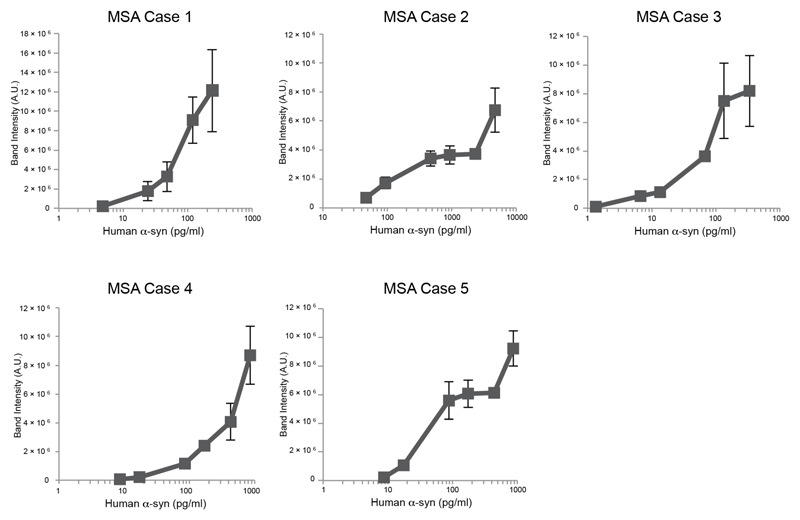
Seeded aggregation of expressed wild-type human α-synuclein was observed in SH-SY5Y cells after addition of sarkosyl-insoluble seeds from the putamen of MSA cases 1-5 [Extended Data Figure 2]. Seeds from MSA case 3 were the most potent, whereas those from MSA case 2 were least effective at inducing seeded aggregation. Seeds from MSA cases 1, 4 and 5 had intermediate seeding potencies.
Cryo-Em Reveals Two Filament Types in Msa
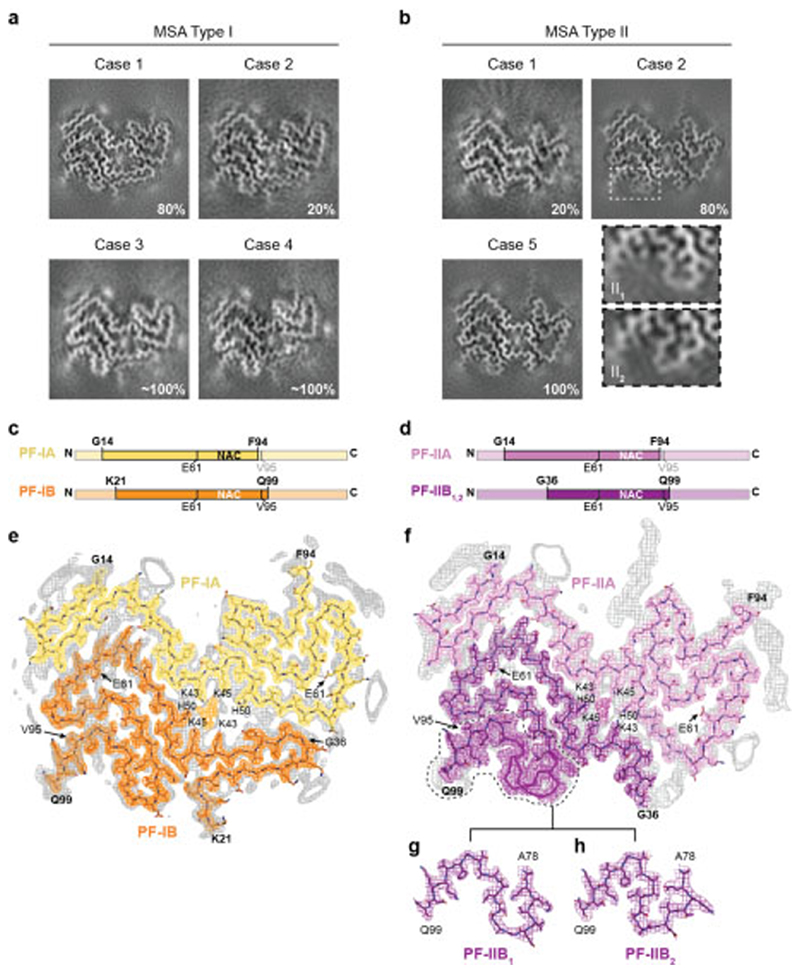
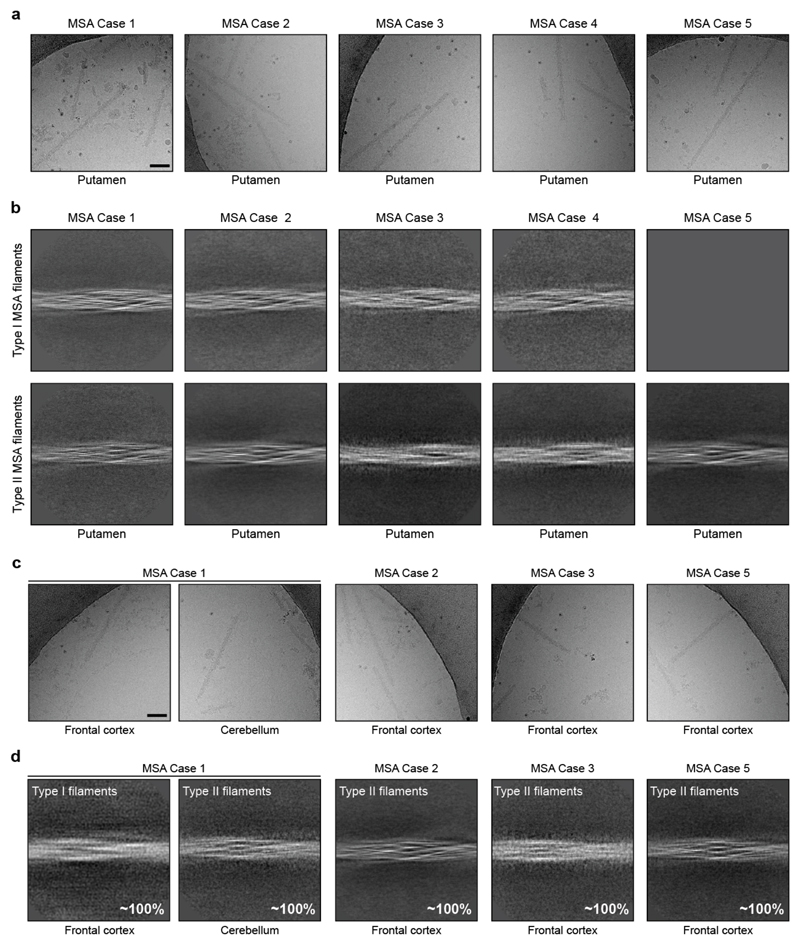
Sarkosyl-insoluble filaments were imaged by cryo-EM [Extended Data Figure 3]. They looked identical upon visual inspection of the micrographs, but two types of filament were revealed by reference-free 2D class averaging [Extended Data Figure 3b,d]. Type I filaments were less symmetrical than Type II. In putamen, Type I:II filament ratios were 80:20 for MSA case 1 (disease duration of 9 years) and 20:80 for case 2 (disease duration of 18 years). Cases 3 and 4 (disease durations of 9 and 10 years) had mostly Type I filaments, whereas case 5 (disease duration of 19 years) had only Type II filaments (Figure 2a,b).
Figure 2. Cryo-EM maps and atomic models of MSA Type I and Type II α-synuclein filaments.
(a,b), Cryo-EM maps of Type I filaments from the putamen of MSA cases 1, 2, 3 and 4 (a) and of Type II filaments from the putamen of MSA cases 1, 2 and 5 (b). For MSA case 2, zoomed-in views of the different regions in Type II1 and II2 filaments are also shown. (c,d), Schematic of the primary structure of human α-synuclein, indicating the cores of protofilaments (PF) IA, IB, IIA and IIB. The NAC domain (residues 61-95) is also shown. (e,f), Sharpened, high-resolution cryo-EM maps of MSA Type I (e) and Type II (f) α-synuclein filaments with overlaid atomic models. Unsharpened, 4.5 Å low pass-filtered maps are in grey. They show weaker densities that extend from the N- and C-terminal regions, a peptide-like density in PF-IIA, as well as weaker densities bordering the solvent-exposed chains of K32 and K34 in PF-IA, PF-IB and PF-IIA. Weaker densities bordering the solvent-exposed chains of K58 and K60 in PF-IA and PF-IIA are also present. (g,h), Cryo-EM structures of A78-Q99 of PF-IIB, illustrating heterogeneity (PF-IIB1 and PF-IIB2). Note the strong density at the protofilament interfaces of MSA Type I and Type II filaments. It is surrounded by the side chains of K43, K45 and H50 from each protofilament.
This suggests that the duration of MSA may correlate with the ratio of filament types in putamen, but additional cases of disease are required to establish this more firmly. What is the case in putamen may not be true of α-synuclein filaments from other affected brain regions. Whereas we identified predominantly Type I filaments in the putamen of MSA cases 1 and 3 [Figure 2], we found almost exclusively Type II filaments in the cerebellum of MSA case 1 and in the frontal cortex of MSA cases 2, 3 and 5 [Extended Data Figure 3d]. It remains to be seen if MSA Type I and Type II filaments are common to both nerve cells and glial cells.
Msa Protofilaments Adopt Extended Folds
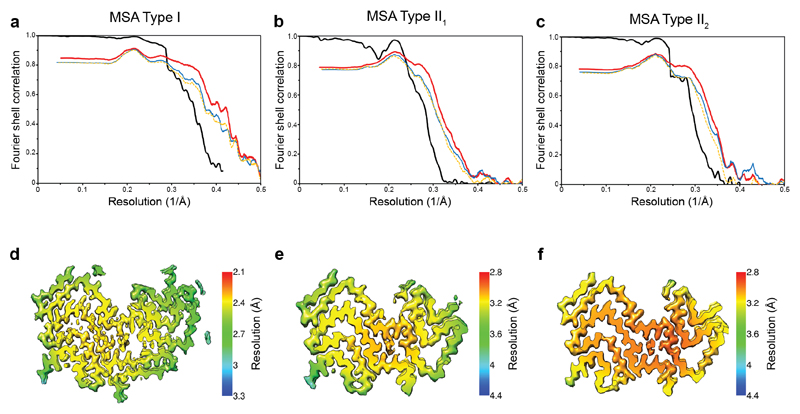
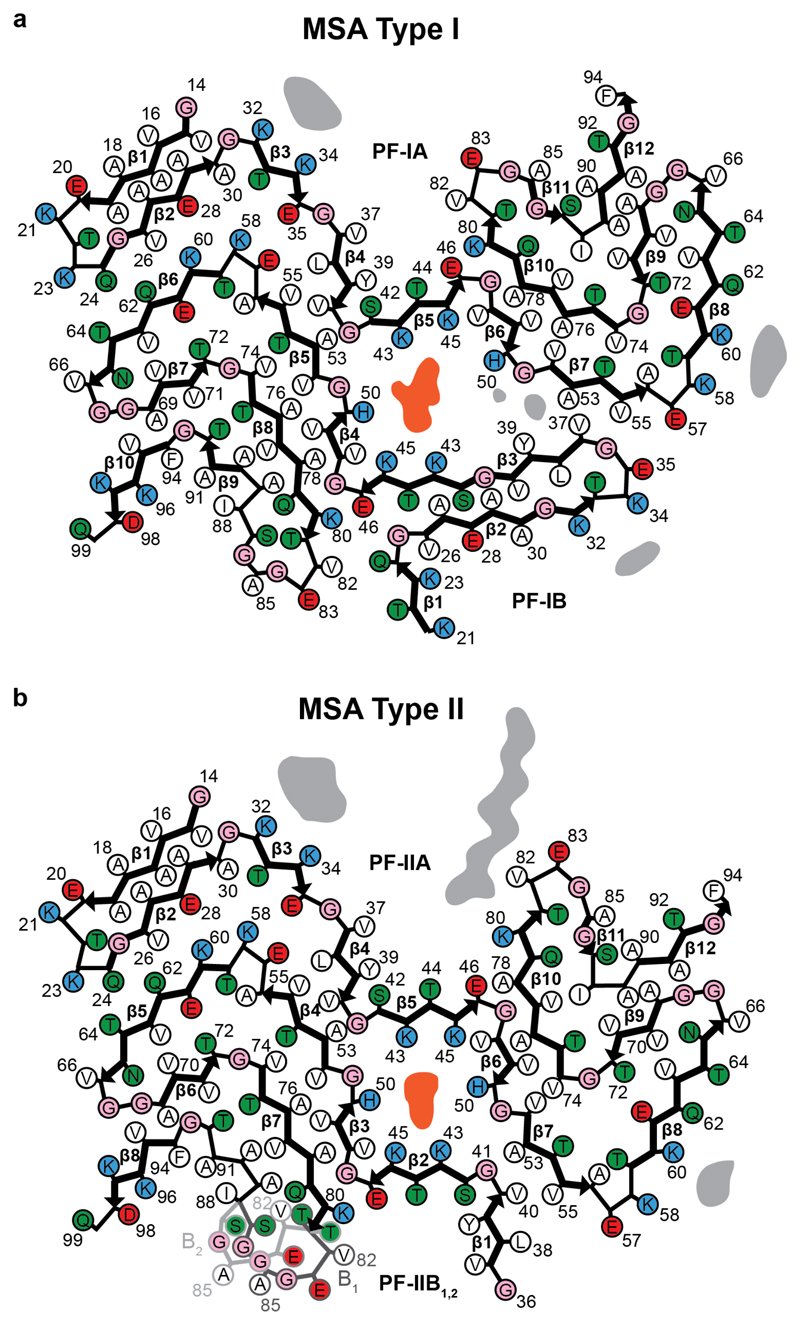
We determined the cryo-EM structures of MSA Type I and Type II filaments from putamen to resolutions sufficient for de novo atomic modelling [Figure 2, Extended Data Table 1]. The best structures were resolved to resolutions of 2.6 Å for Type I filaments from case 1 and 3.1 Å for Type II filaments from case 2 [Extended Data Figure 4]. Type I and Type II filaments are each made of two protofilaments, which consist of an extended N-terminal arm and a compact C-terminal body [Figure 2; Extended Data Figure 5]. Type I and Type II filaments are asymmetrical. PF-IA, the larger protofilament of Type I filaments, comprises residues G14-F94 of α-synuclein, whereas PF-IB, the smaller protofilament, consists of residues K21-Q99 (Figure 2c). PF-IIA and PF-IIB comprise residues G14-F94 and G36-Q99, respectively (Figure 2d). Protofilament folds differ from each other within and between filament types. MSA Type I and Type II filaments are thus made of four distinct protofilaments [Figure 2; Figure 3a].
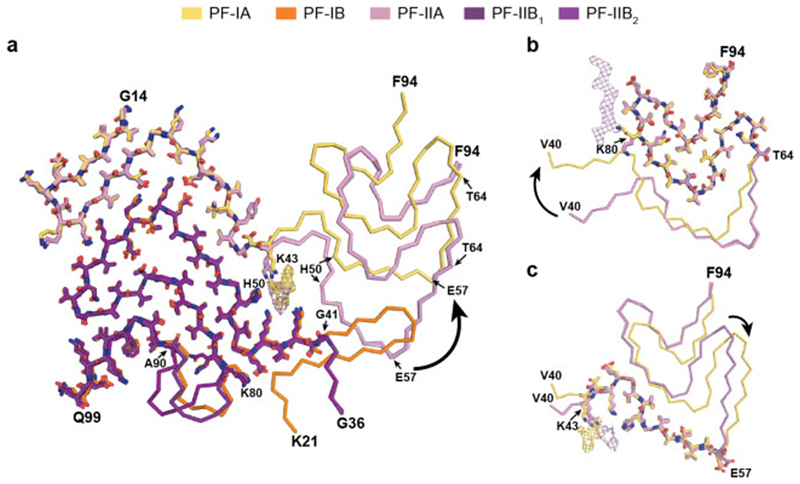
Figure 3. Comparison of MSA α-synuclein protofilament folds.
(a), Overlay of the structures of MSA PF-IA, PF-IB, PF-IIA and PF-IIB. The black arrow indicates the direction of the conformational change that occurs at K43 of PF-IA and PF-IIA. (b,c), Three-layered L-shaped motifs of PF-IA (yellow) and PF-IIA (pink) are aligned, based on the structural similarities between T64-F94 (b) and T44-E57 (c). Black arrows indicate the direction of the conformational change that occurs at T64 (b) or E57 (c) of PF-IA and PF-IIA. The peptide-like density in PF-IIB is shown as a pink mesh.
PF-IA comprises 12 β-strands. Its N-terminal arm consists of a cross-β hairpin (G14-G31) and an extended one-layered L-shaped motif at K32-K45. Its C-terminal body adopts a three-layered L-shaped motif. The outer layer (E46-V66) is the longest. It packs against the outside of the central layer (G67-E83). A salt bridge between E46 and K80 stabilises this interaction. The shorter inner layer (G84-F94) packs against the inside of the central layer. Pairs of glycines in both turns connect the layers. PF-IB comprises 10 β-strands. Its N-terminal arm consists only of a cross-β hairpin at G25-K45. The three-layered L-shaped motif of its C-terminal body is topologically similar to that in PF-1A. Nevertheless, the two motifs differ in structure, most notably in the packing of the inner layer against the central layer by the residues following G86. Whereas the body of PF-IA ends at F94, that of PF-IB extends to Q99.
PF-IIA also comprises 12 β-strands and spans residues G14-F94. Both protofilaments have a similar N-terminal arm [Figure 3b,c]. Although the C-terminal body adopts a three-layered L-shaped motif, its conformation differs in PF-IIA. Whereas G47-V52 from the outer layer pack against A76-K80 from the central layer in Type I protofilaments, in PF-IIA this packing is shifted by two residues and involves V74-A78 in the central layer. This creates a sizeable cavity between the central layer and the L-shaped bend at E57 in the outer layer. It increases the distance between the Cα atoms of E46 and K80 by 5 Å, but a salt bridge may still form between their side chains. PF-IIB is the smallest protofilament core and comprises 9 β-strands. Its N-terminal arm is made of a single L-shaped conformation at G36-K45. Its C-terminal body forms a three-layered L-shaped motif, which exists in two conformations: PF-IIB1, which is virtually identical to PF-IB, and PF-IIB2, which has a different backbone conformation at T81-A90 [Figure 2f, inset Figure 2g,h]. Based on the number of classified helical segments, the ratio of Type II1 : Type II2 filaments was 20:80 [Figure 2b, Extended Data Table 1].
Msa Filaments Enclose Additional Molecules
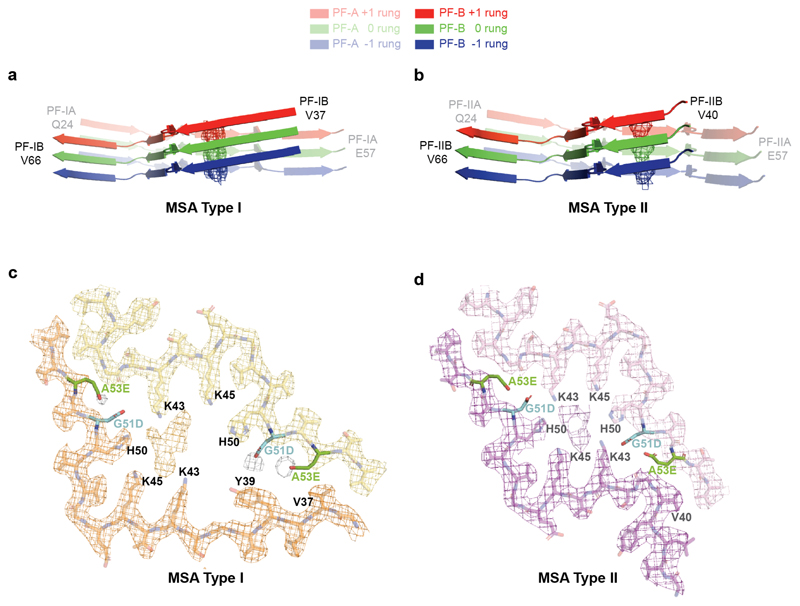
In MSA Type I and Type II filaments, two non-identical protofilaments pack against each other through an extended interface that forms a large cavity surrounded by the side chains of K43, K45 and H50 from each protofilament [Figure 2; Extended Data Figure 5, Extended Data Figure 6a,b]. This cavity encloses an additional strong density that is not connected to the protein density [Figure 2; Extended Data Figure 4]. The chemical nature of this density remains to be established. The observations that it is disconnected from the density of the α-synuclein polypeptide chains, and that it would need to compensate 4 positive charges for everyβ-sheet rung, suggest that this density is non-proteinaceous. In Type I filaments, the cavity is larger than in Type II filaments and contains additional, smaller densities between H50, G51 and A53 of PF-IA, and V37 and Y39 of PF-IB. Although we used sarkosyl to extract filaments, the central cavity is not large enough to accommodate one sarkosyl molecule per rung. Moreover, the negative charge of sarkosyl’s headgroup (-1) cannot compensate for the positive charge (+4 per rung) of the central cavity, and the polar nature of the cavity is not compatible with the fatty acid tail of sarkosyl.
Besides the density in the large cavity at the protofilament interface, several other densities are visible at lower intensities. At the N- and C-termini of the ordered cores of all four protofilaments, fuzzy densities probably correspond to less well-ordered extensions of the core. The longest extensions are seen for PF-IA and PF-IIA. Unlike PF-IA, a peptide-like density of unknown identity is packed against residues K80-E83 of PF-IIA. It may correspond to an extension of the C-terminus of α-synuclein in PF-IIA, or to an unknown protein that is bound to the filament core. Additional unconnected densities are observed in front of pairs of lysines on the exterior of the filaments, i.e. in front of K32 and K34 of PF-IA, PF-IB and PF-IIA, as well as in front of K58 and K60 of PF-IA and PF-IIA. Similar densities were observed in front of pairs of lysines on the exterior of tau filaments from Alzheimer’s disease (4,6), Pick’s disease (5), CTE (7) and CBD (9). Again, the identities of the molecules that form these densities remain unknown.
In the structures of MSA Type I and Type II filaments, residues G51 and A53 of α-synuclein form part of the protofilament interfaces, and are located close to K43, K45 and H50. Mutations G51D and A53E in SNCA are the only known disease-causing mutations that increase the negative charge of α-synuclein (11–13). All four protofilaments of MSA filaments can accommodate the side chains of D51 or E53 without significant structural changes [Extended Data Figure 6c,d]. The presence of D51 or A53 may thus give rise to similar Type I and Type II filament structures. However, the changes in charge of the residues surrounding the central cavity may lead to a different molecular composition of the additional density in G51D and A53E mutation cases compared to sporadic MSA.
By mass spectrometry of sarkosyl-insoluble α-synuclein from putamen, N-terminal acetylation, C-terminal truncation and ubiquitination of K6 and K12 were common to MSA cases 1-5. In the sequences of the filament cores, K21 was ubiquitinated in all cases. Despite identical Type I and Type II filament structures, sarkosyl-insoluble α-synuclein from only some cases of MSA also showed ubiquitination of K23, K60 and K80, acetylation of K21, K23, K32, K34, K45, K58, K60, K80 and K96, as well as phosphorylation of Y39, T59, T64, T72 and T81. With the possible exception of ubiquitination of K80, the percentage of α-synuclein molecules modified at a given residue was low, suggesting that these post-translational modifications are not responsible for additional densities in the cryo-EM maps. Some modifications have been described previously (1), but others are new.
Ubiquitination of K80 was detected in sarkosyl-insoluble α-synuclein from MSA cases 2 and 5 (disease durations of 18 and 19 years), with a preponderance of Type II filaments. This bulky post-translational modification, which is compatible with the PF-IIA structure, clashes with the surroundings of the K80 side chain in PF-IA, PF-IB and PF-IIB. Moreover, one end of the peptide-like density, which is specific for Type II filaments, is located next to K80 of PF-IIA. This density, which does not appear to be connected to the side chain of K80, may consist of a mixture of different sequences, with ubiquitination possibly playing a role. Phosphorylation of T72 may favour PF-IIA over PF-IA. Whereas the side chain of T72 is buried in PF-IA, it borders a large cavity between the outer and central layers of PF-IIA. Phosphorylation of T81 may distinguish between PF-IIB1 and PF-IIB2, since the side chain of this residue is buried in PF-IIB1, but solvent-exposed in PF-IIB2. Post-translational modifications in only one protofilament may favour the formation of asymmetrical Type I and Type II filaments. Thus, in the structures of PF-A, the side chain of K60 is solvent-exposed and can carry a bulky modification. In PF-B structures, by contrast, it is buried in the interfaces between protofilaments.
Dlb Filament Structures are Different
Our results show that α-synuclein filaments adopt the same structures in different individuals with MSA. Previously, we made similar observations for tau filaments from the brains of individuals with Alzheimer’s disease (4,6), Pick’s disease (5), CTE (7) and CBD (9). Tau filaments adopt an identical fold in individuals with the same disease, but different tauopathies are characterised by distinct folds. To assess if the same is true of synucleinopathies, we used cryo-EM to examine α-synuclein filaments that were isolated from the brains of 3 individuals with a neuropathologically confirmed diagnosis of DLB.
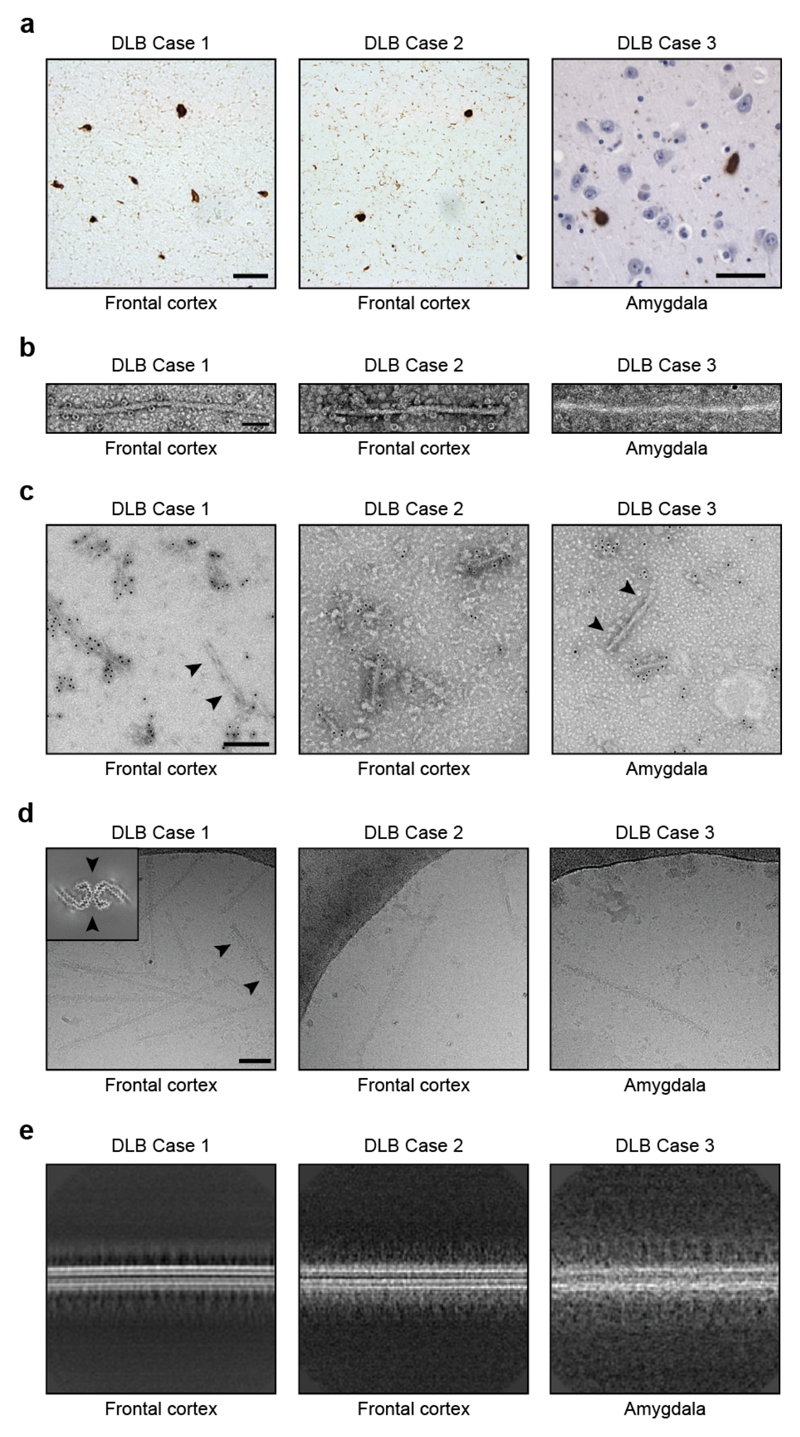
In frontal cortex and amygdala, abundant Lewy bodies and Lewy neurites were stained by an antibody specific for α-synuclein phosphorylated at S129 [Extended Data Figure 7a]. Following sarkosyl extraction, α-synuclein filaments from the brains of individuals with DLB did not appear to twist and were thinner than those from the brains of individuals with MSA [Extended Data Figure 7b,d]. Similar differences between α-synuclein filaments from the brains of individuals with Lewy pathology and MSA have been described (20,38). Unlike MSA, most sarkosyl-insoluble α-synuclein phosphorylated at S129 from DLB brains was SDS-insoluble, in agreement with previous findings (44). Immunogold negative-stain EM with antibody PER4 showed decoration of DLB filaments [Extended Data Figure 7c], in confirmation of previous findings (46). The lack of twist precluded three-dimensional structure determination of α-synuclein filaments from DLB by cryo-EM, but based on reference-free 2D class averages [Extended Data Figure 7e], we conclude that the structures of α-synuclein filaments of DLB are different from those of MSA.
Synthetic Filament Structures are Different
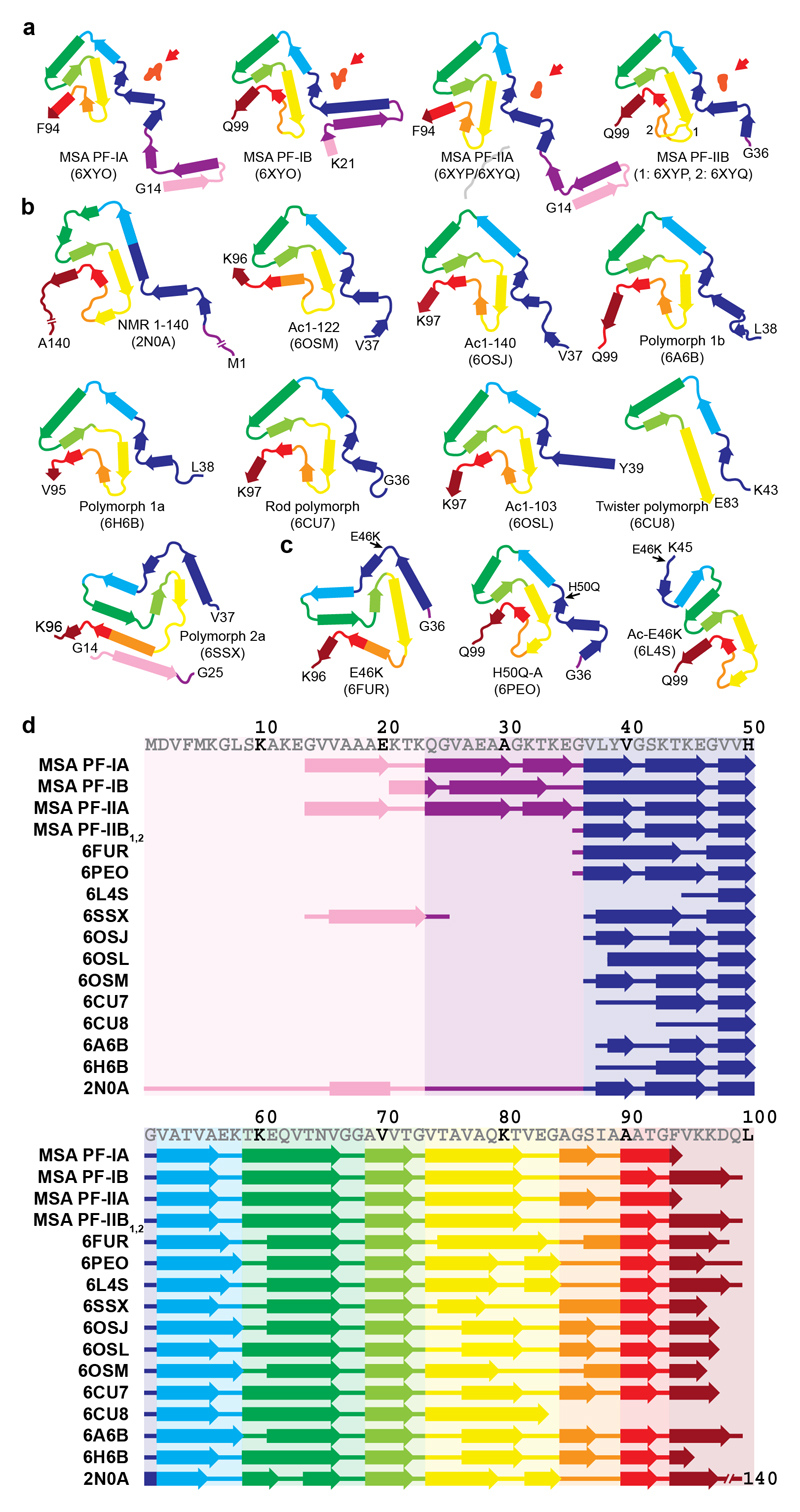
We next compared the structures of filaments from MSA brains with those assembled in vitro from recombinant wild-type and mutant α-synucleins (47–54) [Extended Data Figure 8]. The largest differences are in the extended sizes of the MSA protofilaments and in their asymmetrical packing. None of the recombinant α-synuclein filaments contain the long N-terminal arms of MSA filaments and most recombinant filaments are made of either one protofilament or two identical protofilaments related by helical symmetry.
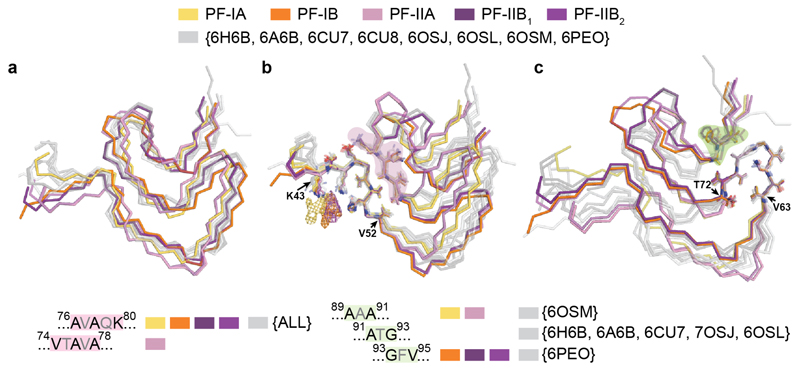
Like all MSA protofilaments, some recombinant α-synuclein protofilaments also contain three-layered L-shaped motifs [Extended Data Figure 9]. One feature that recombinant α-synuclein filaments with the three-layered L-shaped motif have in common is that they were assembled in the presence of polyanions, like phosphate, or of chaotropic, negatively charged ions, such as bromine (47–50). It has been suggested that the additional densities in front of the side chains of K43 and K45 from one protofilament, and of K58 from the other, correspond to phosphate ions (48,51). This raises the possibility that the additional density in the cavity at the protofilament interface of MSA filaments may also consist of molecules that contain phosphate groups. Unlike in the recombinant α-synuclein structures, the pseudo-symmetric cavity in MSA Type II filaments can accommodate approximately 2 phosphate groups per β-sheet rung, consistent with the size of the density. In Type I filaments, the central cavity is more open on one side and can therefore accommodate a larger density.
The finding that the structures of α-synuclein filaments from MSA differ from those of assembled recombinant proteins is consistent with the observation that inhibitors of α-synuclein assembly affected aggregation by MSA and recombinant filament seeds differently (55). It is also reminiscent of similar findings for tau filaments (4–9), even though marked differences exist between tau and α-synuclein. Recombinant tau requires cofactors to form filaments in vitro, whereas assembly of recombinant α-synuclein proceeds in the absence of cofactors. Moreover, α-synuclein exists as a single protein of 140 amino acids, whereas 6 tau isoforms ranging from 352-441 amino acids are expressed in adult human brain; the isoform composition of filaments varies among some tauopathies (56). Still, as was the case of recombinant α-synuclein filaments (47–54), the structures of heparin-induced filaments of recombinant tau (8) differed from those present in disease (4–7,9). In both cases, in vitro assembled filaments were smaller and adopted topologically simpler conformations.
Outlook
Here we establish the presence of two types of α-synuclein filament in MSA, and suggest that different conformers (or strains) of assembled α-synuclein exist in DLB. To understand the causes and spreading of α-synuclein pathology, as well as what distinguishes synucleinopathies, it will be important to identify the mechanisms of seed formation and subsequent assembly. The presence of post-translational modifications in assembled α-synuclein is well established, but their relevance for assembly is not understood (1). In addition, the structures of α-synuclein filaments from MSA reveal the presence of non-proteinaceous molecules, reminiscent of findings in tauopathies (7,9). It will be important to identify the chemical nature of these molecules and to study their effects, alone or in conjunction with post-translational modifications, on α-synuclein and tau assembly. Understanding the structural specificity of filament assembly in disease will facilitate the development of tracers for imaging filamentous amyloid assemblies of α-synuclein in brain, as well as of molecules that prevent, inhibit and reverse filament formation.
Methods
No statistical methods were used to predetermine sample size. The experiments were not randomized and investigators were not blinded to allocation during experiments and outcome assessment.
Clinical history and neuropathology
MSA case 1 was an 85-year-old woman who died with a neuropathologically confirmed diagnosis of MSA-P following a 9-year history of bradykinesia, rigidity in upper and lower limbs and autonomic failure. MSA case 2 was a 68-year-old woman who died with a neuropathologically confirmed diagnosis of MSA-C following an 18-year history of cerebellar ataxia, gait disturbance and autonomic failure. MSA case 3 was a 59-year-old man who died with a neuropathologically confirmed diagnosis of MSA-C following a 9-year history of dysarthria, cerebellar ataxia and autonomic failure. MSA case 4 was a 64-year-old man who died with a neuropathologically confirmed diagnosis of MSA-C following a 10-year history of cerebellar ataxia, dysarthria and autonomic failure. MSA case 5 was a 70-year-old man who died with a neuropathologically confirmed diagnosis of MSA-C following a 19-year history of cerebellar ataxia and autonomic failure. DLB case 1 was a 59-year old man who died with a neuropathologically confirmed diagnosis of DLB following a 10-year history of resting tremor, bradykinesia, rigidity, postural instability and visual hallucinations. DLB case 2 was a 74-year old man who died with a neuropathologically confirmed diagnosis of diffuse Lewy body disease following a 13-year history of bradykinesia, postural instability and visual hallucinations. DLB case 3 was a 78-year old man who died with a neuropathologically confirmed diagnosis of diffuse Lewy body disease following a 15-year history of resting tremor, bradykinesia, autonomic symptoms and visual hallucinations.
Extraction of α-synuclein filaments
Sarkosyl-insoluble material was extracted from fresh-frozen brain regions of MSA and DLB, essentially as described (38). Briefly, tissues were homogenised in 20 vol. (v/w) extraction buffer consisting of 10 mM Tris-HCl, pH 7.5, 0.8 M NaCl, 10% sucrose and 1 mM EGTA. Homogenates were brought to 2% sarkosyl and incubated for 30 min. at 37° C. Following a 10 min. centrifugation at 10,000 g, the supernatants were spun at 100,000 g for 20 min. The pellets were resuspended in 500 μl/g extraction buffer and centrifuged at 3,000 g for 5 min. The supernatants were diluted 3-fold in 50 mM Tris-HCl, pH 7.5, containing 0.15 M NaCl, 10% sucrose and 0.2% sarkosyl, and spun at 166,000 g for 30 min. Sarkosyl-insoluble pellets were resuspended in 100 μl/g of 30 mM Tris-HCl, pH 7.4. We used approximately 0.5 g tissue for cryo-EM and 0.5 g for negative stain immuno-EM In some experiments, sarkosyl-insoluble pellets were resuspended in 30 mM Tris-HCl, 2% SDS, left at room temperature for 30 min. and spun at 100,000 g for 30 min The pellets were resuspended in 8M urea. Both supernatants and pellets were immunoblotted using anti-pS129 α-synuclein antibody.
Immunolabelling and histology
Immunogold negative-stain EM and Western blotting were carried out as described (57). Filaments were extracted from putamen of MSA cases 1-5, frontal cortex of MSA cases 1, 2, 3, 5, cerebellum of MSA case 1, frontal cortex of DLB cases 1, 2, and amygdala of DLB case 3. PER4 (46) was used at 1:50 (a rabbit polyclonal serum that recognises the carboxy-terminal region of α-synuclein). Images were acquired at x11,000 with a Gatan Orius SC200B CCD detector on a Tecnai G2 Spirit at 120 eV. For Western blotting, the samples were resolved on 4-12% Bis-Tris gels (NuPage) and the primary antibodies diluted in PBS plus 0.1% Tween 20 and 5% non-fat dry milk. Prior to blocking, membranes were fixed with 1% paraformaldehyde for 30 min. Primary antibodies were: Syn303 (BioLegend) (58) at 1:4,000 (a mouse monoclonal antibody that recognises the amino-terminus of α-synuclein), PER4 at 1:4,000 and pS129 (ab51253, Abcam) at 1:5,000 (a rabbit monoclonal antibody that recognises α-synuclein phosphorylated at S129). Histology and immunohistochemistry were carried out as described (38,59). Some brain sections (8 μm) were counterstained with haematoxylin. The primary antibody was specific for α-synuclein phosphorylated at S129 (ab51253).
Seeded α-synuclein aggregation
The ability of sarkosyl-insoluble fractions from the putamen of MSA cases 1-5 to convert expressed soluble α-synuclein into its abnormal form was examined, as described (60,61). Following addition of variable amounts of seeds (ranging from 1-4,700 pg/ml), transfected cells were incubated for 3 days. Sarkosyl-insoluble α-synuclein was extracted, run on 15% SDS-PAGE and immunoblotted with a mouse monoclonal antibody specific for α-synuclein phosphorylated at S129 (pSyn64 at 1:1,000) (45). Band intensities were quantified using ImageJ software.
Mass spectrometry of sarkosyl-insoluble α-synuclein
Protease digestion and nano-flow liquid chromatography-ion trap mass spectrometry (LC-MS/MS, Thomas Scientific, Q Exactive HF) were used to identify post-translational modifications in sarkosyl-insoluble α-synuclein extracted from the putamen of MSA cases 1-5 (62). The concentration of α-synuclein was determined using an ELISA kit (Abcam). Sarkosyl-insoluble fractions containing approximately 65 ng of α-synuclein were treated with 70% formic acid for 1 h at room temperature, diluted in water and dried. They were digested overnight with trypsin/lysyl-endopeptidase. Peptides were then analysed by LC-MS/MS.
Electron cryo-microscopy
Extracted α-synuclein filaments were applied to glow-discharged holey carbon gold grids (Quantifoil R1.2/1.3, 300 mesh) and plunge-frozen in liquid ethane using an FEI Vitrobot Mark IV. Micrographs were acquired using two different Thermo Fisher Titan Krios microscopes that were operated at 300 kV. On the first microscope, at the MRC Laboratory of Molecular Biology in Cambridge, UK, a Gatan K2 Summit direct detector was used in counting mode. On the second microscope, at the UK electron Bio-Imaging Centre (eBIC) at Diamond, a Gatan K3 direct detector in super-resolution mode was used. Inelastically scattered electrons were removed by a GIF Quantum energy filter (Gatan) using a slit width of 20 eV. Further details are given in Extended Data Table 1.
Helical reconstruction
Movie frames were corrected for beam-induced motion and dose-weighted using RELION’s motion-correction implementation (63). Super-resolution K3 movies were Fourier-cropped during motion correction, and the reported pixel size in Extended Data Table 1 is the physical pixel size. Aligned, non-dose-weighted micrographs were used to estimate the contrast transfer function using CTFFIND-4.1 (64). All subsequent image-processing steps were performed using helical reconstruction methods in RELION 3.0 (65). Filaments were picked manually.
MSA datasets
Segments for reference-free 2D classification comprising an entire helical crossover were extracted using an inter-box distance of 14.1 Å. For samples extracted from putamen, segments with a box size of 750 pixels and a pixel size of 1.15 Å were downscaled to 256 pixels for MSA cases 2-5, and segments with a box size of 900 pixels and a pixel size of 0.83 Å were downscaled to 300 pixels for MSA case 1. For samples extracted from frontal cortex of MSA cases 1, 2, 3, 5 and cerebellum of case 1, segments with a box size of 750 pixels and a pixel size of 1.15 Å were downscaled to 256 pixels. MSA Type I and Type II filaments from putamen were initially separated by reference-free 2D classification and segments contributing to suboptimal 2D class averages were discarded. For both types of filaments, an initial helical twist of -1.4° was calculated from the apparent crossover distances of filaments in micrographs, and the helical rise was fixed at 4.7 Å. Using these values, initial 3D models for both types were constructed de novo from 2D class averages of segments that comprise entire helical crossovers using the relion_helix_inimodel2d program (66). Type I and Type II filament segments were then re-extracted using box sizes of 220 pixels for MSA cases 2-5 or 320 pixels for MSA case 1, without downscaling. Starting with these segments and an initial de novo model low-pass filtered to 10 Å, 3D auto-refinement was carried out for several rounds with optimisation of helical twist and rise after reconstructions showed separation of β-strands along the helical axis. We then performed Bayesian polishing and contrast transfer function refinement, followed by 3D classification with local optimisation of helical twist and rise, but without further image alignment, to remove segments that yielded suboptimal 3D reconstructions. To further separate the subtypes of Type II filaments, segments from MSA case 2 were subjected to additional supervised and focused 3D classifications of K45-V95 from PF-IIB; Type II1 and II2 filaments served as references. For all cases, selected segments were used for further 3D auto-refinement. Final reconstructions were sharpened using the standard post-processing procedures in RELION (65). Overall resolution estimates were calculated from Fourier shell correlations at 0.143 between the two independently refined half-maps, using phase-randomisation to correct for convolution effects of a generous, soft-edged solvent mask that extended to 20 % of the height of the box. Local resolution estimates were obtained using the same phase-randomisation procedure, but with a soft spherical mask that was moved over the entire map. Using the relion_helix_toolbox program (66), helical symmetries were imposed on the post-processed maps, which were then used for model building. The reported ratios of MSA Type I and Type II filament segments in each case were determined by 2D classification of mixed sets of segments, which were re-extracted with box sizes of 750 or 900 pixels, while keeping the alignment parameters fixed to those resulting from the initial 3D refinements.
DLB datasets
DLB filament segments were extracted using an inter-box distance of 14.1 Å. For DLB cases 1-3, segments with a box size of 540 pixels and a pixel size of 1.15 Å were downscaled to 270 pixels. Reference-free 2D classification was performed using standard procedures.
Model building and refinement
Atomic models for Type I and Type II filaments were built de novo in Coot (67), using the maps of MSA case 1 and MSA case 2, respectively. Model building was started from the topologically conserved C-terminal bodies using the cryo-EM structure of recombinant α-synuclein filaments (6A6B) as an initial reference (48). The handedness of the final models was confirmed by the presence of densities for the main-chain carbonyl oxygen atoms in the map of Type I filaments at a resolution of 2.6 Å. For turns with weaker densities, models were built at low display thresholds. Models containing 5 β-sheet rungs were refined in real-space by PHENIX using local symmetry and geometry restraints (68). MolProbity (69) was used for model validation. Additional details are given in Extended Data Table 1.
Ethical review processeses and informed consent
The studies carried out at Tokyo Metropolitan Institute of Medical Science and at Indiana University were approved through the ethical review processes of each Institution. Informed consent was obtained from the patients’ next of kin.
Reporting summary
Further information on research design is available in the Nature Research Reporting Summary linked to this paper.
Extended Data
Extended Data Figure 1. Filamentous α-synuclein pathology and immunolabelling of α-synuclein filaments in MSA.
(a) Staining of inclusions in frontal cortex of MSA cases 1, 2, 3, 5 and cerebellum of case 1 by an antibody specific for α-synuclein phosphorylated at S129 (brown). Scale bar, 50 μm. (b), Negative-stain EM images of filaments from frontal cortex of MSA cases 1, 2, 3, 5, and cerebellum of case 1. Scale bar, 50 nm. (c,d) Representative immunogold negative-stain EM images of α-synuclein filaments extracted from frontal cortex of MSA cases 1, 2, 3, 5, cerebellum of case 1 and putamen of cases 1-5. Filaments were labelled with antibody PER4, Scale bar, 200 nm. (e), Immunoblots of sarkosyl-insoluble material from putamen of MSA cases 1-5, using anti-α-synuclein antibodies Syn303 (N-terminus), PER4 (C-terminus) and pS129 (phosphorylation of S129).
Extended Data Figure 2. Aggregation of α-synuclein in SH-SY5Y cells following addition of seeds from the putamen of MSA cases 1-5.
Quantitation of wild-type human α-synuclein phosphorylated at S129 in SH-SY5Y cells following addition of variable amounts of α-synuclein seeds from the putamen of MSA cases 1-5. The results are expressed as means ± S.E.M. (n=3).
Extended Data Figure 3. Cryo-EM images and 2D classification of MSA filaments.
(a,c), Representative cryo-EM images of α-synuclein filaments from putamen of MSA cases 1-5, frontal cortex of cases 1, 2, 3, 5 and cerebellum of case 1. Scale bar, 100 nm. (b,d), Two-dimensional class averages spanning an entire crossover of Type I and Type II filaments extracted from putamen of MSA cases 1-5, frontal cortex of cases 1, 2, 3, 5 and cerebellum of case 1.
Extended Data Figure 4. Resolution evaluation of cryo-EM maps and of refined models.
(a-c), For MSA Type I (a), Type II1 (b) and Type II2 (c) filaments: Fourier shell correlation (FSC) curves of two independently refined half-maps (black line); FSC curves of final cryo-EM reconstruction and refined atomic model (red); FSC curves of first half-map and the atomic model refined against this map (blue); FSC curves of second half-map and the atomic model refined against the first half-map (yellow dashes). (d-f), Local resolution estimates of the reconstructions of MSA Type I (d), Type II1 (e) and Type II2 (f) filaments.
Extended Data Figure 5. MSA Type I and Type II α-synuclein filaments.
(a), Schematic of MSA Type I filament, showing asymmetric protofilaments IA and IB. The non-proteinaceous density at the protoflament interface is shown in light red. (b), Schematic of MSA Type II filament, showing asymmetric protofilaments IIA and IIB. The non-proteinaceous density at the protofilament interface is shown in light red.
Extended Data Figure 6. The inter-protofilament interfaces of MSA Type I and Type II α-synuclein filaments.
Rendered view of secondary structure elements in MSA Type I (a) and Type II (b) protofilament folds perpendicular to the helical axis of inter-protofilament interfaces, depicted as three rungs. Because of variations in the height of both polypeptide chains along the helical axis, each α-synuclein molecule interacts with three different molecules in the opposing protofilament. If one considers the interaction between two opposing molecules to be on the same β-sheet rung in the central cavity, the N-terminal arm of PF-A interacts with the C-terminal body of the PF-B molecule, which is one rung higher, while the C-terminal body of PF-IA interacts with the N-terminal arm of the PF-IB molecule, which is one rung lower. (c,d), Compatibility of mutant α-synuclein (G51D and A53E) with MSA Type I and Type II filaments. Close-up views of atomic models of Type I (c) and Type II (d) α-synuclein folds containing D51 (cyan) and E53 (green). Each mutation adds two negatively charged side chains per rung in the second shell of residues around the central cavity, thus reducing the shell’s net positive charge.
Extended Data Figure 7. Filamentous α-synuclein pathology in DLB.
(a), Staining of inclusions in frontal cortex of DLB cases 1 and 2 and amygdala of DLB case 3 by an antibody specific for α-synuclein phosphorylated at S129 (brown). Scale bar, 50 μm. (b), Negative-stain EM images of filaments from frontal cortex of DLB cases 1 and 2 and amygdala of DLB case 3. Scale bar, 50 nm. (c), Representative immunogold negative-stain EM images of α-synuclein filaments extracted from frontal cortex of DLB cases 1 and 2 and amygdala of DLB case 3. Filaments were labelled with antibody PER4, which recognises the C-terminus of α-synuclein. Arrowheads point to an unlabelled tau paired helical filament. Scale bar, 200 nm. (d), Representative cryo-EM images of α-synuclein filaments from frontal cortex of DLB cases 1 and 2, and amygdala of DLB case 3. Scale bar, 200 nm. Arrowheads point to a tau paired helical filament, as evidenced by a three-dimensional reconstruction (inset), calculated as described (6). (e), Two-dimensional class averages of α-synuclein filaments extracted from frontal cortex of DLB cases 1 and 2 and amygdala of DLB case 3.
Extended Data Figure 8. Structures of α-synuclein protofilament cores.
(a), Schematic of secondary structure elements in the α-synuclein protofilament (PF) cores of MSA. Red arrows point to the non-proteinaceous density (in light red) at protofilament interfaces. (b,c), Secondary structure elements in the α-synuclein protofilament cores assembled from recombinant wild-type (b) and mutant (c) α-synuclein. β-Strands are shown as thick arrows. (d), Schematic depicting the first 100 amino acids of human α-synuclein, comparing secondary structure elements in PF cores from MSA with those in PF cores assembled from recombinant α-synuclein. As observed previously for tau filaments (9), the arrangement of residues in β-strands is largely conserved among protofilament cores. This is especially the case for residues that adopt the conserved three-layered L-shaped motif, and less so for residues in the N-terminal arms.
Extended Data Figure 9. MSA filaments differ from those assembled with recombinant α-synuclein.
(a), Overlay of the three-layered L-shaped motifs of MSA α-synuclein filaments (yellow, orange, pink and purple) and filaments assembled in vitro using recombinant α-synuclein that contain a similar motif (grey). Despite topological similarities, none of the three-layered L-shaped motifs in recombinant α-synuclein protofilaments are identical to those of MSA protofilaments. The closest similarity to an in vitro structure is between PF-IIB2 and 6PEO (52), which differ only in the bend positions in the outer layer (between E57 and K58 for PF-IIB2 and between T59 and K60 for 6PEO). (b), Overlay of MSA and recombinant α-synuclein structures based on the turn at K43-V52, revealing a conserved interface between E46-V49 and V74-A78 or A76-K80 (red highlight), including the formation of a salt bridge between E46 and K80. (c), Overlay of MSA and recombinant α-synuclein structures based on the conserved turn at V63-T72, revealing a second conserved turn (V63-T72) and a conserved packing through tight interdigitations of small side chains between A69-T72 and residues on the inner layer (green highlight). In MSA PF-IA and PF-IIA filaments, as well as in 6OSM (47), these residues are A89 and A91; in MSA PF-IB and PF-IIB filaments, as well as in 6PEO, they are G93 and V95; in several recombinant α-synuclein structures, they are A91 and G93.
Extended Data Table 1. Cryo-EM data collection, refinement and validation statistics.
| MSA-Case 1 Putamen (Type I: EMD-10650) | MSA-Case 1 Cerebellum | MSA-Case 1 Frontal cortex | MSA-Case 2 Putamen (Type II1: EMD-10651) (Type II2: EMD-10652) | MSA-Case 2 Frontal cortex | MSA-Case 3 Putamen | MSA-Case 3 Frontal cortex | MSA-Case 4 Putamen | MSA-Case 5 Putamen | MSA-Case 5 Frontal cortex | |
|---|---|---|---|---|---|---|---|---|---|---|
| Data collection and processing | ||||||||||
| Magnification | x105,000 | x105,000 | x105,000 | x105,000 | x105,000 | x105,000 | x105,000 | x105,000 | x105,000 | x105,000 |
| Voltage (kV) | 300 | 300 | 300 | 300 | 300 | 300 | 300 | 300 | 300 | 300 |
| Detector | K3 | K2 Summit | K2 Summit | K2 Summit | K2 Summit | K2 Summit | K2 Summit | K2 Summit | K2 Summit | K2 Summit |
| Electron exposure (e−/Å2) | 49.2 | 51.1 | 51.0 | 47.5 | 51.0 | 46.2 | 50.1 | 45.4 | 38.8 | 51.3 |
| Defocus range (μm) | -1.7 to -2.8 | -1.8 to -2.4 | -1.8 to -2.4 | -1.7 to -2.6 | -1.8 to -2.4 | -1.6 to -2.8 | -1.8 to -2.4 | -1.8 to -2.4 | -1.8 to -2.4 | -1.8 to -2.4 |
| Pixel size (Å) | 0.829 | 1.15 | 1.15 | 1.15 | 1.15 | 1.15 | 1.15 | 1.15 | 1.15 | 1.15 |
| Micrographs (no.) | 6936 | 1415 | 1548 | 5172 | 1366 | 4101 | 2879 | 4084 | 3494 | 1436 |
| Initial particle images (no.) | 329,477 | 24,751 | 9,312 | 386,301 | 154,026 | 93,599 | 22,555 | 93,814 | 200,385 | 61,963 |
| Final particle images (no.) | Type I: 120,501 Type II: 34,239 | Type I: 10,067 Type II1: 23,983 Type II2: 93,137 | Type I: 81,189 | Type I: 85,044 | Type II: 174,764 | |||||
| Map resolution (Å; FSC=0.143) | Type I: 2.60 Type II: 3.68 | Type I: 3.61 Type II1: 3.29 Type II2: 3.09 | Type I: 3.61 | Type I: 3.78 | Type II: 3.24 | |||||
| Map resolution range (Å) | Type I: 2.29 – 24.12 | Type II1: 3.05 – 28.11 Type II2: 2.84 – 23.00 | ||||||||
| Helical rise (Å) | Type I: 4.72 Type II: 4.75 | Type I: 4.71 Type II1: 4.72 Type II2: 4.72 | Type I: 4.72 | Type I: 4.72 | Type II: 4.71 | |||||
| Helical twist (°) | Type I: -1.44 Type II: -1.36 | Type I: -1.40 Type II1: -1.41 Type II2: -1.34 | Type I: -1.42 | Type I: -1.45 | Type II: -1.40 | |||||
| Case 1 – Putamen (Type I: 6XYO) | Case 2 – Putamen (Type II1: 6XYP) | Case 2 – Putamen (Type II,: 6XYQ) | ||||||||
|---|---|---|---|---|---|---|---|---|---|---|
| Refinement | ||||||||||
| Initial model used | 6A6B | 6A6B | 6A6B | |||||||
| Model resolution (Å; FSC=0.5) | 2.6 | 3.27 | 3.1 | |||||||
| Map sharpening B factor (Å) | -46.75 | -62.5 | -60.28 | |||||||
| Model composition | ||||||||||
| Non-hydrogen atoms | 5490 | 4955 | 4955 | |||||||
| Protein residues | 800 | 725 | 725 | |||||||
| Protein B factor (Å) | 57.82 | 73.68 | 69.86 | |||||||
| R.m.s. deviations | ||||||||||
| Bond lengths (Å) | 0.008 | 0.008 | 0.007 | |||||||
| Bond angles (°) | 0.739 | 0.643 | 0.706 | |||||||
| Validation | ||||||||||
| MolProbity score | 1.43 | 1.59 | 1.72 | |||||||
| Clashscore | 5.78 | 8.09 | 9.08 | |||||||
| Poor rotamers (%) | 0.93 | 0 | 0 | |||||||
| Ramachandran plot | ||||||||||
| Favored (%) | 97.44 | 97.16 | 96.45 | |||||||
| Allowed (%) | 100 | 100 | 100 | |||||||
| Disallowed (%) | 0 | 0 | 0 | |||||||
| DLB-Case 1 Frontal cortex | DLB-Case 2 Frontal cortex | DLB-Case 3 Amygdala | ||||||||
|---|---|---|---|---|---|---|---|---|---|---|
| Data collection and processing | ||||||||||
| Magnification | x105,000 | x150,000 | x150,000 | |||||||
| Voltage (kV) | 300 | 300 | 300 | |||||||
| Detector | K2 Summit | K2 Summit | K2 Summit | |||||||
| Electron exposure (e−/Å2) | 47.6 | 50.4 | 51.1 | |||||||
| Defocus range (μm) | -1.7 to -2.8 | -1.8 to -2.4 | -1.8 to -2.4 | |||||||
| Pixel size (Å) | 1.15 | 1.15 | 1.15 | |||||||
| Micrographs (no.) | 3662 | 1728 | 3653 | |||||||
| Initial particle images (no.) | 672,428 | 43,773 | 14,292 | |||||||
Acknowledgements
We thank the patients’ families for donating brain tissues; T. Nakane for help with RELION; T. Darling and J. Grimmett for help with high-performance computing; F. Epperson, U. Kuederli, R. Otani and R.M. Richardson for support with neuropathology; R.A. Crowther, B. Falcon, S. Lovestam, M.G. Spillantini and W. Zhang for helpful discussions. M.G. is an Honorary Professor in the Department of Clinical Neurosciences of the University of Cambridge and an Associate Member of the U.K. Dementia Research Institute. This work was supported by the U.K. Medical Research Council (MC_UP_A025_1013, to S.H.W.S., and MC_U105184291, to M.G.), Eli Lilly and Company (to M.G.), the European Union (EU/EFPIA/Innovative Medicines Initiative [2] Joint Undertaking IMPRIND, project 116060, to M.G.), the Japan Agency for Medical Research and Development (JP18ek0109391 and JP18dm020719, to M.H.), the U.S. National Institutes of Health (P30-AG010133 and U01-NS110437, to B.G.) and the Department of Pathology and Laboratory Medicine, Indiana University School of Medicine (to B.G.). We acknowledge Y. Chaban at Diamond for access to and support from the cryo-EM facilities at the U.K. electron Bio-Imaging Centre (eBIC), proposal EM17434-75, funded by the Wellcome Trust, the MRC and the BBSRC, for acquisition of the MSA case 1 dataset. This study was supported by the MRC-LMB EM facility.
Footnotes
Author contributions. A.T., B.G., T.M., T.T., K.H., S.M., M.Y. and M.H. identified patients, performed neuropathology and extracted α-synuclein filaments from MSA cases 1-5 and DLB cases 1-2; M.S. extracted α-synuclein filaments from DLB case 3 and conducted immunolabelling of filaments from MSA cases 1-5 and DLB cases 1-3; F.K. and M.H. carried out mass spectrometry; A.T. and M.H. did seeded aggregation; M.S., Y.S. and S.H.W.S. performed cryo-EM and analysed the cryo-EM data; Y.S. and A.G.M. built the atomic models; S.H.W.S. and M.G. supervised the project; all authors contributed to writing the manuscript.
Data availability
Raw cryo-EM micrographs are available in EMPIAR, entry numbers EMPIAR-10357 (MSA case 1) and EMPIAR-10358 (MSA case 2). Cryo-EM maps have been deposited in the Electron Microscopy Data Bank (EMDB) under accession numbers EMD-10650 for Type I filaments from MSA case 1, EMD-10651 for Type II1 filaments from MSA case 2 and EMD-10652 for Type II2 filaments from MSA case 2. The corresponding atomic models have been deposited in the Protein Data Bank (PDB) under the following accession numbers: 6XYO for Type I filaments from MSA case 1, 6XYP for Type II1 filaments from MSA case 2 and 6XYQ for Type II2 filaments from MSA case 2. LC-MS/MS data were obtained from the ProteomeXchange database and have been deposited in JPOST (Japan Proteome Standard Repository/Database) under I.D. PXD018434..
References
- 1.Goedert M, Jakes R, Spillantini MG. The Synucleinopathies: twenty years on. J Parkinson’s Dis. 2017;7:S51–S69. doi: 10.3233/JPD-179005. [DOI] [PMC free article] [PubMed] [Google Scholar]
- 2.Spillantini MG, et al. α-synuclein in Lewy bodies. Nature. 1997;388:839–840. doi: 10.1038/42166. [DOI] [PubMed] [Google Scholar]
- 3.Polymeropoulos MH, et al. Mutation in the α-synuclein gene identified in families with Parkinson’s disease. Science. 1997;276:2045–2047. doi: 10.1126/science.276.5321.2045. [DOI] [PubMed] [Google Scholar]
- 4.Fitzpatrick AWP, et al. Cryo-EM structures of tau filaments from Alzheimer’s disease. Nature. 2017;547:185–190. doi: 10.1038/nature23002. [DOI] [PMC free article] [PubMed] [Google Scholar]
- 5.Falcon B, et al. Structures of filaments from Pick’s disease reveal a novel tau protein fold. Nature. 2018;561:137–140. doi: 10.1038/s41586-018-0454-y. [DOI] [PMC free article] [PubMed] [Google Scholar]
- 6.Falcon B, et al. Tau filaments from multiple cases of sporadic and inherited Alzheimer’s disease adopt a common fold. Acta Neuropathol. 2018;136:699–708. doi: 10.1007/s00401-018-1914-z. [DOI] [PMC free article] [PubMed] [Google Scholar]
- 7.Falcon B, et al. Novel tau filament fold in chronic traumatic encephalopathy encloses hydrophobic molecules. Nature. 2019;568:420–423. doi: 10.1038/s41586-019-1026-5. [DOI] [PMC free article] [PubMed] [Google Scholar]
- 8.Zhang W, et al. Heparin-induced tau filaments are polymorphic and differ from those in Alzheimer’s and Pick’s diseases. eLife. 2019;8:e43584. doi: 10.7554/eLife.43584. [DOI] [PMC free article] [PubMed] [Google Scholar]
- 9.Zhang W, et al. Novel tau filament fold in corticobasal degeneration, a four-repeat tauopathy. Nature. 2020 doi: 10.1038/s41586-020-2043-0. [DOI] [PMC free article] [PubMed] [Google Scholar]
- 10.Singleton AB, et al. α-synuclein locus triplication causes Parkinson’s disease. Science. 2003;302:841. doi: 10.1126/science.1090278. [DOI] [PubMed] [Google Scholar]
- 11.Kiely AP, et al. α-synucleinopathy associated with G51D SNCA mutation: A link between Parkinson’s disease and multiple system atrophy? Acta Neuropathol. 2013;125:753–769. doi: 10.1007/s00401-013-1096-7. [DOI] [PMC free article] [PubMed] [Google Scholar]
- 12.Kiely AP, et al. Distinct clinical and neuropathological features of G51D SNCA mutation cases compared with SNCA duplication and H50Q mutation. Mol Neurodeg. 2015;10:41. doi: 10.1186/s13024-015-0038-3. [DOI] [PMC free article] [PubMed] [Google Scholar]
- 13.Pasanen P, et al. A novel α-synuclein mutation A53E associated with atypical multiple system atrophy and Parkinson’s disease-type pathology. Neurobiol Aging. 2014;35:e2181–e2185. doi: 10.1016/j.neurobiolaging.2014.03.024. [DOI] [PubMed] [Google Scholar]
- 14.Nalls MA, et al. Large-scale meta-analysis of genome-wide association data identifies six new risk loci for Parkinson’s disease. Nature Genet. 2014;46:989–993. doi: 10.1038/ng.3043. [DOI] [PMC free article] [PubMed] [Google Scholar]
- 15.Dejerine J, Thomas A. L’atrophie olivo-ponto-cérébelleuse. Nouv Iconogr Salpêtrière. 1900;13:330–370. [Google Scholar]
- 16.Graham JG, Oppenheimer DR. Orthostatic hypotension and nicotine sensitivity in a case of multiple system atrophy. J Neurol Neurosurg Psychiatry. 1969;32:28–34. doi: 10.1136/jnnp.32.1.28. [DOI] [PMC free article] [PubMed] [Google Scholar]
- 17.Quinn N. Multiple system atrophy – the nature of the beast. J Neurol Neurosurg Psychiatry. 1989;(Suppl):78–89. doi: 10.1136/jnnp.52.suppl.78. [DOI] [PMC free article] [PubMed] [Google Scholar]
- 18.Papp MI, Kahn JE, Lantos PL. Glial cytoplasmic inclusions in the CNS of patients with multiple system atrophy. J Neurol Sci. 1989;94:79–100. doi: 10.1016/0022-510x(89)90219-0. [DOI] [PubMed] [Google Scholar]
- 19.Wakabayashi K, Yoshimoto M, Tsuji S, Takahashi H. α-synuclein immunoreactivity in glial cytoplasmic inclusions in multiple system atrophy. Neurosci Lett. 1998;49:180–182. doi: 10.1016/s0304-3940(98)00407-8. [DOI] [PubMed] [Google Scholar]
- 20.Spillantini MG, et al. Filamentous α-synuclein inclusions link multiple system atrophy with Parkinson’s disease and dementia with Lewy bodies. Neurosci Lett. 1998;251:205–208. doi: 10.1016/s0304-3940(98)00504-7. [DOI] [PubMed] [Google Scholar]
- 21.Tu P, et al. Glial cytoplasmic inclusions in white matter oligodendrocytes of multiple system atrophy brain contain insoluble α-synuclein. Ann Neurol. 1998;44:415–422. doi: 10.1002/ana.410440324. [DOI] [PubMed] [Google Scholar]
- 22.Kato S, Nakamura H. Cytoplasmic argyrophilic inclusions in neurons of pontine nuclei in patients with olivopontocerebellar atrophy: immunohistochemical and ultrastructural studies. Acta Neuropathol. 1990;79:584–594. doi: 10.1007/BF00294235. [DOI] [PubMed] [Google Scholar]
- 23.Petrovic IN, et al. Multiple system atrophy-parkinsonism with slow progression and prolonged survival: a diagnostic catch. Mov Disord. 2012;27:1184–1188. doi: 10.1002/mds.25115. [DOI] [PubMed] [Google Scholar]
- 24.Davidson WS, Jonas A, Clayton DF, George JM. Stabilization of α-synuclein secondary structure upon binding to synthetic membranes. J Biol Chem. 1998;273:9443–9449. doi: 10.1074/jbc.273.16.9443. [DOI] [PubMed] [Google Scholar]
- 25.Ueda K, et al. Molecular cloning of cDNA encoding an unrecognized component of amyloid in Alzheimer disease. Proc Natl Acad Sci USA. 1993;90:11282–11286. doi: 10.1073/pnas.90.23.11282. [DOI] [PMC free article] [PubMed] [Google Scholar]
- 26.Li HT, Du HN, Tang L, Hu J, Hu HY. Structural transformation and aggregation of human α-synuclein in trifluoroethanol: Non-amyloid component sequence is essential and β-sheet formation is prerequisite to aggregation. Biopolymers. 2002;64:221–226. doi: 10.1002/bip.10179. [DOI] [PubMed] [Google Scholar]
- 27.Crowther RA, Jakes R, Spillantini MG, Goedert M. Synthetic filaments assembled from C-terminally truncated α-synuclein. FEBS Lett. 1998;436:309–312. doi: 10.1016/s0014-5793(98)01146-6. [DOI] [PubMed] [Google Scholar]
- 28.Conway KA, Harper JD, Lansbury PT. Fibrils formed in vitro from α-synuclein and two mutant forms linked to Parkinson’s disease are typical amyloid. Biochemistry. 2000;39:2552–2563. doi: 10.1021/bi991447r. [DOI] [PubMed] [Google Scholar]
- 29.Serpell LC, Berriman J, Jakes R, Goedert M, Crowther RA. Fiber diffraction of synthetic α-synuclein filaments show amyloid-like cross-β conformation. Proc Natl Acad Sci USA. 2000;97:4897–4902. doi: 10.1073/pnas.97.9.4897. [DOI] [PMC free article] [PubMed] [Google Scholar]
- 30.Miake H, Mizusawa H, Iwatsubo T, Hasegawa M. Biochemical characterization of the core structure of α-synuclein filaments. J Biol Chem. 2002;277:19213–19219. doi: 10.1074/jbc.M110551200. [DOI] [PubMed] [Google Scholar]
- 31.Mougenot AL, et al. Prion-like acceleration of a synucleinopathy in a transgenic mouse model. Neurobiol Aging. 2012;33:2225–2228. doi: 10.1016/j.neurobiolaging.2011.06.022. [DOI] [PubMed] [Google Scholar]
- 32.Luk KC, et al. Pathological α-synuclein transmission initiates Parkinson-like neurodegeneration in nontransgenic mice. Science. 2012;338:949–953. doi: 10.1126/science.1227157. [DOI] [PMC free article] [PubMed] [Google Scholar]
- 33.Masuda-Suzukake M, et al. Prion-like spreading of pathological α-synuclein in brain. Brain. 2013;136:1128–1138. doi: 10.1093/brain/awt037. [DOI] [PMC free article] [PubMed] [Google Scholar]
- 34.Osterberg VR, et al. Progressive aggregation of α-synuclein and selective degeneration of Lewy inclusion-bearing neurons in a mouse model of parkinsonism. Cell Rep. 2015;10:1252–1260. doi: 10.1016/j.celrep.2015.01.060. [DOI] [PMC free article] [PubMed] [Google Scholar]
- 35.Peelaerts W, et al. α-synuclein strains cause distinct synucleinopathies after local and systemic administration. Nature. 2015;522:340–344. doi: 10.1038/nature14547. [DOI] [PubMed] [Google Scholar]
- 36.Peng C, et al. Cellular milieu imparts distinct pathological α-synuclein strains in α-synucleinopathies. Nature. 2018;557:558–563. doi: 10.1038/s41586-018-0104-4. [DOI] [PMC free article] [PubMed] [Google Scholar]
- 37.Prusiner SB, et al. Evidence for α-synuclein prions causing multiple system atrophy in humans with parkinsonism. Proc Natl Acad Sci USA. 2015;112:E5308–E5317. doi: 10.1073/pnas.1514475112. [DOI] [PMC free article] [PubMed] [Google Scholar]
- 38.Tarutani A, Arai T, Murayama S, Hisanaga SI, Hasegawa M. Potent prion-like behaviors of pathogenic α-synuclein and evaluation of inactivation methods. Acta Neuropathol Commun. 2018;6:29. doi: 10.1186/s40478-018-0532-2. [DOI] [PMC free article] [PubMed] [Google Scholar]
- 39.Yamasaki TR, et al. Parkinson’s disease and multiple system atrophy have distinct α-synuclein seed characteristics. J Biol Chem. 2019;294:1045–1058. doi: 10.1074/jbc.RA118.004471. [DOI] [PMC free article] [PubMed] [Google Scholar]
- 40.Lavenir I, et al. Silver staining (Campbell-Switzer) of neuronal α-synuclein assemblies induced by multiple system atrophy and Parkinson’s disease brain extracts in transgenic mice. Acta Neuropathol Commun. 2019;7:148. doi: 10.1186/s40478-019-0804-5. [DOI] [PMC free article] [PubMed] [Google Scholar]
- 41.Klingstedt T, et al. Luminescent conjugated oligothiophenes distinguish between α-synuclein assemblies of Parkinson’s disease and multiple system atrophy. Acta Neuropathol Commun. 2019;7:193. doi: 10.1186/s40478-019-0840-1. [DOI] [PMC free article] [PubMed] [Google Scholar]
- 42.Strohäker T, et al. Structural heterogeneity of α-synuclein fibrils amplified from patient brain extracts. Nature Commun. 2019;10:5535. doi: 10.1038/s41467-019-13564-w. [DOI] [PMC free article] [PubMed] [Google Scholar]
- 43.Shahnawaz M, et al. Discriminating α-synuclein strains in Parkinson’s disease and multiple system atrophy. Nature. 2020;578:273–277. doi: 10.1038/s41586-020-1984-7. [DOI] [PMC free article] [PubMed] [Google Scholar]
- 44.Campbell BCV, et al. The solubility of α-synuclein in multiple system atrophy differs from that of dementia with Lewy bodies and Parkinson’s disease. J Neurochem. 2001;76:87–96. doi: 10.1046/j.1471-4159.2001.00021.x. [DOI] [PubMed] [Google Scholar]
- 45.Fujiwara H, et al. Alphα-synuclein is phosphorylated in synucleinopathy lesions. Nature Cell Biol. 2002;4:160–164. doi: 10.1038/ncb748. [DOI] [PubMed] [Google Scholar]
- 46.Spillantini MG, Crowther RA, Jakes R, Hasegawa M, Goedert M. α-synuclein in filamentous inclusions of Lewy bodies from Parkinson’s disease and dementia with Lewy bodies. Proc Natl Acad Sci USA. 1998;95:6469–6473. doi: 10.1073/pnas.95.11.6469. [DOI] [PMC free article] [PubMed] [Google Scholar]
- 47.Tuttle MD, et al. Solid-state NMR structure of a pathogenic fibril of full-length human α-synuclein. Nature Struct Mol Biol. 2016;23:409–415. doi: 10.1038/nsmb.3194. [DOI] [PMC free article] [PubMed] [Google Scholar]
- 48.Guerrero-Ferreira R, et al. Cryo-EM structure of alphα-synuclein fibrils. eLife. 2018;7:e36402. doi: 10.7554/eLife.36402. [DOI] [PMC free article] [PubMed] [Google Scholar]
- 49.Li Y, et al. Amyloid fibril structure of α-synuclein determined by cryo-electron microscopy. Cell Res. 2018;28:897–903. doi: 10.1038/s41422-018-0075-x. [DOI] [PMC free article] [PubMed] [Google Scholar]
- 50.Li B, et al. Cryo-EM of full-length α-synuclein reveals fibril polymorphs with a common structural kernel. Nature Commun. 2018;9:3609. doi: 10.1038/s41467-018-05971-2. [DOI] [PMC free article] [PubMed] [Google Scholar]
- 51.Guerrero-Ferreira R, et al. Two new polymorphic structures of human full-length alphα-synuclein fibrils solved by cryo-electron microscopy. eLife. 2019;8:e48907. doi: 10.7554/eLife.48907. [DOI] [PMC free article] [PubMed] [Google Scholar]
- 52.Boyer DR, et al. Structures of fibrils formed by α-synuclein hereditary disease mutant H50Q reveal new polymorphs. Nature Struct Mol Biol. 2019;26:1044–1052. doi: 10.1038/s41594-019-0322-y. [DOI] [PMC free article] [PubMed] [Google Scholar]
- 53.Boyer DR, et al. The α-synuclein hereditary mutation E46K unlocks a more stable, pathogenic fibril structure. Proc Natl Acad Sci USA. 2020;117:3592–3602. doi: 10.1073/pnas.1917914117. [DOI] [PMC free article] [PubMed] [Google Scholar]
- 54.Zhao K, et al. Parkinson’s disease associated mutation E46K of α-synuclein triggers the formation of a novel fibril structure. bioRxiv. doi: 10.1038/s41467-020-16386-3. [DOI] [PMC free article] [PubMed] [Google Scholar]
- 55.Sangwan S, et al. Inhibition of synucleinopathic seeding by rationally designed inhibitors. eLife. 2020;9:e46775. doi: 10.7554/eLife.46775. [DOI] [PMC free article] [PubMed] [Google Scholar]
- 56.Goedert M, Falcon B, Zhang W, Ghetti B, Scheres SHW. Distinct conformers of assembled tau in Alzheimer’s and Pick’s diseases. Cold Spring Harbor Symp Quant Biol. 2018;83:163–171. doi: 10.1101/sqb.2018.83.037580. [DOI] [PubMed] [Google Scholar]
- 57.Goedert M, Spillantini MG, Cairns NJ, Crowther RA. Tau proteins of Alzheimer paired helical filaments: abnormal phosphorylation of all six brain isoforms. Neuron. 1992;8:159–168. doi: 10.1016/0896-6273(92)90117-v. [DOI] [PubMed] [Google Scholar]
- 58.Giasson BI, et al. A panel of epitope-specific antibodies detects protein domains distributed throughout human alphα-synuclein in Lewy bodies of Parkinson’s disease. J Neurosci Res. 2000;59:528–533. doi: 10.1002/(SICI)1097-4547(20000215)59:4<528::AID-JNR8>3.0.CO;2-0. [DOI] [PubMed] [Google Scholar]
- 59.Spina S, et al. The tauopathy associated with mutation +3 in intron 10 of Tau: characterization of the MSTD family. Brain. 2008;131:72–89. doi: 10.1093/brain/awm280. [DOI] [PMC free article] [PubMed] [Google Scholar]
- 60.Nonaka T, Watanabe ST, Iwatsubo T, Hasegawa M. Seeded aggregation and toxicity of α-synuclein and tau. J Biol Chem. 2010;285:34885–34898. doi: 10.1074/jbc.M110.148460. [DOI] [PMC free article] [PubMed] [Google Scholar]
- 61.Tarutani A, et al. The effect of fragmented pathogenic α-synuclein seeds on prion-like propagation. J Biol Chem. 2016;291:18675–18688. doi: 10.1074/jbc.M116.734707. [DOI] [PMC free article] [PubMed] [Google Scholar]
- 62.Kametani F, et al. Mass spectrometric analysis of accumulated TDP-43 in amyotrophic lateral sclerosis brains. Sci Rep. 2016;6:23281. doi: 10.1038/srep23281. [DOI] [PMC free article] [PubMed] [Google Scholar]
- 63.Zivanov J, et al. New tools for automated high-resolution cryo-EM structure determination in RELION-3. eLife. 2018;7:e42166. doi: 10.7554/eLife.42166. [DOI] [PMC free article] [PubMed] [Google Scholar]
- 64.Rohou A, Grigorieff N. CTFFIND4: fast and accurate defocus estimation from electron micrographs. J Struct Biol. 2015;192:216–221. doi: 10.1016/j.jsb.2015.08.008. [DOI] [PMC free article] [PubMed] [Google Scholar]
- 65.He S, Scheres SHW. Helical reconstruction in RELION. J Struct Biol. 2017;198:163–176. doi: 10.1016/j.jsb.2017.02.003. [DOI] [PMC free article] [PubMed] [Google Scholar]
- 66.Scheres SHW. Amyloid structure determination in RELION-3.1. Acta Crystallogr D. 2020;76:94–101. doi: 10.1107/S2059798319016577. [DOI] [PMC free article] [PubMed] [Google Scholar]
- 67.Emsley P, Lohkamp B, Scott WG, Cowtan K. Features and development of Coot. Acta Crystallogr D. 2010;66:486–501. doi: 10.1107/S0907444910007493. [DOI] [PMC free article] [PubMed] [Google Scholar]
- 68.Adams PD, et al. PHENIX: A comprehensive Python-based system for macromolecular structure solution. Acta Crystallogr D. 2010;66:213–221. doi: 10.1107/S0907444909052925. [DOI] [PMC free article] [PubMed] [Google Scholar]
- 69.Chen VB, et al. MolProbity: all-atom structure validation for macromolecular crystallography. Acta Crystallogr D. 2010;66:12–21. doi: 10.1107/S0907444909042073. [DOI] [PMC free article] [PubMed] [Google Scholar]
Associated Data
This section collects any data citations, data availability statements, or supplementary materials included in this article.
Data Availability Statement
Raw cryo-EM micrographs are available in EMPIAR, entry numbers EMPIAR-10357 (MSA case 1) and EMPIAR-10358 (MSA case 2). Cryo-EM maps have been deposited in the Electron Microscopy Data Bank (EMDB) under accession numbers EMD-10650 for Type I filaments from MSA case 1, EMD-10651 for Type II1 filaments from MSA case 2 and EMD-10652 for Type II2 filaments from MSA case 2. The corresponding atomic models have been deposited in the Protein Data Bank (PDB) under the following accession numbers: 6XYO for Type I filaments from MSA case 1, 6XYP for Type II1 filaments from MSA case 2 and 6XYQ for Type II2 filaments from MSA case 2. LC-MS/MS data were obtained from the ProteomeXchange database and have been deposited in JPOST (Japan Proteome Standard Repository/Database) under I.D. PXD018434..


