Abstract
Ribosomes are multi-component molecular machines that synthesize all the proteins of living cells. Understandably, most genes encoding the protein components of ribosomes are essential. Reduction in gene dosage is often viable but deleterious and associated with human syndromes, collectively known as ribosomopathies 1–3. The cell biological basis of these pathologies has remained unclear. Here, we model human ribosomopathies in Drosophila and find widespread apoptosis and cellular stress in the resulting animals. This is not caused by insufficient protein synthesis, as reasonably expected. Instead, ribosomal protein deficiency elicits proteotoxic stress, which, we suggest, is caused by the accumulation of misfolded proteins that overwhelm the protein degradation machinery. We find that dampening the integrated stress response 4 or autophagy worsens the harm inflicted by ribosomal protein deficiency, suggesting that these activities could be cytoprotective. Inhibition of TOR activity, which dampens ribosomal protein production, slows down protein synthesis and stimulates autophagy 5, reduces proteotoxic stress in our ribosomopathy model. Interventions that stimulate autophagy, combined with means of boosting protein quality control, could form the basis of a therapeutic strategy for this class of diseases.
Keywords: ribosomes, protein translation, ribosomopathies, proteotoxic stress, autophagy, protein aggregates, apoptosis, p62, eIF2, TOR, RPS23, RPS26, Diamond Blackfan anemia
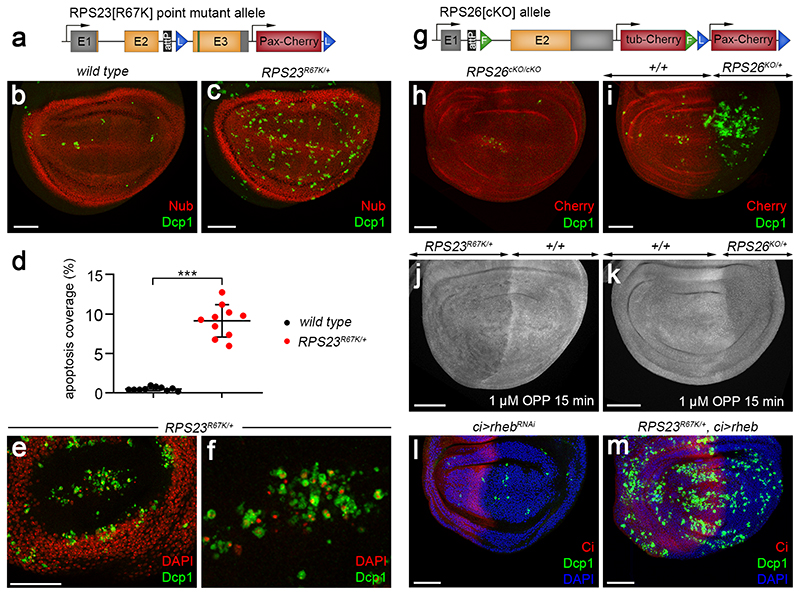
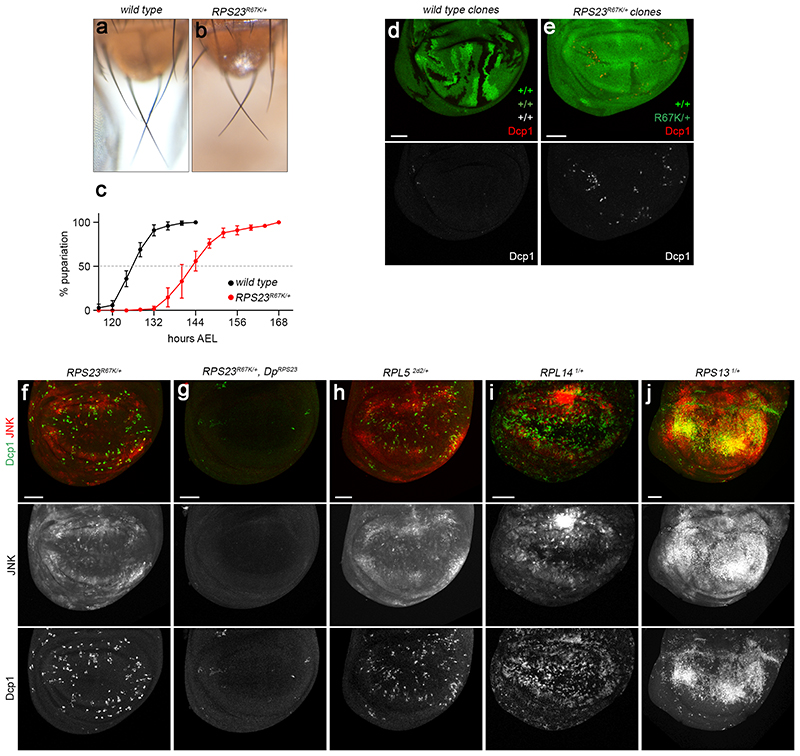
Ribosomopathies encompass a wide range of syndromes. Common symptoms include a reduced number of blood cells, predisposition to cancer, skeletal abnormalities, and growth retardation 1–3. Neurological defects are also observed, though less frequently 1,6–8. A subset of these symptoms including growth retardation and mild autism, but not anemia, were recently reported for a child carrying a de novo mutation in a gene encoding a component of the 40S subunit (RPS23[R67K]) 9,10. Upon the request of this patient’s father, we introduced this mutation in Drosophila and characterised the resulting phenotype. We used CRISPR/Cas9 to replace the third exon by a version encoding the R67K substitution (Fig. 1a). Adult heterozygous (RPS23R67K/+) animals were viable and fertile but displayed the phenotype associated with all the haplo-insufficient genes encoding ribosomal proteins (RPs), collectively known as Minute genes 11,12. Thus, scutellar bristles of RPS23R67K/+ adults were shorter than those of wild type animals and mutant larvae were developmentally delayed (Extended data Fig. 1a-c). Another characteristic of Minute+/- cells is that, in genetic mosaics, they are eliminated by surrounding wild type cells, a process known as cell competition 13. This effect is readily assayed in fast growing larval epithelial structures called wing imaginal discs 14,15. We found that, in mosaic imaginal discs, RPS23R67K/+ cells were outcompeted by wild type cells and that this was accompanied by a high rate of apoptosis, as indicated by Dcp1 immunoreactivity (Extended data Fig. 1d, e). These findings suggest that RPS23R67K behaves like a classical Minute mutation. Therefore, although the patient’s mutation is the starting point of this study, it is expected to trigger the same cell biological response as other ribosomopathy-associated mutations.
Figure 1. Apoptosis and depressed protein synthesis in RP-deficient tissue.
(a) Diagram of the RPS23R67K allele showing the 5’ and 3’ UTRs (grey), the coding exons (orange), attP (black), loxP (blue) and the Pax-Cherry selection cassette (red). The vertical green bar indicates the location of the R67K substitution. (b,c) Wing imaginal discs from wild type and RPS23R67K/+ larvae labelled with anti-Nub (red) to highlight the pouch and anti-Dcp1 (green) to mark apoptotic cells. (d) Apoptotic coverage (% surface area) in wild type (black dots) and RPS23R67K/+ imaginal discs (red dots). (e, f) Accumulation of pyknotic nuclei in a RPS23R67K heterozygous disc. (g) Diagram of the conditional RPS26 allele (RPS26cKO; colour code as in panel a. The FRT sites used for gene inactivation are depicted in green). (h) Homozygous RPS26cKO imaginal disc (wild type for RPS26 activity) showing expression of the tubulin-Cherry cassette and low-level apoptosis (Dcp1 immunoreactivity). (i) RPS26cKO/+ imaginal disc expressing FLP under the control of hedgehog-GAL4. The posterior compartment is hence heterozygous for the RPS26 mutation, as confirmed by the lack of Cherry expression. Note the increased number of apoptotic figures. (j, k) Wing imaginal discs with one half heterozygous mutant for RPS23R67K or RPS26KO and the other half genetically wild type, stained to visualise puromycilated peptides following a 15 min incubation in 1 μM of OPP. In both cases, incorporation is depressed in the mutant compartment. (l, m) Dcp1 immunoreactivity in wild type wing imaginal disc expressing RhebRNAi in the anterior compartment or RPS23R67K/+ wing imaginal disc overexpressing Rheb in the anterior compartment (left hand side, marked with anti-Ci). Statistics in d: n = 10 discs per genotype. Error bars denote standard deviation. A two-tailed unpaired t-test was carried out. ***P = 2.87E-07. Scale bars represent 50 μm. Genotypes for each figure panel are available in Supplementary Table 1. Source data is available for this figure.
Cell competition involves short range interactions that enable wild type cells to trigger apoptosis in Minute+/- cells 14. However, we found that apoptotic figures were widespread in wholly heterozygous RPS23R67K/+ imaginal discs, much more so than in wild type disc 16 (Fig. 1b-f). This observation suggests that RPS23R67K/+ cells undergo apoptosis independently of any signal from wild type cells. This is not a peculiarity of this mutation since RPS3 and RPL14 heterozygotes have been reported to undergo widespread apoptosis, as assayed by TUNEL staining 17. Adding to this evidence, we found that imaginal discs lacking one copy of RPS13, RPL5 or RPL14 had numerous Dcp1-positive cells (Extended data Fig. 1h-j). It is clear therefore that RP-deficient cells undergo apoptosis in a cell competition-independent manner. To confirm that this effect is tissue intrinsic, we generated a conditional allele of RPS26 (Fig. 1g), a gene associated with Diamond Blackfan anemia 18. Inactivation of one homolog in the posterior half of the discs, leaving the rest of the animal genetically wild type, only triggered apoptosis in the heterozygous region (Fig. 1h, i), implying that a systemic signal is not involved.
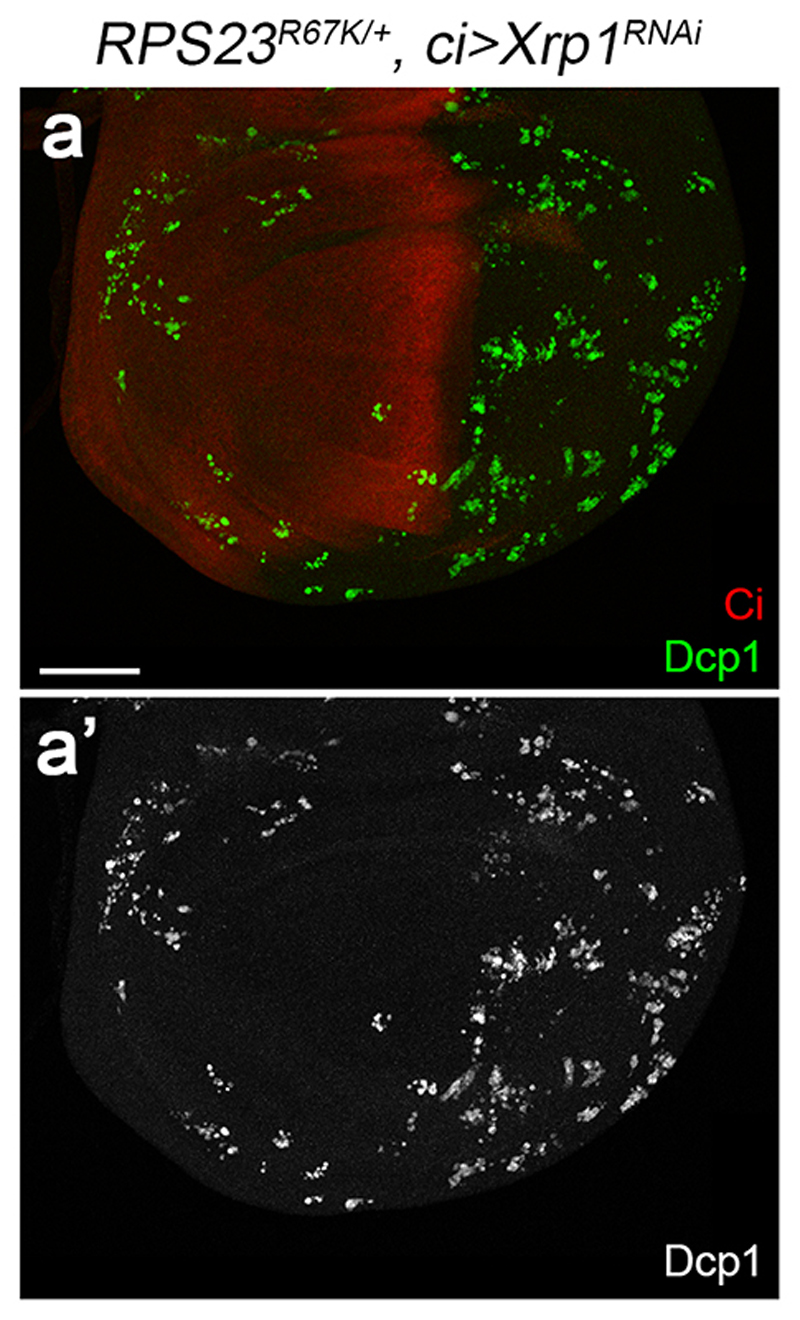
The high rate of apoptosis in Minute heterozygotes suggests that these cells are intrinsically stressed. This is consistent with the widespread activation of JNK signalling that has been reported in RPS3+/- and RPS15+/ imaginal discs 19, an observation that we confirmed in RPS23R67K/-, RPL5+/-, RPL14+/-, and RPS13+/- imaginal discs (Extended data Fig. 1f-j). Another characteristic of Minute mutant cells is that they upregulate Xrp1, a protein recently shown to be required for cell competition 20–22, and associated with the response to oxidative stress 23 and DNA damage response 21. We found that the rate of apoptosis in RPS23R67K heterozygous tissues was strongly reduced by knocking down Xrp1 (Extended data Fig. 2). Therefore, Xrp1 is an essential component of the response to the cellular stress caused by RP deficiency, irrespectively of cell competition. Overall, the above considerations and additional observations in other models of ribosomopathies 1,2,24 show that apoptosis and cellular stress are a characteristic response to RP deficiency.
What could be the proximal cause of stress and apoptosis in RP-deficient tissue? Wing precursors undergo about 1000-fold increase in tissue size during larval development 25,26 and it is conceivable that a limited number of functional ribosomes might not suffice to meet the associated protein demand. Protein synthesis has indeed recently been shown to be depressed in RP-deficient cells 20. We therefore asked whether this is also true in RPS23R67K/+ and RPS26KO/+ tissue. We generated imaginal discs with one half heterozygous mutant and the other half genetically wild type, as an internal control. These imaginal discs were explanted and bathed in 1 μM O-propargyl-puromycin (OPP), for 15 minutes. A click-chemistry reaction was then used to visualise puromycilated peptides in situ 27. Incorporation was reduced in both RPS23R67K/+ and RPS26KO/+ cells relative to that in the control wild type territory (Fig. 1j, k), confirming that the rate of protein synthesis is indeed depressed in these two conditions. However, as argued below, this is unlikely to be the cause of cellular stress.
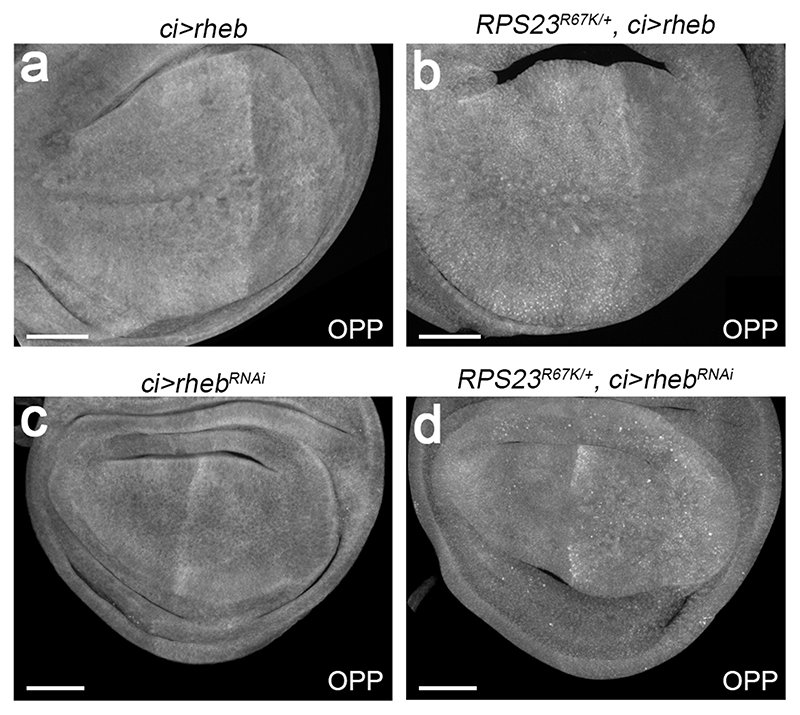
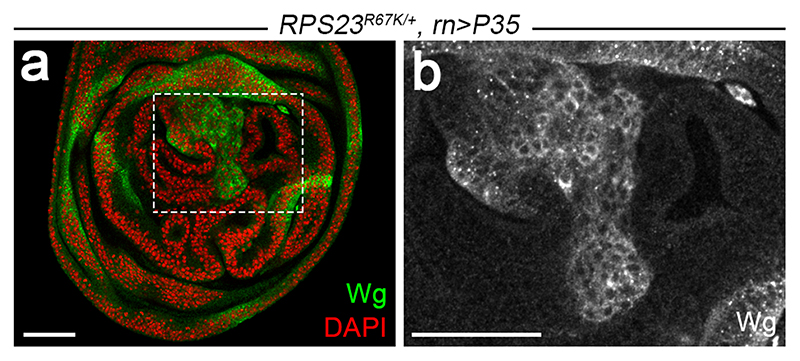
To experimentally alter the rate of protein synthesis, we took advantage of genetic tools that modulate Target of Rapamycin (TOR), a master regulator of translation and ribosome biogenesis 5. Expression of an RNAi transgene against Rheb, a TOR activator, led to reduced OPP incorporation while Rheb overexpression led to increased incorporation (Extended data Fig. 3). Rheb knockdown in the anterior compartment was associated with tissue size reduction, as expected. However, this was not accompanied by increased apoptosis (Fig. 1l). Conversely, stimulation of TOR signalling by Rheb overexpression did not prevent, and even possibly enhanced, apoptosis in RP deficient tissue (Fig. 1m). These results indicate that, while translation is depressed in RP-deficient cells, this is unlikely to be the trigger of apoptosis in these cells. In fact, RPS23R67K/+ cells do not appear to be limited in their capacity to produce proteins since, upon inhibition of apoptosis, they gave rise to tumours, hence generating biomass (Extended data Fig. 4).
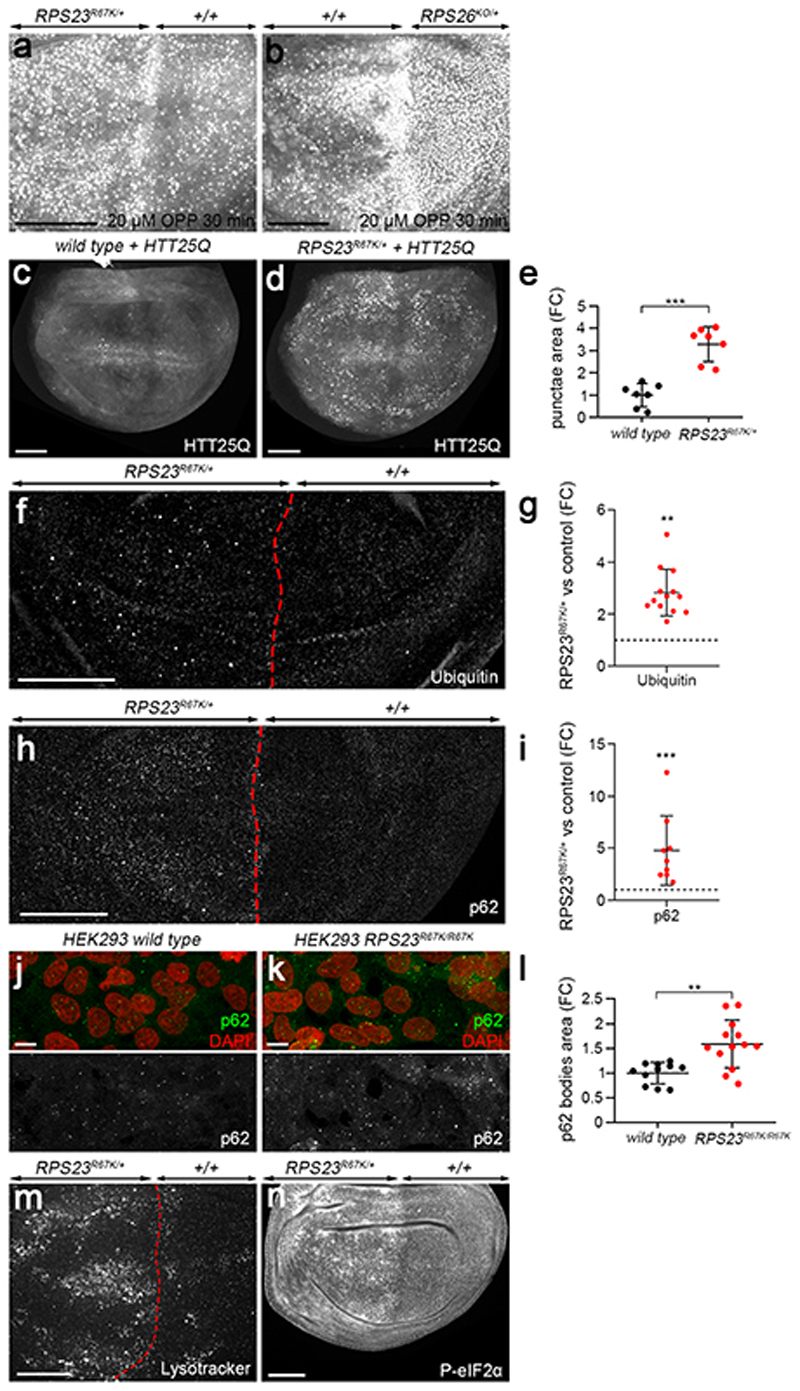
In the course of optimizing the conditions for OPP incorporation, we noticed that, at high doses and/or extended incorporation times (e.g. 20 μM, 30 min), the OPP signal accumulated preferentially in RPS23R67K/+ or RPS26KO/+ tissue by comparison to the wild type territory (Fig. 2a, b). This counterintuitive observation can be rationalised if one considers the fact that puromycin causes premature translation termination in a dose-dependent manner, with the resulting truncated polypeptides often failing to fold properly 28. These defective ribosomal products (DRiPs) are normally recognised and cleared by the ubiquitin-proteasome system (UPS) and autophagy 29,30. However, under conditions of impaired protein quality control response, the burden caused by OPP treatment becomes overwhelming and puromycilated DRiPs accumulate in aggregates 31. Interestingly, puromycilated polypeptides accumulated in large punctae upon high dose of OPP (20 μM, 30 min) and this was much more pronounced in the mutant compartment (RPS23R67K/+ or RPS26KO/+) than in the control tissue. This observation suggests that the disposal of misfolded proteins could be impaired in RP-deficient tissue.
Figure 2. Hallmarks of proteotoxic stress in RP-deficient cells.
(a, b) Wing discs with one half RPS23R67K/+ or RPS26KO/+, labelled to visualise puromycilated peptides following a 30 min incubation in 20 μM of OPP. (c, d) Wing primordia from wild type or RPS23R67K/+ larvae expressing HTT25Q-Cerulean throughout the pouch (under the control of pdm2-GAL4). (e) Quantification of HTT25Q punctae in RPS23R67K/+ tissue (red dots, genotype as in panel d, n = 7 discs), expressed as a fold change (FC) in surface area coverage relative to that in otherwise wild type tissue (black dots, genotype as in panel c, n = 7 discs). (f,g) Anti-ubiquitin staining of a mosaic wing disc with the anterior half RPS23R67K/+. Increased punctae staining in the anterior compartment expressed as a ratio with the posterior signal (n = 13 discs). (h,i) Anti-p62 staining of the same genotype as in panel f and quantified as for panel g (n = 9 discs). (j, k) Wild type or RPS23R67K/R67K HEK293 cells stained with anti-p62 (green) and DAPI (red). (l) Coverage of p62 immunoreactivity in RPS23R67K/R67K (n = 13 images) relative to that in wild type HEK293 cells (n = 11 images). (m) Lysotracker staining in a wing disc with one half RPS23R67K/+. (n) P-eIF2α immunoreactivity in a wing disc with one half RPS23R67K/+. Statistics: all error bars denote standard deviation. For panels e, g, i and l, a two-tailed unpaired t-test was carried out. P-values in e, ***P = 5.81E-05; g, **P = 1.08E-03; i, ***P = 1.96E-04; l, **P = 1.07E-03. Scale bars: 50 μm in panels a-h and m, n, and 10 μm in panels j, k. Genotypes for each figure panel are available in Supplementary Table 1. Source data is available for this figure.
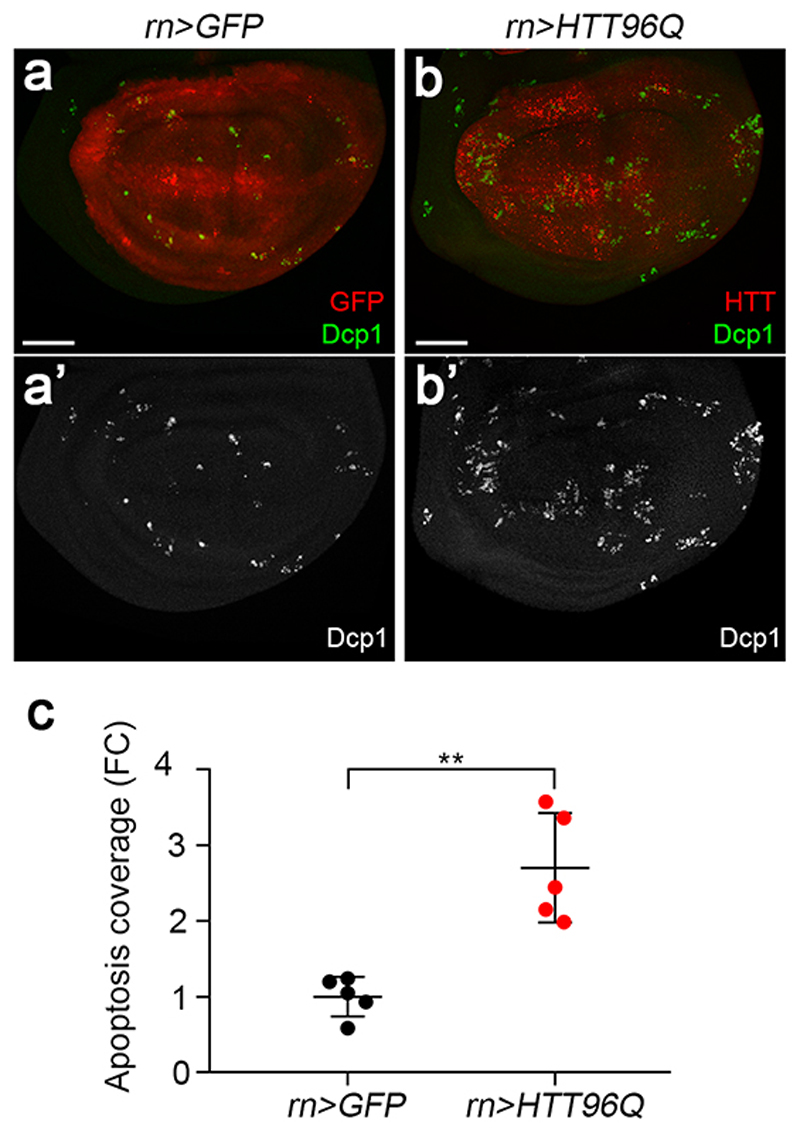
To further test the ability of RP-deficient cells to face proteotoxic stress, we assessed how they handle an aggregation-prone protein. Huntington disease is characterised by polyglutamine (polyQ) expansion in the Huntingtin protein (HTT), which, over a threshold length (>36Q), promotes the formation of oligomers and aggregates 32. Shorter glutamine stretches are not considered pathogenic but the behaviour of sub-pathological HTT25Q could provide an indication of a cell’s competence to mount a response to proteotoxic stress 33,34. As expected, the fluorescence of HTT25Q-Cerulean in otherwise wildtype tissue was largely homogeneous, with only a few small clusters (Fig. 2c). However, in the RPS23R67K/+ background, this protein accumulated in large punctae (Fig. 2d, quantified in 2e). These observations suggest that RP-deficient cells are less able than their wild type counterparts in preventing the accumulation of aggregate-prone species such as truncated OPP-peptides or polyQ repeats. Expression of HTT96Q in an otherwise wild type background leads to excess apoptosis (Extended data Fig. 5), indicating that even wild type cells cannot overcome a large number of repeats. We conclude that proteotoxic stress suffices to trigger apoptosis and that RP-deficient cells are more readily overwhelmed by such stress than wild type cells.
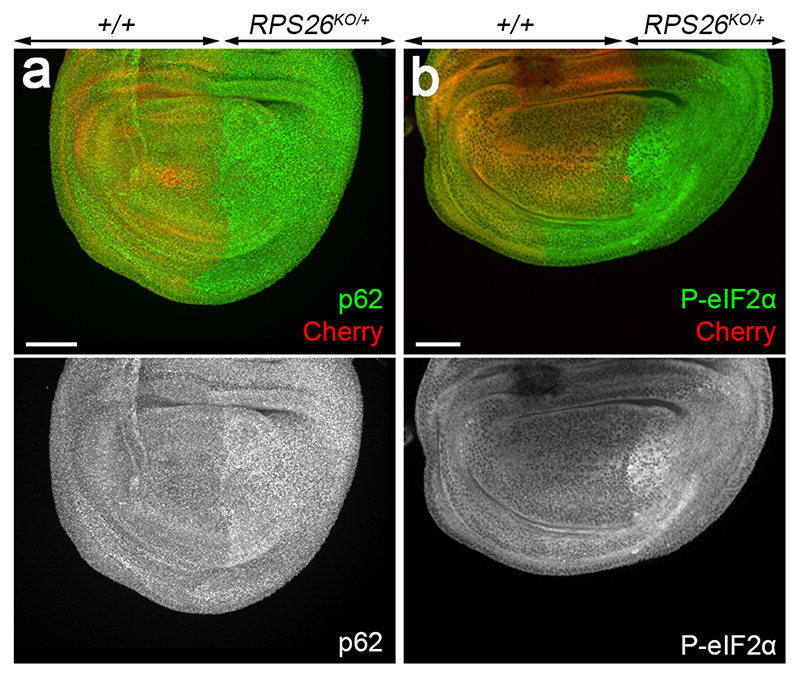
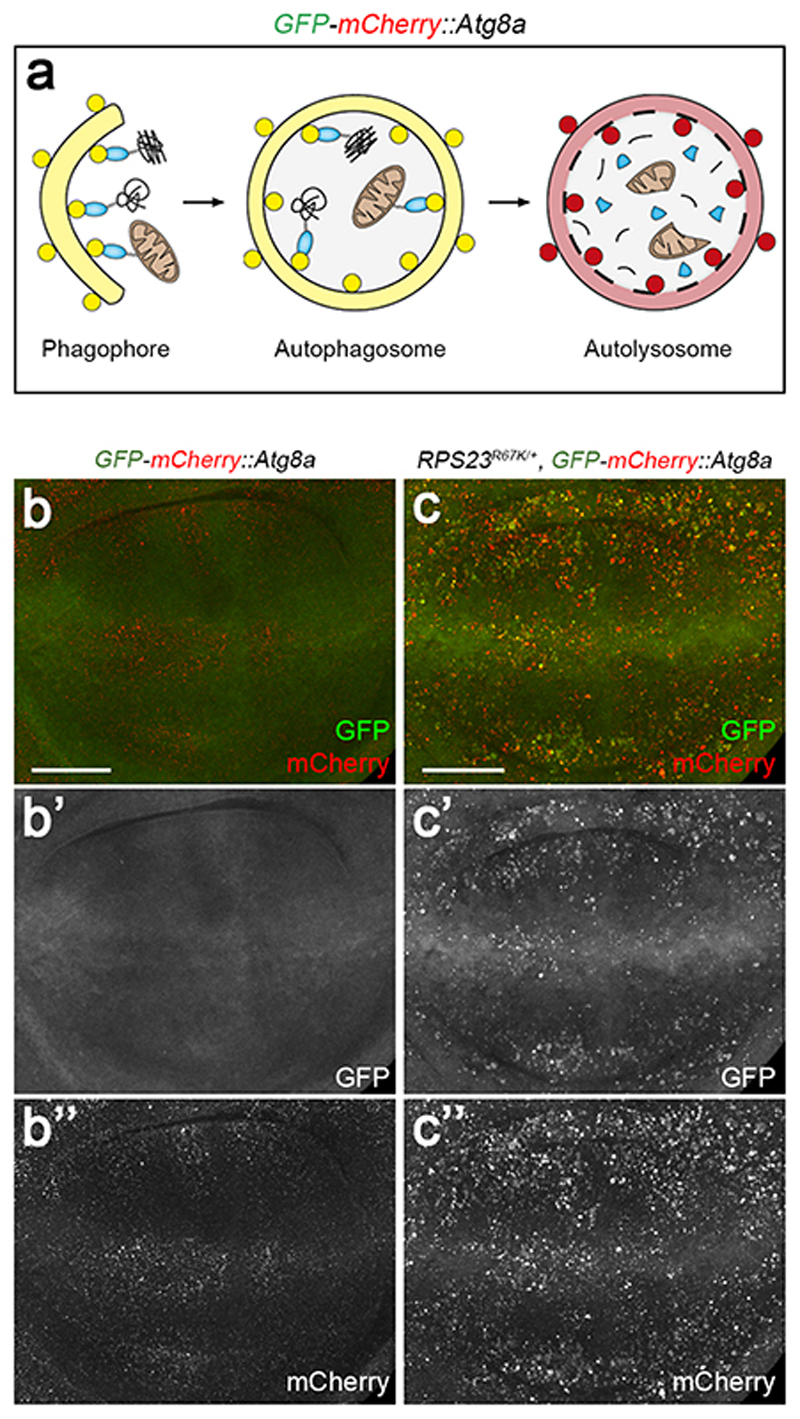
Hallmarks of proteotoxic stress include increased ubiquitination, which targets proteins for degradation, stimulation of autophagy, and enlargement of lysosomes. Ubiquitination, assayed with an antibody, was higher in RPS23R67K/+ than in control tissue (Fig. 2f, g). The p62 protein, AKA SQSTM1 or Sequestosome-1, a ubiquitin-binding adaptor that functions both as a receptor and cargo for selective autophagy 35, also accumulated specifically in RPS23R67K /+ (Fig. 2h, i) as well as in RPS26KO /+ cells (Extended data Fig. 6a). A similar accumulation could be seen in human cells (HEK293) engineered by CRISPR/Cas9 to carry this mutation (RPS23R67K/R67K) (Figure 2j, k, quantified in 2l). Correspondingly, the lysotracker-labelled acidic compartment, a proxy for lysosomes, was enlarged in the RPS23R67K/+ territory (Fig. 2m), suggesting a high load on autophagy. To further assess autophagy, we took advantage of a dual-colour GFP-mCherry-Atg8a reporter 36, which marks autophagosomes and autolysosomes by virtue of the differential sensitivity of GFP and mCherry to acidification (Extended data Fig. 7a). Both markers were increased in RPS23 R67K/+ imaginal discs, suggesting altered progression through the autophagic pathway (Extended data Fig.7 b, c). This observation, combined with the accumulation of p62-positive punctae (Fig. 2 h, i), indicates that, upon RP deficiency, ubiquitinated substrates exceeds the cell’s degradative capacity, a situation likely to cause proteotoxic stress. Proteotoxic stress, and the ensuing integrated stress response (ISR), is manifest by phosphorylation of the eukaryotic initiator factor 2 alpha (eIF2α). To ask if the ISR is activated in RP-deficient cells, we stained imaginal discs with an antibody against phosphorylated eIF2α (P-eIF2α). The signal was distinctly higher in RPS23R67K/+ and RPS26KO/+ tissues than in the control half of the discs (Fig. 2n; Extended data Fig. 6b). We conclude therefore that RP-deficient cells experience proteotoxic stress and activate the ISR as a result.
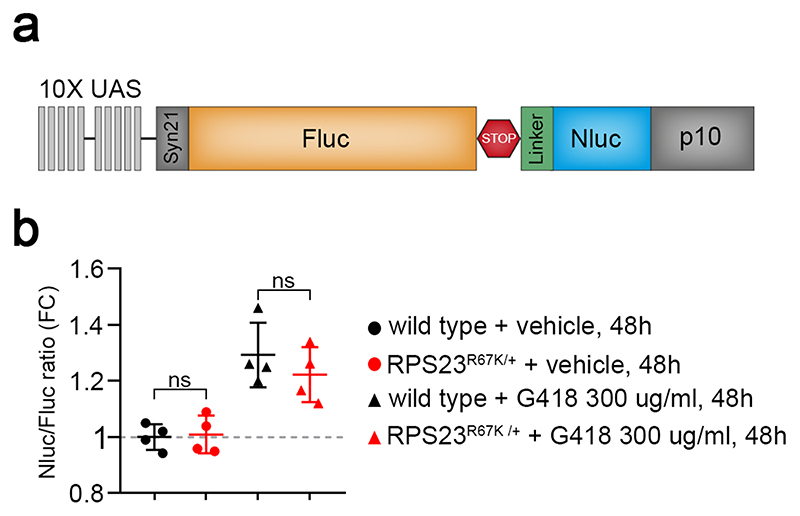
Proteotoxic stress arises from the accumulation of misfolded proteins and/or the formation of protein aggregates. What could be the origin of such proteins in RP-deficient tissues? One can imagine that, in the absence of one functional protein component, dysfunctional ribosomes form. These could be less conducive to co-translational folding and thus generate an inordinate amount of unfolded proteins 37. Alternatively, abnormal stoichiometry of ribosomal proteins could affect the translation of a subset of mRNAs and thus upset the relative amounts of different proteins 38, with excess proteins requiring additional degradation capacity. Yet another possibility is that partially functional ribosomes could be prone to making mistakes and hence produce misfolded proteins. Translational fidelity has indeed been reported to be reduced in cultured RPS23R67K/+ fibroblasts 9. To determine whether this is also the case in RPS23R67K/+ animals, we generated transgenic flies expressing a stop codon readthrough reporter inspired by the design of Grentzmann and colleagues 39. This comprised DNA encoding Firefly luciferase (Fluc) and Nanoluciferase (Nluc) separated by a tetranucleotide termination signal (UGAC) 40 and a flexible linker (Extended data Fig. 8a). Thus, Nluc luminescence is only expected if an amino acid is wrongly incorporated at the stop codon and the Nluc to Fluc ratio therefore provides an estimate of the rate of ribosomal mistakes. This reporter was validated in animals fed for 48h with G418, which causes stop codon readthrough 40. Nevertheless, no difference in translational fidelity could be detected between wild type and RPS23R67K/+ animals (Extended data Fig. 8b). We therefore considered the possibility, suggested by recent work in yeast, that imbalanced production of RPs leads to rapid aggregation of orphan RPs and acute loss of proteostasis 41,42.
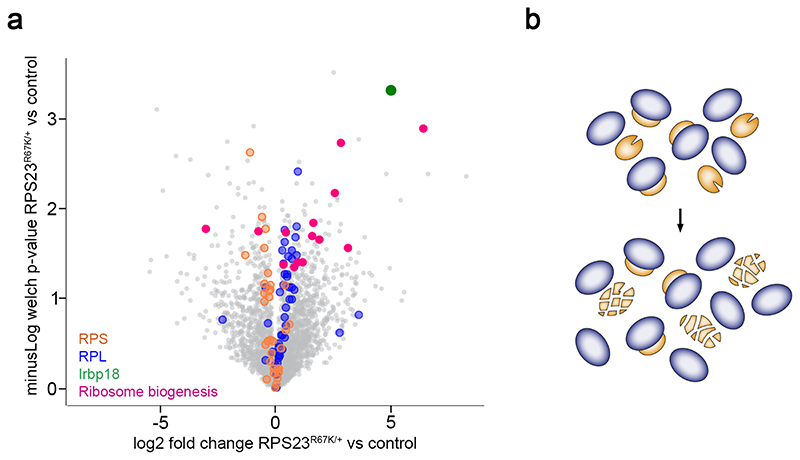
Ribosomal proteins comprise a large proportion of cellular proteins; in humans, they represent about 6% of the proteome by mass 43–46. In the absence of a single RP species, unassembled ribosomal proteins have a tendency to aggregate 47 and need to be disposed of since they could lead to proteotoxic stress 41,42,48. To explore the possible contribution of orphan RPs to proteotoxic stress in RP-deficient tissues, we compared the proteome of RPS23R67K/+ and wild type imaginal discs using label free mass spectrometry. In accordance with its role in stress response, IRBP18, the molecular partner of Xrp1 49, was found to be upregulated in mutant discs (green dot in Fig. 3a; see all proteins highlighted in Supplementary Table 2, in supplementary information). Moreover, there was a general increase in the abundance of proteins involved in ribosome biogenesis (red dots), suggesting that RP-deficient tissues attempt to compensate for the loss of functional ribosomes by boosting their production. Ribosomal proteins themselves showed a differential response depending on the subunit that they contribute to. Large subunit RPs (blue circles) were over-represented in RPS23[R67K] heterozygotes, perhaps as a consequence of increased ribosome biogenesis. In contrast, small subunit RPs (orange circles) were under-represented, suggesting that they are degraded at an increased rate, as expected for ribosomal proteins that cannot participate in a complete subunit for lack of one functional component (Fig. 3b). The need to degrade orphaned small subunit RPs could place an unusually large burden on the protein degradation machinery and trigger proteotoxic stress. Although other models cannot be excluded, with the evidence currently at hand, we favour the notion that proteotoxic stress in RP-deficient tissues arise from unassembled ribosomal proteins that overload the protein degradation systems.
Figure 3. Proteomic analysis of RP-deficient imaginal discs.
(a) Volcano plot displaying changes in the abundance of proteins in RPS23R67K/+ relative to wild type. The green dot highlights IRBP18, while red dots show all the proteins annotated as being involved in ribosome biogenesis (as determined from flybase.org and/or Uniprot) that are changed in a statistically significant manner. The plot also displays the changes in the abundance of ribosomal proteins in RPS23R67K/+ relative to wild type. On average, proteins of the small subunit (RPS, orange circles) are underrepresented while those of the large subunit (RPL, blue circles) are enriched in mutant discs. (b) Differential effect of RP deficiency on the abundance of small (orange) and large (blue) subunit proteins. Since only half the complement of functional RPS23 is produced in the RPS23R67K heterozygotes, a large number of small subunit proteins are orphaned and must be disposed of. By contrast, all the large subunit proteins produced by the cell can assemble in complete subunits. Coloured proteins highlighted in a are listed in Supplementary Table 2.
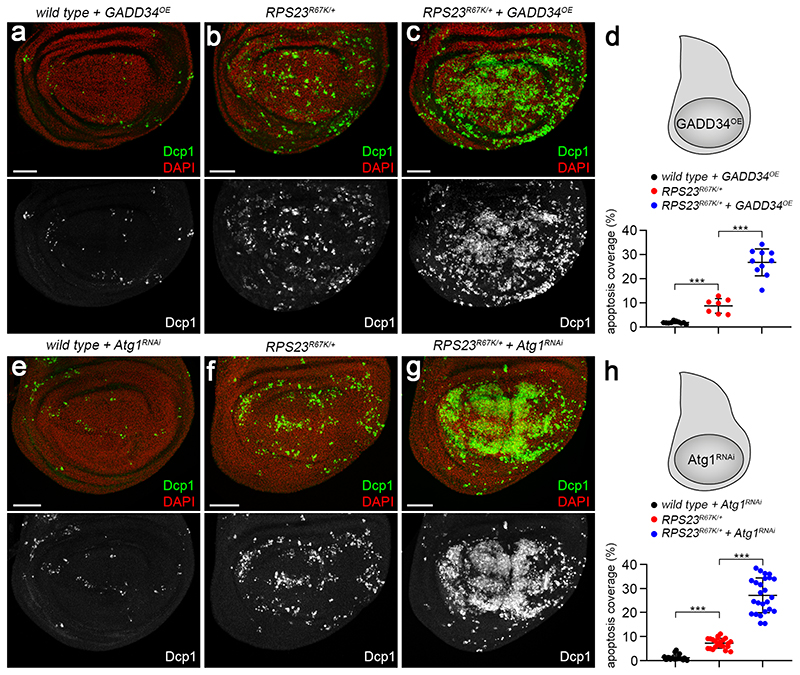
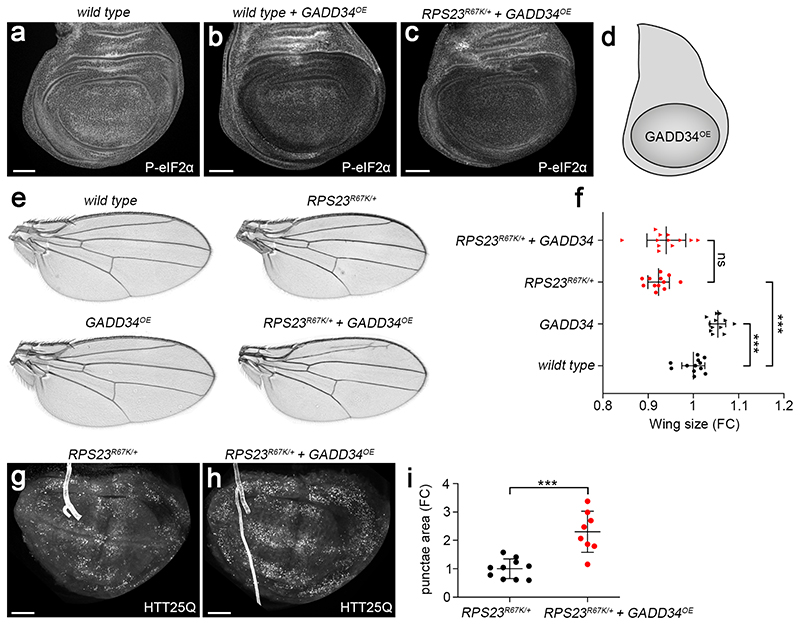
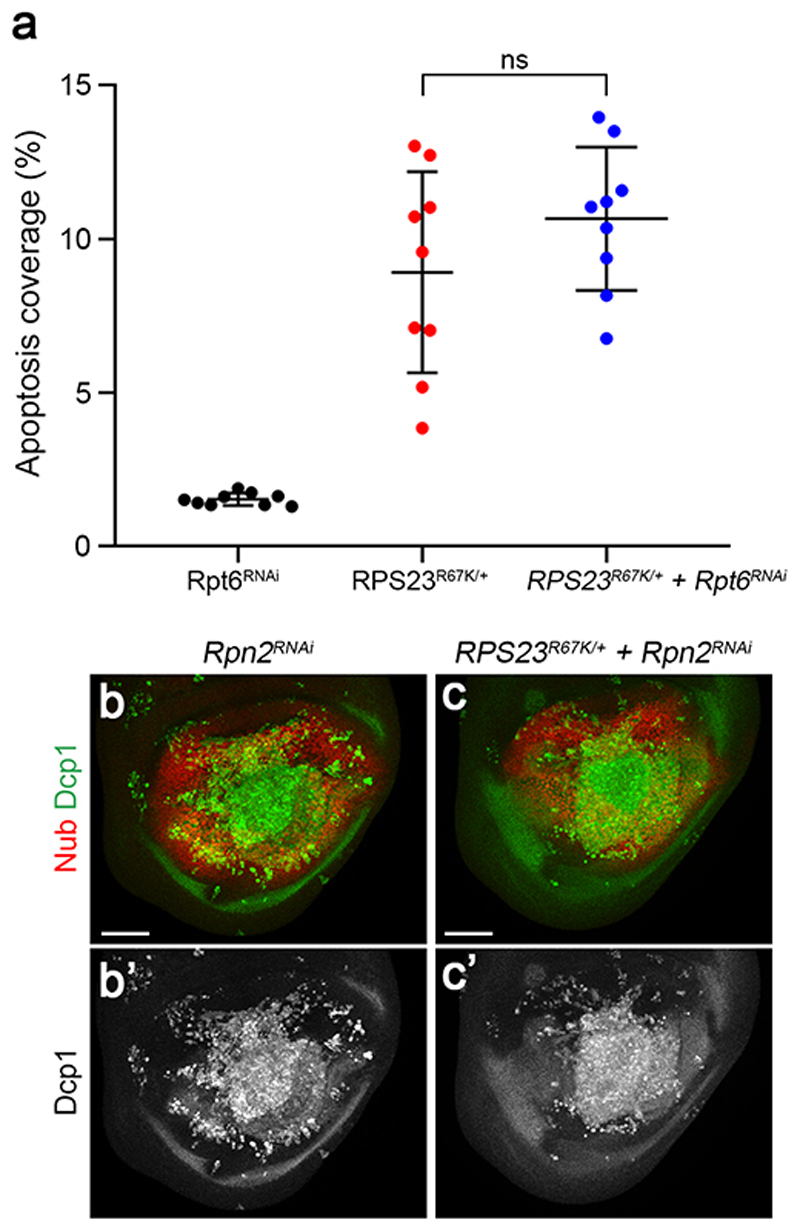
As shown above, RP-deficient cells respond to proteotoxic stress by stimulating the phosphorylation of eIF2α. We now address whether this response is maladaptive or cytoprotective. To reduce the P-eIF2α pool, we overexpressed the conserved GADD34 protein, a substrate-selective regulatory subunit of the catalytic protein phosphatase 1 (PP1) 50. As expected, GADD34 overexpression led to a drop in P eIF2α immunoreactivity in both wild type and RPS23R67K /+ imaginal discs (Extended data Fig. 9a-d). In otherwise wild type, but not RPS23R67K /+, animals, this was accompanied by a relatively minor but significant increase in tissue size (Extended data Fig. 9e-f). Crucially, GADD34 overexpression increased apoptosis by about three-fold in RPS23R67K/+ tissue despite having no or little impact on the rate of apoptosis in wild type discs (Fig. 4a-d). Moreover, GADD34 overexpression led to an increase in the number of HTT25Q punctae in RPS23R67K/+ discs (Extended data Fig. 9g-i). These observations suggest that the phosphorylated form of eIF2α contributes to limiting the proteotoxic stress caused by RP deficiency. We then addressed if autophagy is also part of a cytoprotective process. Expression of an RNAi transgene against Autophagy-related gene 1 (Atg1), which is required for autophagosome formation, had no detectable effect on the rate of apoptosis in otherwise wild type tissue (Fig. 4e, h). However, expression of the same Atg1RNAi transgene markedly enhanced the rate of apoptosis in RP-deficient cells (Fig. 4f-h). This implies that, conversely, stimulation of autophagy could dampen proteotoxic stress in RP-deficient cells. The contribution of the proteasome could not be unambiguously determined (Extended data Fig. 10a-c) for lack of suitable genetic tools. Likewise, the relative importance of mechanisms involving heat-shock proteins (HSPs), the unfolded protein response (UPR), and/or dampening of translation also remain to be assessed.
Figure 4. The ISR and autophagy limit tissue damage caused by RP-deficiency.
(a) Relatively low number of apoptotic figures (Dcp1, green) in imaginal discs that overexpress GADD34 throughout the wing pouch (with nubbin-GAL4). (b,c) The rate of apoptosis in heterozygous for RPS23R67K is markedly enhanced upon GADD34 overexpression. (d) Quantification of apoptosis coverage (as in Fig.1d) in the three genotypes illustrated in panels a-c. (e) Relatively low number of apoptotic figures (Dcp1, green) in imaginal discs expressing an Atg1RNAi transgene throughout the wing pouch (with rotund-GAL4). (f,g) The rate of apoptosis in heterozygous for RPS23R67K is markedly enhanced upon Atg1RNAi expression. (h) Quantification of apoptosis coverage in the three genotypes of panels e-g. Statistics: in panel d, from left to right, n = 10, 7 and 10 discs. In panel h, from left to right, n = 21, 22 and 25 discs. All error bars denote standard deviation. A two-tailed unpaired t-test was carried out. P-values, from left to right in d: ***P = 9.43E-07, ***P = 5.36E-07 and in h, ***P = 2.52E-13, ***P = 1.35E-13. Scale bars represent 50 μm. Genotypes for each figure panel are available in Supplementary Table 1. Source data is available for this figure.
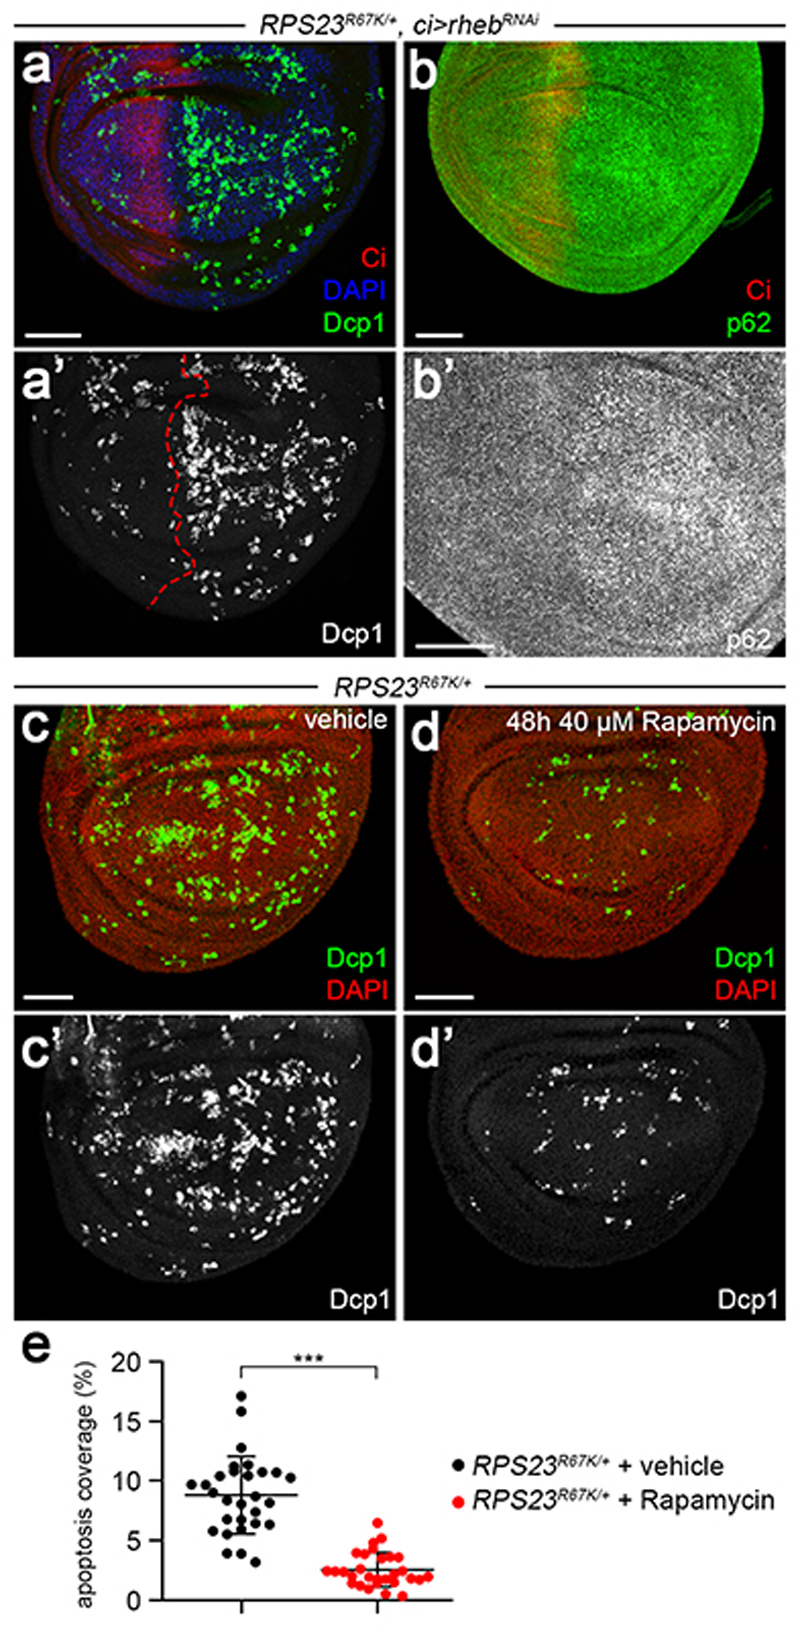
Having established that P-eIF2α and autophagy limits the toxic effects of RP deficiency, we sought to experimentally emulate their downstream effects, with the hope of opening therapeutic avenues. One signalling pathway, that mediated by TOR, stands out since it regulates many of the relevant processes, including autophagy, translation and ribosome biogenesis. To test if TOR inhibition could reduce proteotoxic stress and apoptosis in RP-deficient tissues, a RNAi transgene against Rheb was expressed in the anterior half of imaginal discs wholly heterozygous for RPS23R67K. This led to a marked decrease in the rate of apoptosis (Fig. 5a, compare Dcp1 immunoreactivity to that in the control RPS23R67K/+ half). Crucially, p62 immunoreactivity was also reduced in the ‘rescued’ compartment suggesting that improved cell survival resulted from a lessening of proteotoxic stress (Fig. 5b, b’). As an alternative means of inhibiting TOR, we introduced rapamycin in larval food. A 48h feeding period led to a 3-fold reduction in the rate of apoptosis in RPS23R67K/+ imaginal discs (Fig. 5c, d, quantified in 5e). Therefore, reduction of TOR activity through two independent means alleviates the proteotoxic effect of RP deficiency. By virtue of inhibiting TOR, rapamycin could have multiple beneficial effects. By stimulating autophagy, it is expected to boost the removal of toxic species. By downregulating translation, it is predicted to lessen the burden on the protein degradation machinery 51 while at the same time allowing more time for co-translational folding 52,53. And by dampening ribosome biogenesis, rapamycin would reduce the amount of orphaned ribosomal proteins. The relative importance of these processes remains to be assessed.
Figure 5. Inhibition of TOR signalling reduces the accumulation of aggregates and apoptosis in RP-deficient cells.
(a) Wholly heterozygous RPS23R67K/+ disc expressing RhebRNAi in the anterior compartment (with ci-GAL4). The preparation was stained with anti-Ci to mark the domain of expression and anti-Dcp1 for apoptotic figures (b) Imaginal discs of the same genotype stained with anti-p62, also shown at higher magnification in b’. (c, d). Discs from RPS23R67K/+ larvae fed for 48 h with vehicle or rapamycin. (e) Apoptotic coverage (%) in RPS23R67K/+ imaginal discs from larvae fed with vehicle (black dots) of rapamycin (red dots). n = 29 discs for each condition. Error bars denote standard deviation. For statistical analysis, a two-tailed unpaired t-test was carried out. ***P = 1.41E-11. Scale bars represent 50 μm. Genotypes for each figure panel are available in Supplementary Table 1. Source data is available for this figure.
Our work suggests that unresolved proteotoxic stress, not insufficient protein production, could drive the pathology of ribosomopathies. Independent evidence for proteotoxic stress in RP-deficient cells is described in the accompanying paper 54, with attention to its relevance to cell competition. We found that, upon RP deficiency, proteotoxic stress triggers eIF2a phosphorylation, which is known to slow down translation. Therefore, although the reduction in protein synthesis seen in RP-deficient tissues could be attributed to limited biosynthetic capacity, our findings suggest that it could equally follow from the response to proteotoxic stress. In any case, we have shown that P-eIF2α and autophagy are cytoprotective but insufficiently so. It is conceivable that cells cannot enhance this response further without triggering unacceptable side effects. We found that, to some extent, proteotoxic stress can be alleviated by TOR inhibition, an intervention that has been considered for proteinopathies, including Alzheimer’s, Parkinson’s, Amyotrophic lateral sclerosis, and Huntington’s 55. Although promising in our assays, rapamycin treatment should be seen as a proof of principle intervention since is unlikely to be appropriate for children or in tissues of high biosynthetic demand, where TOR activity is particularly important. Indeed, in fast growing Drosophila larvae, we have not been able to identify a rapamycin regimen that completely suppresses proteotoxic stress without impairing growth. There is a need therefore to specifically target the downstream activities of TOR that are most likely to alleviate proteotoxic stress, such as, for example, autophagy. In this respect it is of interest that a small-molecule inducer of autophagy enhanced erythropoiesis in models of Diamond-Blackfan anemia 56. This could be combined with additional means of reducing proteotoxic burden, e.g. with drugs that favour protein folding or stimulate the clearance of misfolded proteins 57,58.
Methods
Drosophila stocks
All the genotypes analysed in this study are listed in Supplementary Table 1, in supplementary information. The following stocks were obtained from the Bloomington Drosophila Stock Center (BDSC), the Vienna Drosophila Resource Center (VDRC) or are described in Flybase: ci-GAL4 (Flybase #FBti0076751), hh-GAL4 (Flybase #FBti0017278), rn GAL4 (BDSC #7405), tub-GAL4 (BDSC #5138), pdm2-GAL4 (BDSC #49828), nub-GAL4 (Flybase #FBti0150342), FRT42D (BDSC #1802), FRT42D ubi-GFP (BDSC #5626), TRE-GFP (BDSC #59010), UAS-GFP (BDSC #35786), UAS-FLP (BDSC #4540), UAS-P35 (Flybase #FBtp0001646), UAS-HTT25Q Cerulean (BDSC #58360), UAS-HTT96Q-Cerulean (BDSC #56772) UAS-GFP-mCherry-Atg8a (BDSC #37749), UAS-Rheb (BDSC #9688), UAS-GADD34 (BDSC #76250), UAS-Atg1RNAi (BDSC #44034), UAS-RhebRNA i (BDSC #33966), UAS-Xrp1RNAi (BDSC #34521), UAS Rpn2RNAi (VDRC #106457), UAS-Rpt6RNA (VDRC #49244), RPL52d2 (BDSC #25907), RPL141 (BDSC #2247), RPS131 (BDSC #2246), Dp(2:3)Cam14T (BDSC #4519).
Genomic engineering of flies and HEK293 cells
The RPS23[R67K] allele was generated by CRISPR/Cas9-mediated homologous directed repair. Suitable 5’ and 3’ homology arms, as well as the fragment carrying the R67K substitution, were cloned into the pTV attP-Pax-Cherry targeting vector 59 and gRNAs were cloned into the pCFD4 vector (Addgene #49411). The resulting plasmids were co-injected in a nos-Cas9 strain 60. Transgenic candidates were screened by Pax-Cherry expression and subsequently confirmed by PCR and sequencing.
The RPS26[cKO] (conditional KO) allele was generated in two steps. First, a RPS26 knockout strain (RPS26attP-KO/+) was generated by replacing the second RPS26 exon by an attP docking site. Suitable 5’ and 3’ homology arms were cloned into pTV-attP-Pax-Cherry and gRNAs into pCFD4. Positive RPS26attP KO heterozygous candidates were screened by the expression of Pax Cherry and validated by PCR. As expected, RPS26attP-KO/+ flies displayed the so-called Minute bristle phenotype. The loxP sites flanking the Pax-cherry cassette were used to remove it by subsequent expression of Cre in the germline. In a second step, the attP was used to reinsert an FRT-flanked fragment comprising the region of RPS26 deleted in the first step along with a tubulin-Cherry fragment. This was achieved by cloning the RPS26 region and tubulin Cherry between the two FRT sites of the pRIV-Pax-Cherry vector, which allowed ΦC31 mediated integration into the attP site of RPS26[attP-KO] 61. In the resulting strain, RPS26 could be inactivated in a spatially restricted domain (marked by the loss of Cherry expression) with FLP recombinase.
A stop codon readthrough reporter was generated by cloning Firefly luciferase (Fluc) and Nanoluciferase (Nluc) into a pUAS-attP vector (pJFRC81, Addgene #36432). The Fluc coding sequence was amplified from pSGDlucV3.0 (Addgene #119760) and Nluc from pUAS-NanoLuc (Addgene #87696). The stop codon of Fluc was replaced by UGAC and DNA encoding a flexible linker (3XGGGGS). The resulting plasmid, pUAS Fluc-stop-Nluc, was introduced in the germline by site-specific integration at the attP2 docking site on the third chromosome.
The RPS23R67K/R67K HEK293 cell line was generated using CRISPR/Cas9-mediated homologous directed repair. The sgRNA targeting RPS23 was cloned into the pSpCas9(BB)-2A-Puro vector (PX459, Addgene #48139) and co-transfected with ssODNs containing the R67K mutation and a silent mutation which generated an EcoR1 site. After puromycin selection, candidate clones were screened by PCR and EcoR1 digestion. Positive clones were confirmed by Sanger sequencing. The PX459 vector was a gift from Feng Zhang 62.
Generation of clones by heat-shock and FLP/FRT-mediated mitotic recombination
The FLP/FRT technique was used to generate mitotic recombination clones 63. Flies were allowed to lay eggs for 4 h and staged larvae (at the L2-L3 transition) were heat-shocked at 37 °C for 1h. Animals were dissected 72 hours after clone induction and processed for immunostaining.
Generation of RP-heterozygous mutant wing disc compartments
For the generation of imaginal discs with one half RPS23R67K/+ and the other half genetically wild type we first introduced an FRT site proximal to the RPS23[R67K] chromosome. The resulting chromosome was then put in trans over a chromosome bearing the same FRT site at the homologous position. Expression of FLP recombinase under the control of the hedgehog promoter (hh GAL4, UAS-FLP) was used to induce mitotic recombination throughout the posterior compartment, leading to the generation of two genetically distinct cell populations: RPS23R67K/R67K, which are not viable, and RPS23+/+, which populated the whole compartment. In the resulting imaginal discs, the anterior compartment remained RPS23R67K/+.
For the generation of imaginal discs with one half RPS26KO/ + and the other half genetically wild type we took advantage of the fact that the RPS26[cKO] allele is conditional. A FLP transgene was expressed in the posterior half to excise the second exon, along with the tubulin-Cherry cassette, from RPS26[cKO] while leaving the wildtype homologous chromosome unchanged. This genetic manipulation thus generated a heterozygous posterior compartment (RPS26KO/+) marked by the loss of Cherry fluorescence and a control (wild type) anterior compartment.
Developmental timing
Developmental timing was determined in both wild type and RPS23R67K/+ animals with four replicates each. Adult flies were allowed to lay eggs for a period of 4 h. Freshly hatched first instar larvae (L1) were collected and transferred to vials and new pupae were scored every 4 h. The datasets of all replicates were pooled, and the corresponding mean and SD were calculated for each timepoint in Microsoft Excel. Results were represented in a cumulative percentage distribution plot using GraphPad Prism 8.
Translational fidelity assay and quantification
Expression of UAS-Fluc-stop-Nluc was driven ubiquitously with the tubulin-GAL4 driver. Fluc and Nluc luminescence was assayed with the Nano-Glo Dual-Luciferase Reporter Assay System (NanoDLR, Promega #N1610). Positive controls and experimental animals were processed and assayed in parallel. Larvae were collected, washed in PBS and three larvae per tube were homogenised with a pestle in 500 μl of 1X Passive Lysis Buffer (PLB, Promega #E1941). The tubes were then placed in an orbital nutator for 10 min at 4 °C to complete lysis. Tubes were spun at max speed in a benchtop centrifuge for 3 min and the top fatty layer was discarded. For the Fluc reaction, 80 μl of lysate were transferred into a new tube and mixed with 80 μl of ONE-Glo EX reaction mix. Fluc relative luminescence units (RLU) were measured immediately with the GloMax 20/20 single tube luminometer (Promega #E5311). To assay for Nluc luminescence, 80 μl of the NanoDLR Stop & Glo reaction mix were added and tubes kept in the dark for 10 min to fully quench Fluc activity. Nluc luminescence was then measured with the GloMax 20/20 luminometer. The ratio of Nluc/Fluc RLU served as an estimate of stop codon readthrough. Ratios were normalised to the average of that in wild type control larvae to represent the fold-change (FC). To validate the reporter, early third instar larvae (eL3) were transferred to 50 mm Petri dishes containing 10 ml of food supplemented with 300 μg/ml of G418 (Sigma #G8168). Larvae were allowed to feed during 48 h before being processed for luciferase activity as described above.
Rapamycin treatment
Recently hatched L1 larvae were grown into 50 mm petri dishes with normal food. When larvae reached the early L3 stage, they were transferred into new dishes containing 10 ml of food supplemented with 40 μM of Rapamycin (Sigma #37094) or vehicle and allowed to feed during 48 h before being processed for immunostaining.
Mammalian cell culture
Wild type and RPS23R67K/R67K HEK293 cells were cultured in complete Dulbecco’s modified Eagle’s medium (DMEM, ThermoFisher #31966021) supplemented with 10% (v/v) Fetal Bovine Serum (FBS, ThermoFisher #A3160402) and 1% (v/v) Pen/Strep (ThermoFisher #15140122) at 37 °C in a humidified chamber with an atmosphere of 5% CO2.
Antibodies and dyes
The following primary antibodies were used: rat anti-Ci (1:50, DSHB #2A1), mouse anti-Nub (1:50, DSHB #2D4), mouse anti-Wg (1:500, DSHB #4D4), rabbit anti-Dcp1 (1:500, CST #9578), rabbit anti-P-eIF2α (1:100, clone D9G8, CST #3398), mouse anti-Ubiquitin (1:10000, clone FK2, Merck #04-263), rabbit anti-Drosophila p62 [1:2000, kind gift from Tor Erik Rusten 64], mouse anti-human p62 (1:300, clone 2C11, Novus Biologicals H00008878-M01). Alexa Fluor and Alexa Fluor Plus secondary antibodies raised in goat were obtained from ThermoFisher and used at 1:1000 dilution (#A32731, #A32732, #A32723, #A32727, #A-21247). DAPI was used at final concentration of 0.1 μg/ml (Sigma #D9542).
Immunostaining protocol
Larvae were inverted in ice-cold PBS, fixed in 4% methanol-free formaldehyde (Pierce, ThermoFisher #28906) for 30 minutes and then rinsed in PBS. Inverted larvae were permeabilised in PBS + 0.1% Triton X-100 (PBT× 0.1%) for 30 minutes and blocked for 1 hour in 0.1% PBT× with 2% Normal Goat Serum (ThermoFisher #01-6201) before incubation in a solution of primary antibodies diluted in PBT× 0.1% (without blocking agents or carrier proteins) overnight at 4 °C with gentle rotation. After primary antibody incubation, samples were rinsed 3 × 15 min in PBT× 0.1%. Secondary antibodies and DAPI were diluted together in PBT× 0.1% and incubated with samples at room temperature for 1.5 h in an orbital nutator. After secondary incubation, samples were rinsed 3 × 15 min in PBT× 0.1% followed by a final rinse in PBS. Wing discs were then dissected out of the inverted larvae and mounted in glycerol-PBS mounting medium [40 ml glycerol + 5 ml 10X PBS + 450 μl N-propyl-gallate (50% m/v in ethanol)].
Lysotracker staining
Larvae were inverted in pre-warmed PBS at 25 °C and transferred into a 1.5 ml tube containing pre-warmed PBS. The buffer was then replaced with 1 μM Lysotracker Red DND-99 (ThermoFisher, #L7528) in PBS and the tubes were placed in an orbital nutator for 10 min at room temperature. The larvae were then rinsed 3 × 1 min in PBS to remove residual dye and fixed in 4% methanol-free formaldehyde. After fixation, larvae were rinsed in PBS and discs mounted in mounting medium.
Puromycin incorporation assay
Puromycin incorporation was assayed using the Click-iT Plus OPP Alexa Fluor Protein Synthesis Assay Kits (ThermoFisher #C10456 and #C10457) according to manufacturer instructions with minor modifications, as outlined below. Larvae were inverted in pre-warmed Schneider’s Drosophila Medium at 25 °C (Gibco, ThermoFisher #21720024) and transferred into a 1.5 ml tube with pre-warmed Schneider’s medium. The medium was then replaced with either 1 μM O-propargyl-puromycin (OPP) in Schneider’s medium for 15 min or 20 μM for 30 min with gentle rotation at room temperature. After OPP incorporation, inverted larvae were rinsed in PBS, fixed in 4 % methanol-free formaldehyde and rinsed again in PBS before a permeabilization and blocking step. The Click-iT reaction mix was prepared as per manufacturer instructions and larvae were incubated for 30 min in the dark at room temperature. Samples were finally rinsed in Reaction Rinse Buffer and stained with DAPI. Discs were dissected out and mounted in mounting medium.
Image acquisition and processing
Samples were imaged using a Leica TCS SP5 confocal microscopy and confocal stacks (1 μm step-size) were processed and analysed with FIJI (ImageJ, N.I.H). Images were assembled into figures with Adobe Photoshop CC 2018, 19.0 release. Cartoons were drawn with Adobe Illustrator CC 2018, 22.0.1 release.
Quantification of apoptosis in imaginal discs
Apoptosis was quantified in the wing pouch, marked with anti-Nub staining or recognised by the folds that surround this part of the disc. Confocal planes covering all apoptotic cells (Dcp1 positive) along the apico-basal axis of wing discs (excluding the peripodial membrane) were max-projected with FIJI. The pouch was outlined manually, and its area calculated. To segment the apoptotic cells, a threshold excluding background was applied to generate a binary mask. The resulting regions of interest (ROIs) were used to determine the area covered by apoptotic cells. Apoptosis coverage was calculated as the percentage (%) of the total wing pouch area occupied by apoptotic cells. Graphical representation of all datapoints was made in scatter plots using GraphPad Prism 8. For statistical analysis, a two-tailed unpaired t-test was carried out in Microsoft Excel. ***P<0.001
Quantification of HTT aggregates in imaginal discs
The formation of HTT25Q aggregates was quantified in the wing pouch, marked by the fluorescence of HTT25Q-Cerulean, which was expressed under the control of the pouch-specific driver pdm2-GAL4. Confocal planes covering all fluorescent signal along the apico-basal axis of wing discs were max-projected with FIJI. The pouch was outlined, and its area measured. To segment HTT25Q aggregates, a threshold excluding background was applied to generate a binary mask and the area covered by aggregates was calculated as the ratio of aggregates area/wing pouch area. The ratios were normalised to the wild type control and represented as the fold-change (FC). All data points were represented in scatter plots using GraphPad Prism 8. For statistical analysis, a two-tailed unpaired t-test was carried out in Microsoft Excel. ***P<0.001
Quantification of p62 bodies in HEK293 cells
The presence of p62 bodies was quantified in wild type and in RPS23R67K/R67K HEK293 cells with anti-p62 staining. Control and experimental cells were fixed and immunostained in parallel, and images were acquired under identical confocal settings. To segment p62 punctae, confocal planes covering all fluorescent signal along the apico-basal axis were max-projected. The background was then subtracted using a 10-pixel radius rolling ball and identical thresholds were subsequently applied to each image to cover p62 bodies. Images were then converted into binary masks, the segmented particles selected as ROIs and the total area covered by p62 bodies measured. For each image, the ratio of p62 bodies area/number of nuclei was calculated and normalised to the average of the wild type control. The p62 coverage was represented as the fold change (FC) in scatter plots using GraphPad Prism 8. For statistical analysis, a two-tailed unpaired t-test was carried out in Microsoft Excel. **P<0.01
Quantification of ubiquitin and p62 punctae in wing imaginal discs
The accumulation of ubiquitin and p62 was quantified in imaginal discs composed of one half heterozygous for the RPS23[R67K] allele and the other half genetically wild type (hence serving as an internal control). To segment ubiquitin and p62 punctae in wing discs (Fig. 2f-i), confocal planes covering all fluorescent signal along the apico-basal axis were max-projected and the same threshold was subsequently applied to all images. Images were then converted into binary masks, the segmented particles selected as ROIs, and the area covered by Ubiquitin or p62 was calculated relative to the area of the mutant or wild type compartment. The Ubiquitin and p62 data were represented in scatter plots as the fold-change (FC) in the mutant compartment versus the wild type compartment. For statistical analysis, a two-tailed unpaired t-test was carried out in Microsoft Excel. **P<0.01 and ***P<0.001
Proteomic analysis
50 imaginal discs were dissected and lysed in 40μl of extraction buffer containing 1% Triton, 50 mM Tris-HCl pH 7.5, 150 mM NaCl, 2X Halt protease/phosphatase inhibitors (ThermoFisher #78441), 5mM EDTA, 1 mM DTT. Proteins were reduced and alkylated using DTT and Iodoacetamide. The sample volumes were then adjusted to 100μl using LC-MS grade water and subjected to acetone precipitation to remove detergents. Air dried acetone precipitated pellets were resuspended 25μl in 100 mM HEPES, 1M GuaHCl, pH8 in an ultrasonic bath. Endoprotease lysC was added in a 1:50 (enzyme: protein) and incubated at 37 degrees for 3h. The sample was then diluted 2-fold with MilliQ water and trypsin was added in a 1:50 (enzyme: protein) and incubated overnight at 37 degrees. The digests were acidified using TFA and prepared for mass spectrometry analysis using an EvosepOne liquid chromatography system coupled to an Orbitrap Fusion Lumos Mass Spectrometer run in Data Dependent Acquisition mode. Raw data was then processed using MaxQuant v1.6.12.0 specifying iBAQ quantification with further downstream statistical analysis in Perseus 1.4.0.2.
Extended Data
Extended data figure 1. Phenotypes of Minute heterozygotes.
(a, b) Scutellar region of control and RPS23R67K/+ flies showing the short-bristle phenotype that characterises Minute heterozygotes. (c) Cumulative distribution of pupariation time for control (n = 143 larvae) and RPS23R67K/+ (n = 134 larvae). Error bars represent standard deviation (d) Control mosaic imaginal disc harbouring wildtype clones (2X GFP) and their wild type twin clones (absence of GFP), induced by heat shock-mediated expression of FLP (hs-FLP). Note the low number of Dcp1-positive cells (red and grey). (e) Mosaic imaginal discs harbouring wild type clones (2X GFP) in a RPS23R67K/+ background (1X GFP), also induced with hs-FLP. Here the twin clones (RPS23R67K/R67K) are rapidly eliminated and the wild type cells outcompete the RPS23R67K/+ cells, which undergo a high rate of apoptosis (Dcp1, red and grey). (f, g) JNK signalling (indicated by expression of the TRE-GFP reporter and apoptosis (Dcp1) in RPS23R67K/+ are fully supressed by a wild type copy of RPS23 from a genomic duplication (g). (h-j) JNK signalling and apoptosis in a panel of heterozygous Minute mutants (RPL5, RPL14, and RPS13). Scale bars represent 50 μm. Genotypes for each figure panel are available in Supplementary Table 1. Source data is available for this figure.
Extended data figure 2. Xrp1 is required for activation of apoptosis in RPS23R67K/+.
(a) Imaginal disc of a RPS23R67K/+ larva expressing an RNAi transgene against Xrp1 in the anterior compartment (marked with anti-Ci). The number of Dcp1-positive cells is lower in the anterior than in the posterior compartment where Xrp1 activity is unaffected. Scale bars represent 50 μm. Genotypes for each figure panel are available in Supplementary Table 1. Experiments were repeated independently three times with similar results.
Extended data figure 3. Manipulation of Rheb activity affects OPP incorporation in wild type and RPS23R67K/+ imaginal discs.
(a-d) Wing imaginal discs (wild type and RPS23R67K/+, as indicated) overexpressing Rheb or RhebRNAi in the anterior compartment (left hand side of the disc). The discs were explanted and incubated for a 15 min in 1 μM OPP before staining for puromycilated peptides (grey scale). Rheb overexpression stimulated OPP incorporation in both genotypes, while RhebRNAi had the opposite effect. Scale bars represent 50 μm. Genotypes for each figure panel are available in Supplementary Table 1. Experiments were repeated independently three times with similar results.
Extended data figure 4. RPS23R67K/+ imaginal discs develop tumours upon inhibition of apoptosis.
(a-b) Wing disc from a RPS23R67K/+ larva expressing P35, a baculovirus-derived inhibitor of effector caspases in the pouch (under the control of rotund-GAL4). Note the overgrowth characterised by epithelial folds and ectopic Wingless expression (green), shown in grey scale at higher magnification in b. Formation of these tumours shows that RP-deficient cells are not inherently incapable of growth. Tumour formation may be relevant to the increase cancer risk associated with human ribosomopathies as well as to the observation that ribosomal protein genes are frequently deleted in human cancers, often in concert with the loss of TP533. Scale bars represent 50 μm. Genotypes for each figure panel are available in Supplementary Table 1. Experiments were repeated independently three times with similar results.
Extended data figure 5. A toxic form of Huntingtin (HTT96Q) triggers apoptosis.
(a,b) Expression of HTT96Q throughout the pouch (with rotund-gal4) triggers an increased rate of apoptosis relative to that seen with GFP expression, which is expected to be innocuous. (c) Quantification of Dcp1 coverage in the two genotypes shown in panels a and b (n = 5 discs per genotype). Error bars denote standard deviation. For statistical analysis, a two-tailed unpaired t-test was carried out. **P = 4.11E-03. Scale bars represent 50 μm. Genotypes for each figure panel are available in Supplementary Table 1. Source data is available for this figure.
Extended data figure 6. Accumulation of p62 and P-eIF2α in RPS26KO/+.
(a, b) RPS26cKO was inactivated (and tubulin Cherry deleted) by crossing to hedgehog-GAL4, UAS-FLP. In the resulting RPS26KO/+ posterior compartment, immunoreactivity against p62 and P-eIF2α was higher than in the control anterior compartment. Scale bars represent 50 μm. Genotypes for each figure panel are available in Supplementary Table 1. Experiments were repeated independently three times with similar results.
Extended data figure 7. RP deficiency alters the activity of an autophagy reporter.
(a) Cartoon showing progression through autophagy as monitored by the GFP-mCherry-Atg8a reporter. Yellow indicates the simultaneous presence of GFP and Cherry in the phagophore and autophagosome. Autolysosomes only retain the red colour because of the drop in pH, which quenches GFP fluorescence. (b, c) Fluorescence from GFP-mCherry-Atg8a, expressed with tubulin-GAL4 in wild type or RPS23R67K/+. Single fluorescence channels are also shown in grey. Scale bars represent 50 μm. Genotypes for each figure panel are available in Supplementary Table 1. Experiments were repeated independently three times with similar results.
Extended data figure 8. Translation fidelity is unaffected in RPS23R67K/+.
(a) The stop codon readthrough reporter comprises 10X Upstream Activator Sequences (UAS), which confers GAL4 responsiveness, the 5’ UTR from Syn21, the coding region of Firefly luciferase (Fluc), a STOP codon (UGAC), a flexible linker, the coding region of Nanoluciferase (Nluc), and the 3’UTR from p10. (b) Quantification of the Nluc/Fluc ratio, measured from whole larvae lysates and normalised to that in control larvae. Statistical analysis: 4 replicates for each condition. Error bars denote standard deviation. A two-tailed unpaired t-test was carried out. P>0.05, no significant increase was seen in RPS23R67K/+ larvae. Genotypes for each figure panel are available in Supplementary Table 1. Source data is available for this figure.
Extended data figure 9. Validating the effect of GADD34 overexpression.
(a) P-eIF2α immunoreactivity in a wild type imaginal disc. (b) This is reduced by GADD34 overexpression (GADD34OE) driven by nubbin-GAL4. (c) P-eIF2α immunoreactivity is similarly decreased in RPS23R67K/+ larvae overexpressing GADD34. (d) Schematic representation of the domain where GADD34 was overexpressed. (e,f) GADD34 overexpression causes a mild but significant increase in wing size in otherwise wild type flies but not in RPS23R67K heterozygotes. Note that the wing of RPS23R67K heterozygotes is smaller than that of wildtype. (g-i) GADD34 overexpression exacerbates the formation of HTT25Q punctae in RPS23R67K heterozygotes. Statistics: error bars denote standard deviation. In f, n = 12 adult wings for each genotype. In i, from left to right, n = 10 and 8 discs. A two-tailed unpaired t-test was carried out. P-values in f, from top to bottom: 2.48E-01, 1.31E-07 and 7.09E-06. P-value in i, 9.65E-04. Scale bars represent 50 μm. Genotypes for each figure panel are available in Supplementary Table 1. Source data is available for this figure.
Extended data figure 10. Effect of proteasome inhibition on the rate of apoptosis in RP-deficient tissues.
(a) Extent of apoptosis (coverage of Dcp1 immuno-reactivity) in the pouch of discs of genotypes indicated. Rpt6 RNAi denotes rotund-gal4-driven expression of a Rpt6RNAi transgene.. This particular Rpt6RNAi transgene had only a minor effect on apoptosis in wildtype tissue. Expression of this RNAi transgene did not enhance the rate of apoptosis in RPS23R67K heterozygotes. (b) The effect of stronger proteasome knockdown (with Rpn2RNAi) on the rate of apoptosis in RP-deficient tissue could not be assessed because it triggered extensive apoptosis in otherwise wild type imaginal discs. Statistics: error bars denote standard deviation. n = 9 discs for each genotype. A two-tailed unpaired t-test was carried out. P>0.05, no significant difference was seen. Genotypes for each figure panel are available in Supplementary Table 1. Source data is available for this figure.
Supplementary Material
Acknowledgements
This work was supported by a Wellcome Trust Investigator award (206341/Z/17/Z to JPV) and the Francis Crick Institute which receives its core funding from Cancer Research UK (FC001204), the UK Medical Research Council (FC001204), and the Wellcome Trust (FC001204). We thank Tor Erik Rusten (University of Oslo) for the generous gift of anti-p62 antibodies and Feng Zhang (Broad Institute of MIT and Harvard) for the PX459 vector. We also acknowledge the Developmental Studies Hybridoma Bank, created by the NICHD of the NIH and maintained at the University of Iowa for the provision of antibodies. Drosophila stocks obtained from the Bloomington Drosophila Stock Center (NIH P40OD018537) were used in this study. We also thank Matthew Cockman, Ian McGough, and Peter Ratcliffe (all at the Crick Institute), as well as Marc Pieterse (Mill, The Netherlands) for discussions.
Footnotes
Author contributions
This project was conceived by CRA, HN and JPV. HN created the RPS23[R67K] strain, as well as the RPS26[attP-KO] strain, which served as the starting point for the generation of RPS26[cKO] by CA and CRA. HN also performed the developmental timing measurements. DH generated the RPS23[R67K] HEK293 cells. CA and CRA generated the translation fidelity reporter. JK and APS generated and analysed the mass spectrometry data. The manuscript was written by CRA and JPV.
Competing interests
The authors declare no competing or financial interests.
Data availability
The data supporting the findings of this study are available within the main body of the paper or the supplementary information files. The mass spectrometry dataset is available via ProteomeXchange with identifier PXD023021. Accession numbers and names for the proteins identified by mass spectrometry can be found at Uniprot (https://www.uniprot.org/) and Flybase (http://flybase.org/). Source data are provided for Figures 1-5 and Extended Data Figures 1, 5 and 8-10.
References
- 1.Farley-Barnes KI, Ogawa LM, Baserga SJ. Ribosomopathies: Old Concepts, New Controversies. Trends Genet. 2019;35:754–767. doi: 10.1016/j.tig.2019.07.004. [DOI] [PMC free article] [PubMed] [Google Scholar]
- 2.Mills EW, Green R. Ribosomopathies: There’s strength in numbers. Science. 2017;358:eaan2755. doi: 10.1126/science.aan2755. [DOI] [PubMed] [Google Scholar]
- 3.Aspesi A, Ellis SR. Rare ribosomopathies: insights into mechanisms of cancer. Nat Rev Cancer. 2019;19:228–238. doi: 10.1038/s41568-019-0105-0. [DOI] [PubMed] [Google Scholar]
- 4.Harding HP, et al. An Integrated Stress Response Regulates Amino Acid Metabolism and Resistance to Oxidative Stress. Mol Cell. 2003;11:619–633. doi: 10.1016/s1097-2765(03)00105-9. [DOI] [PubMed] [Google Scholar]
- 5.Saxton RA, Sabatini DM. mTOR Signaling in Growth, Metabolism, and Disease. Cell. 2017;168:960–976. doi: 10.1016/j.cell.2017.02.004. [DOI] [PMC free article] [PubMed] [Google Scholar]
- 6.Klauck SM, et al. Mutations in the ribosomal protein gene RPL10 suggest a novel modulating disease mechanism for autism. Mol Psychiatry. 2006;11:1073–1084. doi: 10.1038/sj.mp.4001883. [DOI] [PubMed] [Google Scholar]
- 7.Brooks SS, et al. A Novel Ribosomopathy Caused by Dysfunction of RPL10 Disrupts Neurodevelopment and Causes X-Linked Microcephaly in Humans. Genetics. 2014;198:723–733. doi: 10.1534/genetics.114.168211. [DOI] [PMC free article] [PubMed] [Google Scholar]
- 8.Hetman M, Slomnicki LP. Ribosomal biogenesis as an emerging target of neurodevelopmental pathologies. J Neurochem. 2019;148:325–347. doi: 10.1111/jnc.14576. [DOI] [PMC free article] [PubMed] [Google Scholar]
- 9.Paolini NA, et al. A Ribosomopathy Reveals Decoding Defective Ribosomes Driving Human Dysmorphism. Am J Hum Genet. 2017;100:506–522. doi: 10.1016/j.ajhg.2017.01.034. [DOI] [PMC free article] [PubMed] [Google Scholar]
- 10.Alsop RJ, et al. Structural Abnormalities in the Hair of a Patient with a Novel Ribosomopathy. PLoS One. 2016;11:e0149619. doi: 10.1371/journal.pone.0149619. [DOI] [PMC free article] [PubMed] [Google Scholar]
- 11.Marygold SJ, et al. The ribosomal protein genes and Minute loci of Drosophila melanogaster. Genome Biol. 2007;8 doi: 10.1186/gb-2007-8-10-r216. R216. [DOI] [PMC free article] [PubMed] [Google Scholar]
- 12.Lambertsson A. The Minute Genes in Drosophila and Their Molecular Functions. Advances in Genetics. 1998;38:69–134. doi: 10.1016/s0065-2660(08)60142-x. [DOI] [PubMed] [Google Scholar]
- 13.Morata G, Ripoll P. Minutes: Mutants of Drosophila autonomously affecting cell division rate. Dev Biol. 1975;42:211–221. doi: 10.1016/0012-1606(75)90330-9. [DOI] [PubMed] [Google Scholar]
- 14.Moreno E, Basler K, Morata G. Cells compete for Decapentaplegic survival factor to prevent apoptosis in Drosophila wing development. Nature. 2002;416:755–759. doi: 10.1038/416755a. [DOI] [PubMed] [Google Scholar]
- 15.Johnston LA. Competitive Interactions between Cells: Death, Growth, and Geography. Science (80-) 2009;324:1679–1682. doi: 10.1126/science.1163862. [DOI] [PMC free article] [PubMed] [Google Scholar]
- 16.Milán M, Campuzano S, García-Bellido a. Developmental parameters of cell death in the wing disc of Drosophila. Proc Natl Acad Sci U S A. 1997;94:5691–6. doi: 10.1073/pnas.94.11.5691. [DOI] [PMC free article] [PubMed] [Google Scholar]
- 17.Coelho CMA. Growth and cell survival are unevenly impaired in pixie mutant wing discs. Development. 2005;132:5411–5424. doi: 10.1242/dev.02148. [DOI] [PubMed] [Google Scholar]
- 18.Ulirsch JC, et al. The Genetic Landscape of Diamond-Blackfan Anemia. Am J Hum Genet. 2018;103:930–947. doi: 10.1016/j.ajhg.2018.10.027. [DOI] [PMC free article] [PubMed] [Google Scholar]
- 19.Kucinski I, Dinan M, Kolahgar G, Piddini E. Chronic activation of JNK JAK/STAT and oxidative stress signalling causes the loser cell status. Nat Commun. 2017;8 doi: 10.1038/s41467-017-00145-y. 136. [DOI] [PMC free article] [PubMed] [Google Scholar]
- 20.Lee C-H, et al. A Regulatory Response to Ribosomal Protein Mutations Controls Translation, Growth, and Cell Competition. Dev Cell. 2018;46:456–469.e4. doi: 10.1016/j.devcel.2018.07.003. [DOI] [PMC free article] [PubMed] [Google Scholar]
- 21.Akdemir F, Christich A, Sogame N, Chapo J, Abrams JM. p53 directs focused genomic responses in Drosophila. Oncogene. 2007;26:5184–5193. doi: 10.1038/sj.onc.1210328. [DOI] [PubMed] [Google Scholar]
- 22.Baillon L, Germani F, Rockel C, Hilchenbach J, Basler K. Xrp1 is a transcription factor required for cell competition-driven elimination of loser cells. Sci Rep. 2018;8 doi: 10.1038/s41598-018-36277-4. 17712. [DOI] [PMC free article] [PubMed] [Google Scholar]
- 23.Ji Z, et al. Drosophila RpS12 controls translation, growth, and cell competition through Xrp1. PLOS Genet. 2019;15:e1008513. doi: 10.1371/journal.pgen.1008513. [DOI] [PMC free article] [PubMed] [Google Scholar]
- 24.Danilova N, Gazda HT. Ribosomopathies: how a common root can cause a tree of pathologies. Dis Model Mech. 2015;8:1013–1026. doi: 10.1242/dmm.020529. [DOI] [PMC free article] [PubMed] [Google Scholar]
- 25.Wartlick O, et al. Dynamics of Dpp Signaling and Proliferation Control. Science (80-) 2011;331:1154–1159. doi: 10.1126/science.1200037. [DOI] [PubMed] [Google Scholar]
- 26.Nienhaus U, Aegerter-Wilmsen T, Aegerter CM. In-Vivo Imaging of the Drosophila Wing Imaginal Disc over Time: Novel Insights on Growth and Boundary Formation. PLoS One. 2012;7:e47594. doi: 10.1371/journal.pone.0047594. [DOI] [PMC free article] [PubMed] [Google Scholar]
- 27.Liu J, Xu Y, Stoleru D, Salic A. Imaging protein synthesis in cells and tissues with an alkyne analog of puromycin. Proc Natl Acad Sci U S A. 2012;109:413–418. doi: 10.1073/pnas.1111561108. [DOI] [PMC free article] [PubMed] [Google Scholar]
- 28.Lacsina JR, et al. Premature Translational Termination Products Are Rapidly Degraded Substrates for MHC Class I Presentation. PLoS One. 2012;7:e51968. doi: 10.1371/journal.pone.0051968. [DOI] [PMC free article] [PubMed] [Google Scholar]
- 29.Mediani L, et al. Defective ribosomal products challenge nuclear function by impairing nuclear condensate dynamics and immobilizing ubiquitin. EMBO J. 2019;38:1–19. doi: 10.15252/embj.2018101341. [DOI] [PMC free article] [PubMed] [Google Scholar]
- 30.Wenger T, et al. Autophagy inhibition promotes defective neosynthesized proteins storage in ALIS, and induces redirection toward proteasome processing and MHCI-restricted presentation. Autophagy. 2012;8:350–363. doi: 10.4161/auto.18806. [DOI] [PubMed] [Google Scholar]
- 31.Seguin SJ, et al. Inhibition of autophagy, lysosome and VCP function impairs stress granule assembly. Cell Death Differ. 2014;21:1838–1851. doi: 10.1038/cdd.2014.103. [DOI] [PMC free article] [PubMed] [Google Scholar]
- 32.Martin DDO, Ladha S, Ehrnhoefer DE, Hayden MR. Autophagy in Huntington disease and huntingtin in autophagy. Trends Neurosci. 2015;38:26–35. doi: 10.1016/j.tins.2014.09.003. [DOI] [PubMed] [Google Scholar]
- 33.Serpionov GV, Alexandrov AI, Antonenko YN, Ter-Avanesyan MD. A protein polymerization cascade mediates toxicity of non-pathological human huntingtin in yeast. Sci Rep. 2015;5 doi: 10.1038/srep18407. 18407. [DOI] [PMC free article] [PubMed] [Google Scholar]
- 34.Busch A, et al. Mutant huntingtin promotes the fibrillogenesis of wild-type huntingtin: A potential mechanism for loss of huntingtin function in Huntington’s disease. J Biol Chem. 2003;278:41452–41461. doi: 10.1074/jbc.M303354200. [DOI] [PubMed] [Google Scholar]
- 35.Bjørkøy G, et al. p62/SQSTM1 forms protein aggregates degraded by autophagy and has a protective effect on huntingtin-induced cell death. J Cell Biol. 2005;171:603–614. doi: 10.1083/jcb.200507002. [DOI] [PMC free article] [PubMed] [Google Scholar]
- 36.Nezis IP, et al. Autophagic degradation of dBruce controls DNA fragmentation in nurse cells during late Drosophila melanogaster oogenesis. J Cell Biol. 2010;190:523–531. doi: 10.1083/jcb.201002035. [DOI] [PMC free article] [PubMed] [Google Scholar]
- 37.Pederson T. Ribosomal protein mutations in Diamond-Blackfan anemia: might they operate upstream from protein synthesis? FASEB J. 2007;21:3442–3445. doi: 10.1096/fj.07-8766hyp. [DOI] [PubMed] [Google Scholar]
- 38.Shi Z, et al. Heterogeneous Ribosomes Preferentially Translate Distinct Subpools of mRNAs Genome-wide. Mol Cell. 2017;67:71–83.e7. doi: 10.1016/j.molcel.2017.05.021. [DOI] [PMC free article] [PubMed] [Google Scholar]
- 39.Grentzmann G, Ingram JA, Kelly PJ, Gesteland RF, Atkins JF. A dual-luciferase reporter system for studying recoding signals. RNA. 1998;4:479–86. [PMC free article] [PubMed] [Google Scholar]
- 40.Manuvakhova M, Keeling K, Bedwell DM. Aminoglycoside antibiotics mediate context-dependent suppression of termination codons in a mammalian translation system. RNA. 2000;6:1044–55. doi: 10.1017/s1355838200000716. [DOI] [PMC free article] [PubMed] [Google Scholar]
- 41.Albert B, et al. A ribosome assembly stress response regulates transcription to maintain proteome homeostasis. Elife. 2019;8:1–24. doi: 10.7554/eLife.45002. [DOI] [PMC free article] [PubMed] [Google Scholar]
- 42.Tye BW, et al. Proteotoxicity from aberrant ribosome biogenesis compromises cell fitness. Elife. 2019;8:1–29. doi: 10.7554/eLife.43002. [DOI] [PMC free article] [PubMed] [Google Scholar]
- 43.Nagaraj N, et al. Deep proteome and transcriptome mapping of a human cancer cell line. Mol Syst Biol. 2011;7:548. doi: 10.1038/msb.2011.81. [DOI] [PMC free article] [PubMed] [Google Scholar]
- 44.Pelletier J, Thomas G, Volarević S. Ribosome biogenesis in cancer: new players and therapeutic avenues. Nat Rev Cancer. 2017;18:51–63. doi: 10.1038/nrc.2017.104. [DOI] [PubMed] [Google Scholar]
- 45.Wiśniewski JR, Hein MY, Cox J, Mann M. A “Proteomic Ruler” for Protein Copy Number and Concentration Estimation without Spike-in Standards. Mol Cell Proteomics. 2014;13:3497–3506. doi: 10.1074/mcp.M113.037309. [DOI] [PMC free article] [PubMed] [Google Scholar]
- 46.An H, Harper JW. Ribosome Abundance Control Via the Ubiquitin–Proteasome System and Autophagy. J Mol Biol. 2019:1–15. doi: 10.1016/j.jmb.2019.06.001. [DOI] [PMC free article] [PubMed] [Google Scholar]
- 47.Pillet B, Mitterer V, Kressler D, Pertschy B. Hold on to your friends: Dedicated chaperones of ribosomal proteins. BioEssays. 2017;39:e201600153. doi: 10.1002/bies.201600153. [DOI] [PubMed] [Google Scholar]
- 48.Sung MK, et al. A conserved quality-control pathway that mediates degradation of unassembled ribosomal proteins. Elife. 2016;5:1–28. doi: 10.7554/eLife.19105. [DOI] [PMC free article] [PubMed] [Google Scholar]
- 49.Blanco J, Cooper JC, Baker NE. Roles of C/EBP class bZip proteins in the growth and cell competition of Rp (‘Minute’) mutants in Drosophila. Elife. 2020;9:1–27. doi: 10.7554/eLife.50535. [DOI] [PMC free article] [PubMed] [Google Scholar]
- 50.Malzer E, et al. Coordinate regulation of eIF2α phosphorylation by PPP1R15 and GCN2 is required during Drosophila development. J Cell Sci. 2013;126:1406–15. doi: 10.1242/jcs.117614. [DOI] [PMC free article] [PubMed] [Google Scholar]
- 51.King MA, et al. Rapamycin Inhibits Polyglutamine Aggregation Independently of Autophagy by Reducing Protein Synthesis. Mol Pharmacol. 2008;73:1052–1063. doi: 10.1124/mol.107.043398. [DOI] [PubMed] [Google Scholar]
- 52.Conn CS, Qian S-B. Nutrient Signaling in Protein Homeostasis: An Increase in Quantity at the Expense of Quality. Sci Signal. 2013;6:ra24–ra24. doi: 10.1126/scisignal.2003520. [DOI] [PMC free article] [PubMed] [Google Scholar]
- 53.Xie J, et al. Regulation of the Elongation Phase of Protein Synthesis Enhances Translation Accuracy and Modulates Lifespan. Curr Biol. 2019;29:737–749.e5. doi: 10.1016/j.cub.2019.01.029. [DOI] [PubMed] [Google Scholar]
- 54.Baumgartner M, Dinan MP, Langton PF, Kucinski I, Piddini E. Proteotoxic stress is a driver of the loser status and of cell competition. Nat Cell Biol. 2020 doi: 10.1038/s41556-020-00627-0. [DOI] [PMC free article] [PubMed] [Google Scholar]
- 55.Bové J, Martínez-Vicente M, Vila M. Fighting neurodegeneration with rapamycin: Mechanistic insights. Nat Rev Neurosci. 2011;12:437–452. doi: 10.1038/nrn3068. [DOI] [PubMed] [Google Scholar]
- 56.Doulatov S, et al. Drug discovery for Diamond-Blackfan anemia using reprogrammed hematopoietic progenitors. Sci Transl Med. 2017;9:eaah5645. doi: 10.1126/scitranslmed.aah5645. [DOI] [PMC free article] [PubMed] [Google Scholar]
- 57.Cortez L, Sim V. The therapeutic potential of chemical chaperones in protein folding diseases. Prion. 2014;8:1–6. doi: 10.4161/pri.28938. [DOI] [PMC free article] [PubMed] [Google Scholar]
- 58.Mayor-Ruiz C, et al. Rational discovery of molecular glue degraders via scalable chemical profiling. Nat Chem Biol. 2020;16:1199–1207. doi: 10.1038/s41589-020-0594-x. [DOI] [PMC free article] [PubMed] [Google Scholar]
- 59.Poernbacher I, et al. Lessons in genome engineering: opportunities, tools and pitfalls. bioRxiv. 2019 doi: 10.1101/710871. 710871. [DOI] [Google Scholar]
- 60.Kondo S, Ueda R. Highly Improved Gene Targeting by Germline-Specific Cas9 Expression in Drosophila. Genetics. 2013;195:715–721. doi: 10.1534/genetics.113.156737. [DOI] [PMC free article] [PubMed] [Google Scholar]
- 61.Baena-Lopez LA, Alexandre C, Mitchell A, Pasakarnis L, Vincent JP. Accelerated homologous recombination and subsequent genome modification in Drosophila. Dev. 2013;140:4818–4825. doi: 10.1242/dev.100933. [DOI] [PMC free article] [PubMed] [Google Scholar]
- 62.Ran FA, et al. Genome engineering using the CRISPR-Cas9 system. Nat Protoc. 2013;8:2281–2308. doi: 10.1038/nprot.2013.143. [DOI] [PMC free article] [PubMed] [Google Scholar]
- 63.Germani F, Bergantinos C, Johnston LA. Mosaic analysis in drosophila. Genetics. 2018;208:473–490. doi: 10.1534/genetics.117.300256. [DOI] [PMC free article] [PubMed] [Google Scholar]
- 64.Nezis IP, et al. Ref(2)P, the Drosophila melanogaster homologue of mammalian p62, is required for the formation of protein aggregates in adult brain. J Cell Biol. 2008;180:1065–1071. doi: 10.1083/jcb.200711108. [DOI] [PMC free article] [PubMed] [Google Scholar]
Associated Data
This section collects any data citations, data availability statements, or supplementary materials included in this article.
Supplementary Materials
Data Availability Statement
The data supporting the findings of this study are available within the main body of the paper or the supplementary information files. The mass spectrometry dataset is available via ProteomeXchange with identifier PXD023021. Accession numbers and names for the proteins identified by mass spectrometry can be found at Uniprot (https://www.uniprot.org/) and Flybase (http://flybase.org/). Source data are provided for Figures 1-5 and Extended Data Figures 1, 5 and 8-10.


