Abstract
Malaria has had a major effect on the human genome, many protective polymorphisms such as sickle cell trait having been selected to high frequencies in malaria endemic regions1,2. Recently, it was shown that the blood group variant Dantu provides 74% protection against all forms of severe malaria in homozygous individuals3–5. This is a similar degree of protection to sickle cell trait and considerably greater than the best malaria vaccine, but until now the protective mechanism has been unknown. Here, we demonstrate a significant impact of Dantu on Plasmodium falciparum-merozoite RBC invasion. Dantu was associated with extensive changes to the RBC surface protein repertoire, but unexpectedly, inhibition did not correlate with specific RBC-parasite receptor-ligand interactions. By following invasion using video microscopy, we found a strong link between RBC tension and merozoite invasion and identified a tension threshold above which invasion rarely occurred, even in non-Dantu RBCs. Dantu RBCs had higher average tension, meaning that a greater proportion resisted invasion. These findings provide both an explanation for the malaria-protective effect of Dantu, and fresh insights into why the efficiency of P. falciparum invasion might vary across the heterogenous populations of RBCs both within and between individuals.
The Dantu polymorphism has been fine-mapped to a structural rearrangement in the glycophorin (GYP) gene cluster. This rearrangement of the GYPA and GYPB genes creates two copies of a hybrid gene that encodes the Dantu blood group antigen, a novel sialoglycoprotein composed of a glycophorin B (GYPB) extracellular domain fused with a glycophorin A (GYPA) intracellular domain5. Both GYPA and GYPB play important functional roles in the invasion of P. falciparum merozoites into RBCs, being receptors for the P. falciparum erythrocyte-binding ligand PfEBA-1756 and the P. falciparum erythrocyte binding ligand 1 (PfEBL-1)7 respectively.
Dantu limits red blood cell invasion
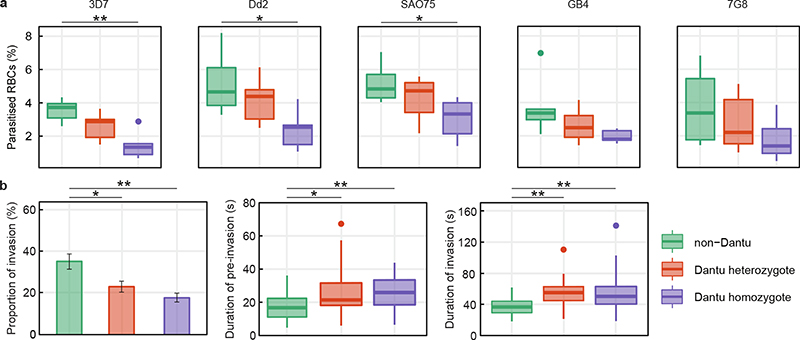
To investigate the impact of Dantu on P. falciparum invasion, we collected RBC samples from 42 healthy children from Kilifi in Kenya. Whilst the prevalence of Dantu is limited geographically, being found at much lower frequencies across Africa than the sickle mutation in HBB (βs), it is found at a minor allele frequency (MAF) of approximately 10% in this region, the highest yet described1,3 and higher than that of βs in this same area (MAF ~8%4). To eliminate any possible confounding from other large-effect malaria-protective polymorphisms, we excluded samples from subjects with either βs or homozygous α-thalassaemia (Supplementary Table 1). We quantified invasion over one life cycle (Extended Data Fig. 1a) using a flow-cytometry-based preference assay8. Parasites were co-cultured with differentially labelled Dantu-heterozygous, homozygous, and non-Dantu RBCs, and we measured invasion events into each using a fluorescent DNA dye (Supplementary Figure). Significantly lower invasion of Dantu RBCs was seen for 3 parasite strains (3D7, Dd2 and SAO75), while a similar but non-significant trend was observed for GB4 and 7G8, potentially because of technical variation in their growth rates and starting parasitaemias. We chose these five strains for their use of varying invasion pathways and their differing reliance on GYPA in particular; Dantu limited invasion in all cases. We also observed a trend towards greater invasion-resistance by Dantu homozygous than heterozygous RBCs, suggesting a dose-dependent effect (Fig. 1a, Supplementary Table 2).
Figure 1. Reduced invasion of Dantu variant RBCs by multiple P. falciparum strains.
(a) The relative ability of P. falciparum strains from multiple geographic locations (3D7 and GB4 West Africa; Dd2 Southeast Asia; SA075 East Africa; 7G8 South America) to invade RBCs was measured using a flow cytometry-based preference invasion assay. The percentage of parasitised RBCs in each genotype group is indicated on the y-axis. Statistical comparison across groups was performed by one-way ANOVA, while pairwise comparisons between groups used the Tukey HSD test. Significant differences in invasion were observed between non-Dantu and Dantu homozygotes in 3D7 (p=0.001), Dd2 (p=0.015) and SAO75 (p=0.028). Statistical data listed in Supplementary Table 2. (b) The invasion process was also followed by live video microscopy, where the invasion rate of 3D7 merozoites was measured as the proportion of merozoites that contacted and successfully invaded RBCs, relative to all merozoites that contacted RBCs. Pre-invasion time - from first merozoite contact through RBC membrane deformation and resting; invasion time - from beginning of merozoite internalization to beginning of echinocytosis. 6 RBCs per genotype group were tested in both flow and video microscopy assays. In the video microscopy assays, the number of contacted and successfully invaded RBCs counted were as follows: non-Dantu: 144/53, Dantu heterozygote: 191/43, Dantu homozygote: 233/41. Boxes indicate the median and interquartile ranges, while whiskers denote the total data range, with the dots outside the whiskers indicating the outliers. Bars show the mean and standard deviation of the video microscopy invasion data. Pairwise comparisons between genotypes were performed using the two-sided Mann-Whitney U test. **p < 0.01; *p < 0.05.
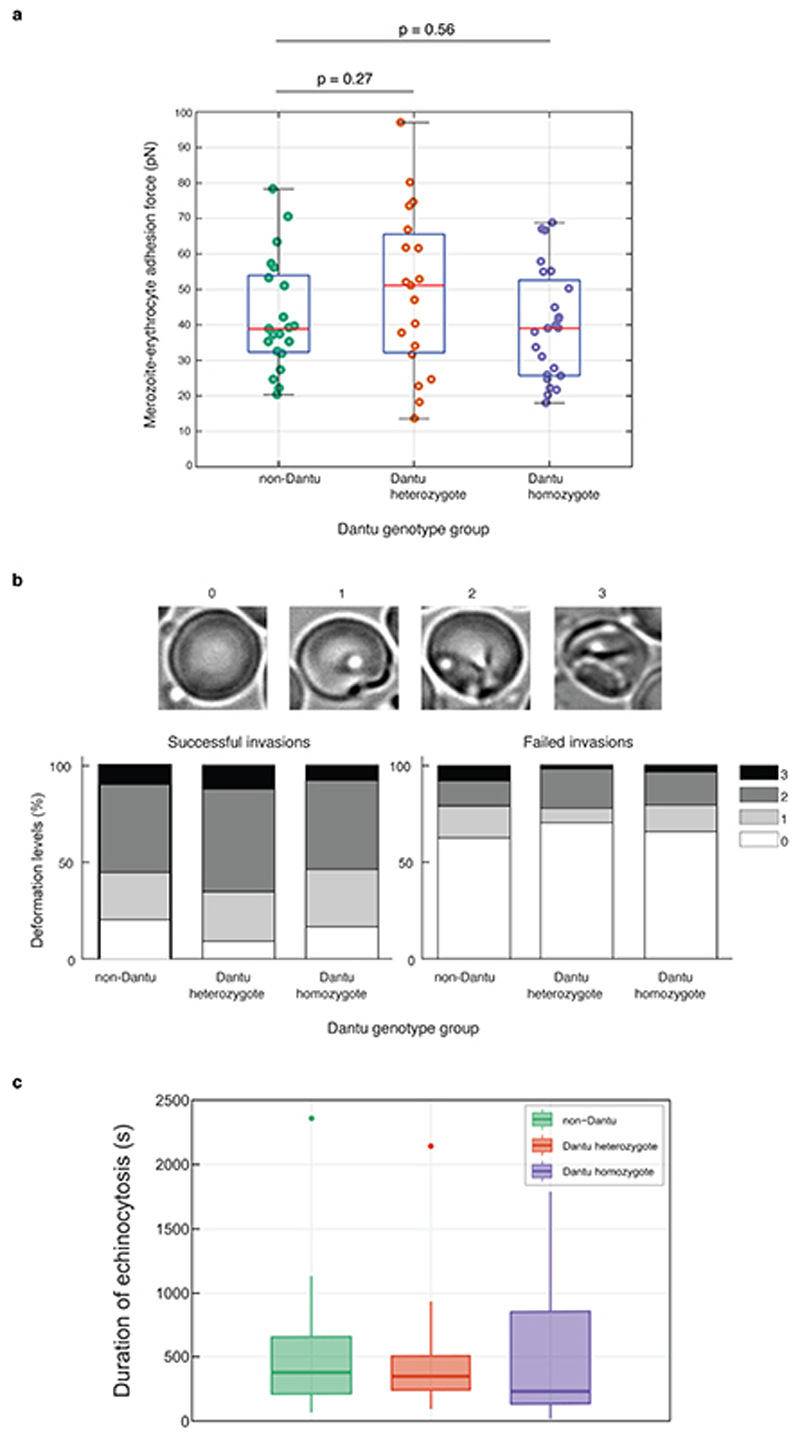
To investigate the specific step at which invasion was impaired, we used time-lapse video microscopy to study the invasion process by 3D7 strain parasites. Invasion into Dantu RBCs was also significantly decreased in this real-time assay, independently validating the results of our FACS-based assays (Fig. 1b and Supplementary Videos 1 and 2). Invasion can be broken down into three phases: pre-invasion, invasion and echinocytosis (Extended Data Fig. 1b). Even when successful, the early pre-invasion and subsequent entry steps took significantly longer in Dantu homozygous RBCs, suggesting a mechanical resistance to invasion. By contrast, we found no significant difference in the strength of attachment between merozoites and Dantu RBCs using optical tweezers9 (Extended Data Fig. 2a, Supplementary Table 3, and Supplementary Video 3), nor was there a significant difference in the degree of membrane deformation10 or echinocytosis triggered by parasites invading RBCs of differing Dantu genotype (Extended Data Fig. 2b and c). Overall, these results indicate that Dantu has a pleiotropic effect on invasion across both contact and entry phases.
Surface protein composition also affected
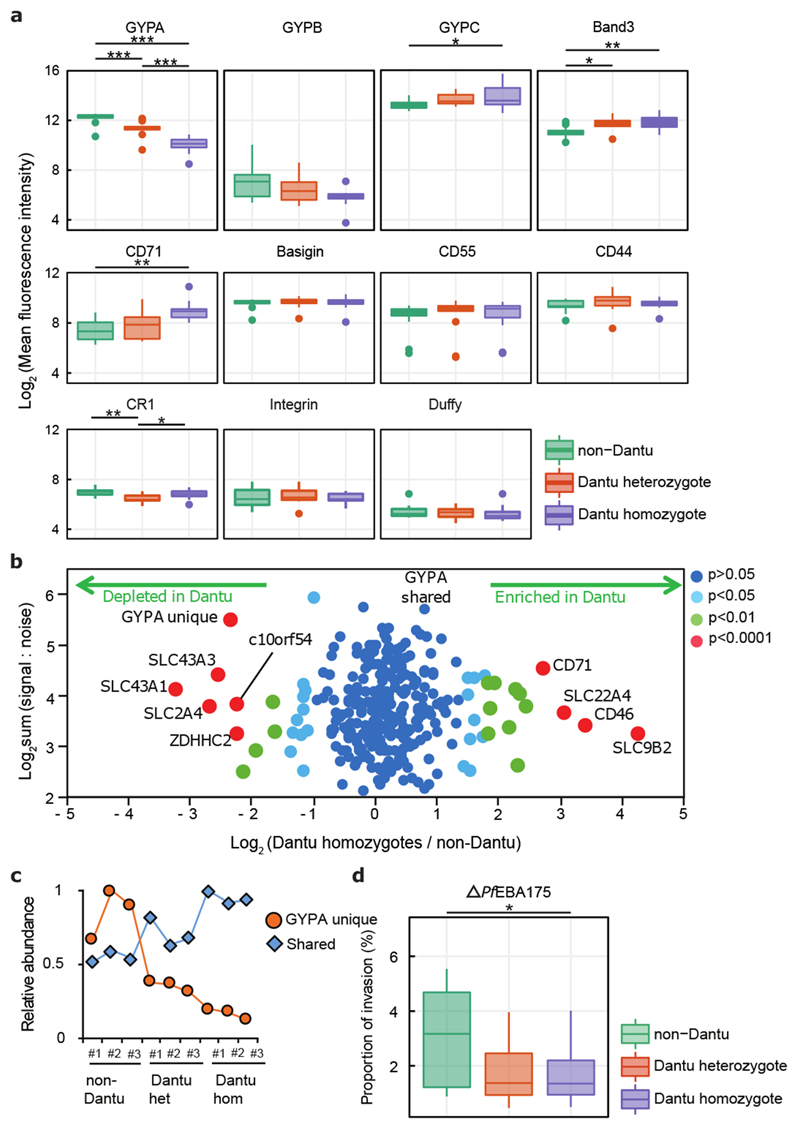
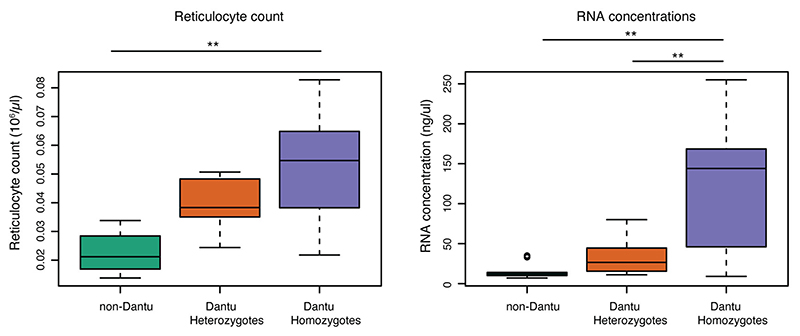
Comparing RBC indices across the Dantu genotypic groups revealed significantly lower mean cell volumes (MCVs) and mean cell haemoglobin concentrations in Dantu homozygotes (Table 1). This suggests that Dantu directly impacts RBC properties, perhaps by altering the composition of the RBC surface. Despite the fact that Dantu leaves an intact copy of GYPA within the genome5, the surface expression level of GYPA in Dantu RBCs was significantly reduced when measured by flow cytometry (Fig. 2a), confirming observations from previous studies11. By contrast, surface expression of GYPB was unchanged, while both GYPC, another important invasion receptor12, and Band 3 were significantly increased in Dantu RBCs (Fig. 2a). CR1 levels were lower in heterozygotes compared to the other two genotypes and, importantly, we also observed a significantly higher proportion of Dantu cells expressing CD71, a marker of younger RBCs that is lost with maturation (Fig. 2a). The conclusion that Dantu RBCs might be younger is supported by the higher reticulocyte counts (Table 1), and a higher reticulocyte RNA content (Extended Data Fig. 3) in Dantu homozygotes. We saw no differences in the surface expression of other essential RBC membrane proteins including Basigin, CD55, CD44, Integrin and Duffy (Fig. 2a).
Table 1. Clinical and demographic characteristics of study participants.
Mean values for each clinical and demographic characteristic, with standard deviation (SD) in parentheses. n= 17 non-Dantu, 16 Dantu heterozygous and 13 Dantu homozygous individuals. Statistical comparison across genotypes was performed using the Kruskal-Wallis test, while pairwise comparisons between groups performed using Dunn’s test. P adj* - adjusted for age, sex and multiple comparisons with Benjamini-Hochberg FDR adjustment. *p < 0.05.
| Pairwise comparisons between genotype groups | |||||||
|---|---|---|---|---|---|---|---|
| Characteristic | non-Dantu | Dantu Heterozygote | Dantu Homozygote | P adj (Comparison across genotype groups) | P adj (non-Dantu vs. Dantu Heterozy gote) | P adj (non-Dantu vs. Dantu Homozy gote) | P adj (Dantu Heteroz ygote vs. Dantu Homozy gote) |
| Mean Age (SD; years) | 11.4 (1.6) | 11.6 (1.7) | 9.3 (4.1) | - | 0.3671 | 0.1498 | 0.1704 |
| Sex (F/M) | 5/10 | 5/9 | 5/8 | - | 0.4557 | 0.9064 | 0.5127 |
| Red blood cell count (SD; 106/μL) | 4.60 (0.36) | 4.62 (0.34) | 4.94 (0.68) | 0.286 | 0.3538 | 0.1743 | 0.1897 |
| Reticulocyte count (SD; 106/μL) | 0.02 (0.01) | 0.04 (0.01) | 0.05 (0.02) | 0.545 | 0.4451 | 0.4539 | 0.2906 |
| White blood cell count (SD; 103/μL) | 5.83 (1.46) | 5.67 (0.78) | 6.89 (2.93) | 0.643 | 0.3684 | 0.5249 | 0.407 |
| Platelet count (SD; 103/μL) | 284.06 (77.91) | 293.31 (73.91) | 346.92 (96.40) | 0.106 | 0.3112 | 0.0594 | 0.087 |
| Haematocrit (SD; %) | 37.23 (1.66) | 37.23 (2.68) | 36.22 (2.42) | 0.188 | 0.419 | 0.0959 | 0.1357 |
| Haemoglobin concentration (SD; g/dL) | 12.54 (0.54) | 12.59 (0.93) | 12.08 (1.13) | 0.168 | 0.3615 | 0.1029 | 0.1085 |
| Mean cell volume (SD; fL) | 81.32 (4.69) | 80.78 (4.67) | 74.40 (9.66) | 0.015* | 0.344 | 0.0094* | 0.0152* |
| Mean cell haemoglobin (SD; pg) | 27.38 (1.75) | 27.31 (1.83) | 24.90 (4.12) | 0.015* | 0.454 | 0.0131* | 0.0099* |
| Mean cell haemoglobin concentration (SD; g/dL) | 33.67 (0.60) | 33.81 (0.63) | 33.33 (1.51) | 0.113 | 0.2774 | 0.0986 | 0.0622 |
| Red blood cell distribution width (SD; %) | 12.83 (1.29) | 12.70 (1.13) | 13.78 (1.66) | 0.830 | 0.4987 | 0.88 | 0.4452 |
Figure 2. RBC membrane protein characteristics vary across Dantu genotypes but do not directly correlate with invasion efficiency.
(a) The relative expression of essential RBC membrane proteins was assessed using fluorescent monoclonal antibodies in flow cytometry assays. 13 non-Dantu, 12 Dantu heterozygotes and 11 Dantu homozygotes were tested. Statistical comparison across groups was performed by one-way ANOVA, while pairwise comparisons between groups used the Tukey HSD test. Significant differences were observed in GYPA (non-Dantu vs. Dantu homozygote p=6.25×10⁻¹¹; non-Dantu vs. Dantu heterozygote p= 4.62×10⁻⁶; Dantu heterozygote vs. Dantu homozygote p= 6.86×10⁻⁴), GYPC (non-Dantu vs. Dantu homozygote p=0.03), Band3 (non-Dantu vs. Dantu homozygote p=6.25×10⁻¹¹; non-Dantu vs. Dantu heterozygote p=0.0136), CD71 (non-Dantu vs. Dantu homozygote p=0.006), and CR1 (non-Dantu vs. Dantu heterozygote p=0.003; Dantu heterozygote vs Dantu homozygote p=0.045). (b) Scatter plot of all proteins quantified by mass spectrometry (n=3 RBCs per genotype). Fold change was calculated by average signal:noise (Dantu homozygote/non-Dantu). GYPA was split into two parts: identified by peptides unique to GYPA (‘GYPA unique’, originating from extracellular region) or shared with the Dantu protein (‘GYPA shared’, originating from intracellular region). Mass spectra were processed with the quantitative proteomics platform “MassPike” and the method of significance A with Benjamini-Hochberg multiple testing correction was used to estimate the p-value that each protein ratio was significantly different to 1. (c) Graph of the relative abundance of ‘unique’ and ‘shared’ GYPA peptides across all donors. Signal:noise values were normalised to a maximum of 1 for each protein. Statistical data for (b) and (c) listed in Supplementary Table 4. (d) Comparison of invasion efficiency of a genetically modified parasite strain, ΔPfEBA175, across genotypes (n=13 non-Dantu, 12 Dantu heterozygotes and 12 Dantu homozygotes) using the flow-cytometry-based preference invasion assay. The percentage of parasitised RBCs in each genotype is indicated on the y-axis. Statistical comparison across groups was by one-way ANOVA, while pairwise comparisons between groups used the Tukey HSD test (non-Dantu vs. Dantu homozygote p=0.04). ** p < 0.01; * p < 0.05.
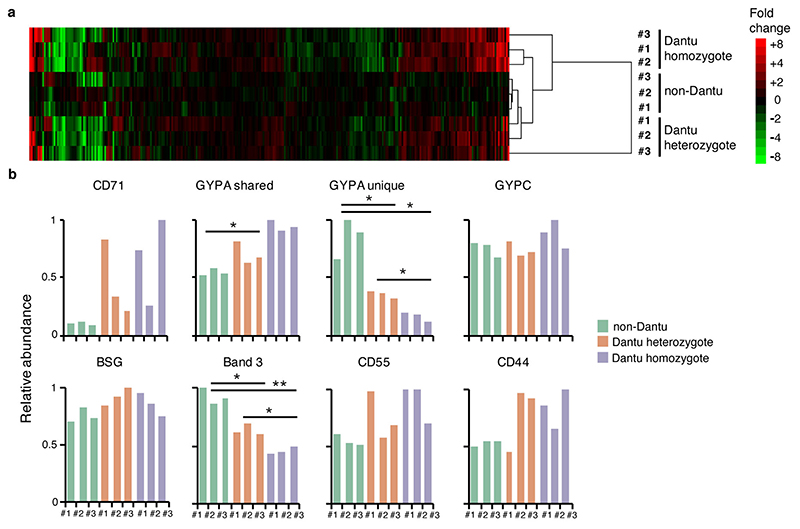
To quantify these changes more accurately, we employed plasma membrane profiling13 and tandem mass tag mass spectrometry to accurately quantify surface proteins. Analyzing RBCs from three donors of each type revealed widespread cell surface changes, with 40 proteins up- and 34 down-regulated by >50% in Dantu heterozygotes, and 66 proteins up- and 34 down-regulated by >50% in Dantu homozygotes (Figures 2b, Extended Data Fig. 4, Supplementary Table 4). The significant decrease in GYPA expression identified by flow cytometry was confirmed by mass spectrometry (Extended Data Fig. 4b), which also identified a significant increase in CD71 expression in Dantu homozygotes (Fig. 2b), supporting the conclusion that on average, Dantu RBCs are younger than normal RBCs. By contrast, the significant increase in GYPC and Band 3 expression in Dantu RBCs observed by flow cytometry were not confirmed by mass spectrometry. Given the more quantitative nature of mass spectrometry, these are likely the more definitive findings. Mass spectrometry also distinguished peptides unique to GYPA (which were all in the extracellular region of the protein) from those shared with Dantu (which were all intracellular), confirming the presence of Dantu antigen on the RBC surface (Figure 2c, Extended Data Fig. 4).
Two independent methods therefore confirm major changes in Dantu RBC membranes, including a significant reduction in the P. falciparum invasion receptor, GYPA. To test whether these changes might explain reduced RBC invasion, we investigated invasion by a genetically modified P. falciparum strain in which PfEBA175, the ligand for GYPA, had been disrupted14. The PfEBA175-GYPA interaction is not essential for invasion, and when PfEBA175 is deleted, other invasion ligands can be transcriptionally up-regulated to compensate for the deletion phenotypically14. Invasion of Dantu RBCs by ΔPfEBA175 parasites was also significantly reduced (Fig. 2d, Supplementary Table 2). Given that by definition, this parasite cannot use GYPA for invasion, the inhibitory impact of Dantu cannot entirely be explained by an altered PfEBA175-GYPA interaction. Along with our earlier observations that Dantu decreases invasion both by strains known to rely heavily on PfEBA175 (Dd2) and others that are less dependent on this pathway (3D7), this observation is further evidence that the impact of Dantu is not linked to specific receptor-ligand interactions.
Membrane tension is linked to invasion efficiency
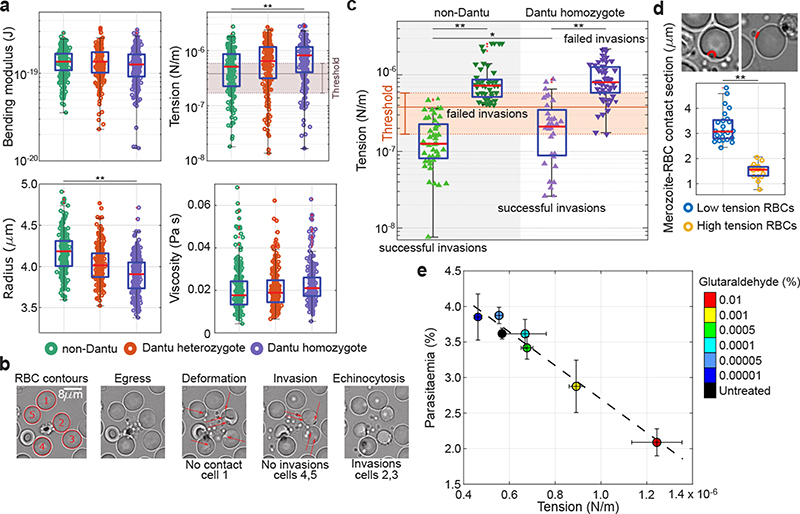
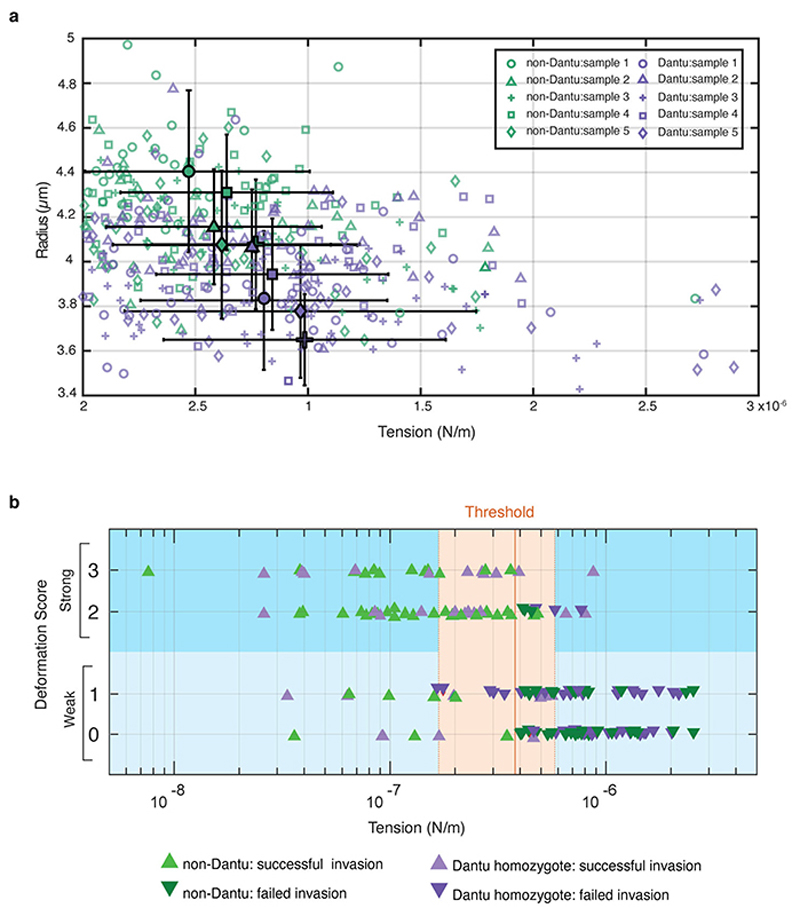
To explore the broader RBC biomechanical effects of Dantu, we measured membrane contour fluctuations16 by combining live imaging with flickering spectrometry17 (Extended Data Fig. 5), enabling us to generate direct measurements of RBC membrane mechanics such as tension, radius, viscosity, and bending modulus. Tension and bending modulus represent the resistance of membranes to stretch and bend, respectively. Bending modulus is affected by lipid composition, membrane thickness, and membrane asymmetry while tension is set by osmotic pressure; the RBC cytoskeleton can affect both. These phenotypes vary naturally between RBCs, which can circulate for more than three months after they are produced from stem cells. As expected due to their lower MCV, Dantu RBCs had a significantly higher tension and smaller radius than non-Dantu RBCs, whereas no significant differences were seen in bending modulus and viscosity (Fig. 3a). The equatorial radius difference of 0.3 μm between non-Dantu and Dantu is minor, and likely explained by a shape change caused by the increased tension. Tension and radius are linked properties, higher tension leading directly to smaller RBCs (Extended Data Fig. 6a)18.
Figure 3.
Biomechanical properties of the RBC membrane differ across Dantu genotypes and correlate with invasion. (a) Membrane flickering spectrometry enabled measurement and comparison of RBC bending modulus, tension, radius, and viscosity across genotypes (n=6 RBCs per genotype). Mean and standard deviation were obtained from the averages of cell tensions for each sample: non-Dantu RBCs - (6.0 ±1.9) *10−7 N/m; Dantu heterozygotes - (7.9±2.8) *10−7 N/m; Dantu homozygotes - (8.8 ± 0.7) *10−7 N/m. The impact of tension on parasite invasion was evaluated by simultaneously measuring tension from flickering analysis and live video imaging of the invasion process from rupturing schizonts (“egress”, “deformation”, then either “invasion” and “echinocytosis”, or a failed invasion) (b), in non-Dantu and Dantu homozygote RBCs (c). The threshold range for tension, marked in (a) and (c), was obtained by comparing distributions of tension across Dantu genotypes with their invasion efficiency. (d) The contact region between merozoites and RBCs, represented in the snapshots, was measured during pre-invasion at the point of RBC maximum deformation for 2 sets of very high (n = 15) and low tension (n = 23) cells (p=1.30 × 10⁻³²). Merozoite-RBC contact section was significantly smaller in high tension RBCs meaning that parasites were much more wrapped around RBCs with a lower membrane tension. (e) Parasite invasion efficiency and RBC tension for six increasing concentrations of glutaraldehyde (0.00001 - 0.01%). Parasite invasion was significantly decreased for RBC tensions around 8.8 × 10⁻⁷ N/m (22% decrease) and 12.2 × 10⁻⁷ N/m (43% decrease). Median values are reported from 2 technical replicates of 2 biologically independent samples. Pairwise comparisons between genotypes used the two-sided Mann-Whitney U test. ** p < 0.01. Number of cells and tension reported in Supplementary Tables 5, and 6.
To test for a link between tension and invasion, we measured both parameters simultaneously using video microscopy. Tension was measured for all RBCs adjacent to a rupturing schizont using high frame-rate capture (Supplementary Video 4), then the invasion fate of all parasite-RBC contact events with these same RBCs was monitored following schizont rupture (Fig. 3b, Supplementary Video 5). We observed an intrinsic distribution of membrane tensions in RBCs from each donor and discovered a clear association between tension and invasion: merozoites preferentially invaded neighbouring RBCs with low tension (Fig. 3c, Supplementary Tables 5 and 6). Comparing the distribution of tension values with invasion efficiency suggested a tension threshold for successful invasion that was consistent across all three genotype groups. The average of these tension thresholds across the genotype groups was 3.8 (±2.0) *10−7 N/m, successful invasion being very rare above this threshold both in Dantu and non-Dantu RBCs (Fig. 3c). Critically, the median tension was 8.2*10−7 N/m in Dantu RBCs, meaning that the majority were above the tension threshold of 3.8 (±2.0) *10−7 N/m (Fig. 3a). The impact of Dantu on the biomechanical properties of the RBC is therefore sufficient to explain its impact on invasion, consistent with the invasion-inhibitory effect of Dantu being independent of a reliance on GYPs or other invasion receptors.
To probe the mechanism by which higher RBC membrane tension results in invasion resistance, we examined whether it impedes the merozoite’s ability to wrap the RBC membrane around itself during invasion. Imaging at fine resolution established that parasites were considerably more wrapped by RBCs with lower membrane tensions (Fig. 3d). Consistent with this, there was also an association between tension and RBC deformation during the invasion process, merozoite contacts with higher tension RBCs resulting in less RBC membrane deformation (Extended Data Fig. 6b, Supplementary Table 6).
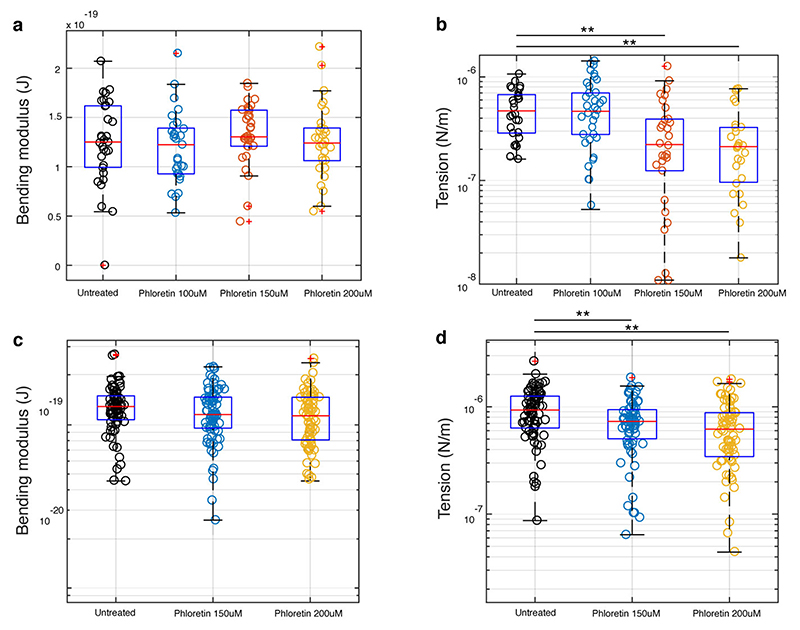
We hypothesized that the molecular mechanism by which membrane tension is increased in Dantu RBCs might relate to changes in expression of membrane ion channels and in particular SLC9B2, a sodium-hydrogen exchanger that is upregulated in Dantu homozygous RBCs (Fig. 2b). Increased SLC9B2 expression could lead to increased intracellular sodium levels, overhydration and increase membrane tension. To test this hypothesis, we treated Dantu RBCs with phloretin, a broad-spectrum inhibitor of ion transporters. Phloretin resulted in decreased tension of both Dantu and non-Dantu RBCs (Extended Data Fig. 7), but unfortunately, it also inhibited egress of parasites from late-stage infected RBCs, making it impossible to test whether phloretin could rescue the invasion inhibitory effect of Dantu. As an alternative approach, we perturbed the membrane tension of non-Dantu RBCs by treating them with trace concentrations of glutaraldehyde, a compound that has been shown to increase RBC membrane tension without affecting bending modulus22, and which therefore mimics the biophysical effect of Dantu. Treatment with 0.01% glutaraldehyde increased membrane tension in non-Dantu RBCs to levels that were similar to Dantu homozygous RBCs, and also caused a 43% reduction in invasion efficiency by 3D7 parasites (Fig. 3e). These data confirm the direct impact of RBC membrane tension on parasite invasion efficiency, independent of other parameters such as bending modulus.
In summary, we have established a mechanism whereby the complex structural polymorphism, Dantu, protects against severe malaria. We demonstrate a marked straintranscending inhibition of P. falciparum-invasion into Dantu RBCs, and establish the novel concept that it is the impact of Dantu on RBC membrane tension that mediates this inhibition, possibly via changes in the surface expression of membrane transporters that affect RBC hydration. By following, for the first time, tension and invasion at single-cell single-event resolution, we propose that irrespective of Dantu genotype, there is a tension threshold for successful P. falciparum invasion, a novel concept that links our understanding of RBC biomechanical properties22,23 to the heterogeneity of parasite invasion. While previous studies have broadly linked invasion efficiency to RBC osmotic stress19 and oxidative damage20, both manipulations have multiple effects on RBC biomechanical properties, and can affect membrane deformability, rigidity, tension and bending modulus20,21 (parameters defined in Supplementary Table 7). In this study, we were able to deconstruct these general biophysical membrane properties into specific components and demonstrate that it is altered tension, but not bending modulus or viscosity, that is associated with impaired invasion into Dantu RBCs.
The concept of a tension threshold potentially explains other well-established features of P. falciparum invasion, such as their preference for younger RBCs24 which have lower tension and higher radii. Several other polymorphisms also affect RBC tension25,26; further studies will be required to investigate whether the same mechanism might be generalizable across multiple malaria-protective RBC traits. Membrane tension also changes with maturation of intracellular parasites27,28, and in other contexts membrane tension has been implicated in the regulation of endocytosis29 and the spreading of bacterial pathogens30. While improving our biological understanding of erythrocyte-parasite dynamics, this study also signals the potential for novel malaria interventions based on modifying the biomechanical properties of circulating RBCs.
Materials and Methods
Study participants
Samples were obtained from 42 children under the age of 13 years from two cohorts from the Kilifi County on the Indian Ocean coast of Kenya, who were involved in ongoing studies on malaria: (i) 18 children from a cohort subject to annual cross-sectional surveys through which blood samples are collected and frozen, and (ii) 24 children from a cohort recruited at 3-12 months of age and followed up for hospital admission since 2007, whose blood samples were collected and used in the assays within 24 hours of blood draw. Individual written informed consent was provided by the parents of all study participants. Ethical approval for the study was granted by the Kenya Medical Research Institute Scientific and Ethics Review Unit in Nairobi, Kenya (SERU3420 and SERU3500), the NHS Cambridgeshire 4 Research Ethics Committee (REC reference 15/EE/0253), and the Wellcome Sanger Institute Human Materials and Data Management Committee.
Genotyping Dantu samples
gDNA was extracted from whole blood using a QIAmp 96 DNA QIcube HT kit on a QIAcube HT System (QIAGEN) following manufacturer’s instructions. The restriction fragment length polymorphism (RFLP) assay to detect genotypes at the Dantu marker SNP, rs186873296, has been previously described4,5. Briefly, PCR amplification of the region of interest containing rs186873296 was performed using the following primers: 5’ACGTTGGATGGCAGATTAGCATTCACCCAG3’ and 5’ACGTTGGATGCTCCAGAGTAAGCATCCTTC3’ generating an amplicon of 124bp. Fragmentation of the PCR product was then performed using the CviQI restriction enzyme (NEB), which allowed us to differentiate between non-Dantu homozygotes (AA) that would remain uncut, Dantu heterozygotes (AG) that would generate two bands of 64 and 56bp, and Dantu homozygotes (GG) which would generate a single band of 56bp.
In vitro culture of P. falciparum parasites
All P. falciparum parasite strains used in this study (3D7, Dd2, SAO75, GB4, 7G8, ΔPfEBA175) were routinely cultured in human O-erythrocytes (NHS Blood and Transplant, Cambridge, UK, and Kenya Medical Research Institute, Nairobi, Kenya) at 3% hematocrit in RPMI 1640 medium with 25 mM Hepes, 20 mM glucose, and 25 μg/mL gentamicin containing 10% Albumax at 37°C (complete medium), under an atmosphere of 1% O2, 3% CO2, and 96% N2 (BOC, Guildford, UK). Parasite cultures were synchronized on early ring stages with 5% D-sorbitol (Sigma-Aldrich, Dorset, UK). Use of erythrocytes from human donors for P. falciparum culture was approved by NHS Cambridgeshire 4 Research Ethics Committee and the Kenya Medical Research Institute Scientific and Ethics Review Unit.
RBC preference invasion assays
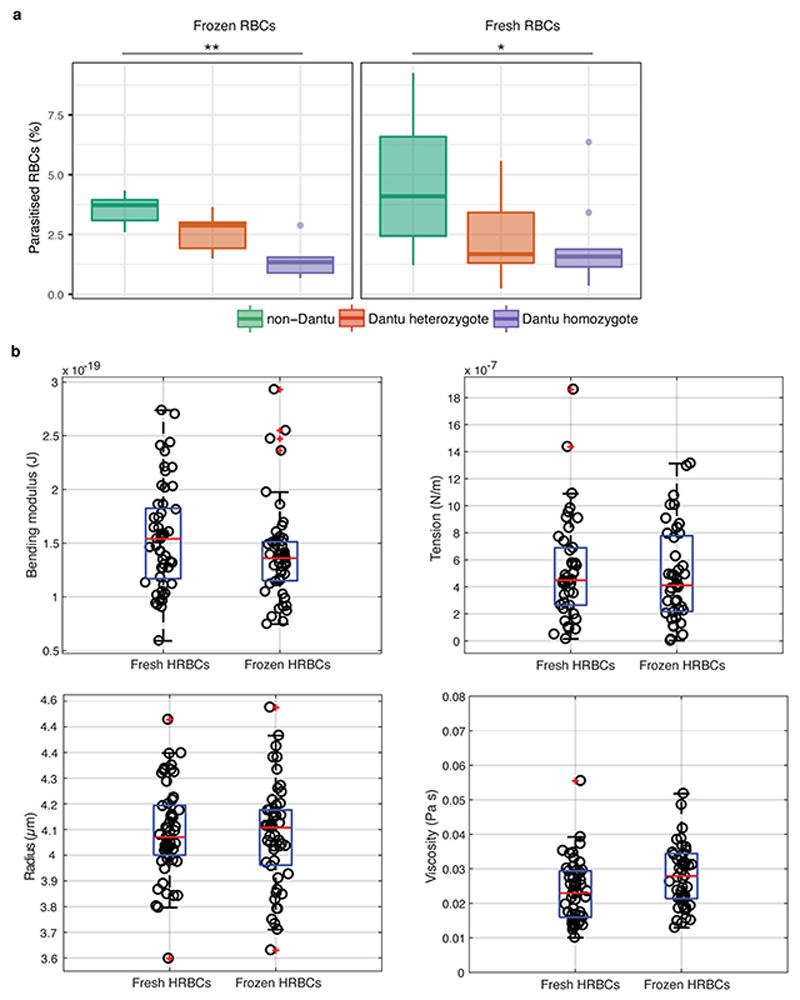
In all cases, blood was collected in EDTA-vacutainers and either used within 24h or cryopreserved using standard methods. Both fresh and frozen/thawed RBCs from Dantu homozygote, heterozygote and non-Dantu children were used in these assays, with no difference in parasite invasion efficiency being observed between them (Extended Data Fig. 8). RBCs were stained with three concentrations of CellTrace Far Red Cell Proliferation kit (Invitrogen, UK) - 1μM, 4μM and 16μM - corresponding to the three genotype groups. After a 2h incubation at 37°C under rotation, the stained RBCs were washed and resuspend to 2% Haematocrit (Hct) with complete medium. The cells were stored at 4°C until use for up to 24h after staining. To evaluate the preference of the parasites to invade RBCs of different Dantu genotype, parasite cultures containing mostly ring forms at 2-5% parasitaemia were pooled with equal volumes of RBCs from each genotype group (25μl pRBCs, 25μl Dantu homozygote RBCs, 25μl Dantu heterozygote RBCs and 25μl non-Dantu RBCs) in the same well in 96-well plates. To evaluate whether the different concentrations of the dye could affect parasite growth, parasite cultures were mixed with stained RBCs from each genotype group in individual wells in a 1:1 ratio (50μl pRBCs + 50μl stained RBCs), while normal parasite growth controls were also evaluated by mixing parasite cultures with unstained RBCs from each genotype group in individual wells in a 1:1 ratio (50μl pRBCs + 50μl unstained RBCs). The samples were incubated for 48h at 37°C under static conditions as described above. After 48h, the cultures were treated with 0.5 mg/mL ribonuclease A (Sigma Aldrich, UK) in PBS for 1h at 37°C to remove any trace of RNA. To evaluate all parasitised RBCs, the cells were stained with 2× SYBR Green I DNA dye (Invitrogen, Paisley, UK) in PBS for 1 h at 37°C. Stained samples were examined with a 488nm blue laser, and a 633nm red laser on a BD FACS Canto flow cytometer (BD Biosciences, Oxford, UK). SYBR Green I was excited by a blue laser and detected by a 530/30 filter. CellTrace Far Red was excited by a red laser and detected by a 660/20 filter. BD FACS Diva software (BD Biosciences, Oxford, UK) was used to collect 50,000 events for each sample. The data collected were then further analysed with FlowJo (Tree Star, Ashland, Oregon) to obtain the percentage of parasitised RBCs within each genotype group. Statistical analyses were performed using R statistical software (version 3.3.3), where differences in invasion across the three Dantu genotype groups were evaluated using a one-way ANOVA test, while pairwise comparisons between genotype groups were evaluated using the Tukey HSD test. All experiments were carried out in triplicate and the data are presented as the median and interquartile ranges of invasion data across samples within each genotype group.
Live invasion imaging
All live imaging assays were performed blind to the Dantu genotype group. Highly concentrated (97-100%) infected cells (strain 3D7) were isolated by magnetic separation (LD columns, Miltenyi Biotec, UK) directly before the experiments and resuspended in complete medium either with Dantu or non-Dantu RBCs at 0.2 % Hct. The Dantu and non-Dantu RBCs suspensions were loaded in separate SecureSeal Hybridization Chambers (Sigma-Aldrich) and imaging was performed at the same time by employing 3 microscopes in order to guarantee the same conditions throughout the experiments. Each sample was recorded for about 2 hours to enable recording of a sufficient number of events. A custom-built temperature control system was used to maintain the optimal culture temperature of 37°C while running these experiments. Samples were placed in contact with a transparent glass heater driven by a PID temperature controller in a feedback loop with the thermocouple attached to the glass slide. A Nikon Eclipse Ti-E inverted microscope (Nikon, Japan) was used with a Nikon 60X Plan Apo VC N.A. 1.40 oil immersion objective, kept at physiological temperature through a heated collar. Motorised functions of the microscope were controlled via custom software written in-house and focus was maintained throughout the experiments using the Nikon “Perfect Focus system”. Images were acquired in bright-field with red filter using a CMOS camera (model GS3-U3-23S6M-C, Point Grey Research/FLIR Integrated Imaging Solutions (Machine Vision), Ri Inc., Canada) at a frame rate of 4 fps, with pixel size corresponding to 0.0986 μm. We recorded one video for each egress-invasion event, from a few minutes before schizont rupture until the end of echinocytosis, around 20 minutes after egress. For each video, the duration of all the phases of an invasion process was assessed by two scientists independently, according to the following definitions of intervals: (i) ‘preinvasion’ the time from the first evident contact between merozoite and RBC, throughout RBC deformation and subsequent resting; (ii) ‘invasion’ from the beginning of merozoite penetration of RBC throughout its complete internalisation until the beginning of echinocytosis; and finally (iii) ‘echinocytosis’ from the first curling of the RBC edge to the recovery of its normal biconcave shape. Our measurements of invasion time are slightly longer than previous studies, which did not include the resting time from the end of parasite internalisation to the start of echinocytosis in their assessment of invasion time10,31. The parasite invasion efficiency or proportion of invasion has been quantified as the fraction of merozoites that contacted and successfully invaded RBCs divided by the number of all merozoites that contacted nearby RBCs post-egress, expressed as a percentage. This definition took into account the fact that in a chamber, we can have multiple invasions when more merozoites invade the same RBC. The degree to which merozoites deformed RBCs during invasion was given by a simplified four-point deformation scale (0, 1, 2, and 3), based on the most extreme degree of deformation achieved10. The visual assessment was done independently by two different experimentalists who were blinded to the genotypes of the RBCs in each video. We analysed six different RBC samples per genotype group, with data from 3 technical replicates. The total number of RBCs contacted by merozoites were: 155 for non-Dantu, 191 for Dantu heterozygotes, and 233 for Dantu homozygotes. The total number of successfully invaded cells were: 53 for non-Dantu, 43 for Dantu heterozygotes, and 41 for Dantu-homozygotes. The contact region between the merozoite and the RBC surface when the parasite deforms the host cell at its maximum was measured for 20 RBCs with both very high and very low tension from three different samples. Image thresholding filters (ImageJ) were used to distinguish the parasite and RBC contours from videos taken in bright-field at 100 fps. Only when merozoites were poised laterally to the RBC the thresholding process accurately identified them, and therefore only lateral invasions as in Fig. 3d were taken into account for this analysis. Both successful and failed invasions were considered, but as already reported in Fig. 3c, most RBCs with lower tension undergo a successful invasion, and vice versa.
Optical tweezers
The optical tweezers are built within the same Nikon inverted microscope used for imaging and consist of a solid-state pumped Nd:YAG laser (IRCL-2W-1064; CrystaLaser, Reno, NV) having 2W optical output at a wavelength of 1064 nm. The laser beam was steered via a pair of acousto-optical deflectors (AA Opto-Electronic, Orsay, France) controlled by custom-built electronics that allow multiple trapping with subnanometer position resolution. Videos were taken at 60 fps through a 60X Plan Apo VC 1.20 NA water objective (Nikon) with pixel size corresponding to 0.0973 μm. Dantu and non-Dantu RBCs were suspended in complete medium at 0.05 % Hct with purified schizonts and loaded in separate chambers coated with 10 μl solution of poly(l-lysine)-graft-poly(ethylene glycol) (PLL-g-PEG) (SuSoS AG, Dübendorf, Switzerland) at 0.5 mg/mL concentration and incubated for 30 minutes to prevent excessive adherence of cell proteins onto the coverslip. Adhesive forces at the merozoite-erythrocyte interface were quantified by evaluating the elastic morphological response of the erythrocyte as it resisted merozoite detachment9. Immediately after schizont egress, merozoites were manipulated by optical trapping and delivered to the surface of uninfected erythrocytes until attachment. Trapping durations were kept short (< 10 seconds) to minimise any possible detrimental effect of local heating: at full laser power, a few degrees Celsius of heating are expected locally around the laser beam focus. Then a second red blood cell was delivered close to the merozoite to form an erythrocyte-merozoite-erythrocyte system9. Erythrocyte maximal elongation before detachment was measured by pulling away the erythrocyte that adheres to the merozoite from their point of attachment, while the opposing force, on a second erythrocyte of our system, is given by either a second optical trap or by adhesion to the bottom of the sample chamber. We do not pull on the merozoite directly because this force would be weak and difficult to calibrate. Finally, because erythrocytes are known to behave mechanically as a linear spring in this regime32, the merozoite-erythrocyte adhesive forces were calculated by multiplying the erythrocyte end-to-end elongation before detachment and the stiffness of the erythrocyte cell. The experimentalist was blinded to the RBC genotype group.
Characterization of RBC membrane by flow cytometry
A panel of antibodies was selected against the 11 antigens that have been confirmed to be or could be potentially involved in cell adhesion and parasite invasion. Each blood sample was diluted at 0.5% haematocrit, washed twice with PBS and incubated in primary mouse monoclonal antibodies for 1h at 37°C. Antibodies used: anti-CD35-APC (CR1, Thermofisher, 1:50); antiCD44-BRIC 222-FITC (1:100, IBGRL); Integrin: anti-CD49d-APC (1:50, Milteny Biotec); anti-CD55-BRIC-216-FITC (1:500, IBGRL); Transferrin R: anti- CD71-FITC (1:100, ThermoFisher); Basigin: anti-CD147-FITC (1:100, ThermoFisher); Band3: anti-CD233-BRIC6-FITC (1:1000, IBGRL); Duffy antigen: anti-CD234-APC (1:100, Milteny Biotec); GYPA: CD235a-BRIC 256-FITC (1:1000, IBGRL); GYPC: anti-CD236R-BRIC10-FITC (1:1000, IBGRL). For detection of GYPB, first cells were incubated with an anti-GYPB (1:100, rabbit polyclonal antibody, Abcam), then washed twice with PBS and then incubated with a goat-anti-rabbit AlexFluor488 labelled antibody. After incubation, cells were washed twice in PBS and analyzed on a BD FACS Canto flow cytometer. Data were analyzed using FlowJo Software (Treestar, Ashland, Oregon). Statistical analyses to test differences in RBC membrane surface expression across genotype groups were performed using R statistical software (version 3.3.3).
Erythrocyte plasma membrane profiling
Plasma membrane profiling was performed as previously described13. Briefly, three of each Dantu genotype RBC samples were washed with PBS. Surface sialic acid residues were oxidized with sodium meta-periodate (Thermo) then biotinylated with aminooxy-biotin (Biotium). After quenching, cells were incubated in 1% Triton X-100 lysis buffer. Biotinylated glycoproteins were enriched with high affinity streptavidin agarose beads (Pierce) and washed extensively. Captured protein was denatured with DTT, alkylated with iodoacetamide (IAA, Sigma) and digested on-bead with trypsin (Promega) in 200 mM HEPES pH 8.5 for 3h. Tryptic peptides were collected and labelled using TMT reagents. The reaction was quenched with hydroxylamine, and TMT-labelled samples combined in a 1:1:1:1:1:1:1:1:1 ratio. Labelled peptides were enriched, desalted, and 80% of the combined sample separated into twelve fractions using high pH reversed phase HPLC as previously described33. 100% of six fractions in addition to 50% of the remaining unfractionated sample were subjected to mass spectrometry.
Mass spectrometry data were acquired using an Orbitrap Fusion Lumos (Thermo Fisher Scientific, San Jose, CA) interfaced via an EASYspray source to an Ultimate 3000 RSLC nano UHPLC. Peptides were loaded onto a 100 μm ID × 2 cm Acclaim PepMap nanoViper precolumn (Thermo Fisher Scientific) and resolved using a 75 μm ID × 50 cm 2 μm particle PepMap RSLC C18 EASYspray column. Loading solvent was 0.1% FA, analytical solvent A: 0.1% FA and B: 80% MeCN + 0.1% FA. All separations were carried out at 40°C. Samples were loaded at 5 μL/minute for 5 minutes in loading solvent before beginning the analytical gradient. The following gradient was used: 3-7% solvent B over 2 minutes, 7-37% solvent B over 173 minutes, followed by a 4 minute wash at 95% solvent B and equilibration at 3% solvent B for 15 minutes. Each analysis used a MultiNotch MS3-based TMT method34. The following settings were used: MS1: 380-1500 Th, 120,000 Resolution, 2×10⁵ automatic gain control (AGC) target, 50 ms maximum injection time. MS2: Quadrupole isolation at an isolation width of m/z 0.7, CID fragmentation (normalised collision energy (NCE) 35) with ion trap scanning in turbo mode from m/z 120, 1.5×10⁴ AGC target, 120 ms maximum injection time. MS3: In Synchronous Precursor Selection mode the top 10 MS2 ions were selected for HCD fragmentation (NCE 65) and scanned in the Orbitrap at 60,000 resolution with an AGC target of 1×10⁵ and a maximum accumulation time of 150 ms. Ions were not accumulated for all parallelisable time. The entire MS/MS/MS cycle had a target time of 3 s. Dynamic exclusion was set to +/− 10 ppm for 70 s. MS2 fragmentation was triggered on precursors 5×10³ counts and above.
Mass spectrometry data analysis
Mass spectra were processed using a Sequest-based software pipeline for quantitative proteomics, “MassPike”, through a collaborative arrangement with Professor Steven Gygi’s laboratory at Harvard Medical School. MS spectra were converted to mzXML using an extractor built upon Thermo Fisher’s RAW File Reader library (version 4.0.26). In this extractor, the standard mzxml format has been augmented with additional custom fields that are specific to ion trap and Orbitrap mass spectrometry and essential for TMT quantitation. These additional fields include ion injection times for each scan, Fourier Transform-derived baseline and noise values calculated for every Orbitrap scan, isolation widths for each scan type, scan event numbers, and elapsed scan times. This software is a component of the MassPike software platform and is licensed by Harvard Medical School.
A combined database was constructed from the human Uniprot database (26th January, 2017) and common contaminants such as porcine trypsin and endoproteinase LysC. The combined database was concatenated with a reverse database composed of all protein sequences in reversed order. Searches were performed using a 20 ppm precursor ion tolerance. Fragment ion tolerance was set to 1.0 Th. TMT tags on lysine residues and peptide N termini (229.162932 Da) and carbamidomethylation of cysteine residues (57.02146 Da) were set as static modifications, while oxidation of methionine residues (15.99492 Da) was set as a variable modification.
To control the fraction of erroneous protein identifications, a target-decoy strategy was employed37. Peptide spectral matches (PSMs) were filtered to an initial peptide-level false discovery rate (FDR) of 1% with subsequent filtering to attain a final protein-level FDR of 1%. PSM filtering was performed using a linear discriminant analysis, as described previously35. This distinguishes correct from incorrect peptide IDs in a manner analogous to the widely used Percolator algorithm (https://noble.gs.washington.edu/proj/percolator/), though employing a distinct machine learning algorithm. The following parameters were considered: XCorr, ΔCn, missed cleavages, peptide length, charge state, and precursor mass accuracy.
Protein assembly was guided by principles of parsimony to produce the smallest set of proteins necessary to account for all observed peptides (algorithm described in35. Proteins were quantified by summing TMT reporter ion counts across all matching peptide-spectral matches using “MassPike”, as described previously34. Briefly, a 0.003 Th window around the theoretical m/z of each reporter ion (126, 127n, 127c, 128n, 128c, 129n, 129c, 130n, 130c, 131n, 131c) was scanned for ions, and the maximum intensity nearest to the theoretical m/z was used. The primary determinant of quantitation quality is the number of TMT reporter ions detected in each MS3 spectrum, which is directly proportional to the signal-to-noise (S:N) ratio observed for each ion. Conservatively, every individual peptide used for quantitation was required to contribute sufficient TMT reporter ions (minimum of ~1250 per spectrum) so that each on its own could be expected to provide a representative picture of relative protein abundance34. An isolation specificity filter with a cutoff of 50% was additionally employed to minimise peptide co-isolation34. Peptide-spectral matches with poor quality MS3 spectra (more than 8 TMT channels missing and/or a combined S:N ratio of less than 250 across all TMT reporter ions) or no MS3 spectra at all were excluded from quantitation. Peptides meeting the stated criteria for reliable quantitation were then summed by parent protein, in effect weighting the contributions of individual peptides to the total protein signal based on their individual TMT reporter ion yields. Protein quantitation values were exported for further analysis in Excel.
Proteins were filtered to include those most likely to be present at the cell surface with high confidence. These comprised proteins with Uniprot Subcellular Location (www.uniprot.org) terms matching ‘Multipass’, ‘GPI anchored’, ‘Lipid Anchored’, ‘Type I transmembrane’, ‘Type II transmembrane’, ‘Type III transmembrane’, ‘Type IV transmembrane’, and those predicted to have transmembrane regions based on TMHMM version 2.036.
For protein quantitation, reverse and contaminant proteins were removed. Despite extensive washing of biotinylated proteins when bound to Streptavidin beads, variable levels of contamination with abundant haemoglobin components were nevertheless detectable. As opposed to normalisation assuming equal protein loading across all channels, normalisation was instead performed from the summed signal:noise values of all proteins passing the filter described above. For further analysis and display in figures, only these filtered proteins are displayed. For Fig. 2c and Extended Data Fig. 4b, fractional TMT signals were used (i.e. reporting the fraction of maximal signal observed for each protein in each TMT channel). For Fig. 2b, fold change was calculated on the basis of (average signal:noise (Dantu homozygote) / average signal:noise (non-Dantu). For figure Extended Data Fig. 4a, fold change was calculated for each Dantu variant donor by (signal:noise (Dantu homozygote) / average signal:noise (non-Dantu).
For Fig. 2b, the method of significance A was used to estimate the p-value that each protein ratio was significantly different to 1. Values were calculated and corrected for multiple hypothesis testing using the method of Benjamini-Hochberg in Perseus version 1.5.1.637. For Extended Data Fig. 4b, two-tailed Student’s t-test values were calculated and corrected for multiple hypothesis testing using the method of Benjamini-Hochberg in Excel. Hierarchical centroid clustering based on uncentered correlation was performed using Cluster 3.0 (Stanford University) and visualised using Java Treeview (http://jtreeview.sourceforge.net).
RBC membrane contour detection and flickering spectrometry
Dantu and non-Dantu RBCs were diluted into culture medium at 0.01% Hct and loaded in different chambers to provide an optimal cell density and avoid overlapping cells. All live-cell experiments were performed at 37°C by using the setup described above. 20 second time-lapse videos were recorded at high frame rate (514 frames/s) and short exposure time (0.8 ms). The RBC contour was detected in brightfield for each frame with subpixel resolution by an optimised algorithm developed in house and implemented in Matlab (The MathWorks, Natick, MA), as described previously17 and in Supplementary Section S1. Full details of membrane fluctuation analysis are given in Supplementary Section S2. Briefly, the equatorial contour was decomposed into fluctuation modes by Fourier transforming to give a fluctuation power spectrum of mean square mode amplitudes at the cell equator 〈|h(qx,y = 0)|2〉 as a function of mode wavevector (qx). From these data, the bending modulus (k) and tension (σ) can be fitted using the following equation:
| (1) |
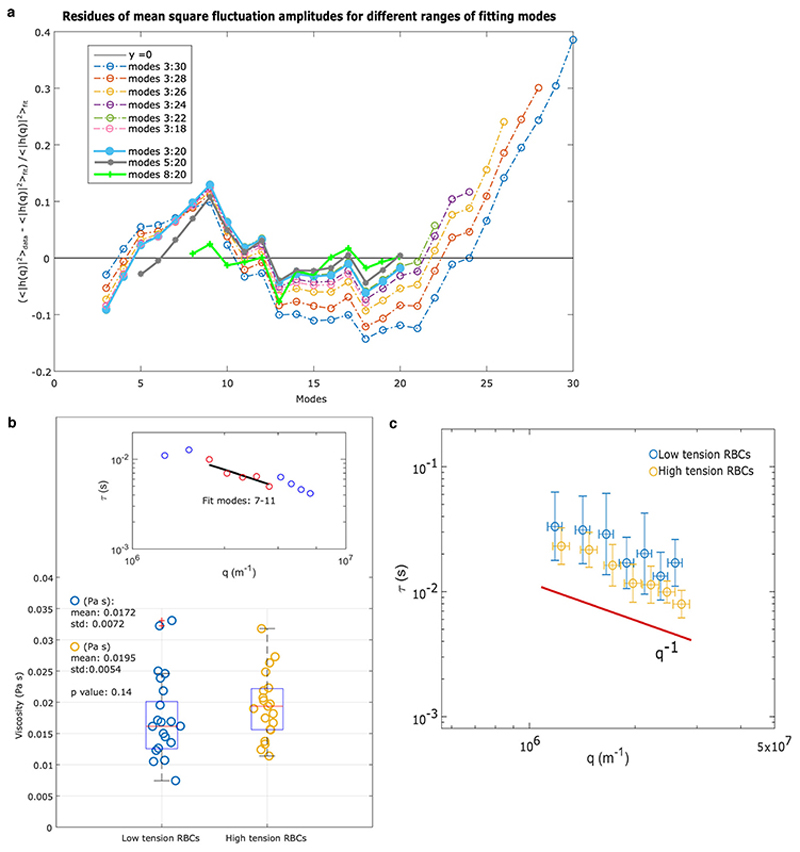
where kB is the Boltzmann constant, T is temperature, and L is mean circumference of the RBC contour. This equation derives from the energy of deforming a flat sheet38, and is a good description of shape fluctuations of the cell’s equator only in a limited range of modes. We show in Extended Data Fig. 10a, through the calculus of the residues, that mode between 8 and 20 are well described by Eq. 1. Lower modes fail due to the closed shape of a cell, whereas higher modes fail due to optical and temporal resolution. This model considers fluctuations as having thermal origin. Eq. 1 has limiting behaviours as shown in a representative fluctuation power spectrum in Supplementary Section S2: the tension term (q−1 behavior) dominates at low modes while the bending modulus term (q−3 trend) dominates at high modes of the spectrum. In the range 8-20, for the parameters of RBCs, both terms contribute to Eq.1 and so both can be resolved robustly and independently, as demonstrated in Extended Data Figs. 5 and 9. The viscosity of RBCs was quantified by measuring the dynamics of the membrane fluctuations and their relaxation time for modes 7-11 (Supplementary Section S2, Extended Data Fig. 10b). This is a further independent check confirming the static study is measuring reliable values of tension (Extended Data Fig. 10c).
Extended Data
Extended Data Figure 1. Erythrocytic cycle of malaria parasites.
Illustration of the erythrocytic stage of the malaria parasite. (a) The merozoites undergo repeated rounds of asexual multiplication, progressing through ring, trophozoite and schizont stages. (1) This cycle starts when merozoites contact, attach and successfully invade RBCs in the circulation. The invasion period lasts for less than a minute and we are only able to follow the dynamics of such a fast event with real-time live microscopy11,28. The merozoite has a slightly ovoidal shape of 1 micron in diameter and is adapted for invasion of erythrocytes. The apical end of the parasite contains secretory organelles called rhoptries and micronemes that release proteins for helping merozoite’s internalisation. In the host red cell, the parasite develops and multiplies, digesting haemoglobin, protected from immune attack. In the case of Plasmodium falciparum, the erythrocytic cycle lasts about 48 hours, and infected cells progress from (2) the ring stage (first 16 hours) throughout (3) trophozoite stage (around 16-36 hours) and, finally to (4) the schizont phase (lasts a few hours). The infected schizont then ruptures (5) releasing 15-30 daughter merozoites ready to infect new nearby red cells. In each cycle, less than 10% of parasites develop into the sexual form of the parasite called gametocytes (6). (b) Detailed illustration of the parasite invasion process into the red blood cell (1) described further in the Materials and Methods, involving the “pre-invasion” phase (contact, merozoite reorientation which triggers RBC membrane deformation, and tight attachment of the merozoite to the RBC membrane), the “invasion” phase (initiation of invasion, penetration, complete internalization of the merozoite, and resealing of the RBC membrane), and the echinocytosis phase (formation of echinocyte). Icons adapted from ©biorender.com
Extended Data Figure 2. Invasion process across Dantu genotype groups studied by timelapse video microscopy.
(a) RBC detachment force from a merozoite was measured using optical tweezers across genotype groups. RBCs attached to merozoites were pulled using optical traps, and the adhesive forces at the merozoite-RBC interface were quantified by evaluating the elastic morphological response of the RBC as it resisted merozoite detachment. Mean and standard deviation (SD) in Supplementary Table 3. Six biologically independent samples per genotype group were tested obtaining 21 events for non-Dantu, 19 for Dantu heterozygote, and 24 for Dantu homozygote. Importantly, the experimentalist was blinded to the RBC genotype group. The median is indicated by the middle red line in the boxplots, with the 25th and 75th percentiles indicated by the tops and bottoms of each plot, while whiskers denote total data range. If the median is not centered in the box, it shows sample skewness. Pairwise comparisons between genotype groups were performed using the two-sided Mann-Whitney U test. (b) The degree to which merozoites deformed RBCs during invasion was given by a simplified four-point deformation scale (0, 1, 2, and 3), based on the most extreme degree of deformation achieved (Weiss et al., PLoS Pathog 2015). The degree of deformation was compared across genotype groups with no significant difference noticed, and between successful and failed invasions. The percentage of RBCs undergoing strong deformations (score 2/3) is significantly higher in case of successful invasions, while RBCs that were contacted but not invaded experience weak deformations (score 0/1). Data from 155 cells for non-Dantu, 191 for Dantu heterozygote, and 233 for Dantu homozygote. Number of successfully invaded cells: 53 for non-Dantu, 43 for Dantu heterozygote, and 41 for Dantu-homozygote. The visual assessment was done with blinded data by two different experimentalists. (c) Successful invasions are usually followed by a reversible echinocyte phase that lasts between 5 and 11 minutes (Gilson and Crabb, Int J Parasitol, 2009), until the recovery of newly infected RBC biconcave shape. The time of echinocytosis was in agreement with literature and not significantly different across genotype groups. Data from 53 cells non-Dantu, 43 Dantu heterozygote, and 41 Dantu-homozygote.
Extended Data Figure 3. Distribution of reticulocytes and RNA concentrations across Dantu genotypes.
Reticulocyte counts, and concentrations of RNA extracted from reticulocytes, were compared across Dantu genotypes. Reticulocyte count data was tested for 8 non-Dantu, 7 Dantu heterozygotes and 7 Dantu homozygote individuals, while RNA concentrations were measured in 9 non-Dantu, 7 Dantu heterozygotes and 7 Dantu homozygote individuals. The median is indicated by the middle red line in the boxplots, with the 25th and 75th percentiles indicated by the tops and bottoms of each plot, while whiskers denote total data range.
Statistical comparison across the three genotype groups was performed using a one-way ANOVA test, while all pairwise comparisons between genotype groups were performed using the Tukey HSD test correcting for multiple pairwise comparison tests using Benjamini-Hochberg FDR. Significant differences were observed in reticulocyte count (non-Dantu vs. Dantu homozygote p=0.0023) and RNA concentrations (non-Dantu vs. Dantu homozygote p=0.0015; non-Dantu vs. Dantu heterozygote p=0.0088). ** p < 0.01; * p < 0.05.
Extended Data Figure 4. Plasma membrane profiling by tandem mass tag (TMT)-based MS3 mass spectrometry.
The impact of the Dantu polymorphism on RBC membrane protein expression levels was quantified using mass spectrometry. (a) Hierarchical cluster analysis of all proteins quantified and annotated as described in the Methods. Fold change was calculated for each donor by (signal:noise (donor) / average signal:noise (non-Dantu). (b) Proteomic quantification of markers shown in Figure 2a (3 biologically independent samples per genotype group). All markers were quantified by proteomics apart from GYPB. Statistical comparisons of quantitative protein expression across Dantu genotype groups were performed using two-tailed t-test with Benjamini-Hochberg multiple hypothesis correction: * p< 0.05, **p< 0.01. All p-values are listed in Supplementary Table 4.
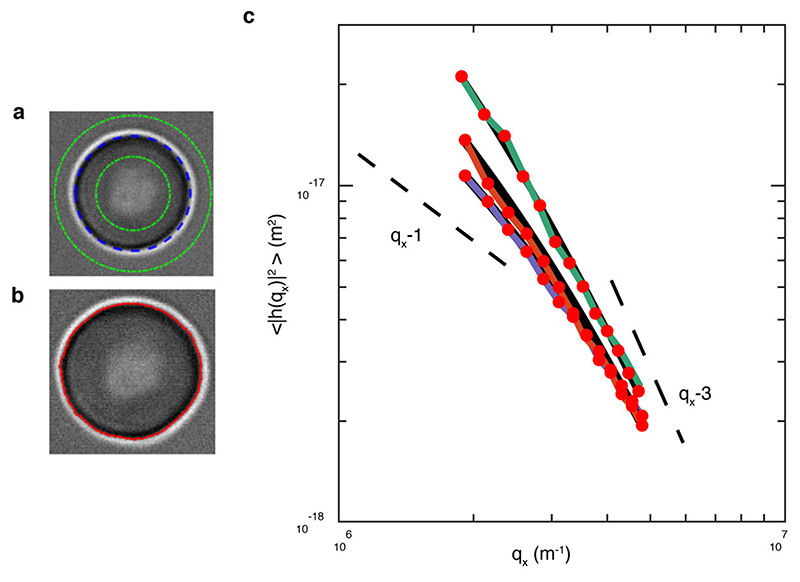
Extended Data Figure 5. Representative membrane fluctuation spectra for non-Dantu, Dantu heterozygous, and Dantu homozygous red blood cells.
Example of contour detection and flickering spectra across genotype groups. (a) Contour of the RBC (dashed blue line), with inner and outer bounds used in image analysis (green lines). (b) Contour of the RBC. (c) Mean square fluctuation amplitudes for non-Dantu (green line), Dantu heterozygote (orange line), and Dantu homozygote (purple line) RBCs. Fitted modes 8-20.
The error bars (not shown for clarity) were calculated as , where SD is the standard deviation, n total number of frames, and dt the time gap between frames.
Extended Data Figure 6. Relationship between biophysical properties in non-Dantu and Dantu homozygote RBCs.
(a) Scatter plot showing correlation between tension and radius in non-Dantu and Dantu homozygote RBCs. The shaded points in the background are all the data considered for non-Dantu (249) and Dantu (247) RBCs from six different biological replicates. The big marks in the foreground represent the mean and standard deviation in tension and radius of the six samples for non-Dantu and Dantu RBCs. There is a linear inverse relation between radius and tension, where we observe that RBCs with higher tension have lower radii. Radius change is very small (0.3 μm) and, we believe, equatorial radius decrease is due to a shape change caused by the increased tension, and the two biophysical parameters have no different fluctuation modes. (b) The impact of tension on RBC deformation during preinvasion, induced by merozoites contacting RBCs, was compared across Dantu genotype groups. RBCs having tension above the tension threshold tended to be weakly deformed (scores 0 and 1), whereas RBCs with tensions below the threshold were more strongly deformed (scores 2 and 3). Deformation scores as defined in Weiss et al. PLoS Pathog. 2015 (Reference 10 of the manuscript).
Extended Data Figure 7. Reduction of membrane tension both in non-Dantu and Dantu homozygous RBCs with phloretin.
Biophysical properties in non-Dantu (a,b) and Dantu homozygous (c,d) RBCs after phloretin treatment **p < 0.01. Phloretin treatment causes a decrease in tension without affecting bending modulus at 150 (p = 0.0015) and 200 (p = 1.72 ×10⁻⁴) μM for both non-Dantu and Dantu samples. Above 200 μM concentration of phloretin, most RBCs become crenated and cannot be used for flickering spectroscopy. Phloretin has an effect on RBC tension only when it is present in the medium, i.e. RBCs recover their normal tension when washed. (a-b) Data from about 30 cells from 3 biologically independent non-Dantu samples. (c-d) Data from 60 cells from 4 biologically independent Dantu samples. Between untreated and phloretin 150 μM (p = 0.01) and between untreated and phloretin 200 μM (p = 0.0022) using the two-sided Mann-Whitney U test.
Extended Data Figure 8. Comparing parasite invasion and biomechanical properties of frozen and fresh RBCs.
Comparison of parasite invasion efficiency and biomechanical properties in frozen vs fresh RBCs. (a) The invasion efficiency of P. falciparum laboratory strain, 3D7, was compared across frozen and fresh RBCs (n=6 frozen and n=14 non-Dantu, 12 Dantu heterozygote and 12 Dantu homozygote fresh biologically independent RBC samples per genotype group were tested). The percentage of parasitised RBCs that successfully invaded each genotype group was measured using a flow cytometry-based invasion assay. Boxplots indicate the median (middle line) and interquartile ranges (top and bottom of boxes) of the data, while whiskers denote the total data range. Statistical comparison across the three genotype groups was performed using a one-way ANOVA test, while pairwise comparisons between genotype groups were performed using the Tukey HSD test, with significant differences in 3D7 invasion observed in frozen RBCS (non-Dantu vs. Dantu homozygote p=0.001) and in fresh RBCs (non-Dantu vs. Dantu homozygote p=0.001). **p < 0.01; *p < 0.05. (b) Membrane flickering spectrometry enabled measurement of RBC biomechanical properties (bending modulus, tension, radius, and viscosity) of fresh (n = 53) and frozen (n = 51) RBCs from the same donor. No statistically significant differences were detected between the two conditions for all the measured biophysical properties. Pairwise comparisons were performed using the two-sided Mann-Whitney U test; p Bending modulus = 0.1, p Tension = 0.6, p Radius = 0.7, p Viscosity = 0.6.
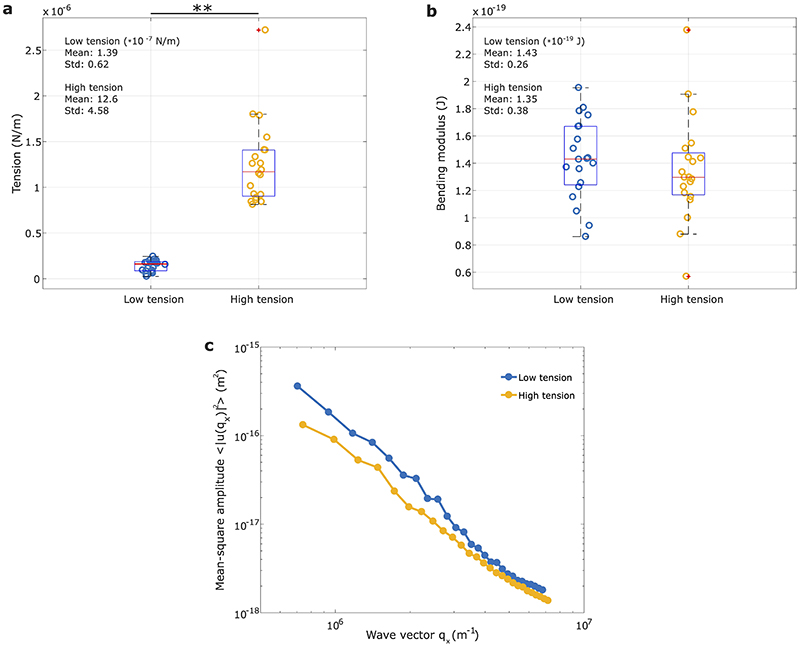
Extended Data Figure 9. Decoupling tension and bending modulus with flickering analysis.
To test our ability to decouple tension and bending modulus from our data through the flickering analysis, we have taken the 20 highest tension and the 20 lowest tension cells from our database and shown that on analysing the fluctuation power spectra of these, which cover a wide enough range of q-values that both tension and bending moduli can be robustly extracted. (a-b) Boxplots for the tensions and bending moduli of the 20 cells with extreme high and extreme low tensions. While there is an obvious significant difference in tension (p=4.0302 × 10⁻¹³, two-sided Mann-Whitney U test), bending modulus is similar. (c) This is also evident from the overlapping of the two spectra for the high modes where a bending-dominated regime prevails, whereas the divergence of the fluctuation amplitudes between the two spectra becomes noticeable when tension predominates. Each mean-square fluctuation spectrum is obtained averaging all 20 fluctuation spectra for both low (blue) and high (yellow) tension cells. Since tension dominates low modes (q−1 behavior) and bending modulus dominates high modes of the spectra (q−3 trend), the decoupling between tension and bending modulus becomes evident from these two spectra (Extended Data Section S2).
Extended Data Figure 10. Membrane flickering spectroscopy amplitude analysis.
(a) To justify our choice of modes for fitting Eq. S4, we calculated the residuals of mean square fluctuation amplitudes at different ranges of modes for the same RBC. The figure shows that the residues derived from fitting modes above 20 increase steadily, suggesting a systematic error in fitting modes above 20. Our range of modes (8-20) seems the most convincing range, as well as range 5-20, with no systematic deviations.
By studying the dynamics of modes it is possible to extract the viscosity of the cell interior, and this analysis can be used as further proof of the method. From the timescale of decorrelation of mode amplitudes, it is possible to obtain the viscosity of the RBC interior, using the values of tension and bending modulus obtained from the static spectrum of the same cell. This is achieved by fitting the relaxation time with Eq. S7. The viscosity is statistically the same, across the non-Dantu and Dantu groups which have statistically different tension values. This is thus a further independent check confirming the static study is measuring tension values reliably. (b) The viscosities of RBCs with extreme low and high tension are not significantly different (p value=0.14, two-sided Mann-Whitney U test). The fit in the inset shows data from one of the RBCs in the sample. (c) The relaxation times, plotted vs qx, modes 5-11, are represented for both the low- and high-tension RBCs; the trend is 1/q consistent with the limiting behaviour of Eq. S7 for . The range of modes that can be studied dynamically is limited by the camera acquisition rate, as well as by the other factors that limit also the static analysis.
Supplementary Material
Acknowledgements
We thank Emmanuel Mabibo, Jacob Golijo, Alphonse Kazungu, Ruth Mwarabu, the staff of Kilifi County Hospital and the KEMRI-Wellcome Trust Research Programme, Kilifi, for their help with participant recruitment, data and sample collection, and to Ellen Leffler and Gavin Band for discussions on the study. We also thank the study participants and their parents for agreeing to participate in this study. JCR, AM and DK were supported by the Wellcome Trust (206194/Z/17/Z). We acknowledge Virgilio Lew and Teresa Tiffert for generous provision of fresh blood and useful discussions. MPW is funded by a Wellcome Senior Fellowship (108070). TNW is funded through Fellowships awarded by the Wellcome Trust (091758 and 202800). SNK is supported by the Wellcome Trust-funded Initiative to Develop African Research Leaders (IDeAL) early-career postdoctoral fellowship (107769/Z/10/Z), supported through the DELTAS Africa Initiative (DEL-15-003). The Wellcome Trust provides core support to The KEMRI/Wellcome Trust Research Programme, Kilifi, Kenya (084535), Wellcome Sanger Institute, Cambridge, UK (206194/Z/17/Z) and the Wellcome Centre for Human Genetics, Oxford, UK (090532/Z/09/Z, 203141). PC is supported by the Engineering and Physical Sciences Research Council (EPSRC) (EP/R011443/1), and VI is supported by the EPSRC and the Sackler fellowship. This paper is published with permission from the Director of KEMRI.
Footnotes
Author Contributions:
SNK, AMM, VI, BJR, YCL, MPW, PC, TNW and JCR conceived and planned the experiments. SNK and AMM carried out genotyping, RBC preference invasion and antibody characterization of RBC by flow cytometry; while VI and YCL performed live video imaging. VI carried out optical tweezers and erythrocyte membrane contour detection and flickering spectrometry. BJR performed the erythrocyte plasma membrane profiling. Each of the authors analysed the corresponding experiments. AM, JM, MT, and WN contributed to sample preparation and genotyping. JK, MC, JAR, KR and DK contributed to the interpretation of the results. All authors provided critical feedback and helped shape the research, analysis and manuscript.
Author Information:
All the authors declare neither financial nor non-financial competing interests.
Data Availability
The authors declare that the data supporting the findings of this study are available within the manuscript and its Supplementary Information files.
References
- 1.MalariaGEN. Insights into malaria susceptibility using genome-wide data on 17,000 individuals from Africa, Asia and Oceania. Nat Commun. 2019;10(1) doi: 10.1038/s41467-019-13480-z. 5732. [DOI] [PMC free article] [PubMed] [Google Scholar]
- 2.Williams TN. Gaur D, CECaVSC, editor. Host genetics. Advances in Malaria Research. 2016 [Google Scholar]
- 3.Band G, Rockett KA, Spencer CC, Kwiatkowski DP. A novel locus of resistance to severe malaria in a region of ancient balancing selection. Nature. 2015;526(7572):253–257. doi: 10.1038/nature15390. [DOI] [PMC free article] [PubMed] [Google Scholar]
- 4.Ndila CM, Uyoga S, Macharia AW, et al. Human candidate gene polymorphisms and risk of severe malaria in children in Kilifi, Kenya: a case-control association study. Lancet Haematol. 2018 doi: 10.1016/S2352-3026(18)30107-8. [DOI] [PMC free article] [PubMed] [Google Scholar]
- 5.Leffler EM, Band G, Busby GBJ, et al. Resistance to malaria through structural variation of red blood cell invasion receptors. Science. 2017;356(6343) doi: 10.1126/science.aam6393. [DOI] [PMC free article] [PubMed] [Google Scholar]
- 6.Sim BK, Chitnis CE, Wasniowska K, Hadley TJ, Miller LH. Receptor and ligand domains for invasion of erythrocytes by Plasmodium falciparum. Science. 1994;264(5167):1941–1944. doi: 10.1126/science.8009226. [DOI] [PubMed] [Google Scholar]
- 7.Mayer DC, Cofie J, Jiang L, et al. Glycophorin B is the erythrocyte receptor of Plasmodium falciparum erythrocyte-binding ligand, EBL-1. Proc Natl Acad Sci U S A. 2009;106(13):5348–5352. doi: 10.1073/pnas.0900878106. [DOI] [PMC free article] [PubMed] [Google Scholar]
- 8.Theron M, Cross N, Cawkill P, Bustamante LY, Rayner JC. An in vitro erythrocyte preference assay reveals that Plasmodium falciparum parasites prefer Type O over Type A erythrocytes. Sci Rep. 2018;8(1) doi: 10.1038/s41598-018-26559-2. 8133. [DOI] [PMC free article] [PubMed] [Google Scholar]
- 9.Crick AJ, Theron M, Tiffert T, Lew VL, Cicuta P, Rayner JC. Quantitation of malaria parasite-erythrocyte cell-cell interactions using optical tweezers. Biophys J. 2014;107(4):846–853. doi: 10.1016/j.bpj.2014.07.010. [DOI] [PMC free article] [PubMed] [Google Scholar]
- 10.Weiss GE, Gilson PR, Taechalertpaisarn T, et al. Revealing the sequence and resulting cellular morphology of receptor-ligand interactions during Plasmodium falciparum invasion of erythrocytes. PLoS Pathog. 2015;11(2):e1004670. doi: 10.1371/journal.ppat.1004670. [DOI] [PMC free article] [PubMed] [Google Scholar]
- 11.Dahr W, Moulds J, Unger P, Kordowicz M. The Dantu erythrocyte phenotype of the NE variety. I. Dodecylsulfate polyacrylamide gel electrophoretic studies. Blut. 1987;55(1):19–31. doi: 10.1007/BF00319637. [DOI] [PubMed] [Google Scholar]
- 12.Maier AG, Duraisingh MT, Reeder JC, et al. Plasmodium falciparum erythrocyte invasion through glycophorin C and selection for Gerbich negativity in human populations. Nat Med. 2003;9(1):87–92. doi: 10.1038/nm807. [DOI] [PMC free article] [PubMed] [Google Scholar]
- 13.Kanjee U, Gruring C, Chaand M, et al. CRISPR/Cas9 knockouts reveal genetic interaction between strain-transcendent erythrocyte determinants of Plasmodium falciparum invasion. Proc Natl Acad Sci U S A. 2017;114(44):E9356–e9365. doi: 10.1073/pnas.1711310114. [DOI] [PMC free article] [PubMed] [Google Scholar]
- 14.Reed MB, Caruana SR, Batchelor AH, Thompson JK, Crabb BS, Cowman AF. Targeted disruption of an erythrocyte binding antigen in Plasmodium falciparum is associated with a switch toward a sialic acid-independent pathway of invasion. Proc Natl Acad Sci U S A. 2000;97(13):7509–7514. doi: 10.1073/pnas.97.13.7509. [DOI] [PMC free article] [PubMed] [Google Scholar]
- 15.Cowman AF, Tonkin CJ, Tham WH, Duraisingh MT. The Molecular Basis of Erythrocyte Invasion by Malaria Parasites. Cell Host Microbe. 2017;22(2):232–245. doi: 10.1016/j.chom.2017.07.003. [DOI] [PubMed] [Google Scholar]
- 16.Betz T, Lenz M, Joanny JF, Sykes C. ATP-dependent mechanics of red blood cells. Proc Natl Acad Sci U S A. 2009;106(36):15320–15325. doi: 10.1073/pnas.0904614106. [DOI] [PMC free article] [PubMed] [Google Scholar]
- 17.Yoon YZ, Hong H, Brown A, et al. Flickering analysis of erythrocyte mechanical properties: dependence on oxygenation level, cell shape, and hydration level. Biophys J. 2009;97(6):1606–1615. doi: 10.1016/j.bpj.2009.06.028. [DOI] [PMC free article] [PubMed] [Google Scholar]
- 18.Popescu G, Ikeda T, Goda K, et al. Optical measurement of cell membrane tension. Phys Rev Lett. 2006;97(21) doi: 10.1103/PhysRevLett.97.218101. 218101. [DOI] [PubMed] [Google Scholar]
- 19.Tiffert T, Lew VL, Ginsburg H, Krugliak M, Croisille L, Mohandas N. The hydration state of human red blood cells and their susceptibility to invasion by Plasmodium falciparum. Blood. 2005;105(12):4853–4860. doi: 10.1182/blood-2004-12-4948. [DOI] [PMC free article] [PubMed] [Google Scholar]
- 20.Sinha A, Chu TT, Dao M, Chandramohanadas R. Single-cell evaluation of red blood cell bio-mechanical and nano-structural alterations upon chemically induced oxidative stress. Sci Rep. 2015;5 doi: 10.1038/srep09768. 9768. [DOI] [PMC free article] [PubMed] [Google Scholar]
- 21.Evans E, Mohandas N, Leung A. Static and dynamic rigidities of normal and sickle erythrocytes. Major influence of cell hemoglobin concentration. J Clin Invest. 1984;73(2):477–488. doi: 10.1172/JCI111234. [DOI] [PMC free article] [PubMed] [Google Scholar]
- 22.Koch M, Wright KE, Otto O, et al. Plasmodium falciparum erythrocyte-binding antigen 175 triggers a biophysical change in the red blood cell that facilitates invasion. Proc Natl Acad Sci U S A. 2017;114(16):4225–4230. doi: 10.1073/pnas.1620843114. [DOI] [PMC free article] [PubMed] [Google Scholar]
- 23.Sisquella X, Nebl T, Thompson JK, et al. Plasmodium falciparum ligand binding to erythrocytes induce alterations in deformability essential for invasion. Elife. 2017;6 doi: 10.7554/eLife.21083. [DOI] [PMC free article] [PubMed] [Google Scholar]
- 24.Pasvol G, Weatherall DJ, Wilson RJ. The increased susceptibility of young red cells to invasion by the malarial parasite Plasmodium falciparum. Br J Haematol. 1980;45(2):285–295. doi: 10.1111/j.1365-2141.1980.tb07148.x. [DOI] [PubMed] [Google Scholar]
- 25.Mohandas N, Lie-Injo LE, Friedman M, Mak JW. Rigid membranes of Malayan ovalocytes: a likely genetic barrier against malaria. Blood. 1984;63(6):1385–1392. [PubMed] [Google Scholar]
- 26.Schrier SL, Rachmilewitz E, Mohandas N. Cellular and membrane properties of alpha and beta thalassemic erythrocytes are different: implication for differences in clinical manifestations. Blood. 1989;74(6):2194–2202. [PubMed] [Google Scholar]
- 27.Park Y, Diez-Silva M, Popescu G, et al. Refractive index maps and membrane dynamics of human red blood cells parasitized by Plasmodium falciparum. Proc Natl Acad Sci U S A. 2008;105(37):13730–13735. doi: 10.1073/pnas.0806100105. [DOI] [PMC free article] [PubMed] [Google Scholar]
- 28.Park Y, Diez-Silva M, Fu D, et al. Static and dynamic light scattering of healthy and malaria-parasite invaded red blood cells. J Biomed Opt. 2010;15(2) doi: 10.1117/1.3369966. 020506. [DOI] [PMC free article] [PubMed] [Google Scholar]
- 29.Dai J, Ting-Beall HP, Sheetz MP. The secretion-coupled endocytosis correlates with membrane tension changes in RBL 2H3 cells. J Gen Physiol. 1997;110(1):1–10. doi: 10.1085/jgp.110.1.1. [DOI] [PMC free article] [PubMed] [Google Scholar]
- 30.Lamason RL, Bastounis E, Kafai NM, et al. Rickettsia Sca4 Reduces Vinculin-Mediated Intercellular Tension to Promote Spread. Cell. 2016;167(3):670–683.e610. doi: 10.1016/j.cell.2016.09.023. [DOI] [PMC free article] [PubMed] [Google Scholar]
- 31.Gilson PR, Crabb BS. Morphology and kinetics of the three distinct phases of red blood cell invasion by Plasmodium falciparum merozoites. Int J Parasitol. 2009;39(1):91–96. doi: 10.1016/j.ijpara.2008.09.007. [DOI] [PubMed] [Google Scholar]
- 32.Yoon YZ, Kotar J, Yoon G, Cicuta P. The nonlinear mechanical response of the red blood cell. Phys Biol. 2008;5(3) doi: 10.1088/1478-3975/5/3/036007. 036007. [DOI] [PubMed] [Google Scholar]
- 33.Nightingale K, Lin KM, Ravenhill BJ, et al. High-Definition Analysis of Host Protein Stability during Human Cytomegalovirus Infection Reveals Antiviral Factors and Viral Evasion Mechanisms. Cell Host Microbe. 2018;24(3):447–460.e411. doi: 10.1016/j.chom.2018.07.011. [DOI] [PMC free article] [PubMed] [Google Scholar]
- 34.McAlister GC, Nusinow DP, Jedrychowski MP, et al. MultiNotch MS3 enables accurate, sensitive, and multiplexed detection of differential expression across cancer cell line proteomes. Anal Chem. 2014;86(14):7150–7158. doi: 10.1021/ac502040v. [DOI] [PMC free article] [PubMed] [Google Scholar]
- 35.Huttlin EL, Jedrychowski MP, Elias JE, et al. A tissue-specific atlas of mouse protein phosphorylation and expression. Cell. 2010;143(7):1174–1189. doi: 10.1016/j.cell.2010.12.001. [DOI] [PMC free article] [PubMed] [Google Scholar]
- 36.Krogh A, Larsson B, von Heijne G, Sonnhammer EL. Predicting transmembrane protein topology with a hidden Markov model: application to complete genomes. J Mol Biol. 2001;305(3):567–580. doi: 10.1006/jmbi.2000.4315. [DOI] [PubMed] [Google Scholar]
- 37.Cox J, Mann M. MaxQuant enables high peptide identification rates, individualized p.p.b.-range mass accuracies and proteome-wide protein quantification. Nat Biotechnol. 2008;26(12):1367–1372. doi: 10.1038/nbt.1511. [DOI] [PubMed] [Google Scholar]
- 38.Pecreaux J, Dobereiner HG, Prost J, Joanny JF, Bassereau P. Refined contour analysis of giant unilamellar vesicles. Eur Phys J E Soft Matter. 2004;13(3):277–290. doi: 10.1140/epje/i2004-10001-9. [DOI] [PubMed] [Google Scholar]
Associated Data
This section collects any data citations, data availability statements, or supplementary materials included in this article.
Supplementary Materials
Data Availability Statement
The authors declare that the data supporting the findings of this study are available within the manuscript and its Supplementary Information files.


