

Abstract
In this study, we have identified 876 polymorphism sites in 145 complete or partial genomes of SARS‐CoV available in the NCBI GenBank. One hundred and seventy‐four of these sites existed in two or more SARS‐CoV genome sequences. According to the sequence polymorphism, all SARS‐CoVs can be divided into three groups: (I) group 1, animal‐origin viruses (such as SARS‐CoV SZ1, SZ3, SZ13 and SZ16); (II) group 2, all viruses with clinical origin during first epidemic; and (III) group 3, SARS‐CoV GD03T0013. According to 10 special loci, group 2 again can be divided into genotypes C and T, which can be further divided into sub‐genotypes C1–C4 and T1–T4. Positive Darwinian selections were identified between any pair of these three groups. Genotype C gives neutral selection. Genotype T, however, shows negative selection. By comparing the death rates of SARS patients in the different regions, it was found that the death rate caused by the viruses of the genotype C was lower than that of the genotype T. SARS‐CoVs might originate from an unknown ancestor.
Keywords: Severe acute respiratory syndrome, SARS-CoV, Genotype, Phylogeny, Most recent common ancestor
1. Introduction
In 2002, a new infectious disease was found in the southern part of China which had high mortality and morbidity and was termed “severe acute respiratory syndrome” (SARS). It affected 8096 people and led 774 patients to death around the world, within a very short span of time [1]. Several studies have shown that SARS is caused by a new member of the coronavirus family. The SARS coronavirus (SARS‐CoV) was supposed to be transmitted from wild animals [2, 3, 4]. This hypothesis was then supported by the identification of a SARS‐CoV‐like virus in civet cats, sold in markets in south China. This isolate had more than 99% sequence identity with SARS‐CoV, indicating that the virus was recently transferred from animals to human beings [5]. However, according to a recent report there is no direct evidence that the civet cat virus is the origin of the SARS‐CoV [6]. Although unlikely, the possibility that SARS‐CoV positive animals were infected from humans cannot be formally excluded, and it was indeed reported that SARS‐CoV was transmitted from man to pig [7]. The mechanism how the pathogen broke the barrier between its natural reservoir and man is still unclear [8].
After the first SARS epidemic, there were three incidences of laboratory infections in Singapore, Taiwan and Beijing [9, 10, 11]. Furthermore, in Guangdong, China, SARS patients were observed to suffer from “mild clinical symptoms” [12]. It is therefore important to further explore the characteristics of the SARS‐CoV genome and trace the source of the epidemic.
There were several studies on SARS‐CoV phylogeny and genotyping published immediately after SARS was identified. According to 4 polymorphism sites, Ruan et al. [13] first genotyped 14 previously published SARS‐CoV genomes at the beginning of May, 2003. Subsequently, Li et al. [14] proposed genotypes of C and T in 17 SARS‐CoV genomes based on 5 polymorphism sites. Regional and international transmission types were also proposed [15, 16]. SARS‐CoV Su‐10 and CUHK‐W1 were genotyped into two different groups even though they were all isolated in Hongkong [17]. Based on the 7 loci of 44 SARS‐CoV genomes, C and T genotypes were further modified and named as the Yexin and Xiaohong genotypes [18]. According to 5 polymorphism sites, 63 SARS‐CoV genomes were divided into early, middle and late phase genotype groups [19]. The polymorphism sites analyzed in these papers were almost the same.
Three successful examples have been reported where infection chains have been traced by comparing variations in SARS‐CoV genomes. The first SARS‐CoV laboratory infection incidence was confirmed by identifying 13 variant loci in the SARS‐CoV genomes [9]. Secondly, it was found that the SARS‐CoV isolated from the patient with “mild clinical symptoms” and the SARS‐CoV (or SARS‐CoV‐like virus) isolated from animals resembled each other in the sequence encoding the spike protein [19]. This study indicates that virus‐carrying animals may be a risk for the investigator. Thirdly, sequence analysis confirmed the laboratory infection of a technician who was working with SARS‐CoV [20].
Up to date, there are already 295 complete or partial SARS‐CoV genome sequences available in GenBank. A new method of genotyping is proposed in this study. The results show that all SARS‐CoV genomes are clustered into three groups and that SARS‐CoV genomes in the second group belong to genotypes C and T. These two genotypes can be further divided into 8 sub‐genotypes. In this study we also analyzed the SARS death rate, SARS‐CoV origin, and population genetics.
2. Materials and methods
2.1. SARS‐CoV genome data
SARS‐CoV ZJ01 (Accession No. AY297028) was isolated in Zhejiang province, China [14]. Other SARS‐CoV genome sequences were downloaded from NCBI GenBank database. Two hundred and ninety‐five complete or partial SARS‐CoV genomes were searched. After removing shorter and repeated records, 101 complete genomes and 44 partial genome sequences were collected for final analysis (by September 20, 2004). The detailed information of sequences of the earliest 20 records in GenBank is shown in Table 1 and the other sequences are listed in Table S1 (Supplementary materials). The newest information about domestic and international SARS fatality rates were downloaded from Health Ministry of China (http://168.160.224.167/) and WHO websites (http://www.who.int/csr/sars/country/Table2004_04_21/en/).
Table 1.
The earliest 20 SARS‐CoV genomes available in GenBank
| Isolate | Accession No. | Length of sequence (bp) | Date of submission | Date of first release | Institute of submission |
|---|---|---|---|---|---|
| Tor2 | AY274119.3 | 29 751 | 13‐4‐2003 | 14‐4‐2003 | BCCA Genome Sciences Centre, Canada |
| BJ01 | AY278488.2 | 29 725 | 17‐4‐2003 | 21‐4‐2003 a | Academy of Military Medical Sciences, China |
| BJ02 | AY278487.3 | 29 745 | 17‐4‐2003 | 21‐4‐2003 a | Academy of Military Medical Sciences, China |
| BJ03 | AY278490.3 | 29 740 | 17‐4‐2003 | 21‐4‐2003 a | Academy of Military Medical Sciences, China |
| Urbani | AY278741.1 | 29 727 | 17‐4‐2003 | 21‐4‐2003 | CDC, Atlanta, USA |
| HKU‐398849 | AY278491.2 | 29 742 | 17‐4‐2003 | 18‐4‐2003 | University of Hong Kong |
| CUHK‐W1 | AY278554.2 | 29 736 | 17‐4‐2003 | 18‐4‐2003 | Chinese University of Hong Kong |
| GD01 | AY278489.2 | 29 757 | 17‐4‐2003 | 21‐4‐2003 a | Academy of Military Medical Sciences, China |
| BJ04 | AY279354.2 | 29 732 | 19‐4‐2003 | 23‐4‐2003 a | Academy of Military Medical Sciences, China |
| CUHK‐Su10 | AY282752.1 | 29 736 | 24‐4‐2003 | 7‐5‐2003 | Chinese University of Hong Kong |
| Sin2500 | AY283794.1 | 29 711 | 27‐4‐2003 | 9‐5‐2003 | Genome Institute of Singapore |
| Sin2677 | AY283795.1 | 29 705 | 27‐4‐2003 | 9‐5‐2003 | Genome Institute of Singapore |
| Sin2679 | AY283796.1 | 29 711 | 27‐4‐2003 | 9‐5‐2003 | Genome Institute of Singapore |
| Sin2748 | AY283797.1 | 29 706 | 27‐4‐2003 | 9‐5‐2003 | Genome Institute of Singapore |
| Sin2774 | AY283798.1 | 29 711 | 27‐4‐2003 | 9‐5‐2003 | Genome Institute of Singapore |
| TW1 | AY291451.1 | 29 729 | 6‐5‐2003 | 14‐5‐2003 | Taiwan University |
| Frankfurt1 | AY291315.1 | 29 727 | 6‐5‐2003 | 16‐3‐2004 b | University of Wuerzburg, Germany |
| ZJ01 | AY297028.1 | 29 715 | 12‐5‐2003 | 19‐5‐2003 | Zhejiang CDC, China |
| TWC | AY321118.1 | 29 725 | 11‐6‐2003 | 26‐6‐2003 | Taiwan CDC, China |
| HSR 1 | AY323977.2 | 29 751 | 16‐6‐2003 | 24‐6‐2003 | Scientific Research Institute, Italy |
Partial sequence at the date of first release. BJ01 genome became complete in May, 2003. BJ02, BJ03, BJ04 and GZ01 became complete in June, 2003.
Date of first release not available.
2.2. Analysis platform tools and methods
The analysis platform was PC server based on P4 ultra thread technological CPU and the operating system was Windows XP. ClustalW version 1.83 was used for multiple sequence alignments. TreeView (Win32) version 1.6.6 and MEGA 2.0 were used to draw phylogenetic tree. DNASP 4.0 was used to analyze single nucleoside polymorphism. The SARS‐CoV sequences were arrayed with ClustalW program, and alignment was further manually examined and adjusted. Only those variant sequence loci that were present in at least two independent sequences were selected for further analyses [13, 18, 19]. Deletion and insertion in SARS‐CoV genomes and the neutral mutation in the spike protein gene, etc., were also estimated. The latest version (NC_004718) of the first submitted SARS‐CoV genome sequence (SARS‐CoV TOR2, AY274119) was used as the control reference.
3. Results
3.1. The distribution of single nucleotide polymorphism loci of SARS‐CoV genome
Eight hundred and seventy‐six mutation loci were identified among the 145 complete or partial SARS‐CoV genomes (the over all mutation rate was 2.94%, 876/29 751), of which 174 loci were identified in more than two genome sequences. To avoid errors that might be introduced by sequencing and cell culture passages, only the latter group of 174 loci was analyzed. Different characteristics of the polymorphism sites were found. The loci related to T mutation accounted for 60.9% (106/174), and C, A and G mutation loci accounted for 39.6% (69/174), 39.0% (68/174) and 27.0% (47/174), respectively. It was obvious that T mutation had the priority. Most of the loci, except for 7 sites, were limited to one pair of nucleotide variations. One hundred and twenty loci were transition mutations (78 CT, 42 AG), and 48 loci were transversion mutations. The ratio of transition mutations to transversion mutations was 2.5 (120/48), and 6 loci were of deletion mutation.
3.2. The distribution of deleted regions in SARS‐CoV genome
The sequence deletion in SARS‐CoV genome mainly occurred in the regions between sars7a to N protein by losing 12, 29, 30, 31, 32, 39, 49, 57, 82, 137 or 415 nt, mostly losing a 29 nt fragment in sars8b (Table 2 ).
Table 2.
The deletion and insertion locations of SARS‐CoV genomes
| No. of strain | Name | Location of genome | ||||||||||||||||||||||||||||||||
|---|---|---|---|---|---|---|---|---|---|---|---|---|---|---|---|---|---|---|---|---|---|---|---|---|---|---|---|---|---|---|---|---|---|---|
| 17 | . | . | . | . | . | . | 20371 | 25197 | 25285 | 26156 | 27066 | 27166 | 27660 | 27702 | 27744 | 27754 | 27781 | 27782 | 27806 | 27808 | 27841 | 27865 | 27866 | 27867 | 28145 | . | . | . | . | . | . | 29727 | ||
| 1 | GD69 | t | a | c | c | . | . | . | + | 1 | 0 | . | . | . | . | . | . | . | . | . | . | . | . | . | . | − | 2 | 9 | . | . | t | g | a | c |
| 1 | SinP2 | t | a | c | c | . | . | . | . | − | 6 | . | . | . | . | . | . | . | . | . | . | . | . | . | . | − | 2 | 9 | . | . | t | g | a | c |
| 4 | SinP5 … | t | a | c | c | . | . | . | . | . | − | 2 | . | . | . | . | . | . | . | . | . | . | . | . | . | − | 2 | 9 | . | . | t | g | a | c |
| 1 | Sino1‐11 | t | a | c | c | . | . | . | . | . | . | − | 3 | . | . | . | . | . | . | . | . | . | . | . | . | − | 2 | 9 | . | . | t | g | a | c |
| 1 | PUMC03 | t | a | c | c | . | . | . | . | . | . | − | 3 | . | . | . | . | . | . | . | . | . | . | . | . | − | 2 | 9 | . | . | t | g | a | c |
| 1 | TW11 | t | a | c | c | . | . | . | . | . | . | . | − | 2 | . | . | . | . | . | . | . | . | . | . | . | − | 2 | 9 | . | . | t | g | a | c |
| 1 | TWJ | t | a | c | c | . | . | . | . | . | . | . | . | − | 2 | . | . | . | . | . | . | . | . | . | . | − | 2 | 9 | . | . | t | g | a | c |
| 1 | Sin846 | t | a | c | c | . | . | . | . | . | . | . | . | . | − | 1 | 3 | 7 | . | . | . | . | . | − | 2 | 9 | . | . | t | g | a | c | ||
| 4 | LC2 … | t | a | c | c | . | . | . | . | . | . | . | . | . | . | − | 4 | 1 | 5 | . | . | . | . | t | g | a | c | |||||||
| 1 | Sin849 | t | a | c | c | . | . | . | . | . | . | . | . | . | . | . | − | 4 | 9 | . | . | . | . | . | − | 2 | 9 | . | − | |||||
| 1 | GZ‐B | − | . | . | . | . | . | . | . | . | . | . | . | − | 3 | 9 | . | . | . | . | . | − | 2 | 9 | . | . | t | g | a | c | ||||
| 1 | GZ‐C | − | . | . | . | . | . | . | . | . | . | . | . | − | 3 | 9 | . | . | . | − | 3 | 2 | − | 1 | 2 | . | t | g | a | c | ||||
| 1 | Sin852 | − | . | . | . | . | . | . | . | . | . | . | . | . | − | 5 | 7 | . | . | . | − | 2 | 9 | . | . | t | g | a | c | |||||
| 1 | Sin2677 | t | a | c | c | . | . | . | . | . | . | . | . | . | . | . | . | . | . | − | 6 | . | . | . | . | − | 2 | 9 | . | . | t | g | a | c |
| 2 | WHU … | t | a | c | c | . | . | . | . | . | . | . | . | . | . | . | . | . | . | . | − | 2 | . | . | . | − | 2 | 9 | . | . | t | g | a | c |
| 1 | Sin2748 | t | a | c | c | . | . | . | . | . | . | . | . | . | . | . | . | . | . | . | . | − | 5 | . | . | − | 2 | 9 | . | . | t | g | a | c |
| 4 | ZS‐A … | t | a | c | c | . | . | . | . | . | . | . | . | . | . | . | . | . | . | . | . | . | − | 8 | 2 | . | . | . | . | t | g | a | c | |
| 1 | GZ60 | − | . | . | . | . | . | . | . | . | . | . | . | . | . | . | . | . | . | − | 3 | 0 | . | . | . | . | t | g | a | c | ||||
| 2 | PUMC02 … | t | a | c | c | . | . | . | . | . | . | . | . | . | . | . | . | . | . | . | . | . | . | . | − | 3 | 1 | . | . | . | t | g | a | c |
| 83 | Tor2 … | t | a | c | c | . | . | . | . | . | . | . | . | . | . | . | . | . | . | . | . | . | . | . | . | − | 2 | 9 | . | . | t | g | a | c |
| 12 | GD01 … | t | a | c | c | . | . | . | . | . | . | . | . | . | . | . | . | . | . | . | . | . | . | . | . | + | 2 | 9 | . | . | t | g | a | c |
3.3. SARS‐CoV genotype and sub‐genotype
Key mutation loci are shown in Table 3 (identified by using nucleotide–nucleotide BLAST program at NEBI and Clustalw 1.83), and the phylogenetic tree of 174 loci (Fig. 1 ) showed that, according to the polymorphism sites of C9404T, C9479T, G17564T, G19838A, A21721G, C22222T, G22517A, G23823T, T27243C and C27827T, the SARS‐CoV genomes of the first epidemic can be divided into two genotypes, genotype C and T. The characteristic of the genotype C was that the genomes had at least one position with the same nucleotide as 10 loci listed above (C:C:G:G:A:C:G:G:T:C). These genomes included GD01, ZS‐C, CUHK‐W1, BJ01, BJ302‐1 and GZ‐C, etc. The characteristic of the genotype T was that the genomes must have all the 10 nucleotides of T:T:T:A:G:T:A:T:C:T. This genotype included GZ‐B, ZJ01, Sin2679, Urbani, TC1, CUHK‐AG01, Sino1‐11, TOR2 and AS, etc. These polymorphism sites were located in 5 different regions of the replicase 1A, 1B, spike protein gene, sars6 and sars8a. Except the 4th and the 7th loci that were synonymous mutations, the others were non‐synonymous mutations with amino acid changes of A/V, A/V, E/D, G/D, T/I, D/Y, P/L and R/C, respectively. It revealed the strongly biased characteristic of changes in genotypes associated with changes in phenotypes. Genotype C can be further divided into 4 sub‐genotypes. Sub‐genotype C1 had, besides the 10 sites mentioned above (Table 3), C3626T, C8559T, T22207C and G22522A loci that would distinguish them from the others. In the same way, sub‐genotype C2 had G3962A, G9448T and T19882C and sub‐genotype C4 had T9854C site. As shown in Fig. 1, the sub‐genotype C3 is a transitional one. Genotype T could also be divided into 4 sub‐genotypes, sub‐genotype T1, T2, T3 and T4. Besides the 10 common polymorphism sites shown above, they had 3, 4, 4 and 3 variant loci, respectively (Table 3). ZJ01, HSR1 and Sin2679, belonging to genotype T and with more polymorphism sites identified in their genomes, located in the midst of the phylogenetic tree (Fig. 1) and were not sub‐genotyped in this paper (Table 3). Only some genomes in both sub‐types C1 and C2 had the 29 nt fragments. SARS‐CoV genomes in sub‐type T3 lacked a region of 415 nt (Fig 1, Table 2).
Table 3.
The distribution characteristics of the key mutation loci of SARS‐CoV genomes
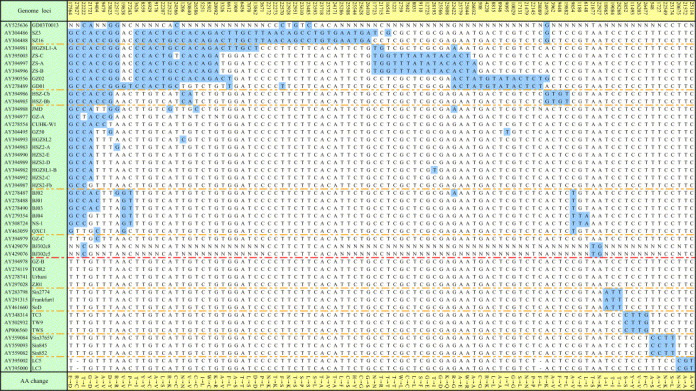
Figure 1.
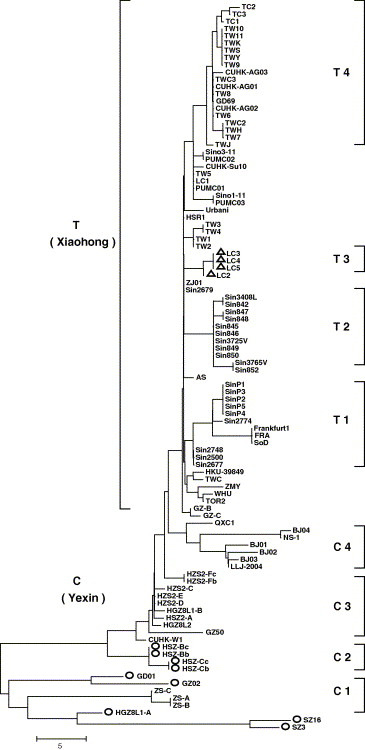
Neighbor‐joining tree for the 174 mutation sites of SARS‐CoV genomes. The tree was reconstructed based on the 174 variant sites among the genomes. Bootstrap = 1000. The length indicated number of variant sites. ○: genomes with 29 nt insert. ▵: genomes with 415 nt deletion. C: genotype C; C1–C4: sub‐genotype C1–C4; T: genotype T; T1–T4: sub‐genotype T1–T4.
3.4. Spike protein gene and complete genome phylogeny analysis
To verify the genotyping results of the 174 loci shown above, we reconstructed the phylogenetic trees of 122 spike protein genes and 101 complete genomes (Fig. 2A and B ). As can be seen in Fig. 2A, most SARS‐CoV were clustered in accordance with their genotypes. Some partial genome sequences were situated in this tree, such as CUHK‐L2, SZ1, GZ43, HSZ‐A, GD03T0013, BJ302‐1, HKU‐65806 and LY, could not be properly located in the phylogenetic tree based on 174 loci. The genomes of GZ‐C and QXC1 showed intercrossing features between genotype C and T. Some sub‐genotypes, such as C1, C2, T2 and T3, were easily recognized in the spike protein gene tree, but some sub‐genotypes were intercrossed. In the phylogenetic tree of complete genomes, the clusters of genotype C and T and 8 sub‐types are obvious (Fig. 2B). One of the reasons for this might be that the spike protein genes were less informative than the complete genomes.
Figure 2.

Neighbor‐joining trees of spike gene and complete SARS‐CoV genomes. The trees were constructed using the Kimura 2‐parameter. Bootstrap = 1000. ○: with 29 nt segments. ♦: T genotype. (A) The tree of 122 spike genes of SARS‐CoV. The length indicated number of nucleotide difference per site of spike gene. (B) The topological tree of 101 complete genomes of SARS‐CoV.
3.5. The evolutionary relationship among GD03T0013, the animal source viruses and the first epidemic SARS‐CoVs
Fig. 3 shows that the genetic distance of recent SARS‐CoV genome of GD03T0013 was closer to the first epidemic SARS‐CoV GZ02 than to the animal‐origin SARS‐CoV SZ3.
Figure 3.

Neighbor‐joining trees of newly occurred, animal‐origin and first epidemic SARS‐CoVs. (A) The tree was constructed using the Kimura 2‐parameter of nucleotide difference. Bootstrap = 1000. The length indicated number of nucleotide difference per site of the spike gene. The number of cluster point indicated bootstrap replication percent. The genetic distance of the newly occurred GD03T0013 was closer to the first epidemic GZ02 than the animal‐origin SZ3. (B) The tree was constructed using the p‐distance of nucleotide difference. Bootstrap = 1000. The number of cluster point indicated bootstrap replication percent. The FIPV‐X06170 (feline infectious peritonitis virus) was used as an out‐group within the spike gene data set. A bootscan recombination analysis of the spike gene revealed high nucleotide identity between the SARS virus and a feline infectious peritonitis virus throughout the gene [21].
3.6. Polymorphism and diversity analysis of the spike gene among the genotypes and the groups
The genetic characteristics of the genotypes were further analyzed based on the sequence polymorphism of the spike protein genes (Table 4 ). The P a/P s value was 1.047 for the polymorphism sites among the genomes of genotype C that showed neutrality or fine selection. In genotype T, non‐synonymous mutation loci decreased, and the P a/P s value was 0.230 (P < 0.05, with significant differences between the genomes), which showed negative selection in this genotype. The P s% value of synonymous mutation, which was less influenced by the general environment selection, had no significance between the two genotypes. The P s% value was one of the characteristic indices identifying the genetic relationship of the populations, and the P s% value of group 2 (C + T) was approximately half of that of the group 1 (animal source viruses, Table 4). The animal source viruses (SARS‐CoV SZ1, SZ3, SZ13 and SZ16) also showed negative selection among themselves.
Table 4.
Polymorphism and diversity analysis of the spike gene among the genotypes and the groups
| Genotype or group | No. of genomes | Polymorphism in genotype or group | Diversity | |||||||||||||
|---|---|---|---|---|---|---|---|---|---|---|---|---|---|---|---|---|
| Animal source | GD03T0013 | ZS‐B a | ||||||||||||||
| No. of genomes with non‐synonymous substitution | P a% | No. of genomes with synonymous substitution | P s% | P a/P s | P‐value | K a% | K s% | K a/K s | K a% | K s% | K a/K s | K a% | K s% | K a/K s | ||
| C | 43 | 33 | 0.177 | 7 | 0.169 | 1.047 | 0.455 | 0.602 | 0.467 | 1.289 | 0.615 | 0.456 | 1.349 | 0.206 | 0.234 | 0.880 |
| T | 73 | 15 | 0.028 | 12 | 0.122 | 0.230 | 0.019 | 0.645 | 0.525 | 1.229 | 0.645 | 0.524 | 1.231 | 0.260 | 0.297 | 0.875 |
| C + T | 116 | 46 | 0.110 | 19 | 0.151 | 0.728 | 0.301 | 0.629 | 0.503 | 1.250 | 0.634 | 0.499 | 1.271 | 0.240 | 0.274 | 0.876 |
| Animal source | 4 | 2 | 0.035 | 6 | 0.340 | 0.103 | 0.003 | – | – | – | 0.700 | 0.513 | 1.365 | 0.525 | 0.285 | 1.842 |
ZS‐B was excluded from genotype C. Diversity between genotypes C and T: K a% = 0.160, K s% = 0.169, and K a/K s = 0.947. Diversity between GD03T0013 and ZS‐B: K a% = 0.595, K s% = 0.228, and K a/K s = 2.609.
According to the phylogenetic trees based on the different data sets described above, the genetic diversities between any pair of 3 groups (the animal source viruses, the first epidemic viruses including C and T genotypes, and GD03T0013) were evaluated. The K a/K s values of each two groups were all greater than 1, showing positive Darwinian selections between these groups. On the other hand, the K a/K s values between genotype C and ZS‐B (one of the first epidemic viruses and the closest to the animal origin viruses) or between genotype T and ZS‐B were all less than 1 (1, 2A, Table 4).
All analyses described above indicated that the animal source virus and GD03T0013 virus could be classified as two relatively independent populations. 145 SARS‐CoV genome sequences could be classified into three groups, and the group 2 could further be divided into two genotypes and eight sub‐genotypes (Fig. 4 ).
Figure 4.

Distribution of SARS‐CoVs in three groups, two genotypes and eight sub‐genotypes.
3.7. Estimated timing of SARS‐CoV origin
Based on the new concept of dividing all the 145 SARS‐CoV genome sequences into three groups, the origin of group 2 and group 3 (assuming group 1 as outer source group) was estimated. Eight candidates including four animal origin genomes of group 1 identified in April to May, 2003, three early genomes of HGZ8L1‐A, ZS‐B and GZ02 in sub‐genotype C1 of group 2 in January to February, 2003, and the genome of GD03T0013 of group 3 in December, 2003, were selected to analyze the date when their most recent common ancestor was existed. Based on analysis of the diversities of spike protein genes, the synonymous mutation rate K s between group 1 and 2 was 0.00321 ± 0.00135, and the synonymous mutation rate K s between group 1 and 3 was 0.00509 ± 0.00199. Assuming that the synonymous mutation rate was constant, a linear regression analysis was evaluated. The linear equation of K s and occurrence time T is K s = 0.000171T + 0.00321 (from January, 2003, with one month intervals), and the date for the most recent common ancestor was estimated to lie in May 2002 (range between early March, 2002 and late July, 2002).
3.8. Relation between genotypes and SARS fatality rate
Information about SARS fatality rate and genotypes from all regions are shown in Table 5 . Comparing SARS fatality rates of different regions, it was found that SARS‐CoV genomes of genotype T had the highest case fatality rate.
Table 5.
Comparison of the case fatality rates and genotypes of SARS‐CoV in different regions
| Region | Cumulative number of case | Number of death | Case fatality ratio (%) | C genotype | T genotype |
|---|---|---|---|---|---|
| Mainland China | 5327 | 349 | 7 | 42 | 11 |
| Beijing | 2521 | 193 | 8 | 14 | 5 |
| Guangdong | 1512 | 58 | 4 | 26 | 3 |
| Shanghai | 8 | 2 | 25 | 2 | 1 |
| Zhejiang | 4 | 1 | 25 | 0 | 1 |
| Hubei | 7 | 1 | 14 | 0 | 1 |
| Hong Kong | 1755 | 299 | 17 | 3 | 12 |
| Singapore | 238 | 33 | 14 | 0 | 24 |
| Taiwan | 346 | 37 | 11 | 0 | 22 |
| Canada | 251 | 43 | 17 | 0 | 1 |
| Germany | 9 | 0 | 0 | 0 | 2 |
| Italy | 4 | 0 | 0 | 0 | 2 |
| Russian | 1 | 0 | 0 | 0 | 1 |
| Thailand | 9 | 2 | 22 | 0 | 1 |
| Other | 156 | 11 | 7 | 0 | 0 |
| Total | 8096 | 774 | 10 | 45 | 76 |
4. Discussion
Several studies on SARS‐CoV genome genotyping and grouping have been published [13, 14, 15, 16, 17, 18, 19]. Some presented the regional and international transmission types according to the epidemic regions and some divided the viruses into early, middle, and late phase groups according to the time of the SARS epidemic in a certain region (Guangdong of China). Based on genome characteristics of 145 SARS‐CoVs, a new concept of three groups, two genotypes and eight sub‐types was established. The genotype C of group 2 in this work was almost compatible with the regional transmission type and the early, middle phase groups, while genotype T of group 2 was compatible with the international transmission type and the late phase group as well [16, 19]. One of the advantages of the new classification is that it fits global and regional epidemic feature analysis, such as for SARS‐CoVs in Taiwan and Singapore. Up to date, all the genomes from clinical samples in the early, middle, and late phase of the SARS epidemic in these regions belonged to genotype T. The concept of dividing all SARS‐CoVs into three groups was mainly based on the phylogenetic analysis and the positive Darwinian selection. Because of the limited virus number in group 1 and 3, this grouping has to be further confirmed.
The source of SARS‐CoVs was traced. It was clear that genotype T was derived from genotype C [14, 18, 19]. The origins of each sub‐genotype were also elucidated [22, 23, 24] and are consistent with our results. But the origin of the SARS‐CoV remains a question and needs further investigation. Zhao et al. [25] analyzed 16 SARS‐CoV genomes and proposed that the closest common ancestor might have existed during the spring of 2002 which is consistent with the date, May 2002, estimated by the spike gene synonymous mutation rate of the three groups in this work. It is very probable that the three groups originated from an unknown common ancestor.
The genotype classification of SARS‐CoV plays an important role in tracing and controlling SARS prevalence. According to genome sequence variation analysis, genotype shifts of SARS‐CoVs in the main epidemic regions during the first epidemic were obvious. The sub‐genotypes C1 and C2, that have a closer relationship to the virus of animal origin, first appeared in Guangdong, and then appeared the sub‐genotype C3. The dominant viruses in HongKong were of genotype T, but genotype C also appeared there. Similarly, although sub‐genotype C4 dominated in Beijing, genotype T also existed there. In Singapore, they had all the genomes of genotypes T, mostly of sub‐genotypes T1 and T2. The viruses in Taiwan were all of genotype T, mostly of sub‐genotype T4. With more SARS‐CoV genome sequences and more complete epidemiological data released, the characteristics of the SARS‐CoV's variations in the genotypes, as well as the features about the epidemic phases, the epidemic regions, the clinical symptoms, and the viruses’ adaptation to the human host, will become clearer and clearer.
The genotype was apparently correlated with virulence of the SARS‐CoV. SARS‐CoV GD03T0013 was from the patient with “mild clinical symptoms”, and its genome sequence was similar to that of the sub‐genotype C1. Experiments have also demonstrated that SARS‐CoVs of the genotype T had a stronger ability to cause cyto‐pathogenic effects (CPE) than those of the genotype C. The CPE of the genotype T remained stable during passages in cell cultures [26]. In the first epidemic, SARS patients in Guangzhou seldom suffered from diarrhea, and the SARS‐CoV genomes were mainly of the genotype C [27]. The majority of SARS patients in Hongkong, however, suffered from diarrhea and it turned out that SARS‐CoVs of the genotype T dominated [28]. SARS‐CoVs of different genotypes might have different virulence. Moreover, the serum from mice immunized with inactivated SARS‐CoV BJ01 of genotype C is able to neutralize the invasiveness of SARS‐CoV BJ01 itself into Vero cells [29]. Further investigations are required to demonstrate whether this serum could prevent the cells from the invasiveness of the SARS‐CoV PUMC01 or others of the genotype T.
If, in the future, a SARS‐CoV epidemic appears again, after rounds of random mutations, it might cause slight clinical symptoms at the initial stage of the infection. Through positive Darwinian selection, a virus with greater virulence might cause more severe clinical symptoms. A period of neutrality selection and negative selection might follow, and different symptoms and case fatality rates might appear. On the other hand, different epidemic features might occur if there are stable intermediate hosts for SARS‐CoVs of the group 2 (such as SARS‐CoV of genotype T) after the first epidemic, and these viruses might cause epidemics in man again.
Supporting information
Table S1. Supplementary table.
Acknowledgments
We sincerely thank Charles Bernstein PhD, at Research in Medicine, University of Manitoba, Canada, for English assistance. We are grateful for the critical technical assistances supplied by Niu Yu‐Xin PhD, at James D. Watson Institute of Genome Sciences, Zhejiang University, China, and Zuyuan Xu PhD, at Research in Medicine, University of Manitoba, Canada.
Appendix A 1.
1.1.
Supplementary data associated with this article can be found, in the online version, at doi:10.1016/j.febslet.2005.07.075.
Wang Zhi-Gang,Zheng Zhi-Hua,Shang Lei,Li Lan-Juan,Cong Li-Ming,Feng Ming-Guang,Luo Yun,Cheng Su-Yun,Zhang Yan-Jun,Ru Miao-Gui,Wang Zan-Xin and Bao Qi-Yu(2005), Molecular evolution and multilocus sequence typing of 145 strains of SARS-CoV, FEBS Letters, 579, doi: 10.1016/j.febslet.2005.07.075
Contributor Information
Zhi-Gang Wang, Email: wzg188@sina.com.cn.
Qi-Yu Bao, Email: baoqy@genomics.org.cn.
References
- 1. Groneberg D.A., Zhang L., Welte T., Zabel P., Chung K.F., Severe acute respiratory syndrome: global initiatives for disease diagnosis. QJM, 96, (2003), 845– 852. [DOI] [PMC free article] [PubMed] [Google Scholar]
- 2. Peiris J.S., Lai S.T., Poon L.L., Guan Y., Yam L.Y., Lim W., Nicholls J., Yee W.K., Yan W.W., Cheung M.T., Cheng V.C., Chan K.H., Tsang D.N., Yung R.W., Ng T.K., Yuen K.Y., Coronavirus as a possible cause of severe acute respiratory syndrome. Lancet, 361, (2003), 1319– 1325. [DOI] [PMC free article] [PubMed] [Google Scholar]
- 3. Drosten C., Gunther S., Preiser W., van der Werf S., Brodt H.R., Becker S., Rabenau H., Panning M., Kolesnikova L., Fouchier R.A., Berger A., Burguiere A.M., Cinatl J., Eickmann M., Escriou N., Grywna K., Kramme S., Manuguerra J.C., Muller S., Rickerts V., Sturmer M., Vieth S., Klenk H.D., Osterhaus A.D., Schmitz H., Doerr H.W., Identification of a novel coronavirus in patients with severe acute respiratory syndrome. N. Engl. J. Med., 348, (2003), 1967– 1976. [DOI] [PubMed] [Google Scholar]
- 4. Ksiazek T.G., Erdman D., Goldsmith C.S., Zaki S.R., Peret T., Emery S., Tong S., Urbani C., Comer J.A., Lim W., Rollin P.E., Dowell S.F., Ling A.E., Humphrey C.D., Shieh W.J., Guarner J., Paddock C.D., Rota P., Fields B., DeRisi J., Yang J.Y., Cox N., Hughes J.M., LeDuc J.W., Bellini W.J., Anderson L.J., A novel coronavirus associated with severe acute respiratory syndrome. N. Engl. J. Med., 348, (2003), 1953– 1966. [DOI] [PubMed] [Google Scholar]
- 5. Guan Y., Zheng B.J., He Y.Q., Liu X.L., Zhuang Z.X., Cheung C.L., Luo S.W., Li P.H., Zhang L.J., Guan Y.J., Butt K.M., Wong K.L., Chan K.W., Lim W., Shortridge K.F., Yuen K.Y., Peiris J.S., Poon L.L., Isolation and characterization of viruses related to the SARS coronavirus from animals in southern China. Science, 302, (2003), 276– 278. [DOI] [PubMed] [Google Scholar]
- 6. Stadler K., Masignani V., Eickmann M., Becker S., Abrignani S., Klenk H.D., Rappuoli R., SARS-beginning to understand a new virus. Nat. Rev. Microbiol., 1, (2003), 209– 218. [DOI] [PMC free article] [PubMed] [Google Scholar]
- 7. Chen W., Yan M., Yang L., Ding B., He B., Wang Y., Liu X., Liu C., Zhu H., You B., Huang S., Zhang J., Mu F., Xiang Z., Feng X., Wen J., Fang J., Yu J., Yang H., Wang J., SARS-associated coronavirus transmitted from human to pig. Emerg. Infect .Dis., 11, (2005), 446– 448. [DOI] [PMC free article] [PubMed] [Google Scholar]
- 8. Antia R., Regoes R.R., Koella J.C., Bergstrom C.T., The role of evolution in the emergence of infectious diseases. Nature, 426, (2003), 658– 661. [DOI] [PMC free article] [PubMed] [Google Scholar]
- 9. Lim P.L., Kurup A., Gopalakrishna G., Chan K.P., Wong C.W., Ng L.C., Se-Thoe S.Y., Oon L., Bai X., Stanton L.W., Ruan Y., Miller L.D., Vega V.B., James L., Ooi P.L., Kai C.S., Olsen S.J., Ang B., Leo Y.S., Laboratory-acquired severe acute respiratory syndrome. N. Engl. J. Med., 350, (2004), 1740– 1745. [DOI] [PubMed] [Google Scholar]
- 10. WHO. Severe Acute Respiratory Syndrome (SARS) in Taiwan, China. 17 December 2003. Available from: <http://www.who.int/csr/don/2003_12_17/en/> .
- 11. WHO. SARS: one suspected case reported in China. 22 April 2004. Available from: <http://www.who.int/csr/don/2004_04_22/en/> .
- 12. WHO. Review of probable and laboratory-confirmed SARS cases in southern China. 27 January 2004. Available from: <http://www.who.int/csr/don/2004_01_27/en/> .
- 13. Ruan Y.J., Wei C.L., Ee A.L., Vega V.B., Thoreau H., Su S.T., Chia J.M., Ng P., Chiu K.P., Lim L., Zhang T., Peng C.K., Lin E.O., Lee N.M., Yee S.L., Ng L.F., Chee R.E., Stanton L.W., Long P.M., Liu E.T., Comparative full-length genome sequence analysis of 14 SARS coronavirus isolates and common mutations associated with putative origins of infection. Lancet, 361, (2003), 1779– 1785. [DOI] [PMC free article] [PubMed] [Google Scholar]
- 14. Li L., Wang Z., Lu Y., Bao Q., Chen S., Wu N., Cheng S., Weng J., Zhang Y., Yan J., Mei L., Wang X., Zhu H., Yu Y., Zhang M., Li M., Yao J., Lu Q., Yao P., Bo X., Wo J., Wang S., Hu S., Severe acute respiratory syndrome-associated coronavirus genotype and its characterization. Chin. Med. J., 116, (2003), 1288– 1292. [PubMed] [Google Scholar]
- 15. Gao L., Qi J., Wei H.B., Sun Y.G., Hao B.L., Molecular phylogeny of coronaviruses including human SARS-CoV. Chin. Sci. Bull., 48, (2003), 1170– 1174. [DOI] [PMC free article] [PubMed] [Google Scholar]
- 16. Qi Z., Hu Y., Li W., Chen Y.J., Zhang Z.H., Sun S.w., Lu H.C., Zhang J.F., Bu D.B., Ling L.J., Chen R.S., Phylogeny of SARS-CoV as inferred from complete genome comparison. Chin. Sci. Bull., 48, (2003), 1175– 1178. [DOI] [PMC free article] [PubMed] [Google Scholar]
- 17. Tsui S.K., Chim S.S., Lo Y.M., Coronavirus genomic-sequence variations and the epidemiology of the severe acute respiratory syndrome. N. Engl. J. Med., 349, (2003), 187– 188. [DOI] [PubMed] [Google Scholar]
- 18. Wang Z.G., Li L.J., Luo Y., Zhang J.Y., Wang M.Y., Cheng S.Y., Zhang Y.J., Wang X.M., Lu Y.Y., Wu N.P., Mei L.L., Wang Z.X., Molecular biological analysis of genotyping and phylogeny of severe acute respiratory syndrome associated coronavirus. Chin. Med. J., 117, (2004), 42– 48. [PubMed] [Google Scholar]
- 19. Chinese SARS Molecular Epidemiology Consortium, Molecular evolution of the coronavirus during the course of the SARS epidemic in China. Science, 303, (2004), 1666– 1669. [DOI] [PubMed] [Google Scholar]
- 20. Ministry of Public Health. Ministry of public health announces the investigation result of epidemic of SARS happens in Beijing, Anhui. Available from: <http://www.moh.gov.cn/dsyyw/xwfb/1200407010015.htm> .
- 21. Stavrinides J., Guttman D.S., Mosaic evolution of the severe acute respiratory syndrome coronavirus. J. Virol., 78, (2004), 76– 82. [DOI] [PMC free article] [PubMed] [Google Scholar]
- 22. Chim S.S., Tsui S.K., Chan K.C., Au T.C., Hung E.C., Tong Y.K., Chiu R.W., Ng E.K., Chan P.K., Chu C.M., Sung J.J., Tam J.S., Fung K.P., Waye M.M., Lee C.Y., Yuen K.Y., Lo Y.M., Genomic characterisation of the severe acute respiratory syndrome coronavirus of Amoy Gardens outbreak in Hong Kong. Lancet, 362, (2003), 1807– 1808. [DOI] [PMC free article] [PubMed] [Google Scholar]
- 23. Guan Y., Peiris J.S., Zheng B., Poon L.L., Chan K.H., Zeng F.Y., Chan C.W., Chan M.N., Chen J.D., Chow K.Y., Hon C.C., Hui K.H., Li J., Li V.Y., Wang Y., Leung S.W., Yuen K.Y., Leung F.C., Molecular epidemiology of the novel coronavirus that causes severe acute respiratory syndrome. Lancet, 363, (2004), 98– 104. [DOI] [PMC free article] [PubMed] [Google Scholar]
- 24. Yeh S.H., Wang H.Y., Tsai C.Y., Kao C.L., Yang J.Y., Liu H.W., Su I.J., Tsai S.F., Chen D.S., Chen P.J., Characterization of severe acute respiratory syndrome coronavirus genomes in Taiwan: molecular epidemiology and genome evolution. Proc. Natl. Acad. Sci. USA, 101, (2004), 2542– 2546. [DOI] [PMC free article] [PubMed] [Google Scholar]
- 25. Zhao Z., Li H., Wu X., Zhong Y., Zhang K., Zhang Y.P., Boerwinkle E., Fu Y.X., Moderate mutation rate in the SARS coronavirus genome and its implications. BMC Evol. Biol., 4, (2004), 1– 9. [DOI] [PMC free article] [PubMed] [Google Scholar]
- 26. Zhang X., Li H., Zheng K., Isolation, identification and the variance of a coronavirus from an imputting SARS case. Chin. J. Microbiol. Immunol., 23, (2003), 409– 413. [Google Scholar]
- 27. Zheng K., Zhang X., Zheng H.Y., Sequence analysis of the complete S gene of SARS-CoV isolated in Guangdong province. South China J. Prec. Med., 29, (2003), 5– 8. [Google Scholar]
- 28. Leung W.K., To K.F., Chan P.K., Chan H.L., Wu A.K., Lee N., Yuen K.Y., Sung J.J., Enteric involvement of severe acute respiratory syndrome-associated coronavirus infection. Gastroenterology, 1254, (2003), 1011– 1017. [DOI] [PMC free article] [PubMed] [Google Scholar]
- 29. Tang L., Zhu Q., Qin E., Yu M., Ding Z., Shi H., Cheng X., Wang C., Chang G., Zhu Q., Fang F., Chang H., Li S., Zhang X., Chen X., Yu J., Wang J., Chen Z., Inactivated SARS-CoV vaccine prepared from whole virus induces a high level of neutralizing antibodies in BALB/c mice. DNA Cell Biol., 23, (2004), 391– 394. [DOI] [PubMed] [Google Scholar]
Associated Data
This section collects any data citations, data availability statements, or supplementary materials included in this article.
Supplementary Materials
Table S1. Supplementary table.