Abstract
Most risk variants for brain disorders identified by genome-wide association studies (GWAS) reside in non-coding genome, which makes deciphering biological mechanisms difficult. A commonly used tool, MAGMA, addresses this issue by aggregating SNP associations to nearest genes. Here, we developed a platform, Hi-C coupled MAGMA (H-MAGMA), that advances MAGMA by incorporating chromatin interaction profiles from human brain tissue across two developmental epochs and two brain cell types. By employing gene regulatory relationships in the disease-relevant tissue, H-MAGMA identifies neurobiologically-relevant target genes. We applied H-MAGMA to five psychiatric disorders and four neurodegenerative disorders to interrogate biological pathways, developmental windows, and cell types implicated for each disorder. Psychiatric disorder risk genes tended to be expressed during mid-gestation and in excitatory neurons, whereas degenerative disorder risk genes showed increasing expression over time and more diverse cell-type specificities. H-MAGMA adds to existing analytic frameworks to help identify the neurobiological consequences of brain disorder genetics.
Introduction
Genome-wide association studies (GWAS) have provided insight into the genetic etiology of multiple brain disorders. However, extracting biological mechanisms from GWAS data is a challenge, largely because the majority of common risk variants reside in non-coding regions of the genome1.
Multi-marker Analysis of GenoMic Annotation (MAGMA) was initially developed to extract biological insights from GWAS by linking risk variants to their cognate genes2. It aggregates SNP associations to gene-level associations while correcting for confounding factors such as gene length, minor allele frequency, and gene density2. While MAGMA is a powerful tool and has been used broadly, there is room for improvement. MAGMA assigns SNPs to the nearest genes, which has two major pitfalls. First, it is becoming increasingly recognized that non-coding SNPs can regulate distal genes via long range (>10 kb) regulatory interactions, whereby distal enhancers are brought into contact with the gene promoter3,4. Second, MAGMA does not take into account tissue-specific regulatory relationships, whereas disease risk SNPs are enriched in regulatory elements of the disease-relevant tissue5,6.
To overcome the limitations in MAGMA, we modified MAGMA approach to create Hi-C coupled MAGMA or H-MAGMA to assign non-coding SNPs to their cognate genes based on long range interactions in disease-relevant tissues measured by Hi-C. H-MAGMA advances conventional MAGMA (hereafter referred to as cMAGMA) by incorporating relevant functional genomics evidence and allowing developmental stage and cell-type specific gene mapping. H-MAGMA also differs from traditional Hi-C guided gene mapping, as it employs the genome-wide mapping capability of MAGMA. While traditional Hi-C guided gene mapping restricts its analysis to genome-wide significant (GWS) loci7, H-MAGMA can leverage signals from sub-threshold loci that explain a significant proportion of heritability8.
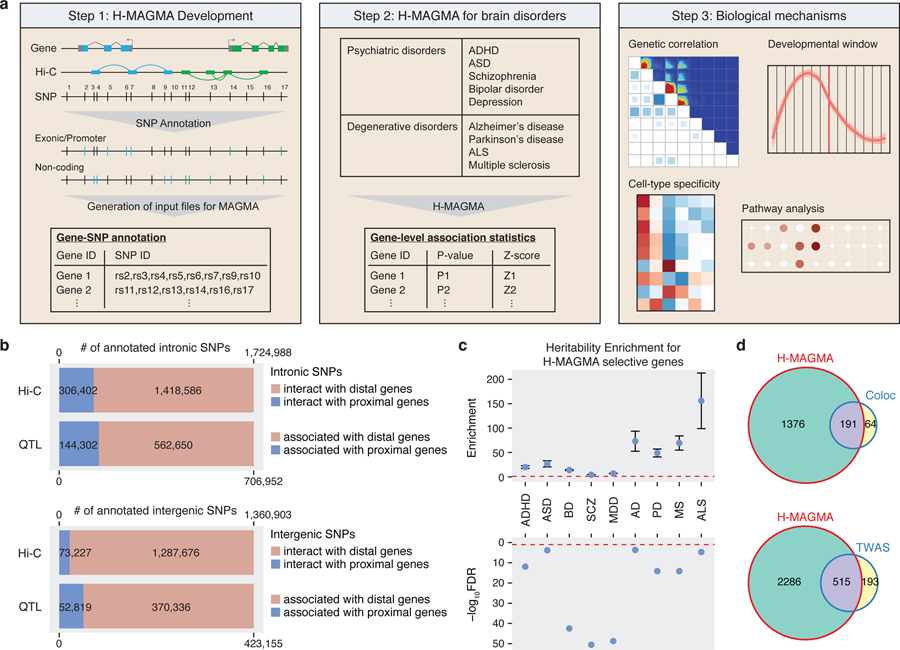
H-MAGMA was constructed from four classes of brain-derived Hi-C datasets that include human cortical tissue across two developmental stages (prenatal and postnatal) and two brain cell types (neurons and astrocytes), enabling developmental and cell-type specific gene mapping. We applied H-MAGMA to five psychiatric disorders (Attention deficit hyperactivity disorders, ADHD; Autism spectrum disorders, ASD; Schizophrenia, SCZ; Bipolar disorder, BD; Major depressive disorders, MDD) and four neurodegenerative disorders (Amyotrophic lateral sclerosis, ALS, Multiple sclerosis, MS; Alzheimer’s disease, AD, and Parkinson’s disease, PD) to generate gene-level summary statistics (Fig. 1). By comparing H-MAGMA with cMAGMA, we found that non-coding SNPs often interact with distal genes, necessitating the use of functional genomic evidence in assigning SNPs to cognate genes. We also found a significant overlap between H-MAGMA and two widely used expression quantitative trait loci (eQTL)-based gene mapping tools, coloc9 and TWAS10. Gene-level association statistics from H-MAGMA closely resembled genetic relationships among brain disorders, which enabled subsequent analyses to identify biological pathways, developmental windows, and cell types critical for each brain disorder.
Fig. 1. Schematics of H-MAGMA approach.
a. H-MAGMA leverages chromatin interaction profiles (Hi-C) to assign intergenic and intronic SNPs to cognate genes. We have applied this framework to five psychiatric disorders and four degenerative disorders using Hi-C datasets from the fetal and adult brain. In return, H-MAGMA provides gene-level association statistics, which can be used to elucidate biological mechanisms underlying brain disorders. b. Intronic and intergenic SNPs are often annotated to distal genes. c. SNPs mapped to H-MAGMA selective genes explain a significant proportion of heritability. Top graph: Heritability enrichment ± standard error; enrichment denotes proportion of heritability/proportion of SNPs; red dotted line, enrichment=1. Bottom graph: false discovery rate (FDR) of heritability enrichment; red dotted line, FDR=0.05. d. Overlap between SCZ-associated genes identified by H-MAGMA, TWAS, and coloc.
Result
Hi-C coupled MAGMA
Since our primary goal is to identify neurobiological mechanisms underlying brain disorders, we leveraged two Hi-C datasets obtained from human brain tissue, one from the developing cortex4 and the other from the adult dorsolateral prefrontal cortex3 (DLPFC), to generate gene-SNP pairs that serve as an input file for MAGMA (Fig. 1a, Methods). Exonic and promoter SNPs were directly assigned to their target genes based on their genomic location, while intronic and intergenic SNPs were assigned to their cognate genes based on chromatin interactions (Fig. 1a). We also generated a cMAGMA input file that utilizes the same set of genes and SNPs as H-MAGMA whereby all intronic and intergenic SNPs were annotated by positional mapping with a generous gene definition that includes 35kb upstream and 10kb downstream of each gene.
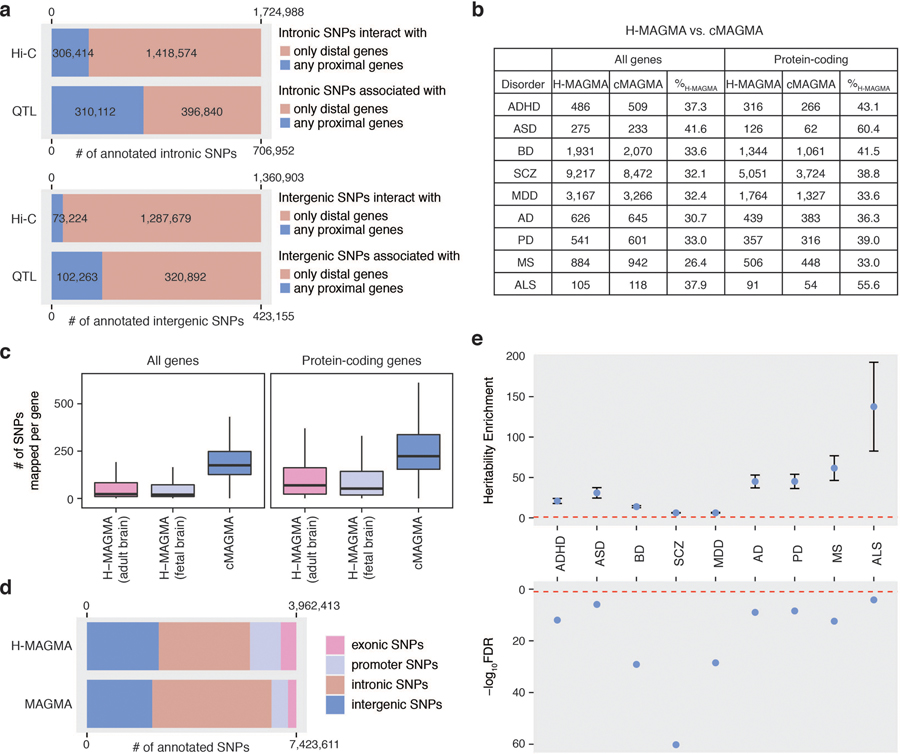
The major source of discrepancy between H-MAGMA and cMAGMA is non-coding variants because promoter and exonic SNPs were assigned to the same genes in both frameworks. We therefore tested how often intronic and intergenic SNPs can be mapped to the nearest genes as predicted by cMAGMA. We found that only 20% of intronic SNPs and 5% of intergenic SNPs interact with nearest genes based on Hi-C (Fig. 1b, Extended Data Fig. 1a, Methods). Because Hi-C based gene mapping cannot capture proximal interactions within 10kb4, we additionally used an eQTL resource from the human DLPFC3, from which we found 56% of intronic SNPs and 76% of intergenic SNPs did not show any association with nearest genes (Extended Data Fig. 1a, Methods). The majority of non-coding SNPs associated with nearest genes showed additional association with distal genes, as 80% of intronic SNPs and 87% of intergenic SNPs showed associations with distal genes (Fig. 1b). These results highlight the importance of using functional genomic evidence in assigning non-coding SNPs to genes.
We reasoned that H-MAGMA would provide neurobiologically relevant target genes for GWAS by accurately linking non-coding variants to their cognate genes via brain-derived chromatin interaction profiles. We therefore applied the framework to nine brain GWAS, including five neuropsychiatric disorders and four degenerative disorders (Fig. 1a). The number of brain disorder risk genes (FDR<0.05) was comparable between H-MAGMA and cMAGMA (Extended Data Fig. 1b, Supplementary Data 1–2), whereas the number of SNPs assigned per gene was three-fold higher for cMAGMA (~244 SNPs per gene) than H-MAGMA (~73 SNPs per gene, Extended Data Fig. 1c). In total, cMAGMA and H-MAGMA linked 7.4M and 3.9M SNPs to genes, respectively (Extended Data Fig. 1d).
Up to 60% of disorder risk genes were H-MAGMA selective (genes identified by H-MAGMA but not by cMAGMA), suggesting that functional genomics guided gene annotation can help identify novel genes and pathways (Extended Data Fig. 1b). H-MAGMA selective genes were significantly enriched for heritability in all nine brain disorders, demonstrating the increase in power of H-MAGMA (Fig. 1c, Extended Data Fig. 1e, Methods).
Using SCZ GWAS as a representative example, we next compared H-MAGMA with eQTL-based gene annotation tools, coloc and TWAS (Methods). Coloc tests whether GWAS SNPs and eQTLs in a certain GWS locus share the same causal variant9, whereas TWAS imputes the genotype-expression relationship based on the eQTL association statistics and derives expression-trait associations by correlating the imputed gene expression to the trait11. We found that a significant proportion of genes identified by eQTL-based gene mapping were also detected by H-MAGMA (Fig. 1d, 74.9% of coloc genes, Fisher’s exact test, OR=4.34, 95% CI=3.22–5.90, P=1.76x10⁻²⁶; 72.6% of TWAS genes, Fisher’s exact test, OR=12.14, 95% CI=10.20–14.49, P=3.94x10–206). H-MAGMA detected a much larger number of genes to be associated with SCZ, which explained a significant proportion of heritability (4.7% of SNPs explained 38.93% of heritability, Enrichment = 8.23, Enrichment P= 7.17x10–53, Methods).
Psychiatric disorders exhibit neurodevelopmental origin, while degenerative disorders exhibit adult origin.
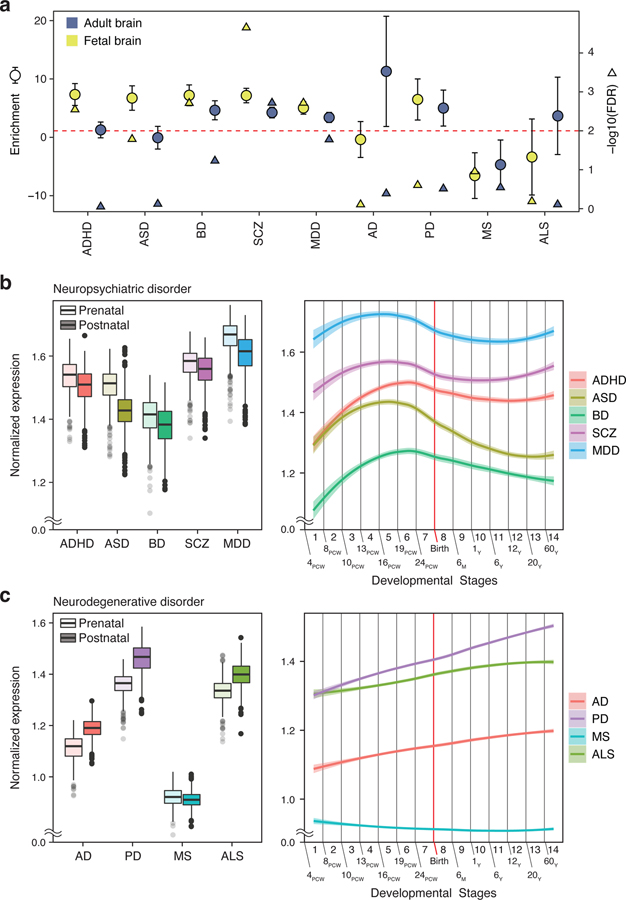
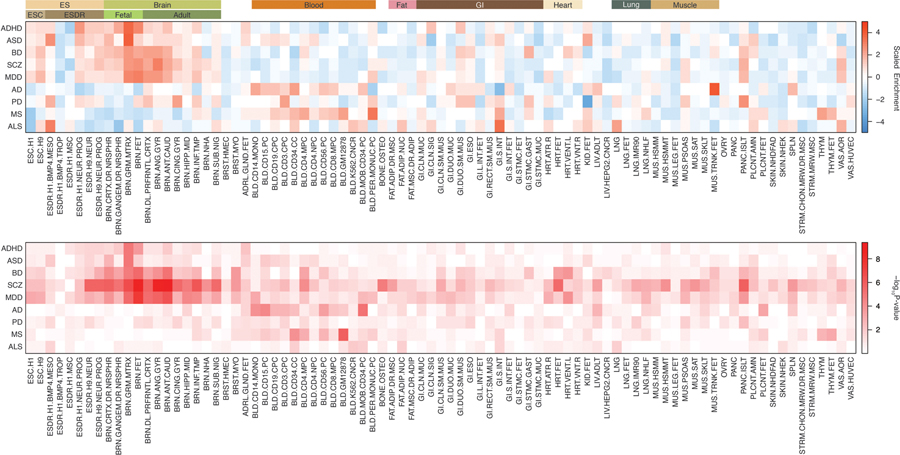
Since 3D chromatin loops are highly tissue-specific4, it is important to decide which Hi-C datasets are appropriate to identify target genes for each disorder. To address this, we first measured the heritability enrichment of each disorder using tissue-specific regulatory elements (Methods). Consistent with the previous findings6, psychiatric disorders showed strong enrichment in brain tissues, while degenerative disorders lacked brain-specific enrichment (Extended Data Fig. 2). Within brain tissue, psychiatric disorders showed stronger heritability enrichment in the fetal brain than in the adult brain, highlighting their neurodevelopmental origin (Fig. 2a). Fetal enrichment was more robust in neurodevelopmental disorders such as ADHD and ASD than in adult onset disorders including BD, SCZ, and MDD.
Fig. 2. Spatiotemporal dynamics of brain disorder risk genes.
a. Heritability enrichment of brain disorders in active regulatory elements of the fetal and adult brain. Enrichment ± standard error (circle) and significance of heritability enrichment (triangle) are depicted. b-c. Developmental expression trajectories of brain disorder risk genes. PCW, post-conception week; M, month; Y, year. (Left) N = 410 and 453 for prenatal and postnatal samples, respectively. Center, median; box = 1st-3rd quartiles (Q); minima, Q1 – 1.5 x interquartile range (IQR); maxima, Q3 + 1.5 x IQR. (Right) LOESS smooth curve with 95% confidence bands.
To confirm this result based entirely on regulatory enrichment, we also used an alternative gene-centric approach. Genes associated with each brain disorder were identified based on fetal and adult brain H-MAGMA, and their expression values were compared between prenatal and postnatal stages. There was a clear distinction between psychiatric and degenerative disorders. Genes associated with psychiatric disorders were highly expressed during prenatal stages, while genes associated with degenerative disorders were highly expressed postnatally (Fig. 2b–c, see Supplementary Data 3 for statistics). The only exception was MS, which displayed prenatal enrichment. This distinction between psychiatric and degenerative disorders was less clear in cMAGMA: ASD- and BD-associated genes were postnatally enriched, AD-associated genes did not display postnatal enrichment, and ALS-associated genes were prenatally enriched (Extended Data Fig. 3, Supplementary Data 3).
Next, we plotted the developmental expression trajectories of brain disorder risk genes (Fig. 2b–c). ASD-, SCZ-, and MDD-associated genes showed remarkedly similar expression patterns with a peak at the developmental stage 5 (16–19 PCW). BD- and ADHD-associated genes were gradually increased during the prenatal stage with a peak at the developmental stage 6 (19–22 PCW). Developmental stages 5 and 6 represent mid-gestation, the period during which upper layer neurons are generated and neuronal differentiation including axonogenesis and dendritic arborization takes place12,13. This result highlights mid-gestation as a critical window during neurodevelopment that may confer risk to multiple psychiatric disorders, consistent with recent results from cross-disorder GWAS14,15. On the contrary, degenerative disorders showed distinct expression trajectories. Genes associated with degenerative disorders except MS constantly and gradually increased during both prenatal and postnatal stages, suggesting that these genes may become more susceptible upon aging. This result is consistent with a strong neurodevelopmental predisposition for psychiatric disorders, in contrast with degenerative disorders which have a postnatal origin.
Pathways implicated for brain disorders.
To identify biological pathways underlying psychiatric and degenerative disorder risk, we conducted a gene ontology (GO) analysis on gene-level association statistics from H-MAGMA. We ranked genes based on Z-scores so that genes with higher Z-scores (more significantly associated with a given disorder) are located at the top of the list. We then tested whether a given gene set is over-represented at the top of the list by performing an incremental enrichment analysis (Methods, see Supplementary Data 4–5 for a full GO result). This approach allows us to (1) identify biological pathways associated with a given trait regardless of the power of GWAS, and (2) characterize the biological pathways reflecting the gene set as a whole rather than using arbitrarily defined genes with a specific P-value threshold.
All brain disorders showed enrichment for pathways involved in transcriptional and translational regulation (e.g. transcriptional regulators, RNA splicing, and DNA damage and repair pathways; Table 1). This is in line with the previous finding that transcriptional dysregulation may mediate risk for brain disorders16. Neuronal differentiation and neuronal apoptotic pathways were also enriched in all brain disorders. Neurogenesis was enriched in the majority of disorders except ASD and BD, consistent with an increasing number of studies elucidating the role of neurogenesis, differentiation, and neuronal apoptosis in brain disorders17,18. Not surprisingly, neurotransmitter and synaptic pathways were implicated in multiple brain disorders, supporting decades of studies highlighting the importance of synaptic function in psychiatric disorders19.
Table 1.
Biological processes enriched for brain disorders. Gene ontologies detected in H-MAGMA but not in cMAGMA are marked in bold.
| ADHD | ASD | BD | SCZ | MDD | AD | PD | MS | ALS | |
|---|---|---|---|---|---|---|---|---|---|
| Transcriptional regulators | ✓ | ✓ | ✓ | ✓ | ✓ | ✓ | ✓ | ✓ | ✓ |
| DNA damage/repair | ✓ | ✓ | ✓ | ✓ | ✓ | ✓ | ✓ | - | ✓ |
| RNA splicing | ✓ | ✓ | ✓ | ✓ | ✓ | ✓ | ✓ | ✓ | ✓ |
| Neurogenesis | ✓ | - | - | ✓ | ✓ | ✓ | ✓ | ✓ | ✓ |
| Neuronal differentiation | ✓ | ✓ | ✓ | ✓ | ✓ | ✓ | ✓ | ✓ | ✓ |
| Neuronal apoptosis | ✓ | ✓ | ✓ | ✓ | ✓ | ✓ | ✓ | ✓ | ✓ |
| Glutamatergic | ✓ | ✓ | ✓ | ✓ | ✓ | ✓ | ✓ | ✓ | ✓ |
| GABAergic | - | ✓ | ✓ | ✓ | - | - | - | - | ✓ |
| Synaptic | Pre/Post | Post | Post | Pre/Post | Pre/Post | Post | Post | Pre/Post | Post |
| Neurotransmitter | Dopamine Serotonin Acetylcholine Monoamine Nitric oxide |
Acetylcholine Nitric oxide Serotonin |
Acetylcholine Nitric oxide |
Dopamine Acetylcholine Nitric oxide |
Monoamine | -- |
Nitric oxide Norepinephrine |
Dopamine | - |
| Glial/Astrocytes | Differentiation |
Development Gliogenesis |
Gliogenesis | - | Astrocyte development Glial guided migration |
Differentiation Migration Proliferation |
Differentiation Proliferation |
Projection Migration Proliferation |
Migration |
| Oligodendrocytes | - | ✓ | - | ✓ | ✓ | ✓Myelination | ✓Myelination | ✓Myelination | ✓Myelination |
| Brain development | Cerebral cortex | Telencephalon | Hippocampus Substantia Nigra Telencephalon |
- | Cerebral cortex Telencephalon Substantia nigra |
Forebrain Cerebral cortex |
Forebrain Limbic system Midbrain Telencephalon |
Cerebral cortex Hypothalamus Forebrain |
Hindbrain
Forebrain Substantia nigra |
| Interferon | ✓ | - | ✓ | ✓ | ✓ | ✓ | ✓ | ✓ | ✓ |
| Antigen processing | ✓ | ✓ | ✓ | ✓ | - | ✓ | ✓ | ✓ | ✓ |
| Interleukin | ✓ | ✓ | ✓ | ✓ | ✓ | ✓ | ✓ | ✓ | ✓ |
| Cytokine | - | ✓ | - | ✓ | ✓ | ✓ | ✓ | ✓ | - |
| T cell | ✓ | ✓ | ✓ | ✓ | ✓ | ✓ | ✓ | ✓ | ✓ |
| B cell | - | ✓ | - | ✓ | - | ✓ | - | - | - |
| TLR | ✓ | ✓ | ✓ | ✓ | ✓ | - | ✓ | - | ✓ |
| Aging | ✓ | ✓ | - | - | - | ✓ | - | - | ✓ |
| Ischemia | - | - | - | - | - | - | - | ✓ | ✓ |
| Others | ERBB | Vocalization Wnt BAF APP |
Glucocorticoid APP Synaptic plasticity |
Amyloid beta BAF Beta-catenin/Wnt ERBB |
Beta-catenin ERBB |
Amyloid beta ERBB Glucocorticoid |
Wnt Amyloid beta ERBB Tau |
ERBB2 Beta-catenin/Wnt Tau |
Wnt |
There were interesting distinctions among brain disorders. For example, all brain disorders showed postsynaptic associations, while a selected set of disorders (ADHD, SCZ, MDD, and MS) also exhibited presynaptic associations. Further, while the majority of brain disorders displayed enrichment in glutamatergic signaling, ASD, SCZ, and ALS displayed enrichment in GABAergic signaling. ASD-associated genes were enriched for acetylcholinergic and serotonergic signaling, reflecting known biology of ASD20,21. SCZ and BD-associated genes were also enriched for acetylcholinergic signaling, supporting previous studies that altered cholinergic signaling contributes to SCZ and BD pathogenesis4,22. MS-associated genes were enriched for dopaminergic signaling, disruption of which has been associated with immune malfunction in MS23. These results collectively highlight synaptic dysfunction in brain disorders, albeit we could detect distinctions among disorders based on neurotransmitters and pre/post synaptic associations.
We observed pronounced immune related processes for degenerative disorders in contrast to psychiatric disorders. In support of this finding, multiple aspects of glial development were also associated with brain disorders, with stronger enrichment in degenerative disorders (Table 1). Moreover, all degenerative disorders showed associations with genes involved in myelination and oligodendrocyte function, suggesting a potential role of oligodendrocytes in neurodegeneration. In line with this, single cell transcriptomic profiles in AD postmortem brains suggested altered molecular profiles in oligodendrocytes24. Together with heritability enrichment, this finding of enriched immune response in degenerative, but less so in psychiatric disorders hints a possible explanation for genetic distinctions between psychiatric and degenerative disorders25.
Additional interesting findings include amyloid beta enrichment for AD and PD, and tau enrichment for MS and PD (Table 1), supporting amyloid beta and tau pathology in degenerative disorders26,27. We also observed Wnt/β-catenin pathway enrichment for a number of brain disorders including ASD, SCZ, MDD, PD, MS and ALS. Wnt/β-catenin signaling is a key pathway for neurogenesis and cortical pattern specification, and its dysregulation has been observed in several psychiatric disorders28. Notably, genes involved in vocalization were associated with ASD, diagnostic criteria of which include impairment in vocalization29. We also identified brain regions (e.g. cortex, hippocampus, substantia nigra, and hypothalamus) associated with multiple brain disorders. This is intriguing as we used cortical Hi-C data.
Cell-type specificity
Brain disorders often exhibit different cellular signatures and vulnerability, highlighting the need to identify critical cell types for brain disorders to develop proper therapeutic strategies. For example, ASD postmortem brains exhibit cell-type specific gene expression signatures such as upregulation of glial genes and downregulation of neuronal genes30. Common variation in SCZ maps onto specific groups of cells including pyramidal neurons and medium spiny neurons31. Microglia are increasingly recognized as a central cell type contributing to the etiology of AD32.
To address central cell types mediating risk for brain disorders, we next assessed cell-type specific expression profiles of brain disorder risk genes (Methods). One striking difference between psychiatric and degenerative disorders was that psychiatric disorder-associated genes coalesced in neurons, while degenerative disorder-associated genes were highly expressed in glia (microglia for AD and MS, astrocytes for ALS and PD, Extended Data Fig. 4a). Since psychiatric disorders showed neurodevelopmental origin, we also measured cell-type specific expression profiles of psychiatric disorder-associated genes in the developing cortex and found convergence onto outer radial glia and excitatory neurons (Extended Data Fig. 4b). This selective enrichment in excitatory neurons prevailed across development, as adult neuronal expression profiles for psychiatric disorder-associated genes also indicated excitatory neuronal enrichment (Extended Data Fig. 4b).
While cMAGMA gave a similar result to H-MAGMA, there were important discrepancies, which include astrocytic expression of ASD-associated genes, lack of astrocytic expression of PD- and ALS-associated genes, and lack of endothelial expression of MS-associated genes (Extended Data Fig. 4). Given the growing evidence of astrocyte-mediated neurodegeneration in ALS and PD33,34, the emerging role of blood-brain barrier in MS35, and lack of genetic association signals of an astrocytic co-expression network in ASD36, this result indicates that H-MAGMA can provide cellular etiology that can be missed by cMAGMA.
Cell-type specific gene mapping
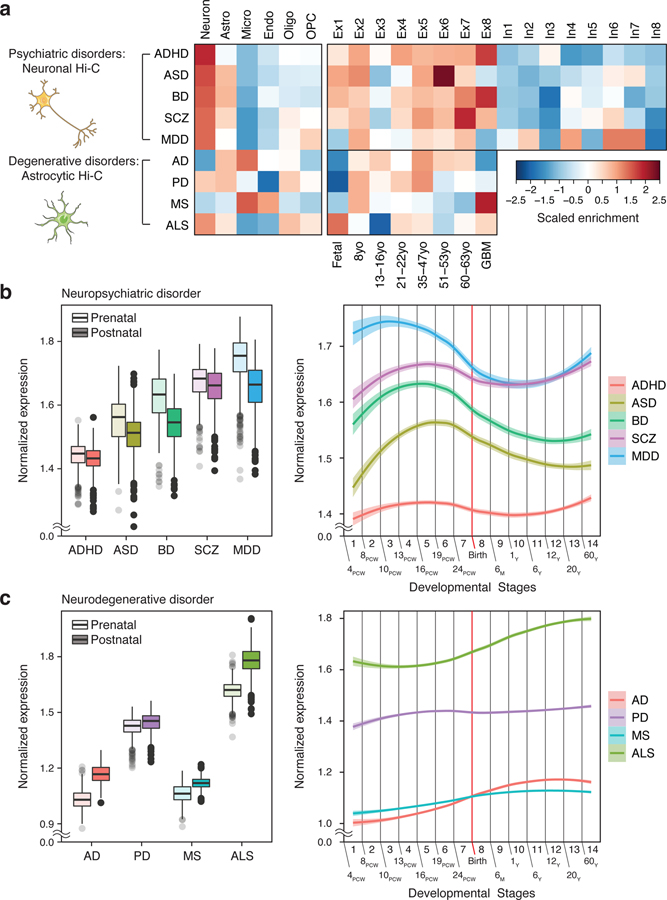
As we detected a remarkable cellular specificity for both psychiatric and degenerative disorders, we next sought to identify disorder risk genes in a cell-type specific manner. To this end, we built H-MAGMA framework based on Hi-C interactions from iPSC-derived neurons and astrocytes37. Neuronal and astrocytic H-MAGMA were subsequently used to decode psychiatric and degenerative disorder GWAS, respectively (Fig. 3a). We found that a significant proportion of genes (20–40%) were detected in a cell-type specific fashion (Extended Data Fig. 5).
Fig. 3. Cellular expression profiles of brain disorder risk genes.
a. We used neuronal and astrocytic H-MAGMA to annotate psychiatric disorder and degenerative disorder GWAS, respectively. Psychiatric disorder-associated genes are highly expressed in neurons, while neurogenerative disorder-associated genes exhibit glial signatures. Astro, astrocytes; Micro, microglia; Endo, endothelial cells; Oligo, oligodendrocytes; OPC, oligodendrocytes progenitor cells; Ex, excitatory neurons; In, inhibitory neurons; GBM, glioblastoma multiforme tumor. b-c. Developmental expression trajectories of psychiatric disorder-associated genes (b) and degenerative disorder-associated genes (c). PCW, post-conception week; M, month; Y, year. (Left) N = 410 and 453 for prenatal and postnatal samples, respectively. Center, median; box=Q1-Q3; minima, Q1 – 1.5 x IQR; maxima, Q3 + 1.5 x IQR. (Right) LOESS smooth curve with 95% confidence bands.
Cell-type specific H-MAGMA recapitulated biological processes, cell-type specificities, and developmental trajectories of brain homogenate H-MAGMA. For example, brain disorder risk genes derived from cell-type specific H-MAGMA were involved in transcriptional regulation, neurogenesis, and synaptic transmission (Supplementary Data 6). Degenerative disorder risk genes showed pronounced enrichment for glial development and inflammatory responses.
Cell-type specific H-MAGMA further recapitulated cellular expression profiles of disease risk genes. For example, we observed excitatory neuronal expression of psychiatric disorder risk genes, microglial expression of AD- and MS-associated genes, and astrocytic expression of PD- and ALS-associated genes (Fig. 3a). As astrocytes gain inflammatory profiles with aging38, we further assessed age-associated astrocytic expression of degenerative disorder risk genes derived from astrocytic H-MAGMA. We found that AD- and PD-associated genes were expressed in mature astrocytes, while ALS-associated genes were highly expressed in fetal astrocytes. MS-associated genes were highly expressed in glioblastoma, consistent with the emerging view that astrocyte-mediated neuroinflammation is a key contributor to the MS pathogenesis39. Further, psychiatric disorder-associated genes showed prenatal enrichment with a peak during mid-gestation, while degenerative disorder-associated genes were postnatally enriched with a gradual increase in expression across a lifespan (Fig. 3b–c). One remarkable difference between cell-type specific and brain homogenate H-MAGMA was postnatal expression of MS-associated genes from astrocytic H-MAGMA, which was not detected in brain homogenate.
Functional impact of genetic risk factors in transcriptomic signatures
We next hypothesized that brain disorder-associated genes are dysregulated in corresponding disorders. Therefore, we assessed whether brain disorder-associated genes are differentially regulated in postmortem brains with brain disorders (Methods)2.
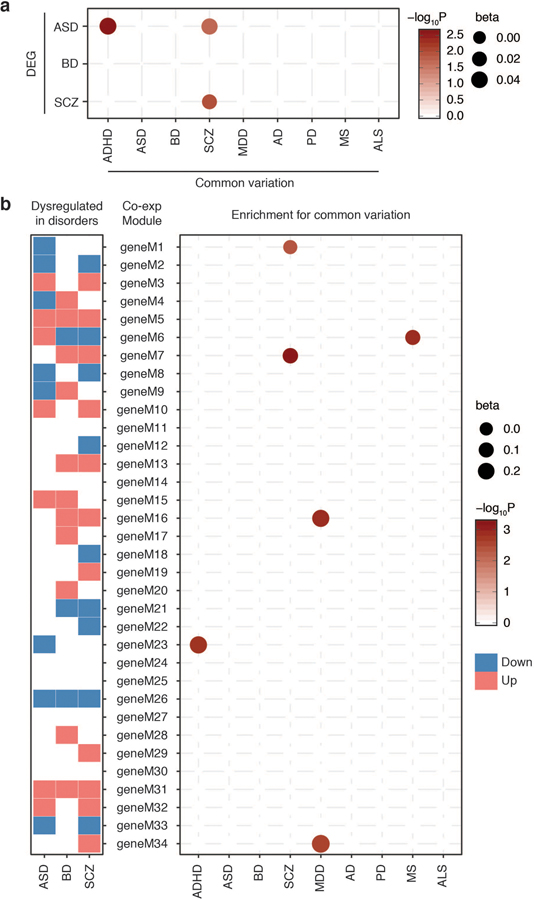
We first compared our gene association statistics with postmortem brain gene expression profiles from individuals with three psychiatric disorders (ASD, BD, SCZ)40. We found a significant overlap between common variation affected genes and differentially expressed genes (DEG) in SCZ (Extended Data Fig. 6a). SCZ-associated genes were also enriched for ASD DEG. In addition, ADHD-associated genes were enriched for ASD DEGs, recapitulating a shared genetic relationship between these two neurodevelopmental disorders41.
Since gene co-expression networks may capture additional disease-associated signatures to DEG, we compared gene association statistics with gene co-expression modules in three psychiatric disorders (Extended Data Fig. 6b). We found that an interneuronal module (geneM23) downregulated in ASD were enriched for ADHD-associated genes. Further, SCZ-associated genes were enriched for a synaptic module (geneM7) upregulated in BD and SCZ. MDD-associated genes were enriched for a neurodevelopmental module (geneM16) upregulated in BD and SCZ.
However, the overlap between DEG and gene association statistics was nominal (beta=0–0.04), and ASD- and BD-associated genes were neither differentially regulated in psychiatric disorders nor enriched for any disease-associated co-expression modules (Extended Data Fig. 6). This can be due to multiple reasons. First, ASD and BD GWAS have relatively limited power compared to SCZ and MDD, hence a more comprehensive picture may arise once we obtain better powered GWAS. Second, transcriptomic signatures do not necessarily reflect early events in the disease process that are directly impacted by genetic risk factors, but result from complex gene-environment interactions throughout the disease progression. Third, given that brain disorder-associated genes show cell-type specific enrichment (Fig. 3, Extended Data Fig. 4), they may affect gene regulation in a specific cell type(s) that may be missed by the bulk expression datasets. To test the third hypothesis, we compared gene association statistics with cell-type specific molecular signatures in AD pathology24. We found that AD-associated genes were significantly enriched for DEGs in microglia and oligodendrocytes, but not in neurons (Fig. 4a). While we cannot completely rule out the first and second hypotheses, this result suggests that the cellular context in which risk variants influence gene expression needs to be carefully considered in understanding the molecular complexity of brain disorders.
Fig. 4. Characteristics of brain disorder risk genes.
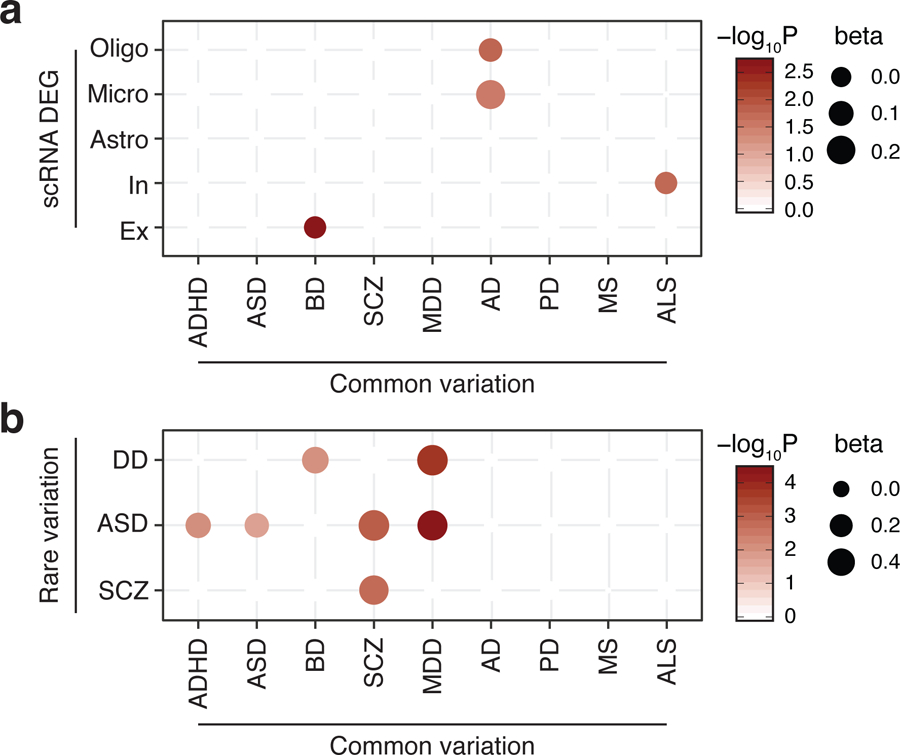
a. AD-associated genes are dysregulated in oligodendrocytes and microglia from AD postmortem brains (single-cell RNA-seq DEG). b. Comparison of brain disorder risk genes with common and rare variation. Only significant associations (FDR<0.1) were depicted.
Interplay between common and rare variation
Not only common but also rare variation plays a role in brain disorders, highlighting the importance of studying risk variants across the allele frequency spectrum. Our previous work suggests a potential interplay between common and rare variation in the genetic architecture of brain disorders42. Therefore, we assessed how rare and common variation in brain disorders crosstalk with each other at a gene level (Fig. 4b, Methods).
We found that the same set of genes, including synaptic genes (DLG2, SYNGAP1, SHANK1) and genes that encode transcriptional regulators (SETD1A, SMARCC2), are affected by both common and rare variation in SCZ. Common and rare variation in ASD also converge onto the same set of genes. MDD-associated genes overlap with genes that harbor rare de novo variation in ASD and developmental disorders (DD), suggesting that a recently reported genetic correlation between MDD and ASD GWAS43 may also apply for rare variation. ADHD-associated genes also overlap with genes with rare de novo variation in ASD, supporting the shared genetic basis of neurodevelopmental disorders. These results collectively suggest that rare and common variation may impact same biological pathways42.
Shared genetic architecture among brain disorders
We next assessed whether the gene-level association statistics obtained from H-MAGMA can be used to elucidate the shared genetic architecture among brain disorders. Since the number of genes significantly associated with a given disorder differs based on the sample size and power of GWAS, we used a rank-rank hypergeometric test of overlap (RRHO), which is a threshold-free algorithm for comparing two genomic datasets44. Genes were ranked based on Z-scores from the H-MAGMA output, and ranked lists between two disorders were compared to identify the gene-level overlap between two disorders (Methods). We then compared this gene-level overlap with genetic correlations calculated by linkage disequilibrium score regression (LDSC)45.
Gene-level overlaps recapitulated the previously reported genetic architecture of brain disorders25: psychiatric disorders exhibited strong overlaps in their ranked gene lists, whereas degenerative disorders did not display significant overlaps (Extended Data Fig. 7a). Among psychiatric disorders, neurodevelopmental disorders (ADHD and ASD) and adult-onset psychiatric disorders (BD, SCZ, and MDD) showed strong overlaps, indicating shared neurobiological bases. The correlation between RRHO and genetic correlation was 0.79 (Extended Data Fig. 7b, P-value=8.08x10⁻⁹), demonstrating that gene-level association statistics from H-MAGMA reflect shared genetic architecture, and hence can be further used to decipher the biological mechanisms underlying shared genetic architecture among psychiatric disorders.
Biological pathways underlying pleiotropy
Cross-disorder GWAS of eight psychiatric disorders recently identified more than a hundred GWS loci increasing risk for multiple disorders, further providing evidence of widespread pleiotropy among psychiatric disorders14. Shared genetic etiology across psychiatric disorders may underlie concerted developmental expression trajectories and cellular expression profiles of psychiatric disorder-associated genes (Fig. 2–3). Therefore, we next examined genes shared in multiple psychiatric disorders (n≥4) to identify common molecular mechanisms of psychiatric disorders (see Methods for gene selection).
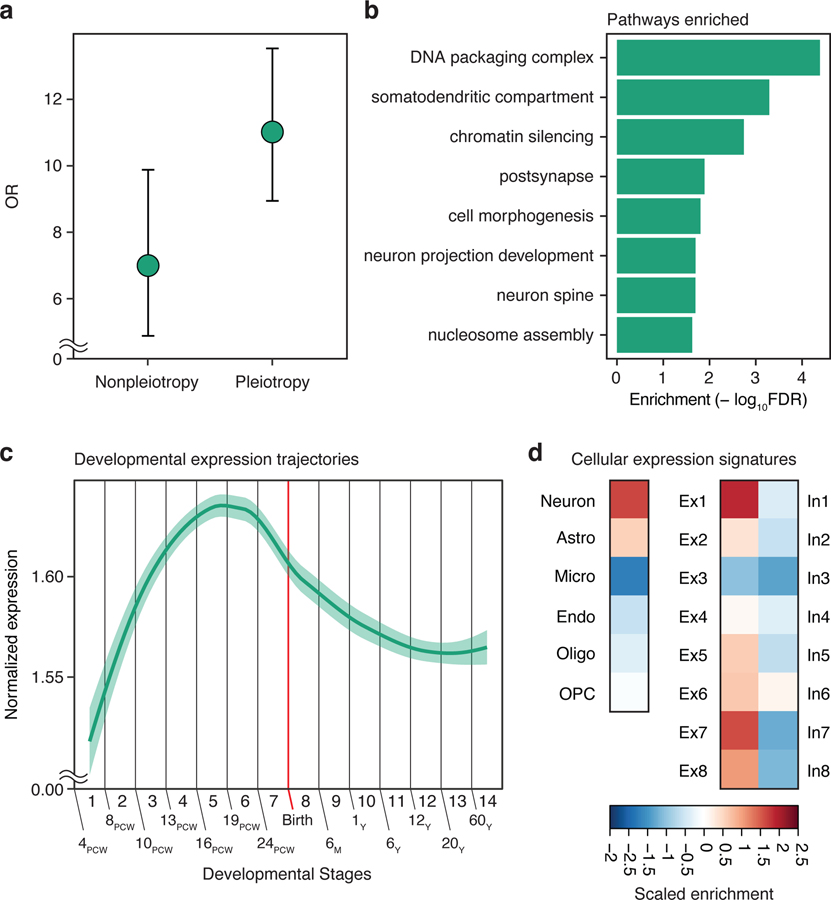
In total, we found 1,841 genes (hereby referred to as pleiotropic genes) that are shared in more than four psychiatric disorders (Supplementary Data 7). Notably, pleiotropic genes showed higher enrichment for genes mapped to pleiotropic cross-disorder GWS loci than those mapped to non-pleiotropic (disease-specific) GWS loci14 (Fig. 5a).
Fig. 5. Pleiotropic genes reveal shared molecular mechanisms of psychiatric disorders.
a. Comparison between pleiotropic genes and genes mapped to non-pleiotropic and pleiotropic GWS loci. Odds ratio (OR) and 95% confidence intervals (CI). b. Gene ontology enrichment of pleiotropic genes. c. A developmental expression trajectory of pleiotropic genes. LOESS smooth curve with 95% confidence bands. d. Cell-type specific expression profiles of pleiotropic genes.
Pleiotropic genes were involved in gene regulation, synaptic function, and neuronal and dendritic development (Fig. 5b). They showed a distinct peak at mid-gestation, consistent with the overall developmental expression patterns of psychiatric disorder-associated genes (Fig. 5c). Finally, pleiotropic genes showed strong excitatory neuronal enrichment for cortical projection neurons in cortical layers 2/3 (excitatory neuronal subtypes 1) and corticothalamic projection neurons in cortical layers 5/6 (excitatory neuronal subtype 7) (Fig. 5d).
Discussion
Here we present a refined framework for gene pathway analysis, H-MAGMA, that aggregates SNP-level summary statistics into the gene-level association statistics. Compared with cMAGMA, H-MAGMA (1) links non-coding SNPs to their target genes based on functional genomic evidence, and (2) adds relevant cellular context to gene mapping by using chromatin interaction data from disease-relevant tissue and cell types. While the basic concept of mapping SNPs to genes using functional genomic resources is similar to FUMA7, H-MAGMA leverages the MAGMA framework to obtain gene-level association statistics in a genome-wide fashion, while FUMA maps a selected set of genomic loci to target genes. Therefore, H-MAGMA can provide an attractive framework to identify genes and biological pathways for low powered GWAS. It also allows comparing different GWAS to elucidate shared biological pathways.
H-MAGMA can be expanded into many different forms. For example, while we decided to use MAGMA among many other tools as it is most widely used, this framework is applicable to any other tools that convert SNP-level P-values into gene-level association statistics16. Moreover, H-MAGMA can be built on Hi-C datasets from multiple tissue- and cell-types to distill biological mechanisms of any GWAS (e.g. Hi-C datasets from immune cells for rheumatoid arthritis GWAS). Finally, while we primarily used Hi-C datasets to link SNPs to target genes, other functional genomics tools such as chromatin accessibility correlations and machine learning-based enhancer-promoter predictions can be used to generate SNP-gene pairs. In fact, a similar approach using eQTLs (eMAGMA) has been recently reported46.
To further examine the interrelationship between Hi-C and eQTLs, we compared H-MAGMA-derived outputs with two eQTL-based gene mapping tools, coloc and TWAS. Consistent with the previous finding3,11, we detected a substantial overlap. While eQTL-based gene mapping is in no doubt a powerful approach, H-MAGMA can provide a complementary platform to understand the mechanism of GWAS for the following reasons. First, Hi-C can provide comprehensive genome-wide maps for tissues or cell-types with limited access. One example is Hi-C datasets from iPSC-derived neurons and astrocytes that allow GWAS annotation in a cell-type specific manner37, which is currently not available with eQTL. Second, it has been recently shown that the variants associated with chromatin accessibility capture stimulus-sensitive signals and explain a significant proportion of heritability, even more so than eQTLs47,48. Supporting this claim, we found that H-MAGMA derived genes explain a significant proportion of heritability in addition to eQTL derived genes. These results collectively suggest that chromatin architecture such as Hi-C and chromatin accessibility may provide complementary regulatory phenotypes that can be missed by eQTLs. It is of note that H-MAGMA also has its shortcoming, as it does not capture gene regulatory mechanisms such as altered RNA splicing or the allelic effect (Hi-C cannot predict whether the SNPs will downregulate or upregulate the cognate genes). Leveraging multiple genomic resources, such as eQTL, spliceQTLs, caQTLs, and Hi-C, is therefore critical for annotating and interpreting GWAS.
An application of H-MAGMA to nine brain disorder GWAS enabled systematic delineation of pathogenic mechanisms of brain disorders. For example, one important question in psychiatry is whether a critical window exists for treatment of psychiatric disorders. Moreover, there is an ongoing debate whether adult onset disorders such as schizophrenia and depression have a neurodevelopmental origin. By comparing prenatal and postnatal expression trajectories, we found that genes associated with psychiatric disorders show remarkable developmental convergence onto mid-gestation, while genes associated with degenerative disorders were gradually increased across the life span, reflecting their increased burden upon aging.
Another layer of convergence among psychiatric disorders was hinted by cellular expression profiles. Psychiatric disorder-associated genes were selectively expressed in excitatory neurons, while degenerative disorder-associated genes show more diverse cellular enrichment profiles. Similar cell-type specificity was reported by the interactome study, demonstrating the robustness of the result using an orthogonal approach49.
These results demonstrate that the shared genetic basis of psychiatric disorders translates into shared neurobiological mechanisms. To further identify shared neurobiological basis among psychiatric disorders, we defined a set of pleiotropic genes that are associated with more than four psychiatric disorders. Pleiotropic genes were associated with neuronal development and synaptic plasticity, suggesting that inappropriate neuronal activity and regulation may act as key components in the pathogenesis of psychiatric disorders. Pleiotropic genes also displayed mid-gestational and excitatory neuronal enrichment, summarizing the overall pattern of psychiatric disorder-associated genes. Importantly, this characteristic was also observed for pleiotropic genes identified by meta-analysis of eight psychiatric disorders14.
Finally, we found intricate relationships among genes impacted by common and rare variation. For example, common and rare variation in SCZ and ASD coalesce to the same set of genes, highlighting the importance of studying risk variation across the allele frequency spectrum to comprehensively understand the complex interplay between common and rare variation in psychiatric disorders.
Accession codes
Hi-C data from the developing cortex is available through dbGaP under the accession number phs001190.v1.p1; Hi-C data from the adult DLPFC is available through the PsychENCODE resource site (resource.psychencode.org); Hi-C data from neuron and astrocyte is available through PsychENCODE knowledge portal under the accession number syn4921369.
Methods
Hi-C
Fetal brain Hi-C data was obtained from the paracentral cortex of three individuals of gestation week (GW) 17–184. Adult brain Hi-C data was obtained from the dorsolateral prefrontal cortex (DLPFC) of three individuals (36, 44, 64 years)3. Neuronal and astrocytic Hi-C data were derived from human induced pluripotent stem cells (hiPSC) obtained from two individuals (15 and 31 years)37.
GWAS
We used the following GWAS summary datasets: attention deficit/hyperactivity disorder (ADHD) (n = 20,183 cases; 35,191 controls) 50, autism spectrum disorder (ASD) (n = 18,381 cases; 27,969 controls)41, bipolar disorder (BD) (n = 20,352 cases; 31,538 controls)51, schizophrenia (SCZ) (n = 11,260; 24,542 controls)52, major depressive disorder (MDD) (n = 246,363 cases; 561,190 controls)53, Alzheimer’s disease (AD) (n = 71,880 cases; 383,378 controls)54, Parkinson’s disease (PD) (n= 37,700 cases; 1,400,000 controls)55, multiple sclerosis (MS) (n = 4,888; 10,395 controls)56, amyotrophic lateral sclerosis (ALS) (n = 12,577; 23,475 controls)57. Since we used publicly available GWAS summary statistics, (1) no data points were excluded from analysis, (2) no statistical methods were used to pre-determine the sample size, and (3) data collection and analysis were not performed blind to the conditions of the experiments.
Development of Hi-C coupled MAGMA (H-MAGMA)
Exonic and promoter SNPs were directly assigned to their target genes based on their genomic location using a gene model Gencode v26 https://www.gencodegenes.org/human/release_26lift37.html), and promoter definition as 2kb upstream of transcription start sites (TSS) of each gene isoform. Intronic and intergenic SNPs were assigned to their cognate genes based on chromatin interactions with promoters and exons as previously described3,4. Briefly, we generated a background Hi-C interaction profile by pooling 9 million imputed SNPs from schizophrenia GWAS summary statistics58. Using this background Hi-C interaction profile, we fit the distribution of Hi-C contacts at each distance from each chromosome using the fitdistrplus package (https://cran.r-project.org/web/packages/fitdistrplus/index.html). Significance for a given Hi-C contact was calculated as the probability of observing a stronger contact under the fitted Weibull distribution matched by chromosome and distance. Hi-C contacts with FDR<0.01 were selected as significant interactions. Significant Hi-C interacting regions were overlapped with Gencode v26 exon and promoter coordinates to identify exon- and promoter-based interactions. We used exon- and promoter-based interactions, because our previous study comparing Hi-C data with eQTLs have demonstrated the gene regulatory potential of exon-level interactions3. Hi-C data from brain homogenate (fetal and adult human brain) and brain cells (hiPSC-derived neurons and astrocytes) were used to generate MAGMA input files that describe gene-SNP pairs. Input files can be found in the github repository: https://github.com/thewonlab/H-MAGMA.
Gene annotation for conventional MAGMA (cMAGMA)
We generated an input file for cMAGMA that is comparable to H-MAGMA. We used the same gene model (Gencode v26) and a SNP list used for H-MAGMA, and allowed a window of 35kb upstream and 10kb downstream of each gene as previously described16,52. Subsequently, any intronic and nearby intergenic SNPs were assigned to the genes based on positional mapping. This input file can be found in the github repository: https://github.com/thewonlab/H-MAGMA.
Non-coding SNP annotation
We first grouped non-coding SNPs into intronic and intergenic SNPs. Proximal genes were defined by positional mapping: for intronic SNPs, genes in which SNPs are located were defined as proximal genes; for intergenic SNPs, nearest genes were defined as proximal genes. Intronic and intergenic SNPs were then overlapped with the SNPs annotated by Hi-C (Hi-C non-coding SNPs: SNPs that interact with gene promoters and exons) and eQTLs (eQTL non-coding SNPs: SNPs that have associations with gene expression). For Hi-C non-coding SNPs, we compared proximal genes with genes that physically interact with the SNPs. For eQTL non-coding SNPs, we compared proximal genes with e-genes (genes that show eQTL associations). We assessed how often (1) physically interacting genes and/or e-genes for a given SNP contain proximal (nearest) genes (Extended Data Fig. 1a), and (2) SNPs show any interactions/associations with distal (non-nearest) genes (Fig. 1b).
Running MAGMA
For both H-MAGMA and cMAGMA, we used the MAGMA analysis pipeline as the default setting:
magma_v1.07b/magma --bfile g1000_eur –pval <GWAS summary statistics> use=rsid,p ncol=N --gene-annot <MAGMA input annotation file> --out <output file>
Here, g1000_eur denotes the reference data file for European ancestry population. This file can be downloaded from: https://ctg.cncr.nl/software/magma. Detailed instructions can be found in the github repository: https://github.com/thewonlab.
Comparison between H-MAGMA and cMAGMA
We compared disorder risk genes identified by H-MAGMA with those identified by cMAGMA using a Vennerable package in r. We reported the proportion of H-MAGMA selective genes by calculating the number of genes only identified by H-MAGMA divided by the total number of genes identified by H-MAGMA. Since H-MAGMA results were available from the fetal and adult brain Hi-C data, we used genes that are significantly associated in either fetal or adult dataset using a union function in R (hereby referred to as union disorder risk genes).
We next obtained SNPs mapped to H-MAGMA selective genes using H-MAGMA input files from the fetal and adult brain (H-MAGMA SNPs) and the cMAGMA input file (cMAGMA SNPs). We also obtained H-MAGMA selective SNPs by excluding cMAGMA SNPs from H-MAGMA SNPs to ensure that heritability enrichment we observed is not due to the exonal and promoter SNPs that are shared between H-MAGMA and cMAGMA. We then measured heritability explained by H-MAGMA SNPs and H-MAGMA selective SNPs using stratified linkage disequilibrium score regression with the baseline-LD model (S-LDSC)6.
Comparison between H-MAGMA and eQTL-based gene mapping algorithms
To compare H-MAGMA with eQTL-based tools, we used previously reported schizophrenia (SCZ) risk genes obtained through the transcriptome-wide association study (TWAS)40 and coloc3. Both TWAS and coloc were performed on SCZ GWAS52 using the largest eQTL resource obtained from the adult human DLPFC3. We restricted our H-MAGMA results to those derived from the adult brain so that we can match the developmental period (adult) and brain region (DLPFC) with the eQTL database. TWAS identified 708 SCZ-associated genes (TWAS SCZ genes) whose imputed expression values are correlated with SCZ (FDR<0.05). Coloc identified 255 SCZ-associated genes (coloc SCZ genes) whose eQTLs co-localize with SCZ genome-wide significant (GWS) loci (PP4>(PP0+PP1+PP2+PP3)).
While H-MAGMA uses the whole genome as genetic background, coloc and TWAS require a more carefully defined background. Because coloc is a GWS loci-centric approach, e-genes within GWS loci ± 1Mb were considered as background (3,632 genes). On the other hand, TWAS is a genome-wide approach and uses cis-heritable genes as background (13,396 genes). We therefore intersected H-MAGMA SCZ association results with coloc and TWAS background, from which 1,576 and 2,801 H-MAGMA SCZ genes (FDR<0.05) were selected and compared with coloc and TWAS SCZ genes, respectively. By comparing H-MAGMA SCZ genes and coloc/TWAS SCZ genes, we obtained 3,004 H-MAGMA selective genes (genes identified by H-MAGMA but not by TWAS and/or coloc). SNPs mapped to H-MAGMA selective genes were subsequently identified via H-MAGMA input file from the adult brain (H-MAGMA SNPs). Finally, heritability enrichment of H-MAGMA SNPs was calculated by S-LDSC to demonstrate that H-MAGMA genes without eQTL support still explain a significant proportion of heritability.
Heritability enrichment for tissue-specific regulatory elements
To measure heritability enrichment of eight brain disorder GWAS in active genomic regions in each cell/tissue-type, we used S-LDSC6 with chromHMM-defined chromatin states5. Since chromatin profiling hasn’t been performed in all cell/tissue-types (e.g. DNase hypersensitivity was missing for fetal brains, while H3K27ac ChIP-seq was not performed in the adult DLPFC), we instead used genomic regions that are active in each cell/tissue type using chromatin states defined by chromHMM59. We defined active genomic elements by the regions marked as Active transcription start sites (TSS, state 1), Flanking active TSS (state 2), Genic enhancers (state 6), and Enhancers (state 7), and repressive genomic elements marked as Heterochromatin (state 9), Repressed polycomb (state 13), Weak repressed polybcomb (state 14), and Quiescent (state 15) in the core 15-state model (https://egg2.wustl.edu/roadmap/web_portal/chr_state_learning.html). To further assess developmental stage specific heritability enrichment in the human brain tissue, we defined fetal active elements (elements that are active in the fetal brain and become repressive in the adult brain) and adult active elements (elements that are repressive in the fetal brain then become active in the adult brain). The SNP annotation file can be downloaded from the github repository: https://github.com/thewonlab/H-MAGMA. Heritability enrichment values in different cell/tissue types resulting from S-LDSC were then scaled to allow tissue-level comparison of enrichment values.
Gene selection
For assessing (1) developmental expression profiles, (2) cell-type specific expression profiles, and (3) gene ontology enrichment of disorder-associated genes, we used following strategies to select genes. We restricted our analysis only on protein-coding genes, because (1) the majority of genes detected in the spatiotemporal transcriptomic atlas12, single cell expression datasets60–62, and gene ontologies were protein-coding genes, and (2) non-coding genes have much lower expression values compared with protein-coding genes, which can dilute the signals. We also excluded genes within the MHC region due to the complexity of LD, which can override the overall pattern. Finally, we removed genes within chromosome X (chrX), as only a subset of GWAS had association statistics available in chrX.
Developmental and Cellular Expression Profiles
Analyzing developmental and cell-type specific expression levels required selection of significantly associated genes for each disorder. We calculated adjusted P-values based on the Benjamini and Hochberg (BH) procedure using p.adjust function in R. We then selected genes with two FDR thresholds (FDR<0.01 for GWAS with >20 GWS hits, SCZ, BD, MDD, AD; FDR<0.1 for GWAS with < 20 GWS hits, ADHD, ASD, PD, MS, ALS) for as significantly associated brain disorder genes.
Spatiotemporal transcriptomic atlas from Kang et al., 201112 was used to obtain cortical expression profiles across multiple developmental stages. Developmental stages were defined as follows: stage 1, 4 PCW ≤ Age < 8 PCW; stage 2, 8 PCW ≤ Age < 10 PCW; stage 3, 10 PCW ≤ Age < 13 PCW; stage 4, 13 PCW ≤ Age < 16 PCW; stage 5, 16 PCW ≤ Age < 19 PCW; stage 6, 19 PCW ≤ Age < 24 PCW; stage 7, 24 PCW ≤ Age < Birth; stage 8, Birth ≤ Age < 6 M; stage 9, 6M ≤ Age < 1 Y; stage 10, 1 Y ≤ Age < 6 Y; stage 11, 6 Y ≤ Age < 12 Y; stage 12, 12 Y ≤ Age < 20 Y; stage 13, 20 Y ≤ Age < 60 Y; stage 14, Age > 60 Y.
Log-transformed expression values were centered to the mean expression level per sample using a scale(center=T, scale=F) function in R. Genes associated with brain disorders were selected for each brain sample and their average centered expression values were calculated for each brain sample. To ensure that developmental expression trajectories are not dictated by the developmental stage from which Hi-C data was obtained, we used union disorder risk genes. To further verify the developmental trajectories in a cell-type specific fashion, we used neuronal Hi-C for psychiatric disorders and astrocytic Hi-C for degenerative disorders. Prenatal versus postnatal expression values were compared using lm function in R (e.g. for a given disorder, lm(Expression values ~ stages)).
We also used single cell transcriptomic data from the adult brain60,62 and fetal brains61 to identify cell-type specific expression profiles of brain disorder-associated genes. To measure astrocytic expression profiles across developmental stages, we used transcriptomic data from purified human astrocytes63. H-MAGMA results derived from fetal and adult brain Hi-C were used to assess cell-type specific expression values in the fetal and adult brain, respectively. Furthermore, neuronal H-MAGMA was used to assess cell-type and neuronal subtype enrichment of psychiatric disorder risk genes, whereas astrocytic H-MAGMA was used to assess cellular expression profiles and age-associated expression changes in astrocytes for degenerative disorders. We processed log-transformed expression values per cell or sample using a scale(center=T, scale=F) function in R. Average centered expression values of genes associated with brain disorders were calculated for each cell type.
Gene ontology analysis
We used an R package gProfileR (https://biit.cs.ut.ee/gprofiler/gost) for running gene ontology analysis, as it allows a ranked gene list, which resembles Gene Set Enrichment Analysis (GSEA). Because it does not require a P-value threshold to select significantly associated genes, it allows comparing gene ontologies for differently powered GWAS in a non-bias fashion. After ranking genes based on Z-scores generated by H-MAGMA, we ran gene ontology analysis using this command line:
gprofiler(<Ranked gene list>, organism=“hsapiens”, ordered_query=T, significant=T, max_p_value=0.05, min_set_size=15, max_set_size=600, min_isect_size=5, correction_method=“fdr”, hier_filtering=“moderate”, custom_bg=background gene set, include_graph=T, src_filter=“GO”)
Gene-set analysis
Genes that harbor de novo protein disrupting variation in developmental disorders (DD) were obtained from the Deciphering Developmental Disorders Study (93 DD risk genes with genome-wide significance)64. We also obtained 102 ASD risk genes (rare variation burden, FDR<0.1) from the Autism Sequencing Consortium (ASC) study65. Schizophrenia risk genes with elevated burden of rare variation were obtained from Singh et al., 201666 (110 genes with FDR<0.3). Differentially expressed genes (DEG) in postmortem brains with psychiatric disorders were obtained from Gandal et al., 201840 (FDR<0.05). Cell-type specific DEG in AD postmortem brains was obtained from Mathys et al., 201924.
Since different brain disorders have different numbers of significantly associated genes, we tried to avoid selecting genes based on a P-value threshold. In comparing H-MAGMA outputs with DEG, we used the gene-set analysis embedded in MAGMA, which utilizes the whole gene-level association statistics while controlling for covariates such as gene size and LD2. In comparing H-MAGMA outputs (common variation) with the gene lists that harbor protein disrupting variation (rare variation), we used a generalized linear model controlling for the exome length (controlling for rare variation) and the number of SNPs mapped to each gene (controlling for common variation).
glm(<MAGMA Z-scores> ~ <Rare variation annotation file> + <Exome length> + <The number of SNPs mapped to genes>)
We took this alternative approach than using MAGMA gene-set analysis because protein disrupting variation in brain disorders was detected by exome-sequencing and is dependent on the exon, but not gene length.
Rank-rank hypergeometric overlap (RRHO)
We assessed genetic relationship between two disorders (rg) by using genetic correlation analysis of LDSC45. To provide similar metrics based on gene-level association statistics, we compared ranks between two datasets (e.g. H-MAGMA outcomes from two disorders) using an R package RRHO (https://www.bioconductor.org/packages/release/bioc/html/RRHO.html) with the following command line:
RRHO(<Ranked gene list 1>, <Ranked gene list 2>, outputdir=<output directory>, alternative=“enrichment”, BY=TRUE, log10.ind=TRUE)
To compare gene-level overlaps (RRHO output) with genetic correlations (calculated by LDSC), P-values from RRHO was converted into Z-scores using the following command line:
Zscore = qnorm(10^(-Pvalues), lower.tail=FALSE)
We then compared resulting RRHO Z-scores with rg values from the genetic correlation analysis using Pearson’s correlation. This correlation coefficient provides a metric to compare a genetic relationship between two disorders measured at the SNP level (rg) vs. gene-level (RRHO Z).
Identification of pleiotropic genes
RRHO outputs two gene sets consisting of most up and downregulated genes, with most upregulated genes referring to a list of genes that are associated with both conditions, and most downregulated genes referring to a list of genes that are not associated with both conditions. Therefore, we employed most upregulated genes as a gene list that is shared between two disorders, hence representing pleiotropic genes. We then generated pleiotropic genes shared in at least four disorders by intersecting RRHO most upregulated genes between the following disorder pairs (ADHD vs. ASD/BD/SCZ/MDD; ASD vs. BD/SCZ/MDD; BD vs. SCZ/MDD; and SCZ vs. MDD). Since psychiatric disorder-associated genes showed neurodevelopmental and neuronal enrichment, we used fetal brain and neuronal H-MAGMA results. We merged the gene sets by a union function in R and obtained uniquely identified genes. The code is provided in the github repository: https://github.com/thewonlab/H-MAGMA. In the end, we obtained 1,841 genes that are shared in more than four disorders, and defined them as pleiotropic genes. These genes were compared with the genes mapped to pleiotropic versus non-pleiotropic GWS loci from the meta-analysis of 8 psychiatric disorders14. We next performed the gene ontology, developmental expression, and cell-type expression analyses on the pleiotropic genes as described above.
Data availability
All GWAS summary statistics used in this study are publicly available. We deposited (1) H-MAGMA input files derived from the fetal and adult brain, and neuronal and astrocytic Hi-C data, and (2) H-MAGMA output files for nine brain disorders in the github repository https://github.com/thewonlab/H-MAGMA.
Code availability
Codes used in this study are provided in the github repository: https://github.com/thewonlab/H-MAGMA.
Extended Data
Extended Data Fig. 1. Comparison between H-MAGMA and cMAGMA.
a. The number and proportion of intronic and intergenic SNPs annotated to proximal and distal genes. SNPs mapped to proximal genes may also have distal associations, while SNPs mapped to distal genes do not have any association with proximal genes. b. The number of brain disorder risk genes (genes that are significantly associated with each brain disorder at a threshold of FDR<0.05) predicted by H-MAGMA and cMAGMA. % H-MAGMA denotes the percentage of H-MAGMA selective genes (genes that were identified by H-MAGMA but not by cMAGMA). c. The number of SNPs assigned to each gene for H-MAGMA and cMAGMA. Center, median; box=1st-3rd quartiles (Q); minima, Q1 – 1.5 x interquartile range (IQR); maxima, Q3 + 1.5 x IQR. d. The number and proportion of SNPs annotated to the cognate genes by H-MAGMA and cMAGMA. e. H-MAGMA selective SNPs (SNPs assigned to H-MAGMA selective genes in H-MAGMA – SNPs assigned to H-MAGMA selective genes in cMAGMA) explain a significant proportion of heritability. Top graph: Heritability enrichment ± standard error; enrichment denotes proportion of heritability/proportion of SNPs; red dotted line, enrichment=1. Bottom graph: false discovery rate (FDR) of heritability enrichment: red dotted line, FDR=0.05.
Extended Data Fig. 2. Heritability enrichment of brain disorders in active regulatory elements of multiple tissue/cell types.
(Top) Scaled enrichment values. (Bottom) Significance of heritability enrichment (P-values). ESC, embryonic stem cells. ESDR, embryonic stem cell derived cell lines.
Extended Data Fig. 3. Developmental expression trajectories of brain disorder risk genes derived from cMAGMA.
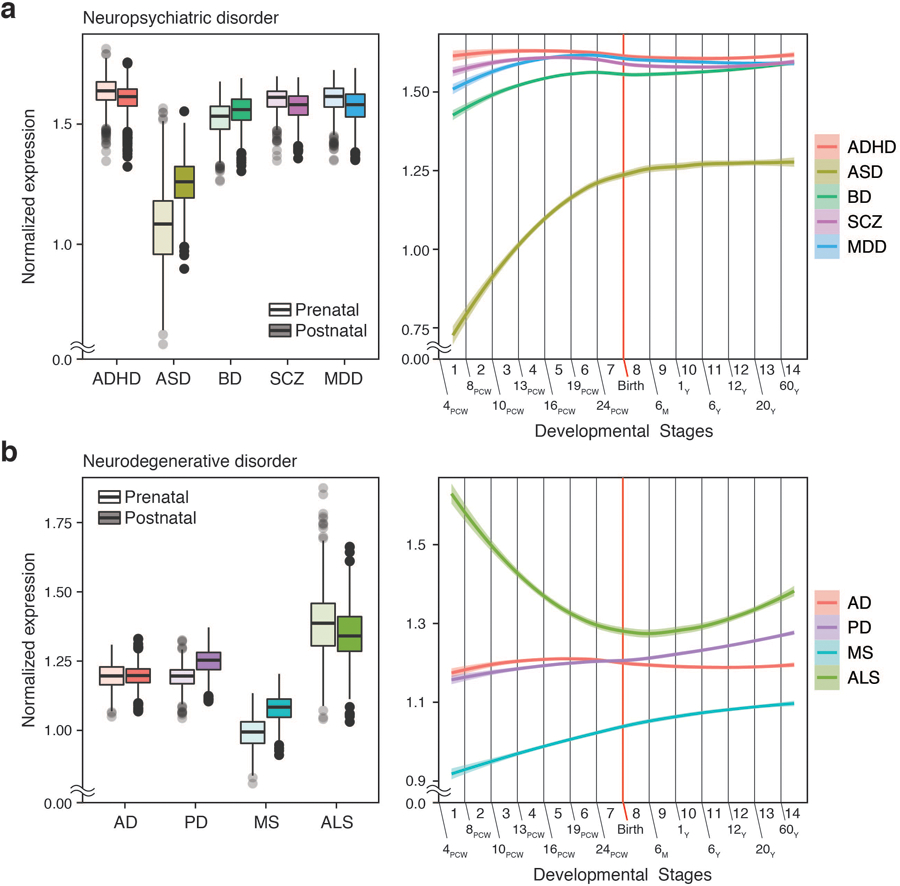
PCW, post-conception week; M, month; Y, year. (Left) N = 410 and 453 for prenatal and postnatal samples, respectively. Center, median; box=Q1-Q3; lower whisker, Q1 – 1.5 x IQR; upper whisker, Q3 + 1.5 x IQR. (Right) LOESS smooth curve with 95% confidence bands.
Extended Data Fig. 4. Cellular expression profiles of brain disorder risk genes.
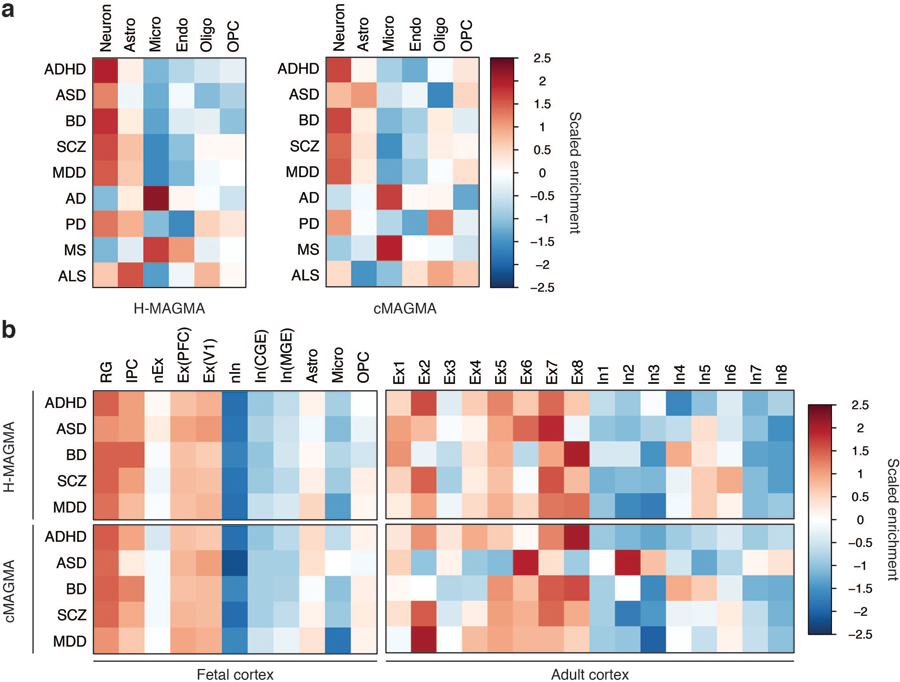
a. Cellular expression profiles of brain disorder risk genes derived from H-MAGMA and cMAGMA. Psychiatric disorder-associated genes are highly expressed in neurons, while neurogenerative disorder-associated genes show glial signatures. Astro, astrocytes; Micro, microglia; Endo, endothelial cells; Oligo, oligodendrocytes; OPC, oligodendrocytes progenitor cells. b. Psychiatric disorder-associated genes are highly expressed in radial glia and excitatory neurons in the developing cortex. RG, radial glia, vRG; ventricular RG; oRG, outer RG; tRG, truncated RG; IPC, intermediate progenitor cells; Ex, excitatory neurons; In, inhibitory neurons; nEx/nIn, newly born excitatory/inhibitor neurons; PFC, prefrontal cortex; V1, visual cortex; CGE, caudal ganglionic eminence; MGE, medial ganglionic eminence.
Extended Data Fig. 5. Overlap between brain disorder risk genes derived from neuronal and astrocytic H-MAGMA.
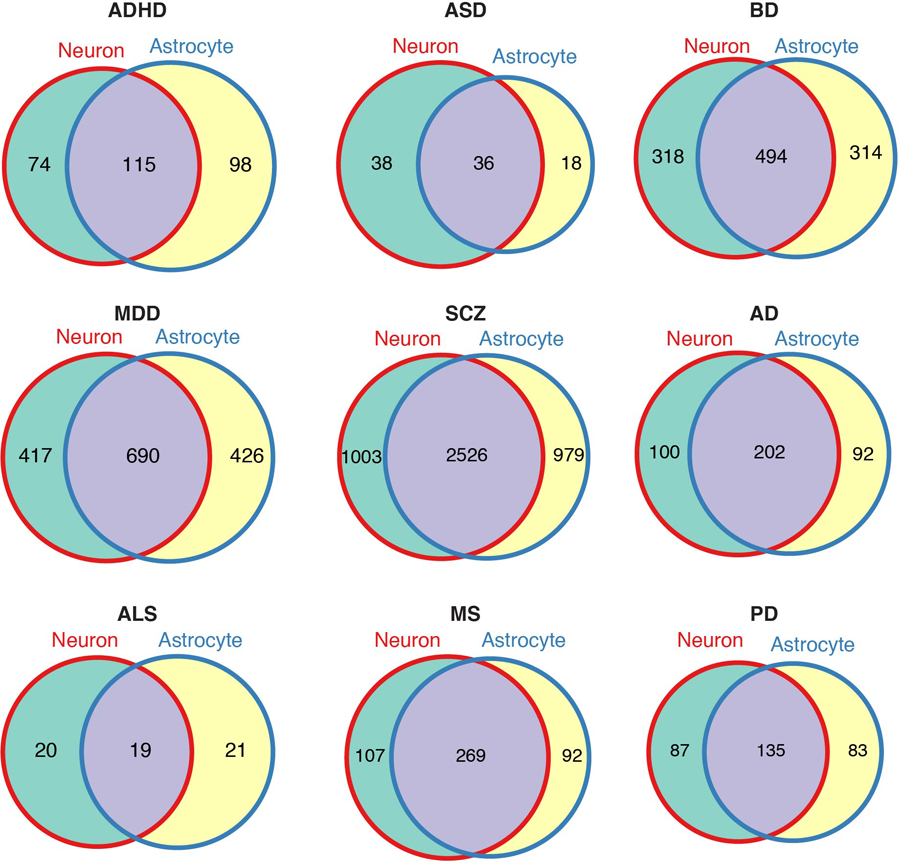
Brain disorder risk genes (FDR<0.05) were compared between neuronal and astrocytic H-MAGMA results.
Extended Data Fig. 6. Psychiatric disorder risk genes predicted by H-MAGMA are dysregulated in postmortem brains of individuals with psychiatric disorders.
a. Overlap between common variation associated genes and genes differentially expressed (DEG) in postmortem brains with psychiatric disorders. b. Overlap between common variation associated genes and co-expression (co-exp) modules differentially regulated in psychiatric disorders. Down, modules are downregulated in disorders; Up, modules are upregulated in disorders.
Extended Data Fig. 7. Genetic relationships among brain disorders.
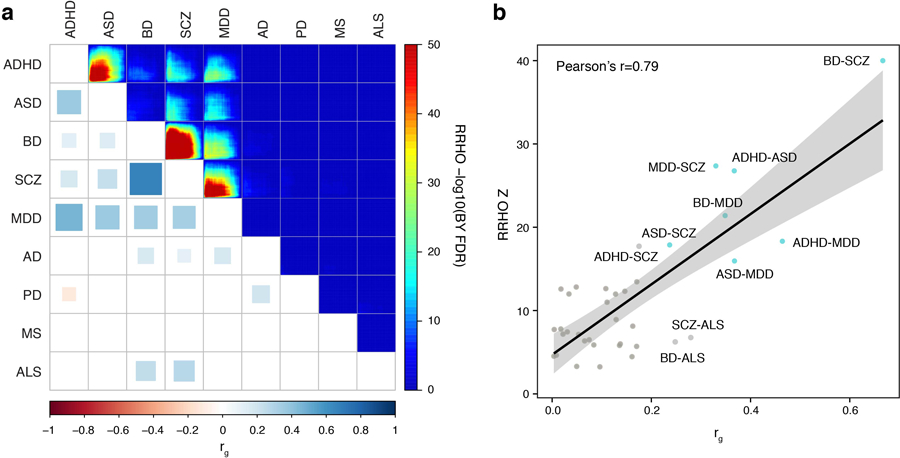
a. Psychiatric disorders show strong genetic relationships both at the level of genetic correlations (bottom left, rg) and gene-level overlaps (top right, RRHO). BY FDR, P-values adjusted by the Benjamini and Yekutieli procedure. b. Genetic correlations measured with Pearson’s correlation (rg) and gene-level overlaps (RRHO Z) are highly correlated, indicating that gene-level overlaps obtained by H-MAGMA recapitulate genetic correlations. Brain disorders that show strong genetic correlations (rg > 0.2) and gene-level overlaps (RRHO Z > 15) are marked in blue. Linear regression line with 95% confidence bands.
Supplementary Material
Supplementary Data 1 Comparison of brain disorder risk genes identified by H-MAGMA and cMAGMA.
Supplementary Data 2 Brain disorder risk genes identified by H-MAGMA.
Supplementary Data 3 Statistical comparison between prenatal and postnatal expression values of brain disorder risk genes.
Supplementary Data 4 Gene ontologies of brain disorder risk genes based on fetal and adult brain H-MAGMA.
Supplementary Data 5 Gene ontologies of brain disorder risk genes based on cMAGMA.
Supplementary Data 6 Gene ontologies of brain disorder risk genes based on neuronal and astrocytic H-MAGMA.
Supplementary Data 7 A list of pleiotropic genes.
Acknowledgement
We thank members of the Won lab and Daniel H. Geschwind for helpful discussions and comments about this paper. Sergio Espeso Gil helped transferring Hi-C datasets for neurons and astrocytes. This research was supported by National Institute of Mental Health grants (R00MH113823, DP2MH122403, H.W.; R56 MH101454, K.J.B.; R0MH106056, S.A and K.J.B.), a NARSAD Young Investigator Award from the Brain and Behavior Research Foundation (H.W.), a SPARK grant from the Simons Foundation Autism Research Initiative (H.W.), training grants from the UNC Neuroscience Center (5T32NS007431, N.Y.A.S., H.F.), and Helen Lyng White Fellowship (W.M.).
Footnotes
Competing Interests Statement
The authors declare no competing interests.
Reference
- 1.Edwards SL, Beesley J, French JD & Dunning AM Beyond GWASs: illuminating the dark road from association to function. Am J Hum Genet 93, 779–797 (2013). [DOI] [PMC free article] [PubMed] [Google Scholar]
- 2.de Leeuw CA, Mooij JM, Heskes T & Posthuma D MAGMA: generalized gene-set analysis of GWAS data. PLoS Comput Biol 11, e1004219 (2015). [DOI] [PMC free article] [PubMed] [Google Scholar]
- 3.Wang D et al. Comprehensive functional genomic resource and integrative model for the human brain. Science 362, eaat8464 (2018). [DOI] [PMC free article] [PubMed] [Google Scholar]
- 4.Won H et al. Chromosome conformation elucidates regulatory relationships in developing human brain. Nature 538, 523–527 (2016). [DOI] [PMC free article] [PubMed] [Google Scholar]
- 5.Roadmap Epigenomics Consortium et al. Integrative analysis of 111 reference human epigenomes. Nature 518, 317–330 (2015). [DOI] [PMC free article] [PubMed] [Google Scholar]
- 6.Finucane HK et al. Partitioning heritability by functional annotation using genome-wide association summary statistics. Nat Genet 47, 1228–1235 (2015). [DOI] [PMC free article] [PubMed] [Google Scholar]
- 7.Watanabe K, Taskesen E, van Bochoven A & Posthuma D Functional mapping and annotation of genetic associations with FUMA. Nat. Commun 8, 1826 (2017). [DOI] [PMC free article] [PubMed] [Google Scholar]
- 8.Shi H, Kichaev G & Pasaniuc B Contrasting the Genetic Architecture of 30 Complex Traits from Summary Association Data. Am. J. Hum. Genet 99, 139–153 (2016). [DOI] [PMC free article] [PubMed] [Google Scholar]
- 9.Giambartolomei C et al. Bayesian test for colocalisation between pairs of genetic association studies using summary statistics. PLoS Genet 10, e1004383 (2014). [DOI] [PMC free article] [PubMed] [Google Scholar]
- 10.Gusev A et al. Integrative approaches for large-scale transcriptome-wide association studies. Nat Genet 48, 245–252 (2016). [DOI] [PMC free article] [PubMed] [Google Scholar]
- 11.Gusev A et al. Transcriptome-wide association study of schizophrenia and chromatin activity yields mechanistic disease insights. Nat Genet 50, 538–548 (2018). [DOI] [PMC free article] [PubMed] [Google Scholar]
- 12.Kang HJ et al. Spatio-temporal transcriptome of the human brain. Nature 478, 483–489 (2011). [DOI] [PMC free article] [PubMed] [Google Scholar]
- 13.De La Torre-Ubieta L, Won H, Stein JLL & Geschwind DHH Advancing the understanding of autism disease mechanisms through genetics. Nat Med 22, 345–361 (2016). [DOI] [PMC free article] [PubMed] [Google Scholar]
- 14.Cross-Disorder Group of the Psychiatric Genomics Consortium. Electronic address: plee0@mgh.harvard.edu, P. H. et al. Genomic Relationships, Novel Loci, and Pleiotropic Mechanisms across Eight Psychiatric Disorders. Cell 179, 1469–1482.e11 (2019). [DOI] [PMC free article] [PubMed] [Google Scholar]
- 15.Schork AJ et al. A genome-wide association study of shared risk across psychiatric disorders implicates gene regulation during fetal neurodevelopment. Nat. Neurosci 22, 353–361 (2019). [DOI] [PMC free article] [PubMed] [Google Scholar]
- 16.Network Pathway Analysis Subgroup of the Psychiatric Genomics Consortium. Psychiatric genome-wide association study analyses implicate neuronal, immune and histone pathways. Nat Neurosci 18, 926 (2015). [DOI] [PubMed] [Google Scholar]
- 17.Marín O Developmental timing and critical windows for the treatment of psychiatric disorders. Nat Med 22, 1229–1238 (2016). [DOI] [PubMed] [Google Scholar]
- 18.Wegiel J et al. The neuropathology of autism: defects of neurogenesis and neuronal migration, and dysplastic changes. Acta Neuropathol 119, 755–770 (2010). [DOI] [PMC free article] [PubMed] [Google Scholar]
- 19.Zoghbi HY & Bear MF Synaptic dysfunction in neurodevelopmental disorders associated with autism and intellectual disabilities. Cold Spring Harb. Perspect. Biol 4, a009886 (2012). [DOI] [PMC free article] [PubMed] [Google Scholar]
- 20.Deutsch SI, Urbano MR, Burket JA, Herndon AL & Winebarger EE Pharmacotherapeutic implications of the association between genomic instability at chromosome 15q13.3 and autism spectrum disorders. Clin Neuropharmacol 34, 203–205 (2011). [DOI] [PubMed] [Google Scholar]
- 21.Muller CL, Anacker AMJ & Veenstra-VanderWeele J The serotonin system in autism spectrum disorder: From biomarker to animal models. Neuroscience 321, 24–41 (2016). [DOI] [PMC free article] [PubMed] [Google Scholar]
- 22.Berman JA, Talmage DA & Role LW Cholinergic Circuits and Signaling in the Pathophysiology of Schizophrenia. Int. Rev. Neurobiol 78, 193–223 (2007). [DOI] [PMC free article] [PubMed] [Google Scholar]
- 23.Marino F & Cosentino M Repurposing dopaminergic drugs for MS — the evidence mounts. Nat. Rev. Neurol 12, 191–192 (2016). [DOI] [PubMed] [Google Scholar]
- 24.Mathys H et al. Single-cell transcriptomic analysis of Alzheimer’s disease. Nature 1 (2019). doi: 10.1038/s41586-019-1195-2 [DOI] [PMC free article] [PubMed] [Google Scholar]
- 25.Consortium Brainstorm et al. Analysis of shared heritability in common disorders of the brain. Science 360, eaap8757 (2018). [DOI] [PMC free article] [PubMed] [Google Scholar]
- 26.Iqbal K, Liu F & Gong C-X Tau and neurodegenerative disease: the story so far. Nat. Rev. Neurol 12, 15–27 (2016). [DOI] [PubMed] [Google Scholar]
- 27.Haass C & Selkoe DJ Soluble protein oligomers in neurodegeneration: lessons from the Alzheimer’s amyloid β-peptide. Nat. Rev. Mol. Cell Biol 8, 101–112 (2007). [DOI] [PubMed] [Google Scholar]
- 28.Mulligan KA & Cheyette BN R. Neurodevelopmental Perspectives on Wnt Signaling in Psychiatry. Mol. neuropsychiatry 2, 219–246 (2017). [DOI] [PMC free article] [PubMed] [Google Scholar]
- 29.Edmunds SR, Kover ST & Stone WL The relation between parent verbal responsiveness and child communication in young children with or at risk for autism spectrum disorder: A systematic review and meta-analysis. Autism Res (2019). doi: 10.1002/aur.2100 [DOI] [PMC free article] [PubMed] [Google Scholar]
- 30.Parikshak NN et al. Genome-wide changes in lncRNA, splicing, and regional gene expression patterns in autism. Nature 540, 423–427 (2016). [DOI] [PMC free article] [PubMed] [Google Scholar]
- 31.Skene NG et al. Genetic identification of brain cell types underlying schizophrenia. Nat Genet 50, 825–833 (2018). [DOI] [PMC free article] [PubMed] [Google Scholar]
- 32.Hansen DV, Hanson JE & Sheng M Microglia in Alzheimer’s disease. J Cell Biol 217, 459–472 (2018). [DOI] [PMC free article] [PubMed] [Google Scholar]
- 33.Clement AM et al. Wild-Type Nonneuronal Cells Extend Survival of SOD1 Mutant Motor Neurons in ALS Mice. Science (80-. ) 302, 113–117 (2003). [DOI] [PubMed] [Google Scholar]
- 34.Halliday GM & Stevens CH Glia: Initiators and progressors of pathology in Parkinson’s disease. Mov. Disord 26, 6–17 (2011). [DOI] [PubMed] [Google Scholar]
- 35.Ortiz GG et al. Role of the Blood–Brain Barrier in Multiple Sclerosis. Arch. Med. Res 45, 687–697 (2014). [DOI] [PubMed] [Google Scholar]
- 36.Voineagu I et al. Transcriptomic analysis of autistic brain reveals convergent molecular pathology. Nature 474, 380–384 (2011). [DOI] [PMC free article] [PubMed] [Google Scholar]
- 37.Rajarajan P et al. Neuron-specific signatures in the chromosomal connectome associated with schizophrenia risk. Science (80-. ) 362, (2018). [DOI] [PMC free article] [PubMed] [Google Scholar]
- 38.Clarke LE et al. Normal aging induces A1-like astrocyte reactivity. Proc. Natl. Acad. Sci. U. S. A 115, E1896–E1905 (2018). [DOI] [PMC free article] [PubMed] [Google Scholar]
- 39.Brambilla R The contribution of astrocytes to the neuroinflammatory response in multiple sclerosis and experimental autoimmune encephalomyelitis. Acta Neuropathol 137, 757–783 (2019). [DOI] [PMC free article] [PubMed] [Google Scholar]
- 40.Gandal MJ et al. Transcriptome-wide isoform-level dysregulation in ASD, schizophrenia, and bipolar disorder. Science (80-. ) 362, eaat8127 (2018). [DOI] [PMC free article] [PubMed] [Google Scholar]
- 41.Grove J et al. Identification of common genetic risk variants for autism spectrum disorder. Nat. Genet 51, 431–444 (2019). [DOI] [PMC free article] [PubMed] [Google Scholar]
- 42.Mah W & Won H The three-dimensional landscape of the genome in human brain tissue unveils regulatory mechanisms leading to schizophrenia risk. Schizophr. Res (2019). doi: 10.1016/J.SCHRES.2019.03.007 [DOI] [PMC free article] [PubMed] [Google Scholar]
- 43.Wray NR et al. Genome-wide association analyses identify 44 risk variants and refine the genetic architecture of major depression. Nat Genet 50, 668–681 (2018). [DOI] [PMC free article] [PubMed] [Google Scholar]
- 44.Plaisier SB, Taschereau R, Wong JA & Graeber TG Rank–rank hypergeometric overlap: identification of statistically significant overlap between gene-expression signatures. Nucleic Acids Res 38, e169–e169 (2010). [DOI] [PMC free article] [PubMed] [Google Scholar]
- 45.Bulik-Sullivan B et al. An atlas of genetic correlations across human diseases and traits. Nat Genet 47, 1236–1241 (2015). [DOI] [PMC free article] [PubMed] [Google Scholar]
- 46.Gerring ZF, Gamazon ER, Derks EM & Consortium, for the M. D. D. W. G. of the P. G. A gene co-expression network-based analysis of multiple brain tissues reveals novel genes and molecular pathways underlying major depression. PLOS Genet 15, e1008245 (2019). [DOI] [PMC free article] [PubMed] [Google Scholar]
- 47.Alasoo K et al. Shared genetic effects on chromatin and gene expression indicate a role for enhancer priming in immune response. Nat. Genet 50, 424–431 (2018). [DOI] [PMC free article] [PubMed] [Google Scholar]
- 48.Gate RE et al. Genetic determinants of co-accessible chromatin regions in activated T cells across humans. Nat. Genet 50, 1140–1150 (2018). [DOI] [PMC free article] [PubMed] [Google Scholar]
- 49.Mohammadi S, Davila-Velderrain J & Kellis M Reconstruction of Cell-type-Specific Interactomes at Single-Cell Resolution. Cell Syst (2019). doi: 10.1016/j.cels.2019.10.007 [DOI] [PMC free article] [PubMed] [Google Scholar]
Methods-only References
- 50.Demontis D et al. Discovery of the first genome-wide significant risk loci for attention deficit/hyperactivity disorder. Nat. Genet 51, 63–75 (2019). [DOI] [PMC free article] [PubMed] [Google Scholar]
- 51.Stahl EA et al. Genome-wide association study identifies 30 loci associated with bipolar disorder. Nat. Genet 51, 793–803 (2019). [DOI] [PMC free article] [PubMed] [Google Scholar]
- 52.Pardiñas AF et al. Common schizophrenia alleles are enriched in mutation-intolerant genes and in regions under strong background selection. Nat Genet 50, 381–389 (2018). [DOI] [PMC free article] [PubMed] [Google Scholar]
- 53.Howard DM et al. Genome-wide meta-analysis of depression identifies 102 independent variants and highlights the importance of the prefrontal brain regions. Nat. Neurosci 22, 343–352 (2019). [DOI] [PMC free article] [PubMed] [Google Scholar]
- 54.Jansen IE et al. Genome-wide meta-analysis identifies new loci and functional pathways influencing Alzheimer’s disease risk. Nat. Genet 51, 404–413 (2019). [DOI] [PMC free article] [PubMed] [Google Scholar]
- 55.Nalls MA et al. Identification of novel risk loci, causal insights, and heritable risk for Parkinson’s disease: a meta-analysis of genome-wide association studies. Lancet Neurol 18, 1091–1102 (2019). [DOI] [PMC free article] [PubMed] [Google Scholar]
- 56.Andlauer TFM et al. Novel multiple sclerosis susceptibility loci implicated in epigenetic regulation. Sci. Adv 2, e1501678 (2016). [DOI] [PMC free article] [PubMed] [Google Scholar]
- 57.van Rheenen W et al. Genome-wide association analyses identify new risk variants and the genetic architecture of amyotrophic lateral sclerosis. Nat. Genet 48, 1043–1048 (2016). [DOI] [PMC free article] [PubMed] [Google Scholar]
- 58.Schizophrenia Working Group of the Psychiatric Genomics Consortium et al. Biological insights from 108 schizophrenia-associated genetic loci. Nature 511, 421–427 (2014). [DOI] [PMC free article] [PubMed] [Google Scholar]
- 59.Ernst J & Kellis M Large-scale imputation of epigenomic datasets for systematic annotation of diverse human tissues. Nat Biotechnol 33, 364–376 (2015). [DOI] [PMC free article] [PubMed] [Google Scholar]
- 60.Darmanis S et al. A survey of human brain transcriptome diversity at the single cell level. Proc Natl Acad Sci U S A 112, 7285–7290 (2015). [DOI] [PMC free article] [PubMed] [Google Scholar]
- 61.Nowakowski TJ et al. Spatiotemporal gene expression trajectories reveal developmental hierarchies of the human cortex. Science (80-. ) 358, 1318–1323 (2017). [DOI] [PMC free article] [PubMed] [Google Scholar]
- 62.Lake BB et al. Neuronal subtypes and diversity revealed by single-nucleus RNA sequencing of the human brain. Science (80-. ) 352, 1586–1590 (2016). [DOI] [PMC free article] [PubMed] [Google Scholar]
- 63.Zhang Y et al. Purification and Characterization of Progenitor and Mature Human Astrocytes Reveals Transcriptional and Functional Differences with Mouse. Neuron 89, 37–53 (2016). [DOI] [PMC free article] [PubMed] [Google Scholar]
- 64.Deciphering Developmental Disorders, S. Prevalence and architecture of de novo mutations in developmental disorders. Nature 542, 433–438 (2017). [DOI] [PMC free article] [PubMed] [Google Scholar]
- 65.Satterstrom FK et al. Large-Scale Exome Sequencing Study Implicates Both Developmental and Functional Changes in the Neurobiology of Autism. Cell (2020). doi: 10.1016/j.cell.2019.12.036 [DOI] [PMC free article] [PubMed] [Google Scholar]
- 66.Singh T et al. Rare loss-of-function variants in SETD1A are associated with schizophrenia and developmental disorders. Nat Neurosci 19, 571–577 (2016). [DOI] [PMC free article] [PubMed] [Google Scholar]
Associated Data
This section collects any data citations, data availability statements, or supplementary materials included in this article.
Supplementary Materials
Supplementary Data 1 Comparison of brain disorder risk genes identified by H-MAGMA and cMAGMA.
Supplementary Data 2 Brain disorder risk genes identified by H-MAGMA.
Supplementary Data 3 Statistical comparison between prenatal and postnatal expression values of brain disorder risk genes.
Supplementary Data 4 Gene ontologies of brain disorder risk genes based on fetal and adult brain H-MAGMA.
Supplementary Data 5 Gene ontologies of brain disorder risk genes based on cMAGMA.
Supplementary Data 6 Gene ontologies of brain disorder risk genes based on neuronal and astrocytic H-MAGMA.
Supplementary Data 7 A list of pleiotropic genes.
Data Availability Statement
All GWAS summary statistics used in this study are publicly available. We deposited (1) H-MAGMA input files derived from the fetal and adult brain, and neuronal and astrocytic Hi-C data, and (2) H-MAGMA output files for nine brain disorders in the github repository https://github.com/thewonlab/H-MAGMA.


