Abstract
Aim:
The goal of this study was to comprehensively interrogate and map DNA methylation across 16 CpG-dense regions previously associated with oral and pharyngeal squamous cell carcinoma (OPSCC).
Materials & methods:
Targeted multiplex bisulfite amplicon sequencing was performed on four OPSCC cell lines and primary non-neoplastic oral epithelial cells. Real-time quantitative polymerase chain reaction (RT-qPCR) was performed for a subset of associated genes.
Results:
There was clear differential methylation between one or more OPSCC cell lines and control cells for the majority of CpG-dense regions.
Conclusion:
Targeted multiplex bisulfite amplicon sequencing allowed us to efficiently map methylation across the entire region of interest with a high degree of sensitivity and helps shed light on novel differentially methylated regions that may have value as biomarkers of OPSCC.
Keywords: : BSAS, DNA methylation, epigenetics, head and neck cancer, HNSCC
Oral and pharyngeal cancer accounted for an estimated 51,540 new cancer diagnoses and 10,030 deaths in the USA in 2018 [1], of which more than 90% were squamous cell carcinoma (OPSCC) [2]. The prognosis for OPSCC is relatively poor, with an overall 5-year survival around 65% [3]. Additionally, many of these patients experience a high degree of morbidity as a result of treatment [4], particularly for patients with advanced disease. This underscores the need for development of biomarkers for early detection of primary and recurrent disease.
Epigenetic dysregulation is recognized as playing a key role during the genesis of OPSCC [5,6], although the focus of the scientific literature has largely been on promoter hypermethylation, despite the increasingly recognized importance of gene body [7] and even intergenic methylation [8,9] in transcriptional regulation and cancer development. A number of studies have investigated the potential utility of oral rinse methylation panels for early detection [10–21]. However, these studies reflect the aforementioned emphasis on promoter methylation, with the bulk of these studies having focused on methylation panels based on a relatively limited set of candidate gene promoters and little heed paid to potentially important roles of CpG island methylation outside of this context. Thus, expansion of our understanding of non-canonical differential methylation associated with OPSCC can greatly expand the available targets for biomarker development.
We previously identified several novel CpG-dense regions – the majority of which are situated outside of the promoter region – that were differentially methylated in OPSCC based on Infinium HumanMethylation450 array data [22]. To advance our understanding of the epigenetic landscape of OPSCC, we sought to further characterize differential methylation across the novel differentially methylated CpG-dense regions that were identified in our previous study by performing multiplexed targeted bisulfite amplicon sequencing (BSAS) [23,24] – a powerful but underutilized tool allowing for deep coverage and efficient interrogation of DNA methylation in regions of interest – and corresponding expression analysis of 4 OPSCC cell lines relative to non-neoplastic oral epithelial cells.
Materials & methods
Cell culture
We cultured four OPSCC cell lines originating from four distinct sites in the upper aerodigestive tract: H413 (buccal; Sigma-Aldrich, MO, USA; authenticated 24 November 2006) [25]; Detroit 562 (pharynx metastatic to pleura; obtained 7 May 2016 from ATCC, VA, USA; authenticated 17 February 2015) [26]; FaDu (hypopharynx; obtained 7 May 2016 from ATCC; authenticated 27 February 2014) [27]; and Cal 27 (tongue; obtained 7 May 2016 from ATCC; authenticated 26 November 2014) [28]. ATCC cell lines were authenticated by ATCC through morphological assessment, cytochrome C oxidase subunit I DNA barcoding, and short tandem repeat analysis; cells were tested for mycoplasma contamination using the Hoechst staining and agar culture methods. Sigma-Aldrich obtained the H413 cell line from the European Collection of Authenticated Cell Cultures; cells were authenticated using short tandem repeat analysis and tested for mycoplasma contamination using the Hoechst staining, agar culture and mycoplasma-specific PCR. Primary human oral epithelial cells pooled from three healthy donors were used as a nonmalignant control (CELLnTEC, Bern, Switzerland) and were tested for contamination using mycoplasma-specific RT-PCR prior to use.
OPSCC cells were cultivated in supplier-recommended media with 10% fetal bovine serum and 1% penicillin/streptomycin at 37°C with 5% CO2 in sterile 10 cm Nunclon™ Delta surface cell culture dishes (Thermo Fisher Scientific, MA, USA). Briefly, H413 was grown in Dulbecco’s modified Eagle’s medium/Nutrient F-12 Ham (DMEM-F12; Sigma-Aldrich), Detroit 562 and FaDu were grown in Eagle’s minimum essential medium (ATCC) and Cal 27 was grown in Dulbecco’s modified Eagle’s medium (ATCC). Primary oral epithelial cells were cultured in fully-defined CnT-Prime media (CELLnTEC) and 1% penicillin/streptomycin/Fungizone, at 37°C with 5% CO2. After reaching 80–90% confluence, 1,000,000 cells were frozen and stored at -80°C and retained for DNA isolation; an additional 1,000,000 were collected in RNAlater® for expression analysis.
Targeted bisulfite amplicon sequencing
Primer design for bisulfite PCR
Bisulfite PCR primers for BSAS of the CpG-dense regions – defined according to the Hidden Markov model approach [29] – were designed using an approach similar to those previously described [30]. Briefly, 4.5–5 kb genomic DNA (gDNA) including the flanking sequence of a target region was analyzed by MethPrimer [31] to design primers for bisulfite PCR. To facilitate the primer validation process, each amplicon was designed, when possible, to have a unique size so as to be distinguishable via Bioanalzyer HS DNA chip assay (Agilent, CA, USA). BSAS can support amplicons up to 800 base pair (bp). For sequencing of CpG-dense regions >800 bp, multiple overlapping amplicons were designed to provide coverage of the entire region. Of the 22-targeted regions, 24 pairs of primers were initially designed to over the entire regions, of which, 18 primer sets covering 16 of the regions were successfully designed and implemented (Supplementary Table 1).
Multiplexed bisulfite PCR
gDNA was quantified by Qubit dsDNA HS assay kit (Thermo Fisher Scientific). 500 ng of gDNA was sodium bisulfite modified using the EZ DNA Methylation Kit (Zymo Research, CA, USA), resulting in elution of 25 μl of bisulfite modified DNA for each sample. NEB Multiplex PCR 5X Master Mix (New England BioLabs, MA, USA) was used to test the specificity and amplification efficiency of bisulfite PCR, and primer pairs were divided into different groups according to their amplification efficiency. A manual hot-start approach was used according to the manufacturer’s recommendation. Multiplexed bisulfite PCRs were performed for each sample using 2 μl of bisulfite-modified DNA as template in 25 μl reactions, and the number of PCR cycles for the different groups were set from 36 to 40 according to primer efficiency.
Library preparation & sequencing
Library preparation and sequencing was performed by the University of Cincinnati Genomics, Epigenomics and Sequencing Core. Pooled column-purified PCR products were transferred to microTUBE (Covaris, MA, USA) and sheared for 480 s at 4C using a Covaris S2 focused-ultrasonicator (duty cycle = 10%, intensity = 5 and cycles per burst = 200). Based on the Bioanalyzer analysis, the majority of amplicons were fragmented to 50–300 bp with a peak size around 150 bp. Using the PrepX DNA Library kit and Apollo 324 NGS automated library preparation system (WaferGen, CA, USA), a ChIP-seq script was selected for sequencing library preparation. This script excludes inserts less than ∼100 bp from the library but retains larger ones for sequencing. In brief, fragmented DNA samples with overhangs were first converted to blunt ends through an end repair procedure and adenylated at 3′ ends for TA ligation to sequencing adaptors. The ligated library was then indexed and enriched by five cycles of PCR using sample-specific index and universal PCR primers, followed by automated purification using AMPure XP beads (Beckman Coulter, CA, USA). To check the quality and yield of the library, 1 μl of purified PCR library was analyzed via Bioanalyzer DNA High Sensitivity chip. To accurately quantify the pooled library concentration for cluster generation, the library was 1:104 diluted with dilution buffer (10 mM Tris-HCl, pH 8.0 with 0.05% Tween 20), and qPCR quantified using the NEBNext Library Quant Kit (New England Biolabs, MA, USA) on an ABI 9700HT real-time PCR system (Life Technologies, NY, USA).The quantified pooled library was used for cluster generation on a cBot system (Illumina, CA, USA). Libraries were clustered onto a flow cell at the final concentration of 16 pM using the TruSeq SR Cluster kit v3 (Illumina) and were sequenced for 50 cycles using the TruSeq SBS kit on a HiSeq system (Illumina), generating on average 2.5 million-pass filter reads per sample.
Bioinformatic analysis of BSAS
Clustered sequencing reads were demultiplexed using CASAVA 1.8. Demultiplexed fastq files were imported into CLC Genomics Workbench v10.0.1 (Qiagen, Hilden, DEU), reads were trimmed and mapped to the reference amplicons (Supplementary Figure 1), and methylation levels were called using the bisulfite sequencing plugin. For each of the targeted regions, we calculated the average and the standard deviation of the observed methylation levels at each CpG site across the triplicates of each cell line, which were plotted using the R package ggplot2 [32]. Additional annotation was added to a subset of methylation maps presented in the manuscript: cytogenic band location and gene context were added to the using images obtained for each region from UCSC Genome Browser [33]; and overlapping and proximal regulatory elements were identified and added to the plots using data from the Encyclopedia of DNA Elements ChIP-seq [34] and ORegAnno [35] annotation.
mRNA expression analysis
RNA was isolated from each respective cell line using the RNeasy micro kit (Qiagen) according to the manufacturer’s suggested protocol, and residual DNA was depleted by treating the isolate with DNase I. Following isolation, RNA concentration was determined using a Qubit 3.0 fluorometer (Thermo Fisher Scientific). Relative expression was measured via real-time quantitative PCR (RT-qPCR) using TaqMan Gene Expression assays (Thermo Fisher Scientific) for CIT (assay ID: Hs00294611_m1), PTHLH (assay ID: Hs00174969_m1), KCNQ1 (assay ID: Hs00923522_ml), ANKRD33B; assay ID: Hs03845457_s1), ZCCHC14 (assay ID: Hs00296622_m1) and MARCH4 (assay ID: Hs00863129_m1). GAPDH (assay ID: Hs03929097_g1) and RNA18S5 (assay ID: Hs99999901_s1) housekeeping genes were used as endogenous controls. Each sample was reverse transcribed using the High-Capacity cDNA Reverse Transcription Kit (Thermo Fisher Scientific) and run in triplicate for each assay on a StepOnePlus real-time PCR system (Thermo Fisher Scientific). A no template control and no amplification control were included on each plate for each assay to monitor the level of background signal and presence of contaminating DNA in the sample, respectively.
The geometric mean of the threshold cycle (CT) values for GAPDH and RNA18S5 was used to determine relative expression of each transcript of interest for each cell line. Expression was further quantified using the comparative CT method (2-ΔΔCT) [36] and reported as log 2 fold-difference for each OPSCC cell line relative to expression relative to the primary oral epithelial control cells. Correlation between mean methylation of each region and associated mean gene expression was tested using Spearman’s correlation coefficient. Tests were two-sided and significance was considered where p < 0.05.
Results
We bisulfite amplicon sequenced 16 OPSCC-associated CpG-dense regions that we had previously identified on the Infinium HumanMethylation450 platform [22]. The majority (14/16) did not involve the 5′-untranslated region (UTR), of which nine were situated in the gene body, four were situated in intergenic sequences and one was in the 3′-UTR of its host gene. Interestingly, half (8/16) of the CpG-dense regions overlapped or solely resided in intronic sequences. The median length of each region was 281.5 bp (range: 135–1270 bp), each of which included a median of 18.5 CpGs (range: 11–112). The median sequencing coverage was >1000×, although average coverage depth of the CpG-dense regions ranged from 62× to 13297×. A complete description of each region is provided in Table 1.
Table 1. . Description of the 16 novel oral and pharyngeal squamous cell carcinoma-associated CpG-dense regions interrogated by targeted bisulfite amplicon sequencing.
| CpG-dense region coordinates† | Region length (bp) | Total CpG count | Associated gene | Genomic context | Enhancer region | DNase I hypersensitivity site | Regulatory element binding site(s) | Average coverage (BSAS) | CpGs covered by infinium 450K beadarray (% coverage) |
|---|---|---|---|---|---|---|---|---|---|
| chr12:118725604–118725889 | 286 | 16 | CIT | Gene body (intron 9) | Yes | YY1 | 1862 | 3 (18.8%) | |
| chr12:28015205–28015607 | 403 | 18 | PTHLH | Gene body (intron 1) | EGR1; PRDM14 | 2409 | 3 (16.7%) | ||
| chr11:2511670–2512178 | 509 | 28 | KCNQ1 | Gene body (intron 2) | Yes | Yes | Multiple | 106 | 4 (14.3%) |
| chr1:8194584–8194818 | 235 | 16 | JD505160‡ | Intergenic | Yes | Yes | Multiple | 190 | 3 (18.8%) |
| chr12:110319267–110319654 | 388 | 29 | Intergenic | Yes | Multiple | 850 | 4 (13.8%) | ||
| chr19:5538686–5538939 | 254 | 19 | SAFB2 | Gene body (intron 19-exon 20) | 1229 | 3 (15.8%) | |||
| chr6:25135475–25135786 | 312 | 15 | RIPOR2 | Gene body (intron 1) | EGR1 | 183 | 3 (20.0%) | ||
| chr1:10818517–10818704 | 188 | 18 | Intergenic | Yes | Yes | Multiple | 2527 | 3 (16.7%) | |
| chr1:1385949–1386143 | 195 | 15 | ATAD3C | Gene body (intron 9-exon 10) | 2014 | 5 (33.3%) | |||
| chr10:53743705–53744974 | 1270 | 83 | DKK1 | 5′UTR:body (5′UTR-exon 1-intron 1) | Yes | Multiple | 1541 | 7 (8.4%) | |
| chr11:20588323–20588561 | 239 | 17 | SLC6A5 | Gene body (intron 5) | Yes | Yes | CTCF; Rad21 | 245 | 3 (17.6%) |
| chr10:134210902–134211265 | 364 | 22 | INPP5A | Gene body (intron 1) | c-Jun | 62 | 5 (22.7%) | ||
| chr5:10702368–10703458 | 1091 | 112 | ANKRD33B | Gene body (exon 4) | REST | 295 | 3 (2.7%) | ||
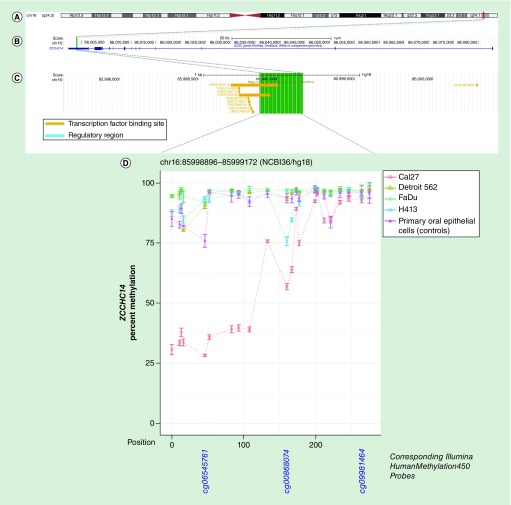
| chr16:85998896–85999172 | 277 | 22 | ZCCHC14 | 3′UTR | Yes | Multiple | 4606 | 3 (13.6%) | |
| chr5:1010475–1010610 | 136 | 11 | Intergenic | Yes | Yes | Multiple | 13297 | 3 (27.3%) | |
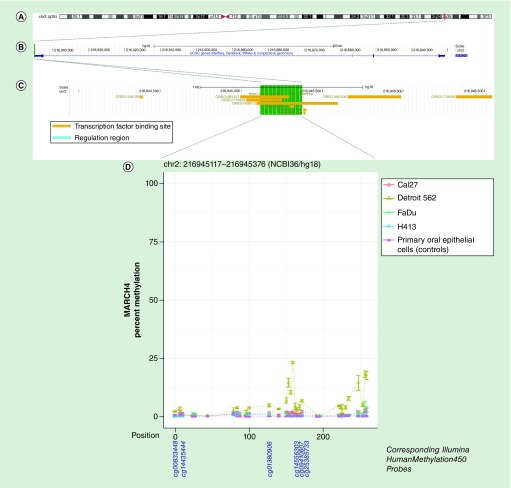
| chr2:216945117–216945376 | 260 | 32 | MARCH4 | 5′UTR | Yes | Multiple | 627 | 6 (18.8%) |
Coordinates correspond to CpG islands predicted by HMM using the NCBI36/hg18 assembly.
Putative non-coding RNA.
bp: Base pair; BSAS: Bisulfite amplicon sequencing; HMM: Hidden Markov model.
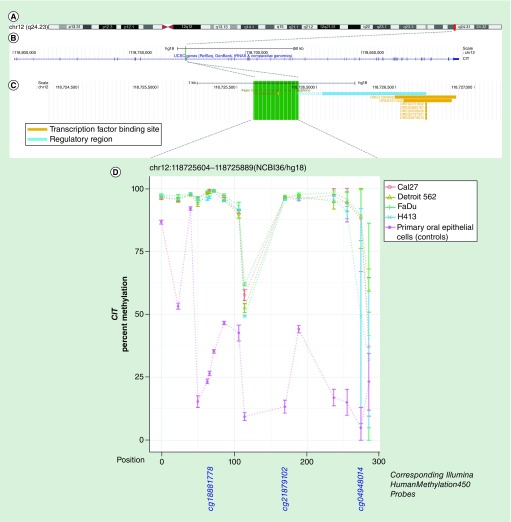
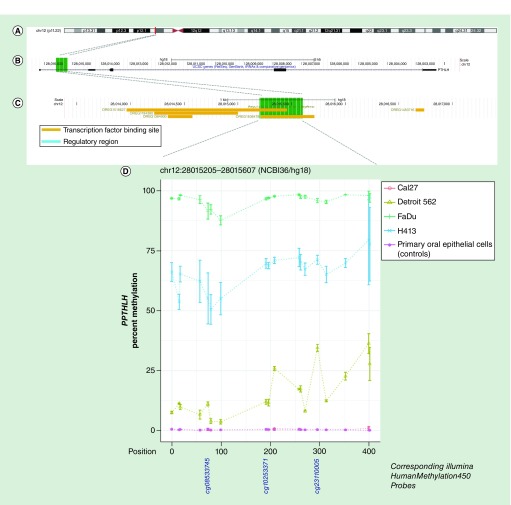
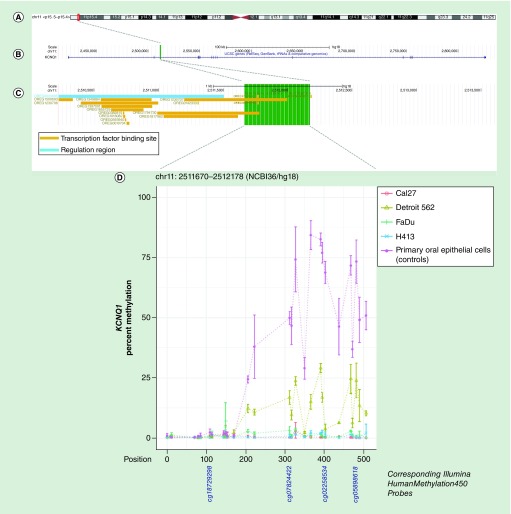
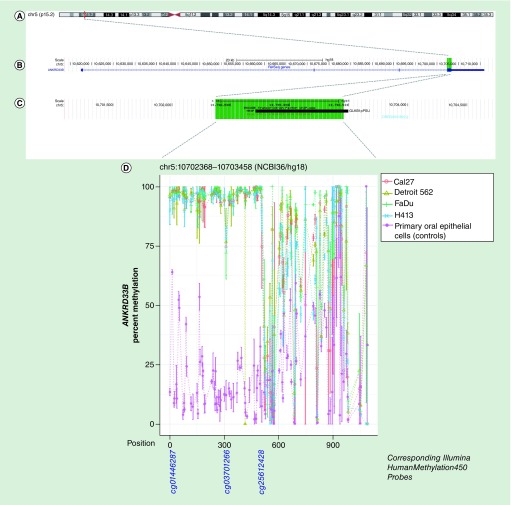
We employed targeted BSAS to allow us to comprehensively interrogate and the methylation of each region and map it in its entirety. Average methylation for each cell line at each of the 16 CpG-dense regions is presented in Table 2, in which differential mean methylation was observed for at least one OPSCC cell line relative to the oral epithelial control cells for 14 of the 16 regions, with the notable exceptions being the regions associated with DKK1 (chr10:53743705–53744974) and one of the intergenic regions (chr1:8194584–8194818). Select methylation maps with detailed annotation are presented in Figures 1–6 for a subset of CpG-dense regions associated with CIT, PTHLH, KCNQ1, ZCCHC14, MARCH4 and ANKRD33b genes. Methylation maps for all 16 CpG-dense regions are provided in Supplementary Figure 2, and p-values from formal t-tests of differential methylation for each OPSCC cell line relative to non-neoplastic oral epithelial cells at each individual CpG is presented in Supplementary Table 2. The methylation maps generated from the BSAS data also suggest that even within these CpG-dense regions, methylation levels can vary – this was particularly evident among the intergenic sequences chr1:10818517–10818704 and chr12:110319267–110319654, and the region spanning the putative non-coding RNA JD505160 (chr1:8194584–8194818), where differential methylation occurred toward either the beginning or end of the respective sequences. The regions spanning intron 5 of SLC6A5 (chr11:20588323–20588561) and intron 1 of INPP5A (chr10:134210902–134211265) exhibited more complex patterns of variability between OPSCC cells and controls that differed in terms of magnitude and direction in a locus-specific manner. Average methylation restricted to CpGs represented on the HumanMethylation450 beadarray is provided in Supplementary Table 3, to allow for further comparison with the differential methylation analysis at these sites that we previously performed using OPSCC tumor-adjacent normal pairs from The Cancer Genome Atlas (TCGA) [22].
Table 2. . Differential methylation between oral and pharyngeal squamous cell carcinoma cell lines and primary non-neoplastic oral epithelial cells.
| CpG-dense region | Associated gene | Head and neck squamous cell carcinoma cell lines | Non-neoplastic oral epithelial cells (referent) | |||||||
|---|---|---|---|---|---|---|---|---|---|---|
| Cal27 | Detroit562 | FaDu | H413 | |||||||
| Mean % methylation | pdifferential | Mean % methylation | pdifferential | Mean % methylation | pdifferential | Mean % methylation | pdifferential | Mean % methylation | ||
| chr12:118725604–118725889(NCBI36/hg18) | CIT | 89.7% | 0.0005 | 90.4% | 3.83E-05 | 90.9% | 0.0006 | 85.6% | 0.002 | 34.2% |
| chr12:28015205–28015607(NCBI36/hg18) | PTHLH | 0.3% | 0.22 | 15.5% | 0.0008 | 96.0% | 2.48E-07 | 66.1% | 0.0002 | 0.3% |
| chr11:2511670–2512178(NCBI36/hg18) | KCNQ1 | 0.5% | 0.0004 | 8.3% | 5.49E-05 | 1.2% | 0.0002 | 0.7% | 0.0004 | 32.7% |
| chr1:8194584–8194818(NCBI36/hg18) | Intergenic | 0.6% | 0.59 | 3.0% | 0.03 | 0.8% | 0.76 | 1.5% | 0.34 | 0.9% |
| chr12:110319267–110319654(NCBI36/hg18) | Intergenic | 1.2% | 0.91 | 1.5% | 0.83 | 1.2% | 0.91 | 2.6% | 0.28 | 1.3% |
| chr19:5538686–5538939(NCBI36/hg18) | SAFB2 | 94.5% | 0.0008 | 94.5% | 0.0007 | 96.3% | 0.0008 | 91.8% | 3.53E-05 | 70.0% |
| chr6:25135475–25135786(NCBI36/hg18) | Intergenic | 18.0% | 1.33E-05 | 53.6% | 0.0008 | 95.1% | 0.0003 | 64.4% | 0.0008 | 78.0% |
| chr1:10818517–10818704(NCBI36/hg18) | Intergenic | 10.2% | 0.001 | 8.0% | 0.02 | 9.9% | 0.001 | 11.2% | 0.003 | 4.7% |
| chr1:1385949–1386143(NCBI36/hg18) | ATAD3C | 59.8% | 0.04 | 38.3% | 0.01 | 62.3% | 0.02 | 82.2% | 0.0002 | 52.6% |
| chr10:53743705–53744974(NCBI36/hg18) | DKK1 | 0.9% | 0.42 | 0.6% | 0.21 | 0.8% | 0.32 | 1.2% | 0.75 | 1.4% |
| chr11:20588323–20588561(NCBI36/hg18) | SLC6A5 | 2.4% | 0.01 | 4.2% | 0.005 | 5.5% | 0.002 | 3.4% | 0.002 | 1.2% |
| chr10:134210902–134211265(NCBI36/hg18) | INPP5A | 68.7% | 0.002 | 76.1% | 0.16 | 87.3% | 0.12 | 76.0% | 0.09 | 79.2% |
| chr5:10702368–10703458(NCBI36/hg18) | ANKRD33B | 76.3% | 5.10E-07 | 79.1% | 3.08E-07 | 81.3% | 1.15E-07 | 75.6% | 5.53E-05 | 22.0% |
| chr16:85994896–85999172(NCBI36/hg18) | ZCCHC14 | 63.9% | 1.26E-06 | 95.1% | 0.01 | 96.4% | 0.007 | 92.6% | 0.16 | 91.7% |
| chr5:1010475–1010610(NCBI36/hg18) | Intergenic | 4.4% | 4.01E-09 | 57.4% | 1.39E-08 | 78.3% | 2.91E-08 | 60.2% | 3.34E-05 | 24.9% |
| chr2:216945117–216945376(NCBI36/hg18) | MARCH4 | 1.2% | 0.001 | 5.8% | 0.001 | 1.0% | 0.02 | 0.5% | 0.16 | 0.4% |
Significant p-values (<0.05) are highlighted with bold font.
p-values are based on a two-sample t-test for differential methylation of each respective oral and pharyngeal cancer cell line relative to non-neoplastic oral epithelials cells.
Figure 1. . Methylation landscape of a CpG-dense region in intron 9 of CIT in oral and pharyngeal squamous cell carcinoma cell lines and primary non-neoplastic oral epithelial cells.
(A) The cytogenic band location is displayed at the top of the figure, (B) followed by the position of the CpG-dense region within the gene – highlighted in green – and (C) overlapping and proximal regulatory elements annotated in ORegAnno, with the area spanned by the CpG-dense region highlighted in green. (D) CpGs are represented by each point on each line in the methylation plot, and are accompanied by vertical bars representing standard error. CpGs corresponding to those represented on the Infinium HumanMethylation450 bead array are shown below the methylation plot.
Figure 2. . Methylation landscape of a CpG-dense region in intron 1 of PTHLH in oral and pharyngeal squamous cell carcinoma cell lines and primary non-neoplastic oral epithelial cells.
(A) The cytogenic band location is displayed at the top of the figure, (B) followed by the position of the CpG-dense region within the gene – highlighted in green – and (C) overlapping and proximal regulatory elements annotated in ORegAnno, with the area spanned by the CpG-dense region highlighted in green. (D) CpGs are represented by each point on each line in the methylation plot, and are accompanied by vertical bars representing standard error. CpGs corresponding to those represented on the Infinium HumanMethylation450 bead array are shown below the methylation plot.
Figure 3. . Methylation landscape of a CpG-dense region in intron 2 of KCNQ1 in oral and pharyngeal squamous cell carcinoma cell lines and primary non-neoplastic oral epithelial cells.
(A) The cytogenic band location is displayed at the top of the figure, (B) followed by the position of the CpG-dense region within the gene – highlighted in green – and (C) overlapping and proximal regulatory elements annotated in ORegAnno, with the area spanned by the CpG-dense region highlighted in green. (D) CpGs are represented by each point on each line in the methylation plot and are accompanied by vertical bars representing standard error. CpGs corresponding to those represented on the Infinium HumanMethylation450 bead array are shown below the methylation plot.
Figure 4. . Methylation landscape of a CpG-dense region in exon 4 of ANKRD33B in oral and pharyngeal squamous cell carcinoma cell lines and primary non-neoplastic oral epithelial cells.
(A) The cytogenic band location is displayed at the top of the figure, (B) followed by the position of the CpG-dense region within the gene – highlighted in green – and (C) overlapping RE1 silencing transcription factor (REST/NRSF) binding site annotated in Encyclopedia of DNA Element (black bar), with the area spanned by the CpG-dense region highlighted in green. (D) CpGs are represented by each point on each line in the methylation plot, and are accompanied by vertical bars representing standard error. CpGs corresponding to those represented on the Infinium HumanMethylation450 bead array are shown below the methylation plot.
Figure 5. . Methylation landscape of a CpG-dense region in the 3′-untranslated region of ZCCHC14 in oral and pharyngeal squamous cell carcinoma cell lines and primary non-neoplastic oral epithelial cells.
(A) The cytogenic band location is displayed at the top of the figure, (B) followed by the position of the CpG-dense region within the gene – highlighted in green – and (C) overlapping and proximal regulatory elements annotated in ORegAnno, with the area spanned by the CpG-dense region, highlighted in green. (D) In the methylation plot, CpGs are represented by each point on each line and are accompanied by vertical bars representing standard error. CpGs corresponding to those represented on the Infinium HumanMethylation450 bead array are shown below the methylation plot.
Figure 6. . Methylation landscape of a CpG-dense region in the 5′-untranslated region of MARCH4 in oral and pharyngeal squamous cell carcinoma cell lines and primary non-neoplastic oral epithelial cells.
(A) The cytogenic band location is displayed at the top of the figure, (B) followed by the position of the CpG-dense region within the gene – highlighted in green – and (C) overlapping and proximal regulatory elements annotated in ORegAnno, with the area spanned by the CpG-dense region highlighted in green. (D) In the methylation plot, CpGs are represented by each point on each line and are accompanied by vertical bars representing standard error. CpGs corresponding to those represented on the Infinium HumanMethylation450 bead array are shown below the methylation plot.
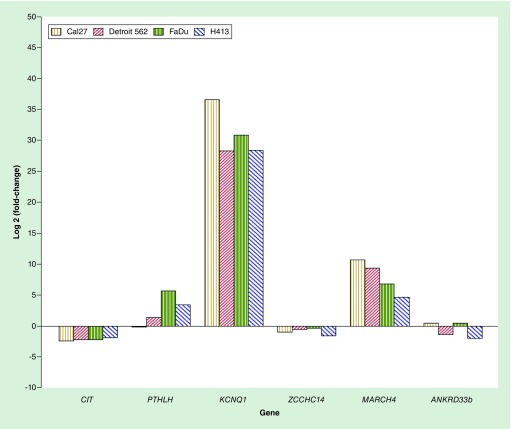
On the basis of the observed differential methylation of CpG-dense regions associated with a protein-coding gene, we measured expression of six associated genes (CIT, PTHLH, KCNQ1, ZCCHC14, MARCH4 and ANKRD33b) for each of the OPSCC cell lines relative to that of the oral epithelial control cells (Figure 7). Expression of KCNQ1, MARCH4 and PTHLH (for 3/4 cell lines) was increased for the OPSCC cells relative to the oral epithelial controls, CIT and ZCCHC14 was decreased, and ANKRD33b was variable, with two cell lines exhibiting upregulation while the other two were downregulated. There were significant positive correlations between methylation of the respective CpG-dense regions residing intron 1 of PTHLH and the 5′-UTR of MARCH4 and expression of the associated gene while there were significant inverse correlations with expression of the associated gene for the regions spanning intron 9 of CIT and intron 2 of KCNQ1 (Table 3).
Table 3. . Correlation between gene expression and methylation of select targeted regions.
| Differentially-methylated CpG-dense region | Associated gene | Genomic context | Difference in % methylation of cancer lines vs control cells | Correlation between expression and methylation | |
|---|---|---|---|---|---|
| Spearman (ρ) | pcorrelation | ||||
| chr12:118725604–118725889 | CIT | Intron 9 | 57% | -0.9 | 0.04 |
| chr12:28015205–28015607 | PTHLH | Intron 1 | 44% | 0.9 | 0.04 |
| chr11:2511970–2512178 | KCNQ1 | Intron 2 | -50% | -1.0 | <0.0001 |
| chr16:85998896–85999146 | ZCCHC14 | 3′UTR | -9% | 0.2 | 0.75 |
| chr2:216945117–216945376 | MARCH4 | 5′UTR | 2% | 0.9 | 0.04 |
| chr5:10702368–10702990 | ANKRD33B | Exon 4 | 78% | 0.3 | 0.64 |
Figure 7. . Expression of select genes associated with CpG-dense regions for the oral and pharyngeal squamous cell carcinoma cell lines relative to that of primary oral epithelial control cells.
Discussion
We successfully designed multiplexed targeted BSAS assays for 16 novel CpG-dense regions identified in our previous study [22]. This allowed us to comprehensively and efficiently interrogate and map the methylation landscape of these regions in OPSCC. This was particularly important for deciphering the epigenetic landscape of these regions given the incomplete coverage of the Infinium HumanMethylation450 beadarray (likewise with the more recent Infinium HumanMethylationEPIC beadarray) that was used for the initial discovery in our prior work.
The methylation maps revealed variability in methylation across CpG-dense regions within OPSCC cell lines, as well as between OPSCC cell lines, as would be expected given the known epigenetic variability in HNSCC [37,38]. Overall, we observed good agreement between methylation at the CpG-dense regions measured via BSAS in our cell lines relative to non-neoplastic oral epithelial cells and our previous differential methylation analysis in tumor and paired normal using Infinium HumanMethylation450 array data from TCGA [22] in terms of directionality and magnitude. The notable exception, however, is for the region situated within intron 1 of PTHLH (chr12:28015205–28015607), where methylation was substantially higher for three of the four OPSCC cell lines with no measurable methylation at any of the CpG loci in the control cells. This was in sharp contrast to the differential methylation analysis using paired OPSCC tumor-normal pairs from TCGA, in which we found average methylation to be 19% lower in tumors compared with adjacent normal tissue in this region. However, it should be noted that while the overall median difference between tumor-normal pairs suggests downregulation, the range of differences between pairs in TCGA was from -38% to 37%. One of the regulatory elements that binds in this region is PRDM14, which is a putative histone methyltransferase that has been shown to play a key role in cell development and pluripotency via both gene suppression and activation in murine models [39].
We observed decreased methylation of the CpG-dense region in intron 2 of KCNQ1 in OPSCC, which correlated with increased expression. This region resides within a DNase I hypersensitivity site and overlaps several transcription factor binding sites (NFkB, c-Jun, Ini1, JunD, FOSL2 and PU.1) annotated as part of the Encyclopedia of DNA Elements (ENCODE) [34]. We observed the opposite in the CpG-dense region in intron 9 of CIT, where the OPSCC cancer lines exhibited higher methylation that correlated with lower expression. This region overlaps a binding site for methylation-sensitive YY1 – a transcription factor that can either activate or repress gene expression depending upon its target and interaction [40]. Conversely, the region situated in the 5′-UTR of MARCH4 was positively correlated with expression. Here, one OPSCC cell line (Detroit 562) exhibited markedly increased methylation while the other HNSCC cell had subtly elevated methylation. This is a region upstream of the promoter overlapping a number of transcription factor binding sites.
There were numerous strengths to our study. Multiplexed BSAS represents a powerful tool for targeted methylation analysis, particularly given the potential for substantially longer amplicon lengths (up to 800 bp) compared with pyrosequencing (>120 bp [41]) or Sanger sequencing (300–500 bp [42]), with a higher level of sensitivity and accuracy [23]. This allowed us to comprehensively interrogate methylation across each region with deep coverage, Additionally, use of the multiplexed BSAS assays allowed us to simultaneously and efficiently interrogate multiple CpG regions, affording much higher throughput and enhances cost–effectiveness [23]. However, there were also some limitations. Although the coverage depth was good overall, this was variable across genes, with comparatively lower coverage in the regions in intron 1 of INPP5A (62×) and intron 2 of KCNQ1 (106×). One strategy to address this kind of variation moving forward would be to separate low amplification efficiency primer pairs from the high ones, and perform multiplexed PCR separately if necessary and/or increasing the sequencing depth with minimal increase of sequencing cost. However, this depth is still sufficient, particularly given the clonal nature of the cells being assayed, to provide an accurate snapshot of the respective methylation profiles. We should also note that the second of the two amplicons (toward the 3′ end) for the region spanning exon 4 of ANKRD33b (chr5:10702368–10703458) was less efficient/specific than the first, resulting in increased variability – and accordingly decreased mapping resolution – for the latter segment of the sequence, as is evident from the larger error bars. The expression analysis is limited in that it is strictly correlative and our BSAS assays only provide information on the regions of interest and do not provide information on methylation landscape of other regulatory regions of the associated genes. The RT-qPCR expression analyses also assumed regulation in cis and thus gave no information on the trans impact of other genes. Finally, this study was limited to four human papillomavirus (HPV)-negative OPSCC cell lines and thus is not likely to be representative of all OPSCC, particularly HPV-positive oropharyngeal cancers, which are recognized as a biologically distinct entity. It should also be noted that the cancer cells were immortalized cell lines while the oral epithelial control cells were primary cell culture, which could potentially influence results. However, the similarity of the results using cell culture to our previous findings in human tumor and oral rinse samples helps alleviate this concern. Finally, while the immortalized cell lines are not likely to represent intratumoral heterogeneity [43], use of clonal cell lines, as opposed to tumor tissue, allowed us to assess the pure populations of OPSCC and epithelial cells without admixture of other cell types.
Targeted BSAS allows us to map methylation across the entire region of interest with a high degree of sensitivity, helping shed light on novel differentially methylated regions, particularly those residing outside of the gene promoter context. BSAS, which has been under-utilized to date, represents a potentially powerful tool for targeted methylation analysis in the context of scientific discovery/validation and clinical/translational and public health applications.
Future perspective
We believe that multiplex BSAS assays for the regions covering methylation panel comprised of CpG-dense regions that we had identified in our previous work [22] may have potential utility for oral rinse-based cancer screening and/or post-treatment follow-up surveillance and thus are actively working on strategies to optimize the remaining six regions for future testing and are currently in the process of longitudinally collecting oral rinse samples during post-treatment follow-up surveillance from OPSCC patients in an effort to evaluate these CpG-dense regions as novel predictors for early detection of recurrent and new primary OPSCC.
Executive summary.
Targeted multiplex bisulfite amplicon sequencing (BSAS) allowed us to comprehensively and efficiently map methylation across the entire region of interest with a high degree of sensitivity.
Coupling BSAS with expression analysis shed additional light on novel differentially methylated regions associated with oral and pharyngeal squamous cell carcinoma.
There is notable variability across some of the regions, both between and within cell lines.
All six of the selected regions with detailed annotation overlap with transcription factor binding sites.
Methylation of the CpG-dense regions situated in intron 1 of PTHLH and the 5′-UTR of MARCH4 were positively correlated with expression of the associated gene.
Methylation of the CpG-dense regions situated in intron 9 of CIT and the intron 2 of KCNQ1 were inversely correlated with expression of the associated gene.
This work further underscores the potential importance of aberrant methylation of outside of the canonical gene promoter context.
These BSAS assays for the CpG-dense regions may have potential downstream utility for oral rinse-based cancer screening and/or post-treatment follow-up surveillance of oral and pharyngeal squamous cell carcinoma.
Supplementary Material
Footnotes
Financial & competing interests disclosure
This work was supported by the NIH/NIDCR (Grant Number 1R21DE027227) and NIH/NCI (Grant Number K22CA172358) to SM Langevin. The American Cancer Society (Grant Number 132476-RSG-18-148-01-CCE) also supported this work. The authors have no other relevant affiliations or financial involvement with any organization or entity with a financial interest in or financial conflict with the subject matter or materials discussed in the manuscript apart from those disclosed.
No writing assistance was utilized in the production of this manuscript.
References
Papers of special note have been highlighted as: • of interest; •• of considerable interest
- 1.Siegel RL, Miller KD, Jemal A. Cancer statistics, 2018. CA Cancer J. Clin. 68(1), 7–30 (2018). [DOI] [PubMed] [Google Scholar]
- 2.Carvalho AL, Nishimoto IN, Califano JA, Kowalski LP. Trends in incidence and prognosis for head and neck cancer in the United States: a site-specific analysis of the SEER database. Int. J. Cancer 114(5), 806–816 (2005). [DOI] [PubMed] [Google Scholar]
- 3.American Cancer Society. Cancer facts & figures 2017 (2017). https://www.cancer.org/research/cancer-facts-statistics/all-cancer-facts-figures/cancer-facts-figures-2017.html
- 4.Curado MP, Hashibe M. Recent changes in the epidemiology of head and neck cancer. Curr. Opin. Oncol. 21(3), 194–200 (2009). [DOI] [PubMed] [Google Scholar]
- 5.Bakhtiar SM, Ali A, Barh D. Epigenetics in head and neck cancer. Methods Mol. Biol. 1238, 751–769 (2015). [DOI] [PubMed] [Google Scholar]
- 6.Russo D, Merolla F, Varricchio S. et al. Epigenetics of oral and oropharyngeal cancers. Biomed. Rep. 9(4), 275–283 (2018). [DOI] [PMC free article] [PubMed] [Google Scholar]
- 7.Yang X, Han H, De Carvalho DD, Lay FD, Jones PA, Liang G. Gene body methylation can alter gene expression and is a therapeutic target in cancer. Cancer Cell 26(4), 577–590 (2014). [DOI] [PMC free article] [PubMed] [Google Scholar]
- 8.Almamun M, Kholod O, Stuckel AJ. et al. Inferring a role for methylation of intergenic DNA in the regulation of genes aberrantly expressed in precursor B-cell acute lymphoblastic leukemia. Leuk. Lymphoma 58(9), 1–12 (2017). [DOI] [PMC free article] [PubMed] [Google Scholar]
- 9.Rauscher GH, Kresovich JK, Poulin M. et al. Exploring DNA methylation changes in promoter, intragenic, and intergenic regions as early and late events in breast cancer formation. BMC Cancer 15, 816 (2015). [DOI] [PMC free article] [PubMed] [Google Scholar]
- 10.Demokan S, Chang X, Chuang A. et al. KIF1A and EDNRB are differentially methylated in primary HNSCC and salivary rinses. Int. J. Cancer 127(10), 2351–2359 (2010). [DOI] [PMC free article] [PubMed] [Google Scholar]
- 11.Nagata S, Hamada T, Yamada N. et al. Aberrant DNA methylation of tumor-related genes in oral rinse: a noninvasive method for detection of oral squamous cell carcinoma. Cancer 118(17), 4298–4308 (2012). [DOI] [PubMed] [Google Scholar]
- 12.Ovchinnikov DA, Cooper MA, Pandit P. et al. Tumor-suppressor gene promoter hypermethylation in saliva of head and neck cancer patients. Transl. Oncol. 5(5), 321–326 (2012). [DOI] [PMC free article] [PubMed] [Google Scholar]
- 13.Ovchinnikov DA, Wan Y, Coman WB. et al. DNA methylation at the novel CpG sites in the promoter of MED15/PCQAP gene as a biomarker for head and neck cancers. Biomark. Insights 9, 53–60 (2014). [DOI] [PMC free article] [PubMed] [Google Scholar]
- 14.Pattani KM, Zhang Z, Demokan S. et al. Endothelin receptor type B gene promoter hypermethylation in salivary rinses is independently associated with risk of oral cavity cancer and premalignancy. Cancer Prev. Res. 3(9), 1093–1103 (2010). [DOI] [PMC free article] [PubMed] [Google Scholar]
- 15.Righini CA, De Fraipont F, Timsit JF. et al. Tumor-specific methylation in saliva: a promising biomarker for early detection of head and neck cancer recurrence. Clin. Cancer Res. 13(4), 1179–1185 (2007). [DOI] [PubMed] [Google Scholar]
- 16.Rosas SL, Koch W, da Costa Carvalho MG. et al. Promoter hypermethylation patterns of p16, O6-methylguanine-DNA-methyltransferase, and death-associated protein kinase in tumors and saliva of head and neck cancer patients. Cancer Res. 61(3), 939–942 (2001). [PubMed] [Google Scholar]
- 17.Viet CT, Schmidt BL. Methylation array analysis of preoperative and postoperative saliva DNA in oral cancer patients. Cancer Epidemiol. Biomarkers Prev. 17(12), 3603–3611 (2008). [DOI] [PubMed] [Google Scholar]
- 18.Schussel J, Zhou XC, Zhang Z. et al. EDNRB and DCC salivary rinse hypermethylation has a similar performance as expert clinical examination in discrimination of oral cancer/dysplasia versus benign lesions. Clin. Cancer Res. 19(12), 3268–3275 (2013). [DOI] [PMC free article] [PubMed] [Google Scholar]
- 19.Guerrero-Preston R, Soudry E, Acero J. et al. NID2 and HOXA9 promoter hypermethylation as biomarkers for prevention and early detection in oral cavity squamous cell carcinoma tissues and saliva. Cancer Prev. Res. 4(7), 1061–1072 (2011). [DOI] [PMC free article] [PubMed] [Google Scholar]
- 20.Carvalho AL, Jeronimo C, Kim MM. et al. Evaluation of promoter hypermethylation detection in body fluids as a screening/diagnosis tool for head and neck squamous cell carcinoma. Clin. Cancer Res. 14(1), 97–107 (2008). [DOI] [PubMed] [Google Scholar]
- 21.Langevin SM, Stone RA, Bunker CH, Grandis JR, Sobol RW, Taioli E. MicroRNA-137 promoter methylation in oral rinses from patients with squamous cell carcinoma of the head and neck is associated with gender and body mass index. Carcinogenesis 31(5), 864–870 (2010). [DOI] [PMC free article] [PubMed] [Google Scholar]
- 22.Langevin SM, Eliot M, Butler RA. et al. CpG island methylation profile in non-invasive oral rinse samples is predictive of oral and pharyngeal carcinoma. Clin. Epigenetics 7, 125 (2015). [DOI] [PMC free article] [PubMed] [Google Scholar]; •• Initially identifies the novel oral and pharyngeal squamous cell carcinoma-associated CpG-dense regions interrogated in the present study.
- 23.Masser DR, Berg AS, Freeman WM. Focused, high accuracy 5-methylcytosine quantitation with base resolution by benchtop next-generation sequencing. Epigenetics Chromatin 6(1), 33 (2013). [DOI] [PMC free article] [PubMed] [Google Scholar]; •• Describes the targeted bisulfite amplicon sequencing method that we utilized to interrogate our regions of interest.
- 24.Masser DR, Stanford DR, Freeman WM. Targeted DNA methylation analysis by next-generation sequencing. J. Vis. Exp. (96), e52488 (2015). [DOI] [PMC free article] [PubMed] [Google Scholar]
- 25.Prime SS, Nixon SV, Crane IJ. et al. The behaviour of human oral squamous cell carcinoma in cell culture. J. Pathol. 160(3), 259–269 (1990). [DOI] [PubMed] [Google Scholar]
- 26.Peterson WD, Jr, Stulberg CS, Simpson WF. A permanent heteroploid human cell line with type B glucose-6-phosphate dehydrogenase. Proc. Soc. Exp. Biol. Med. 136(4), 1187–1191 (1971). [DOI] [PubMed] [Google Scholar]
- 27.Rangan SR. A new human cell line (FaDu) from a hypopharyngeal carcinoma. Cancer 29(1), 117–121 (1972). [DOI] [PubMed] [Google Scholar]
- 28.Gioanni J, Fischel JL, Lambert JC. et al. Two new human tumor cell lines derived from squamous cell carcinomas of the tongue: establishment, characterization and response to cytotoxic treatment. Eur. J. Cancer Clin. Oncol. 24(9), 1445–1455 (1988). [DOI] [PubMed] [Google Scholar]
- 29.Wu H, Caffo B, Jaffee HA, Irizarry RA, Feinberg AP. Redefining CpG islands using hidden Markov models. Biostatistics 11(3), 499–514 (2010). [DOI] [PMC free article] [PubMed] [Google Scholar]; • The hidden Markov model CpG island definition described in this manuscript was what we utilized for our initial discovery of the CpG-dense regions interrogated in our present study.
- 30.Zhang X, Leav I, Revelo MP. et al. Deletion hotspots in AMACR promoter CpG island are cis-regulatory elements controlling the gene expression in the colon. PLoS Genet. 5(1), e1000334 (2009). [DOI] [PMC free article] [PubMed] [Google Scholar]
- 31.Li LC, Dahiya R. MethPrimer: designing primers for methylation PCRs. Bioinformatics 18(11), 1427–1431 (2002). [DOI] [PubMed] [Google Scholar]
- 32.Wickham H. ggplot2: Elegant Graphics for Data Analysis. Springer International Publishing AG, Cham, Switzerland: (2016). [Google Scholar]
- 33.Kent WJ, Sugnet CW, Furey TS. et al. The human genome browser at UCSC. Genome Res. 12(6), 996–1006 (2002). [DOI] [PMC free article] [PubMed] [Google Scholar]
- 34.Consortium EP. An integrated encyclopedia of DNA elements in the human genome. Nature 489(7414), 57–74 (2012). [DOI] [PMC free article] [PubMed] [Google Scholar]
- 35.Griffith OL, Montgomery SB, Bernier B. et al. ORegAnno: an open-access community-driven resource for regulatory annotation. Nucleic Acids Res. 36(Database issue), D107–D113 (2008). [DOI] [PMC free article] [PubMed] [Google Scholar]
- 36.Schmittgen TD, Livak KJ. Analyzing real-time PCR data by the comparative C(T) method. Nat. Protoc. 3(6), 1101–1108 (2008). [DOI] [PubMed] [Google Scholar]
- 37.Marsit CJ, Christensen BC, Houseman EA. et al. Epigenetic profiling reveals etiologically distinct patterns of DNA methylation in head and neck squamous cell carcinoma. Carcinogenesis 30(3), 416–422 (2009). [DOI] [PMC free article] [PubMed] [Google Scholar]
- 38.Cancer Genome Atlas N. Comprehensive genomic characterization of head and neck squamous cell carcinomas. Nature 517(7536), 576–582 (2015). [DOI] [PMC free article] [PubMed] [Google Scholar]
- 39.Seki Y. PRDM14 is a unique epigenetic regulator stabilizing transcriptional networks for pluripotency. Front. Cell. Dev. Biol. 6, 12 (2018). [DOI] [PMC free article] [PubMed] [Google Scholar]
- 40.Khachigian LM. The Yin and Yang of YY1 in tumor growth and suppression. Int. J. Cancer 143(3), 460–465 (2018). [DOI] [PubMed] [Google Scholar]
- 41.Dejeux E, El Abdalaoui H, Gut IG, Tost J. Identification and quantification of differentially methylated loci by the pyrosequencing technology. Methods Mol. Biol. 507, 189–205 (2009). [DOI] [PubMed] [Google Scholar]
- 42.Zhang Y, Rohde C, Tierling S. et al. DNA methylation analysis by bisulfite conversion, cloning, and sequencing of individual clones. Methods Mol. Biol. 507, 177–187 (2009). [DOI] [PubMed] [Google Scholar]
- 43.Assenov Y, Brocks D, Gerhauser C. Intratumor heterogeneity in epigenetic patterns. Semin. Cancer Biol. 51, 12–21 (2018). [DOI] [PubMed] [Google Scholar]
Associated Data
This section collects any data citations, data availability statements, or supplementary materials included in this article.


