Abstract
Brain metastases from lung adenocarcinoma (BM-LUAD) cause significant patient mortality. To identify genomic alterations that promote brain metastases, we performed whole-exome sequencing of 73 BM-LUAD cases. Using case-control analyses, we discovered candidate drivers of brain metastasis by identifying genes with more frequent copy-number aberrations in BM-LUAD compared to 503 primary lung adenocarcinomas. We identified three regions with significantly higher amplification frequencies in BM-LUAD, including MYC (12% vs 6%), YAP1 (7% vs 0.8%), and MMP13 (10% vs 0.6%) and significantly more frequent deletions in CDKN2A/B (27% vs 13%). We confirmed that amplification frequencies of MYC and YAP1/MMP13 were elevated in an independent cohort of 105 patients. Functional assessment in patient-derived xenograft mouse models validated that MYC, YAP1 or MMP13 overexpression increased the brain metastasis incidence. These results demonstrate that somatic alterations contribute to brain metastases and that genomic sequencing of a large number of metastatic tumors can reveal novel metastatic drivers.
Main
Approximately 30% of patients with lung adenocarcinoma present with brain metastasis at the time of diagnosis and 50% will eventually develop brain metastases1. Treatment options for brain metastases from lung adenocarcinoma are few and limited in their efficacy. There is an urgent need for more focused efforts to study the genomics driving brain metastases, and to identify therapeutic targets.
The evolution of brain metastases from lung adenocarcinoma is a complex multi-step process2–4. Although somatic genetic alterations have been firmly established as driving primary tumor formation, it is not known whether additional genetic changes contribute to the development of brain metastasis. A recently published genomic characterization of diverse brain metastases and matched primary-tumor samples demonstrated clonally dominant and nearly universal genetic divergence between primary and metastatic tissue samples5. Because this study combined multiple diverse primary cancers, the limited number of cases from any one histology did not permit genome-wide discovery of novel metastasis promoting alterations at an acceptable false-discovery rate.
Clonal selection of somatic alterations promoting cancer progression and brain metastasis implies that such alterations are likely to be maintained in the metastases themselves, regardless of the specific steps of cancer progression that the mutations facilitated. Therefore, somatic alterations promoting cancer progression are expected to exhibit elevated mutational frequencies in brain metastasis tissue. Accordingly, we designed a discovery case dataset consisting of brain metastases exclusively from lung adenocarcinoma, and compared against a control population of primary lung adenocarcinoma. Paired germline DNA was included for all samples in both cohorts.
We performed whole exome sequencing on 73 brain metastasis cases from lung adenocarcinoma (BM-LUAD) with detailed patient and sample information (Supplementary Tables 1–2). Using a case-control somatic alteration analysis, we compared the somatic alterations in our BM-LUAD cohort to those in a set of 503 primary lung adenocarcinomas sequenced by The Cancer Genome Atlas (TCGA-LUAD)6. This approach nominated several novel candidate metastatic drivers, a subset of which we validated in an additional set of 105 lung adenocarcinoma brain metastases. We demonstrated that overexpression of these candidate drivers promoted brain metastases in patient-derived xenograft (PDX) mouse models.
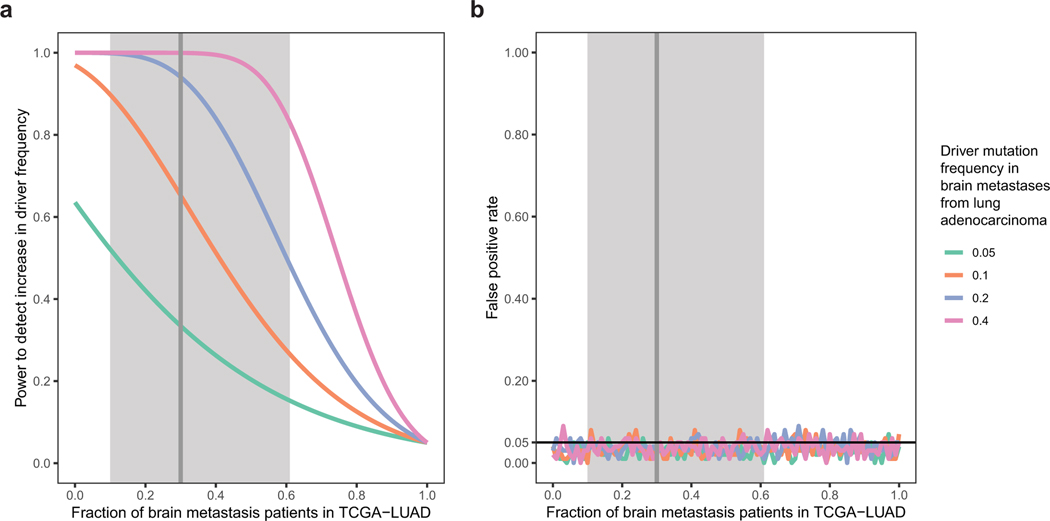
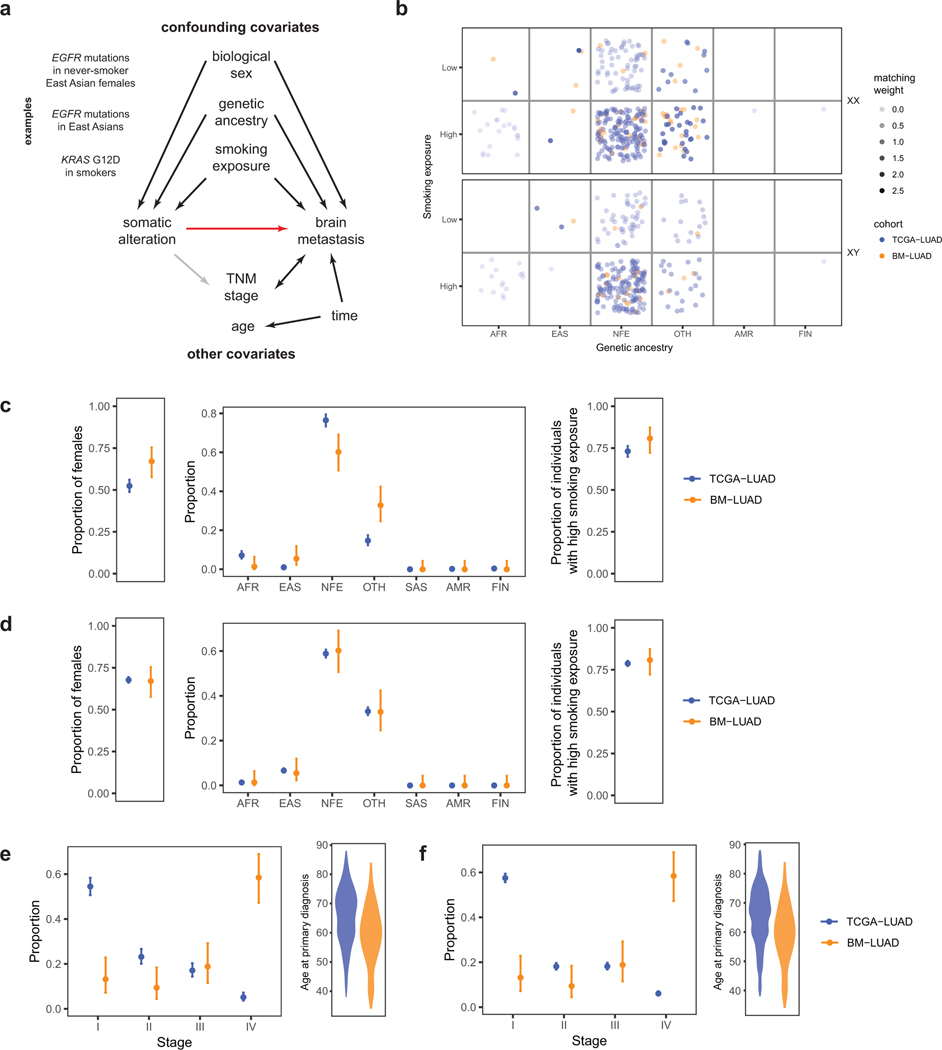
We established the validity of our approach by assessing and addressing two potential weaknesses inherent to case control somatic alteration analysis. First, we noted that a fraction of the TCGA-LUAD control patients likely developed brain metastases eventually, which would decrease our statistical power for discovery of brain metastasis drivers that occur in primary tumors (Extended Data Fig. 1a). However, multiple statistical simulations confirmed that the presence of metastatic cases among the control cohort did not increase the false-positive rate (Extended Data Fig. 1b). Second, differences in genetic alteration frequencies between BM-LUAD and TCGA-LUAD could have occurred in part due to differences in cohort characteristics. To evaluate this possibility, we matched TCGA-LUAD (control cohort) to BM-LUAD (case cohort) based on potentially confounding covariates including smoking exposure, genetic ancestry, and sex (Extended Data Fig. 2) using established statistical methodology7. We then proceeded to compare the mutational and copy-number landscapes of BM-LUAD and matched subset of TCGA-LUAD (n = 464).
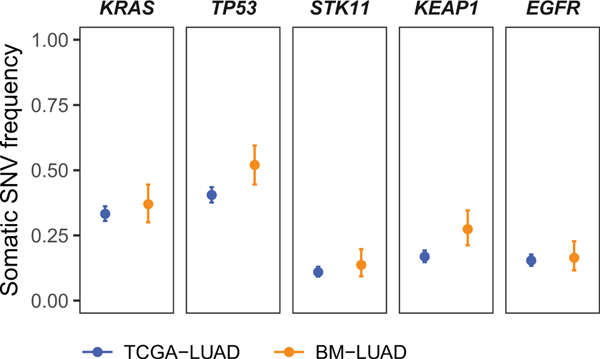
We first looked for evidence of positive selection on somatic single nucleotide variants in brain metastases using established algorithms, MutSig2CV8 and dNdScv9. We recovered previously identified6 drivers of primary lung adenocarcinoma, including TP53, KRAS, STK11, KEAP1, and EGFR, indicating that the BM-LUAD cohort was representative of lung adenocarcinoma. However, these known drivers of primary disease did not occur at elevated frequency in BM-LUAD (Extended Data Fig. 3).
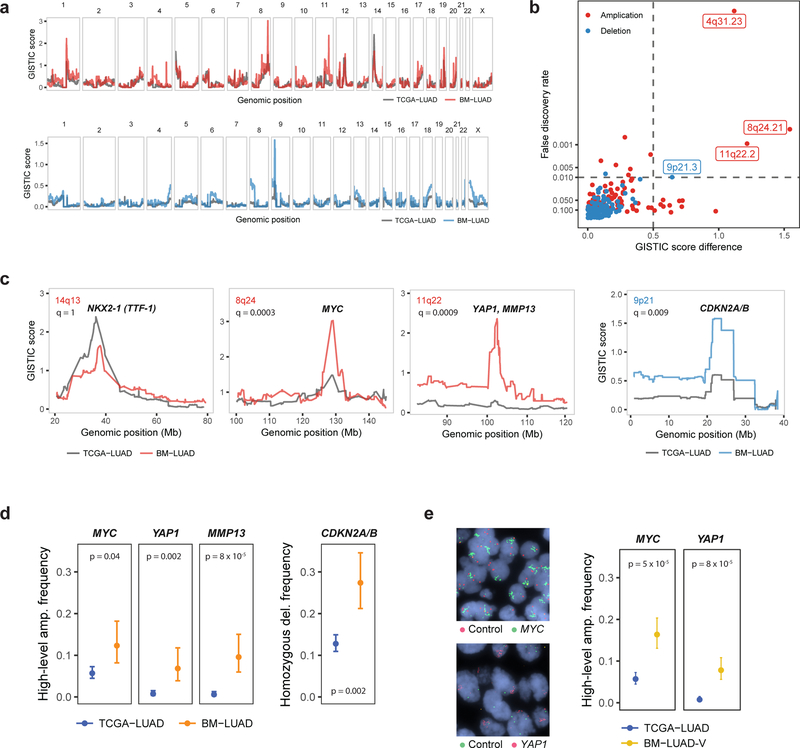
We next assessed somatic copy-number alterations (SCNAs) and found that the genome-wide landscape of SCNAs was similar between BM-LUAD and TCGA-LUAD (Fig. 1a). Chromosome arm-level copy number events occurred with similar frequencies in the two cohorts, as did whole genome doubling events (Extended Data Fig. 4). We applied an established methodology10 to compute a SCNA positive selection score at each genomic location, which assessed SCNA amplitudes and frequencies across samples and identified regions with significantly recurrent SCNAs that were likely due to positive selection. The highest-ranking genes in both the BM-LUAD and TCGA-LUAD cohorts included MYC, TERT, MDM2, CDK4, CCND1 and NKX2–2.
Fig. 1: Novel candidate brain-metastatic drivers targeted by amplifications or deletions.
a, GISTIC amplification (top) and deletion (bottom) plots of BM-LUAD (n = 73) and matched samples in TCGA-LUAD (n = 464) cohorts. b, Differentially amplified or deleted regions in BM-LUAD compared to TCGA-LUAD. Significant differential regions are labeled (FDR < 0.01, and G-score difference > 0.5). c, GISTIC plots of control region (NKX2–1) and candidate metastatic driver regions. d, Frequencies of amplifications or deletions of candidate metastatic drivers, adjusted by matching weights to control for confounding. Error bars denote 80% confidence intervals. Significance was assessed by weighted logistic regression. e, Frequencies of amplifications of MYC and YAP1 in validation cohort BM-LUAD-V (n = 105) as determined by fluorescence in situ hybridization. TCGA-LUAD was re-used as the control cohort.
Despite the broad similarities of copy-number landscapes between BM-LUAD and TCGA-LUAD, we found four distinct genomic regions with significantly different positive selection scores. We computed a genome-wide false discovery rate (FDR) for differential positive selection SCNA scores, while controlling for differences in cohort composition. Because SCNA scores are highly correlated along the genome, we used a statistical model to control for this effect (Fig. 1b, Extended Data Fig. 5, Methods). This analysis revealed a significantly elevated degree of positive selection for 9p21.3 homozygous deletion harboring CDKN2A/B in BM-LUAD compared to TCGA-LUAD (Fig. 1c); no other deletions were significantly enriched in BM-LUAD (genome-wide FDR < 0.01). In addition, we discovered 3 regions of focal amplification that were significantly enriched in BM-LUAD (genome-wide FDR < 0.01), including (i) a 101 kbp region on 8q24.21 containing MYC; (ii) a 1.5 Mbp region on 11q22.2 containing YAP1, BIRC3, TMEM123 and a cluster of matrix metalloproteinase genes including MMP13; and (iii) a 6 kbp region on 4q31.23 containing EDNRA, ARHGAP10 and NR3C2 (Fig. 1c).
The identified SCNA regions encompassed genes that are credible candidate metastatic drivers. MYC and CDKN2A/B were frequently involved in genomic amplifications and deletions respectively in a prior sequencing study of brain metastases from diverse types of primary cancers including lung adenocarcinoma5. Matrix metalloproteinases are involved in remodeling of the extracellular matrix and have been associated with cancer-cell invasion and metastasis11, including brain metastases. YAP1 encodes the downstream transcriptional effector of Hippo signaling pathway, and it has been implicated in many tumorigenic processes12. Specifically, YAP1 regulates cellular mechanical behavior13, epithelial-to-mesenchymal transition, and cellular proliferation14.
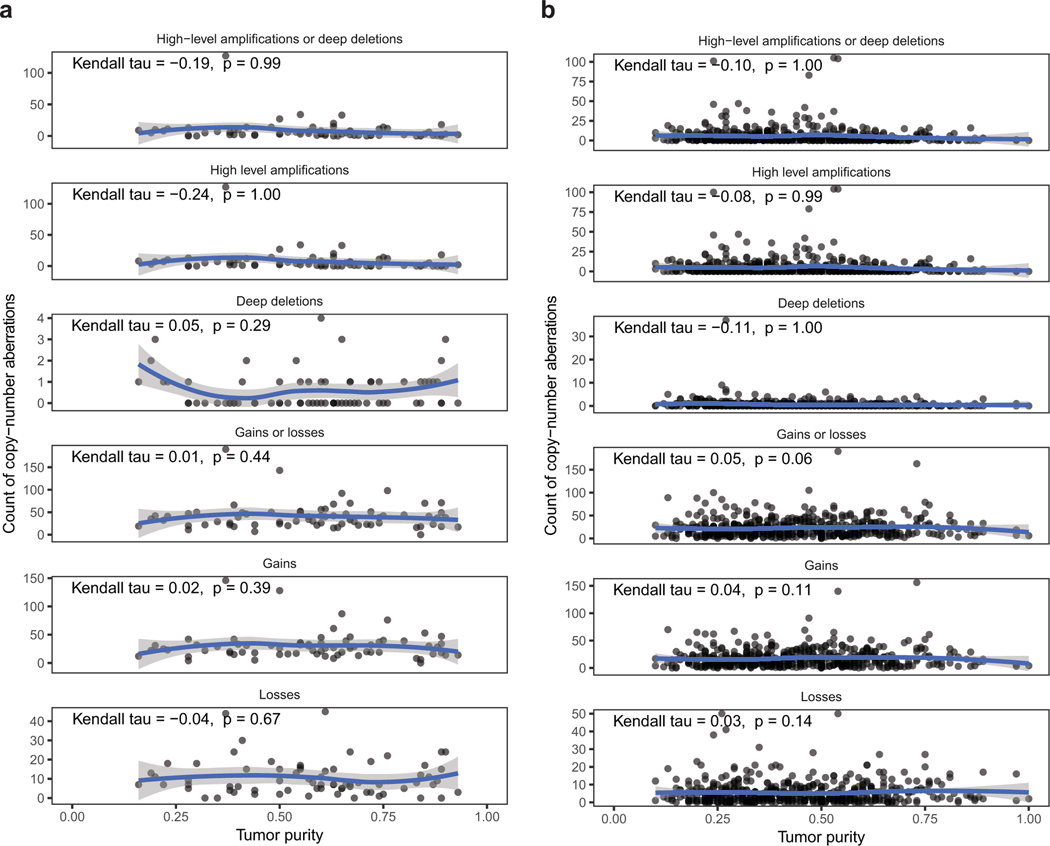
We further confirmed that the frequency of candidate SCNA driver events was significantly higher in BM-LUAD compared to matched TCGA-LUAD controls (Fig. 1d). MYC amplification occurred in 12% (CI 8–18%) of BM-LUAD vs. 6% (CI 4–7%) in TCGA-LUAD, YAP1 amplification in 7% (CI 4–12%) vs. 0.8% (CI 0.4–1.5%), MMP13 amplification in 10% (CI 6–15%) vs. 0.6% (CI 0.3–1.3%), and CDKN2A/B deletions in 27% (CI 21–35%) of BM-LUAD vs. 13% (CI 11–15%) in TCGA-LUAD. To rule out the possibility that other covariates might explain the differences in driver event frequencies between BM-LUAD and TCGA-LUAD, we confirmed that amplification of MYC, YAP1/MMP13, and deletion of CDKN2A/B, continued to be significant after controlling for tumor purity and stage (Extended Data Fig. 6 and 7).
To further establish that the observed increase in amplification frequency of YAP1, MMP13 and MYC between BM-LUAD and TCGA-LUAD reflected genuine differences in brain-metastatic lung adenocarcinoma, we obtained an independent validation cohort from the Medical University of Vienna consisting of 105 brain metastases from lung adenocarcinoma resected between 1990 and 2013 (BM-LUAD-V). Fluorescence in situ hybridization (FISH) revealed high-level 11q22.2 (YAP1/MMP13) amplifications in 9 of 98 informative cases (9%, CI 6%−14%), and MYC amplifications in 20 of 94 cases (21%, CI 17–27%), and the amplification frequencies of YAP1/MMP13 and MYC were both significantly higher in BM-LUAD-V than the TCGA-LUAD control cohort (Fig. 1e).
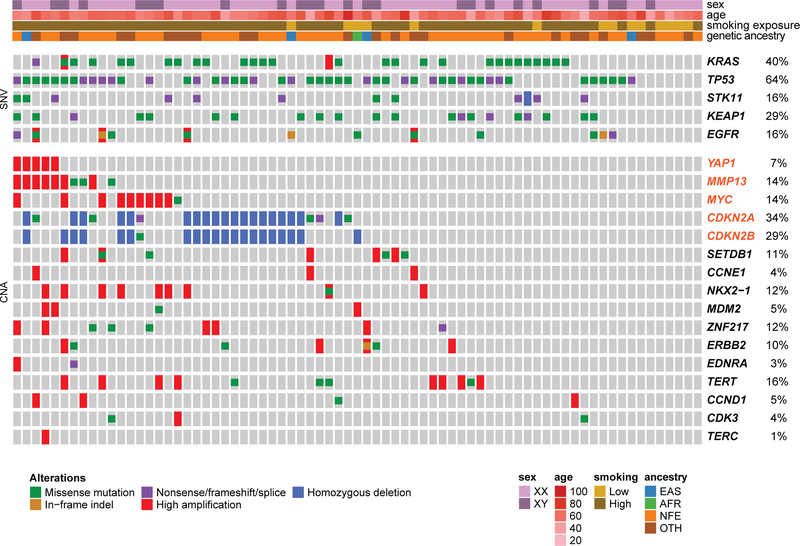
Analysis of co-mutation between previously discovered lung adenocarcinoma drivers (TCGA) together with our novel BM-LUAD candidate drivers revealed that none of the cases of YAP1 amplification co-occurred with oncogenic mutant KRAS samples (Fig. 2). These findings are consistent with previous reports that overexpression of YAP1 can substitute for KRAS activity in KRAS-dependent lung cancer cells15,16. In addition, we observed two patients with a high-level 11q22.2 amplification involving only MMP13; these patients harbored KRAS G13C mutations (Fig. 2). These observations, taken collectively, suggest that YAP1 and MMP13 may contribute independently to the development of metastatic lung adenocarcinoma.
Fig. 2: Co-mutation plot from whole exome sequencing of brain metastasis patients.
Significantly recurrently mutated drivers identified by both MutSig2CV and dNdScv in BM-LUAD are shown, followed by significantly amplified or deleted drivers identified using GISTIC in BM-LUAD, along with additional known cancer drivers in lung adenocarcinoma. Genes highlighted in orange are candidate metastatic drivers identified by matched case-control comparison between BM-LUAD and TCGA-LUAD. Each column represents one brain metastasis. False discovery rates are controlled at 1%.
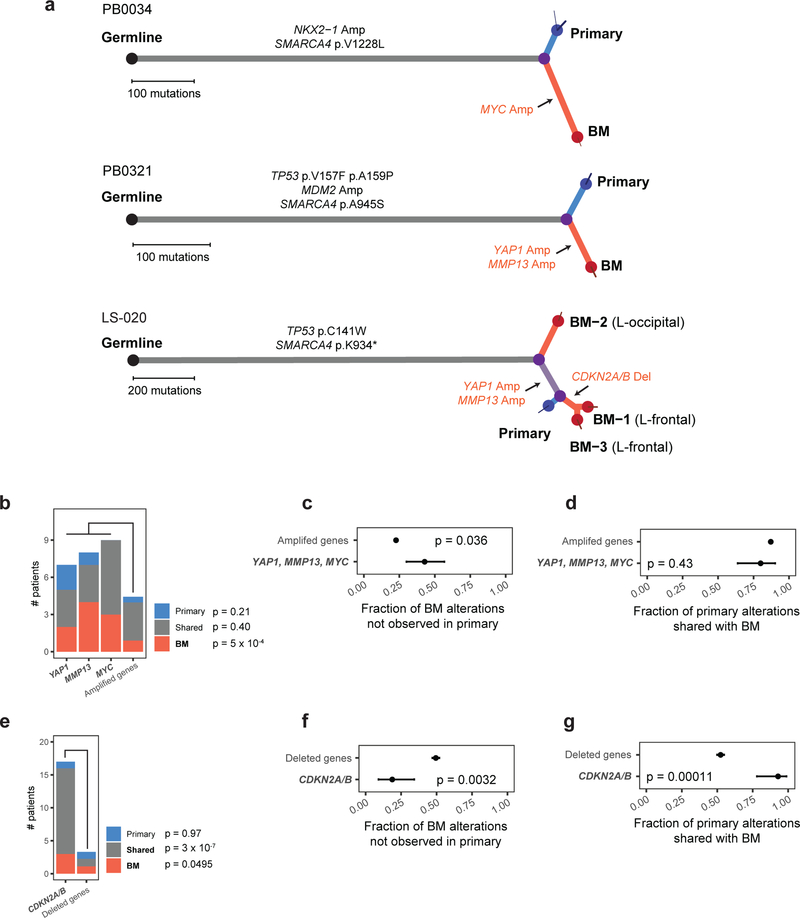
To further investigate the significance and evolutionary timing of candidate brain metastasis-driving genetic alterations in the BM-LUAD cohort, we sequenced matched primary tumor samples from 58 BM-LUAD cases with tissue available (Fig. 3; Extended Data Fig. 8; Supplementary Fig. 1; Supplementary Table 3). Candidate-driver SCNAs that were undetected in either of the primary or metastatic samples were considered private and assumed to have occurred after the divergence of the metastatic and primary-tumor lineages. SCNAs that were shared by the primary-tumor sample and brain metastasis were assumed to have occurred in an ancestral population that preceded their divergence. Example cases with candidate driver alterations are depicted in Fig 3a.
Fig. 3: Phylogenetic analysis of copy-number drivers in brain metastasis and matched primary tumors.
a, Somatic mutations in BM-LUAD cases bearing candidate drivers, depicted as phylogenetic trees. Branch lengths are proportional to the number of somatic point-mutations incurred along each lineage. Thin terminal branches indicate subclones with estimated cancer cell fraction less than 1.0 in the indicated sample. Somatic alterations in genes considered significantly recurrently mutated in TCGA-LUAD by CNA or mutation are annotated in black on the indicted phylogenetic branch. Somatic amplification and deletion of proposed candidate driver genes are indicated in red. b, Frequency of high-level amplifications that were private to the primary tumor, private to brain metastasis, or shared. The ‘other amplified gene’ column represents the average number of samples the other recurrently amplified genes were amplified in. Significance was determined using Poisson regression and Wald test. c, Fraction of high-level amplifications in brain metastases that were not detected in paired primary tumors. Significance was determined using Fisher’s exact test. Error bars represent 80% confidence intervals. d, Fraction of high-level amplifications in primary-tumor samples that were also detected in paired brain metastases. Significance was determined using Fisher’s exact test. Error bars represent 80% confidence intervals. e, Frequencies of deletions that were private to the primary tumor, private to brain metastasis, or shared. The ‘other deleted gene’ column represents the average number of samples the other recurrently deleted genes were deleted in. Significance was determined using Poisson regression and Wald test. f, Fraction of deletions in brain metastases that were not detected in their paired primary tumors. Significance was determined using Fisher’s exact test. Error bars represent 80% confidence intervals. g, Fraction of deletions in primary-tumor samples that were also detected in paired brain metastases. Significance was determined using Fisher’s exact test. Error bars represent 80% confidence intervals.
Patterns of shared vs. private alterations in candidate drivers across the 58 BM-LUAD pairs were consistent with positive selection leading to metastatic lung adenocarcinoma at various disease stages (power calculation in Extended Data Fig. 8). Although we cannot completely exclude the possibility that some candidate alterations might have been undetected in some samples due to spatial tumor heterogeneity and tissue-sampling bias, we verified that detection of homozygous deletions and high-level amplifications was not influenced by tumor purity (Extended Data Fig. 6). Furthermore, by analyzing multiple metastasis-primary tumor pairs, informative trends could be observed even with incomplete tissue sampling.
Amplified candidate drivers (MYC, MMP13, YAP1) tended to occur after the divergence of the metastatic and primary-tumor lineages, and were consistent with positive selection of these amplifications contributing to a pro-metastatic phenotype. Compared to other recurrently amplified genes, amplified candidate drivers were significantly more frequent when private to the brain metastases (P = 5 × 10⁻⁴, t = 3.5, Poisson regression and Wald test), but not when shared or private to the primary-tumor sample (Fig 3b). Candidate driver amplifications occurring in brain metastases were significantly less likely to have been shared with paired primary-tumor samples than were amplifications in other recurrently amplified genes (Fig. 3c; P = 0.036, OR = 0.39, Fisher’s exact test). Candidate driver amplifications occurring in primary-tumor samples were not more likely to have been shared with paired brain metastases than were other recurrently amplified genes (Fig. 3d).
In contrast, deletions of CDKN2A/B tended to occur prior to divergence of the metastatic and primary-tumor lineages, and were consistent with positive selection of these deletions contributing to the formation or progression of primary tumors with greater potential to form brain metastases. Compared to other recurrently deleted genes, homozygous deletion of CDKN2A/B was significantly more frequent, both as a shared event (P = 3 × 10⁻⁷, t = 5.3, Poisson regression and Wald test) and privately in brain metastases (P = 0.0495, t = 2.0), but not privately in primary tumors (P = 0.97, t = −0.033; Fig 3e). Deletions in CDKN2A/B occurring in brain metastases were significantly more likely to have been shared with the paired primary-tumor samples than were deletions in other recurrently deleted genes (Fig. 3f; P = 0.0032, OR = 3.4, Fisher’s exact test). Furthermore, CDKN2A/B deletions occurring in primary-tumor samples were significantly more likely to have been shared with paired brain metastases than were deletions in other recurrently deleted genes (Fig. 3g; P = 0.00011, OR = 7.3, Fisher’s exact test).
We functionally validated the role of MYC, MMP13 and YAP1 amplifications using a PDX model of lung adenocarcinoma metastasis. We established cells that stably overexpressed MYC, MMP13, YAP1 or lacZ control by lentiviral transfection. The cells were then injected into the left cardiac ventricle of immunodeficient mice, and tumor burden and brain metastasis incidence were measured respectively by in vivo and ex vivo bioluminescence imaging 12 days post injection (Fig. 4a-b; Extended Data Fig. 9). While the 27 mice injected with cells expressing lacZ did not develop any measurable brain metastases, overexpression of MYC, MMP13, and YAP1 significantly increased the incidence of brain metastasis to 5 of 28 mice (22%; CI 11–37%), 5 of 26 mice (24%; CI 12%−40%), and 5 of 28 mice (22%; CI 11%−37%), respectively (P < 0.05, Fisher’s exact test, Fig. 4c). No significant increase in total tumor burden (including extracranial disease) was observed (P = 0.40, χ2 = 2.9, df = 3, Kruskal-Wallis rank sum test; Fig. 4d). Overexpression of MYC, but not LacZ, MMP13, or YAP1, also increased the propensity of tumor cells to grow in the brain microenvironment, as evidenced by shorter survival following intracranial tumor implants (Extended Data Fig. 10). These findings demonstrate that overexpression of any of the three genes that are enriched for focal amplification in brain metastases (MYC, MMP13, or YAP1) can each contribute to brain metastasis formation.
Fig. 4: Functional validation of brain-metastatic drivers in a patient-derived xenograft model.
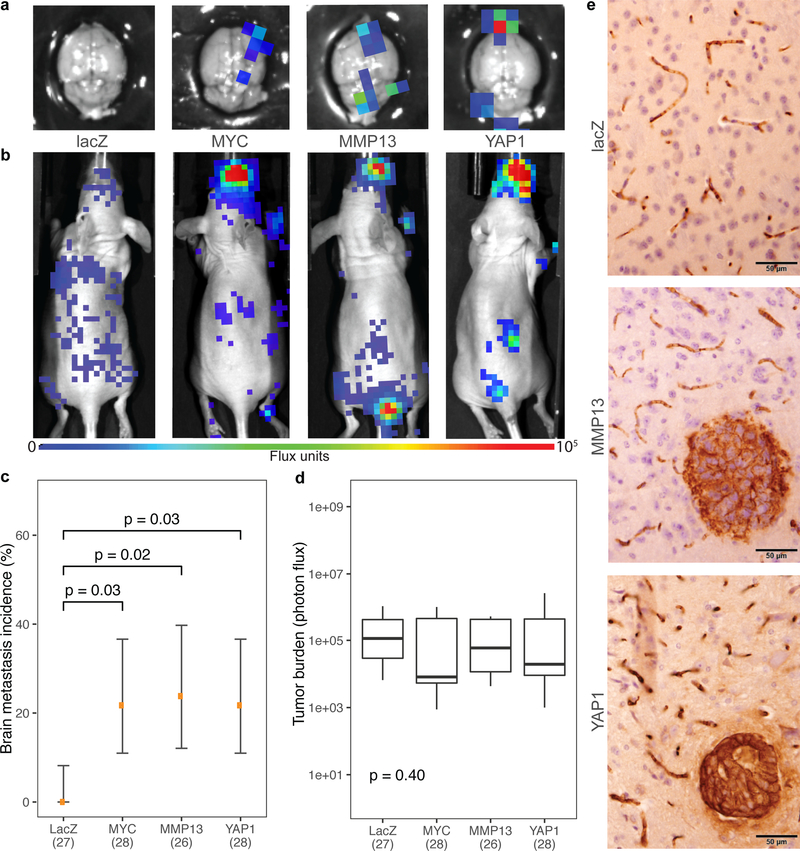
a, Representative ex vivo and b, in vivo bioluminescence images 12 days after intracardiac injections with LN-001 tumor cells. c, Incidence of brain metastasis 12 days after intracardiac injections of LN-001 tumor cells overexpressing lacZ (n = 27), MYC (n = 28), MMP13 (n = 26), or YAP1 (n = 28). Error bars denote 80% confidence intervals. Data were aggregated over 3 independent experiments. Significances were assessed by Fisher’s exact tests. d, Overall tumor burden following intracardiac injection. Box represents interquartile range; middle line represents median; limits mark the extremes. Significance was assessed by the Kruskal-Wallis rank sum test. e, Representative images of mouse brain sections stained for human keratin, showing presence of brain metastases 12 days after intracardiac injections of LN-001 tumor cells.
Despite the fact that up to 40% of lung cancer deaths are attributable to metastasis and that brain is the most common metastatic site17, large-scale genomic characterization of brain metastases has not been previously performed, primarily because of difficulties in obtaining suitable tissue samples for sequencing. Therefore, it has been unclear to what extent the spectrum of genetic drivers in brain metastases is equivalent to that of primary cancers. Our results demonstrate that sequencing a sufficiently large number of brain metastases, combined with rigorous comparison of somatic alteration frequencies to those in histologically matched primary tumors, represents an efficient approach to reveal novel somatic drivers of cancer progression and metastasis.
Our data suggest that RAS-pathway activation by genomic amplification of YAP1 may set the stage for brain metastasis by co-amplification of the adjacent cluster of matrix metalloprotease genes on 11q22.2, including MMP13. Our observation of focal MMP13 amplifications that excluded YAP1 further support the idea that MMP13 contributes to brain metastasis independently of YAP1. Furthermore, our experimental demonstration that MMP13 overexpression can promote brain metastasis in a murine model provides further support for the nomination of MMP13 as a pro-metastatic gene in human lung adenocarcinoma. Further experimental work will be needed to confirm a synergistic role for these genes in the evolution of brain metastasis.
We note that metastasis-driving somatic DNA alterations may not be necessary for brain metastasis formation. For example, previous work has shown that metastasis formation can be explained by phenotypic transitions2,18,19 and epigenetic alterations20. Nonetheless, our results nominate novel high-level amplifications in brain metastases from lung adenocarcinoma, consistent with positive selection of genetic alterations during the evolution of brain metastasis. Our murine experiments indicate that these alterations can promote brain metastasis formation.
The novel candidate drivers we identified represent potential therapeutic targets for brain metastases. For example, brain metastases harboring YAP1 amplifications might represent candidates for Hippo pathway inhibitors, which are under active development21. We also observed a higher frequency of alterations in known cancer genes in brain metastases compared to primary tumors, including MYC amplifications and CDKN2A/B deletions. These observations suggest that therapies targeting these alterations should be investigated in patients with brain metastases. Examples of trials targeting the CDK pathway include NCT02896335, NCT02308020 and Alliance A071701. Genomic characterization of large collections of metastases thus represents a feasible strategy to uncover potential avenues for the prevention and treatment of metastasis.
Methods
Case cohort
This study was conducted in accordance with the Declaration of Helsinki. It was reviewed and approved by the human subjects Institutional Review Boards of the Dana-Farber Cancer Institute (Boston, MA), Brigham and Women’s Hospital (Boston, MA), Broad Institute of Harvard and MIT (Boston, MA), Massachusetts General Hospital (Boston, MA), Seoul National University College of Medicine (Seoul, South Korea), and Vall d’Hebron University Hospital (Barcelona, Spain). Written informed consent for the study (including genetic analysis) was obtained from all participants.
We identified 73 patients with brain metastases originating from a primary lung adenocarcinoma, whose brain metastases and normal tissues were collected as part of standard clinical care between 1999 and 2014. This case cohort of patients is referred to as “BM-LUAD”. In 58 of these cases, we collected additional samples including multiple brain metastases and primary tumor tissue. Board-certified neuropathologists (M.F., S.S., and M.M.L) confirmed the histologic diagnoses and selected representative fresh-frozen or formalin-fixed paraffin-embedded (FFPE) sections with estimated tumor purity of ≥ 40%.
Control cohort and matching
We identified 503 unique patients with primary lung adenocarcinoma tumor sample and matched normal sample that were sequenced at the Broad Institute as part of The Cancer Genome Atlas (TCGA) project22. This control cohort is referred to as “TCGA-LUAD”. These patients were matched to BM-LUAD cohort using the coarsened exact matching method23, as implemented in the Matchit R package (v3.0)24. The covariates being matched between the case and control cohorts including ancestry, sex, and smoking exposure, all of which have previously been associated with differences in EGFR mutation frequency25–30 and may conceivably confound estimation of driver mutation frequencies. A total of 464 patients had non-zero matching weights.
Although brain metastasis follow-up was not available in TCGA-LUAD, the incidence of brain metastasis in control was estimated to be 30% (credible interval 10–61%) using a mixed-effect meta-analysis binomial regression accounting for immunohistological subtype, TNM stage, EGFR mutation status, race, smoking status, gender, and age under an errors-in-variables model to allow for missing or uncertain data. Taking into consideration this event incidence in the control cohort, this study has 94% power to detect a significant increase in mutation frequencies between the case (n1 = 73) and control cohorts (n0 = 464) for mutations that occur in ≥ 20% of cases and ≤ 1% in true controls with zero event incidence. Further, this study has 65% power to detect frequency increases for mutations occurring in ≥ 10% of cases (Extended Data Fig. 1).
Power analysis
Under the case-control design, power was calculated for testing an increase in mutation frequency among patients in the case cohort compared to patients in the control cohort, using the pwr (v1.2) R package. Under the matched-pairs primary-metastasis design, power was calculated for Poisson regression comparing absolute frequencies of alterations occurring on the phylogenetic branch of brain metastasis for driver vs. non-driver genes, using the powerMediation (v0.2) R package. Observations were assumed to be independent and identically distributed. Other parameters were either estimated from available data or set to a range of possible values.
Sample preparation
DNA was extracted from tissue shavings of frozen tissue using QIAamp DNA Mini Kit (QIAGEN, Valencia, CA), three to five 1 mm core punch biopsies (#33–31AA-P/25; Integra Miltex) from FFPE tissue using GeneRead DNA FFPE (QIAGEN), or buffy coat preparations of matched blood using DNeasy Blood and Tissue Kit (QIAGEN), followed by quantification using PicoGreen (P11496; Invitrogen, Carlsbad, CA). The matching of tumor-normal pairs was ascertained by mass spectrometric genotyping (Sequenom, San Diego, CA) with an established 48-SNP panel31. The possibility of sample cross-contamination was computationally assessed by ContEst32 on the sequencing data.
Whole-exome Sequencing
We performed whole-exome sequencing of extracted DNA as per manufacturer’s instructions on Illumina HiSeq or Genome Analyzer IIX platforms to a median target coverage of 95X at the Broad Institute and the Center for Cancer Genome Discovery (CCGD), Dana-Farber Cancer Institute. At the Broad Institute, libraries underwent exome enrichment using the Agilent SureSelect hybrid capture kit (Whole Exome v1.1 Agilent, Santa Clara, CA) or the Nextera Rapid Capture Exome v1 (Illumina, San Diego, CA), followed by sequencing using 76 bp paired-end reads on Illumina HiSeq 2000 or GA-IIX. At CCGD, libraries were enriched using Agilent SureSelect hybrid capture kit (Whole Exome v2) and sequenced using 100 pair-end reads on Illumina HiSeq 2500. Details of whole-exome library construction have been described elsewhere33.
The data files from all sources were harmonized and processed by common data processing pipelines to yield BAM files containing aligned reads34,35. Read pairs were aligned to the hg19 (GRCh37) reference genome using the Burrows-Wheeler Aligner36, and sample reads were de-multiplexed using Picard35. Aligned reads were sorted and marked for duplicates using Samtools37 and Picard. Base quality scores were re-calibrated using the Genome Analysis Toolkit (GATK)34. All tumor-normal pairs passed quality control pipelines that test for sample swaps (by matching SNP genotypes of samples from the same patient), mis-annotations (by looking for discrepancies, such as reported gender and genetically inferred sex), cross-sample contamination (using ContEst32). All included tumor-normal pairs must also have > 10 × 106 bases covered for calling somatic-mutation.
Genetic ancestry inference
The genetic ancestry of each patient was inferred by analyzing germline genotypes at common autosomal SNP sites (minor allele frequency ≥ 0.01 in any population) reported in the Exome Aggregation Consortium (ExAC)38. The germline SNP genotypes were extracted from the output of MuTect, excluding flagged artifacts. Using the germline genotype, the sample was classified into one of seven ExAC genetic ancestries using a Bayesian classifier parameterized by the genotype frequencies of each ExAC population.
Given the genotype vector and assuming conditional independence of SNP sites, the genetic ancestry y of an individual is predicted by
where p(y) is the frequency distribution of ExAC populations.
For each SNP locus j, xj is modeled by
Genetic sex identification
Exome SNP sites on chrX and chrY were obtained from the Exome Sequencing Project39. The genotypes of germline samples at these SNP sites were called using samtools mpileup and bcftools call (v1.3.1)37, and two summary statistics for each sample were derived: pX, proportion of reads mapping to chrX over reads mapping to chrX or chrY; and phetX, proportion of heterozygous SNP sites on chrX. K-means clustering (k = 2) was performed using the features pX and phetX, together with seed samples of known sex. Each cluster was assigned a class/sex based on the majority label of its seeds, and each sample with unknown sex was assigned the class/sex of its cluster.
Somatic mutation calling
Somatic single-nucleotide variants (SNVs) were called using MuTect40, and short insertions/deletions (indels) were called using Strelka41 on tumor-normal pairs. Flagged artifacts were excluded from downstream analysis. FFPE and oxoG artifacts were removed by read-pair orientation bias filters described previously42. Differences in detection of SNVs and indels on fresh-frozen vs. FFPE specimens were assessed in Supplementary Fig. 2. Spurious calls due to mis-alignment or sequence ambiguity were removed by re-assessing global alignment quality using BLAT44. For each variant, alternative allele supporting reads were extracted from the BAM file using the htslib C library (v1.2.1)45 directly. Each supporting read was re-aligned using BLAT (v35), and if fewer than 65% of the reads re-align to the same locus by the top hit, the variant was removed. Variants were also filtered according to a reference blacklist: germline variants reported in ExAC38 at a population minor allele frequency > 0.05 or any variant that failed quality control in ExAC. Passing variants were annotated using Oncotator46 as previously described33.
Copy-number analysis
To obtain raw copy-number estimates across the genome of each sample, the number of read-pairs mapping to each exome target region (padded by 250 bp) were extracted from the BAM file. The raw estimates were normalized against coverage obtained from a panel of diploid normal samples. The resulting total copy-ratio profiles were then segmented using the circular binary segmentation algorithm47. Subsequently, allele-specific copy-number was estimated by examining read counts of alternative and reference alleles at germline heterozygous SNP sites that were identified by MuTect40 and restricted to those reported in UCSC Genome Browser table snp146Common, subject to the filter: class = ‘single’ and valid <> ‘unknown’ and except = ‘‘ and locType = ‘exact’ and alleleFreqCount = 2 and submitterCount >= 2 and not bitfields like ‘clinically-assoc’. The allele-specific read counts were then used to infer allele-specific copy-ratios as previously described33, serving as input into ABSOLUTE (v1.4)48, which jointly estimated the fraction of cancer cells, cancer ploidy, and absolute allelic copy-numbers across the genome.
At each locus j, total copy-number sj was estimated by rescaling the copy-ratio rj by estimates of cancer purity α and ploidy τ:
which is a simple rearrangement of the definition of copy-ratio.48
Recurrently amplified genes are defined as genes that are amplified in ≥ 2 unique patients, after samples with amplification frequencies greater than the 95% quantile have been excluded from consideration. Due to co-amplifications, nearby genes may have the same copy-number profile across samples. To correct for this effect, each group of genes having identical copy-number profiles across samples (e.g. determined by zero pairwise Euclidean distances) were collapsed to a representative gene. Recurrently deleted genes are defined similarly.
Differences in detection of copy-number events on fresh-frozen vs. FFPE specimens were assessed in Supplementary Fig. 2.
Mutation driver analysis
MutSig2CV49 and dNdScv50 were used to analyze somatic SNVs and indels within exons in order to identify genes with mutation frequency above background rate.
Copy-number driver analysis
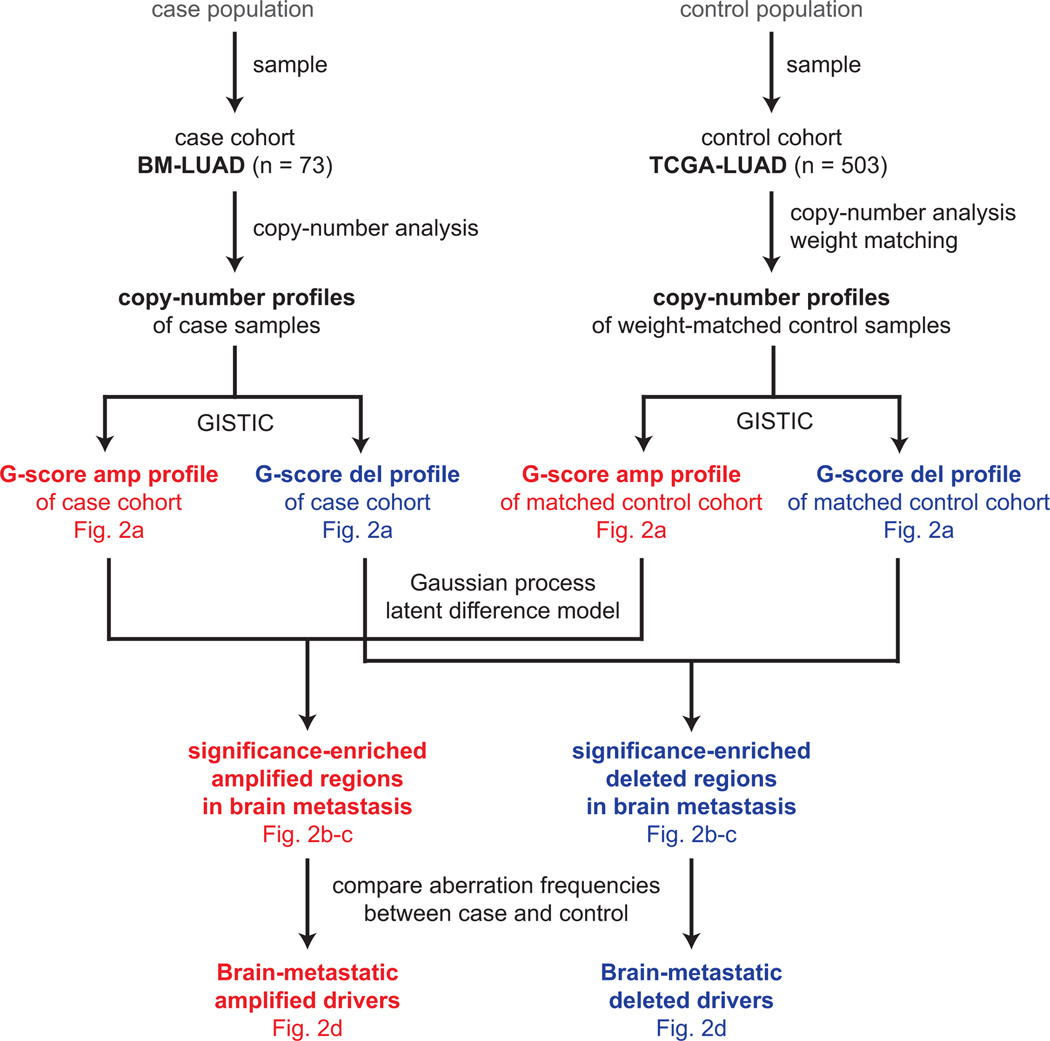
In order to identify brain metastatic drivers, we performed a case-control analysis on the frequencies of copy-number aberrations (Extended Data Fig. 5). Total copy-number segments produced by ABSOLUTE (v1.4)48 from the case and control cohorts were independently analyzed by GISTIC51. To account for confounding covariates, the segment profiles of control samples were multiplied by the matching weights (see “Control cohort and matching”). The GISTIC amplifications and deletion profiles were independently analyzed using a Gaussian Process Latent Difference model, in order to identify regions where G-scores are greater in the case cohort than in the control.
Given G-scores from group at genomic positions indexed by , the objective is to estimate the latent differences between the two groups, using the following novel model:
where is the overall offset, is the observation error, is the Gaussian process covariance matrix, and is squared exponential covariance function. Model parameters were fitted using the iterated conditional mode method (coordinate ascent). Following convergence, the posterior distribution of f was approximated by Laplace’s method.
Differential regions were identified at prescribed false discovery rate levels using a two-step procedure inspired by the Korthauer method for detecting regions of differential methylation52. Bayesian false discovery rates were estimated using the Muller-Parmigiani-Rice method53.
Phylogenetic analysis
Phylogenetic analysis was performed as previously described33. For patients with multiple sequenced tumor samples, we borrowed statistical evidence across tumor samples in order to improve sensitivity. At each variant locus called in any of the matched samples from a patient, we re-examine the BAM file and count the number of reads supporting the alternative allele. These alternative allele counts were taken in consideration during phylogenetic analysis in order to avoid miscalling a mutation as specific to one sample when it is in fact shared among multiple samples from the same patient33.
Matched-pairs primary-metastasis analysis
High-level amplifications and homozygous deletions were first called on all samples based on principal thresholds (total copy-number > 8 for amplification; total copy-number < 0.5 for deletion). Each amplified or deleted gene was reassessed using relaxed thresholds (total copy-number > 6 for amplification; total copy-number < 0.6 for deletion) on samples from patients with at least one sample meeting the principal threshold. This reassessment helps avoid miscalling events that are shared among multiple samples from the same patient. Differences in absolute frequencies of events between groups were assessed using linear region under a quasi-Poisson model, followed by hypothesis testing with the Wald test. Differences in relative frequencies of events were tested using Fisher’s exact test.
Patient-derived tumor xenograft model
LN-001 tumor cell culture was derived from a freshly resected brain-metastatic lesion of a patient with lung adenocarcinoma who provided written informed consent approved by the Institutional Review Board. Tissue was collected under sterile conditions, minced and dissociated with Brain Tumor Dissociation Kit (Miltenyi Biotec) according to manufacturer’s instructions. Cells were cultured in Neurobasal medium (Invitrogen) supplemented with 1X B-27 (Invitrogen), 0.5X N2 (Invitrogen), heparin (2 μg/mL; Sigma-Aldrich), L-glutamine (3 mM; Invitrogen), 1X antibiotic/antimycotic (Invitrogen), epidermal growth factor (20 ng/mL; R&D Systems), fibroblast growth factor 2 (20 ng/mL; Peprotech) for 10 days, and then cultured in Dulbecco’s Modified Eagle’s Medium (Invitrogen) supplemented with 10% fetal bovine serum (Invitrogen) and 1X antibiotic/antimycotic.
Lentiviral transduction
Recombinant viruses were produced in HEK293T cells by transfection with lentiviral plasmids using FuGENE HD Transfection Agent (Promega, Madison, WI) along with pCMV-delta-R8.2 and pCMV-VSV-G, generous gifts from Sandro Santagata (Brigham and Women’s Hospital, Boston, MA). Cells were transduced at a multiplicity of infection of 2 in media containing polybrene (8 μg/mL; EMD Millipore, Burlington, MA) for 48 hours. Media was collected 24 and 48 hours after transfection, filtered through a 0.48 μm filter and stored at −80°C. LN-001 cells were engineered to express Firefly luciferase and mCherry (FmC) by transduction with LV-pico2-Fluc-mCherry (LV-FmC), a generous gift from Khalid Shah (Brigham and Women’s Hospital, Boston, MA) and Andrew Kung (Dana-Farber Cancer Institute, Boston, MA). Transduced cells were selected with puromycin (7 μg/mL) for 3 days and mCherry-expressing cells were selected using fluorescence-activated cell sorting (FACSAria Cell Sorting System; BD Biosciences).
Lentiviral expression constructs
Gateway entry or donor vectors (pENTR223-MMP13 and pDONR221-MYC) were obtained from the Harvard Medical School PlasmID Repository (HsCD00376676 and HsCD00039771), and open reading frames were cloned into the lentiviral V5 C-terminal tag expression vector pLX304, a gift from David Root (#25890; Addgene) using BP Clonase II and LR Clonase II (#11789020, #11791020; Thermo Fisher). pLX304-LacZ and pLX304-YAP1 lentiviral vectors were a gift from William Hahn (#42560, #42555; Addgene). All constructs were verified by Sanger sequencing using CMV-F and WPRE-R primers. pLX304 lentiviral vectors were packaged and LN-001-FmC cells were transduced as described above. Cells were selected with blasticidin (10 μg/mL) for 10–14 days. Protein expression was confirmed by Western blotting using an anti-V5 antibody (V8137; Sigma-Aldrich).
Animal studies
All in vivo experiments were approved by the Institutional Animal Care and Use Committee at Massachusetts General Hospital and involved female athymic nude mice (Charles River Laboratories) housed in a 12-hour light-dark cycle with free access to water.
Intracranial tumor implantation
Mice aged 6–8 weeks were anesthetized with 40–50 mg/kg sodium pentobarbital (Nembutal) and placed in a stereotaxic frame (David Kopf Instruments). 1×10⁴ tumor cells suspended in 4 μL HBSS were injected into the right mid-striatum (2 mm lateral from bregma and 2.5 mm deep) using a 26-gauge syringe (Hamilton Company). MediGel CPF cups (ClearH2O) were administered for pain management. Mice were euthanized when neurological symptoms developed.
Intracardiac tumor implantation
Mice were anesthetized with 3% isoflurane in 100% oxygen and 2.5×10⁵ tumor cells suspended in 50 μL HBSS were injected into the left cardiac ventricle.
Bioluminescence imaging
Mice were anesthetized with 3% isoflurane in 100% oxygen, injected with 4.5 mg/kg of D-luciferin in 300 μL saline, and imaged after 10 minutes using an optical imaging platform (Spectral Instruments Imaging). Images were taken every 5 minutes until photon counts peaked. For ex vivo imaging, mouse brains were harvested, placed in a bath of ice-cold D-luciferin (15 mg/mL), and imaged 10 minutes after the final in vivo image. Tumor burden was estimated by measuring the photon intensity above the background signal in a region of interest and normalized by area. Mouse brain sections were stained with antibody against human keratin (#4546S; Cell Signaling Technology) to validate the presence of brain metastatic lesions.
Statistical analysis
All statistical analyses were conducted in the R environment (v3.2.3). All statistical tests are two-sided. Weighted logistic regression for the comparison of mutation frequencies was performed using the glm function with the quasibinomial model family, logistic link function, and coarsened exact matching weights as input weights in order to control for confounding covariates (biological sex, genetic ancestry, and smoking exposure). Confidence or credible intervals are at the 80% level, unless stated otherwise. Results with p < 0.05 are considered statistically significant. Adjusted p values (also denoted as q values) control for multiple hypothesis testing at the indicated false discovery rates. Co-mutation plots were generated using ComplexHeatmap (v1.14)54 package on Bioconductor. Markov chain Monte Carlo sampling was performed using rstan (v2.17)55.
Extended Data
Extended Data Fig. 1.
Power analysis and statistical simulation of case-control study.
a, Estimated effect of increasing fraction of brain metastasis patients in TCGA-LUAD on statistical power to detect metastatic drivers at different mutation frequency levels in BM-LUAD. The driver mutation frequency is assumed to be 1% among TCGA-LUAD patients who do not develop brain metastasis (true controls). Power is calculated for testing an increase in driver mutation frequency among cases compared to controls at a significance level of 0.05. Observations are assumed to be independent and identically distributed.
b, Simulated effect of increasing fraction of brain metastasis patients in TCGA-LUAD on false positive rate for detecting metastatic drivers at different mutation frequency levels. Each data point represents a simulation of 100 experiments under the null hypothesis (i.e. the mutation frequency among patients who never develop brain metastasis is equal to the mutation frequency among brain metastasis patients).
Significance level is set to 0.05. Vertical line represents the estimated fraction of brain metastasis patients in TCGA-LUAD, and shaded region represents the 95% confidence interval, as determined using a mixed effect meta-analysis binomial regression accounting for immunohistological subtype, TNM stage, EGFR mutation status, race, smoking status, gender, and age under an errors-in-variables model to allow for missing or uncertain data.
Extended Data Fig. 2.
Power analysis and statistical simulation of case-control study.
a, Proposed causal model for brain metastasis. Red arrow denotes main causal relationship of interest; black arrows, well-supported relationships; gray arrows, uncertain relationships. Relationship between TNM stage and brain metastasis is bidirectional: brain metastasis at diagnosis is defined as stage IV, and node involvement contributes to metastasis.
b, Coarsened exacting matching weights, determined based on biological sex, genetic ancestry, and smoking exposure.
c, Distributions of confounding covariates before exact matching.
d, Distributions of confounding covariates after exact matching.
e, Distributions of TNM stage and age at primary diagnosis before exact matching and f, after. TNM stage and age were not included in exact matching, and their distributions remain similar after exact matching.
AFR, African or African American. EAS, East Asian. NFE, Non-Finnish European. SAS, South Asian. AMR, Latino. FIN, Finnish. OTH, Other.
Extended Data Fig. 3.
Power analysis and statistical simulation of case-control study.
Single nucleotide variants (SNVs) and short insertions/deletions (indels) in BM-LUAD were analyzed by MutSig2CV and dNdScv to identify driver genes under positive selection. Identified drivers are statistically significant by both MutSig2CV and dNdScv at 1% false discovery rate, except for EGFR, which harbors recurrent indels that are considered only by MutSig2CV. The mutation frequencies of the identified drivers are shown for BM-LUAD and TCGA-LUAD after matching adjustment by coarsened exact matching, and statistical significances of differences in mutation frequency were assessed by weighted logistic regression using the matching weights. None of the identified drivers were statistically significantly different between BM-LUAD and TCGA-LUAD at 0.05 significance level with Benjamini-Hochberg multiple hypothesis correction.
Extended Data Fig. 4.
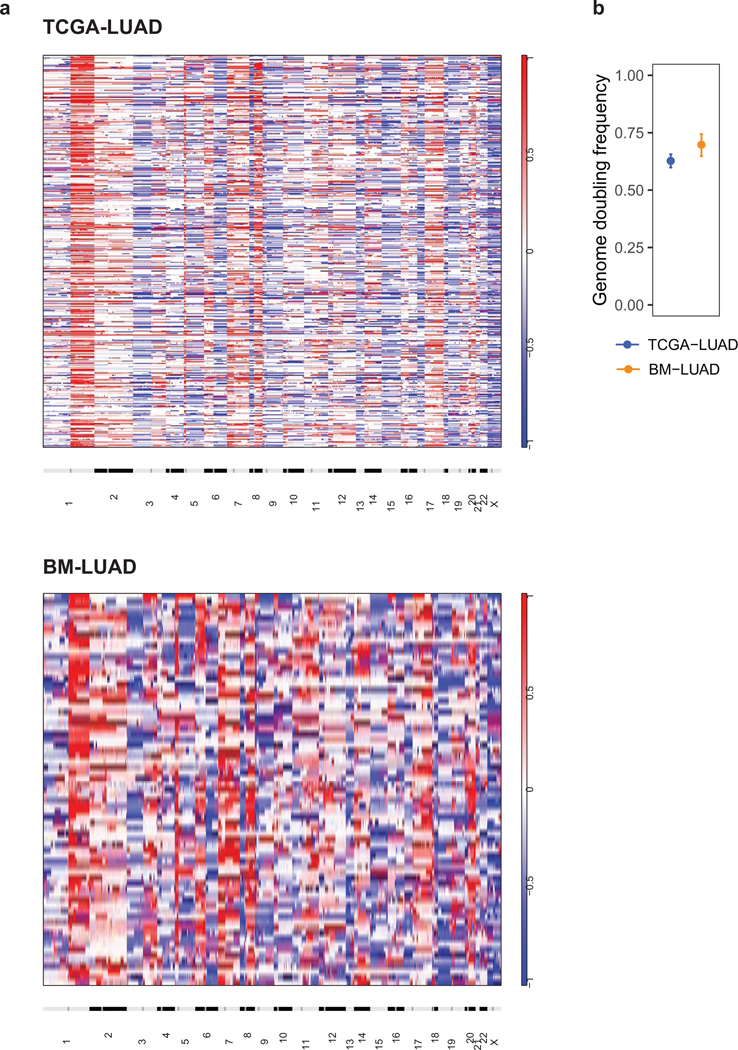
Power analysis and statistical simulation of case-control study.
a, Heatmap of copy-number profiles for samples from TCGA-LUAD (top) and BM-LUAD (bottom).
Each row represents the copy-number profile of a tumor sample across chromosomes 1 to 22 and X.
Red indicates copy-number gain; blue, loss.
b, Frequencies of genome doubling events in TCGA-LUAD and BM-LUAD.
Extended Data Fig. 5.
Power analysis and statistical simulation of case-control study.
CNAs Somatic copy-number profiles in case cohort (BM-LUAD) and weight-matched control cohort (TCGA-LUAD) were analyzed by GISTIC. Copy-number profiles of control samples were multiplied by matching weights, which were defined to balance covariate distributions between case and control cohorts using the coarsened exact matching method. G-score profiles for amplifications and deletions were independently analyzed by a Gaussian process latent difference model to identify significantly enriched regions. Candidate drivers were identified by logistic regression comparing aberration frequencies between case and weighted controls; the candidates were further validated in an independent cohort by fluorescence in situ hybridization.
Extended Data Fig. 6.
Power analysis and statistical simulation of case-control study.
Dot plot of frequencies of copy-number events and tumor purity in BM-LUAD (a) and TCGA-LUAD (b).
Correlations are measured by Kendall rank correlation coefficient. Blue curves represent LOESS regressions.
High-level amplification, > 8 total copy-number; Deep deletion, < 0.5 total copy-number;
Gain, > 3/2 normalized copy-ratio; Loss, < ½ normalized copy-ratio.
Normalized copy-ratio is total copy-number scaled to tumor ploidy.
Extended Data Fig. 7.
Power analysis and statistical simulation of case-control study.
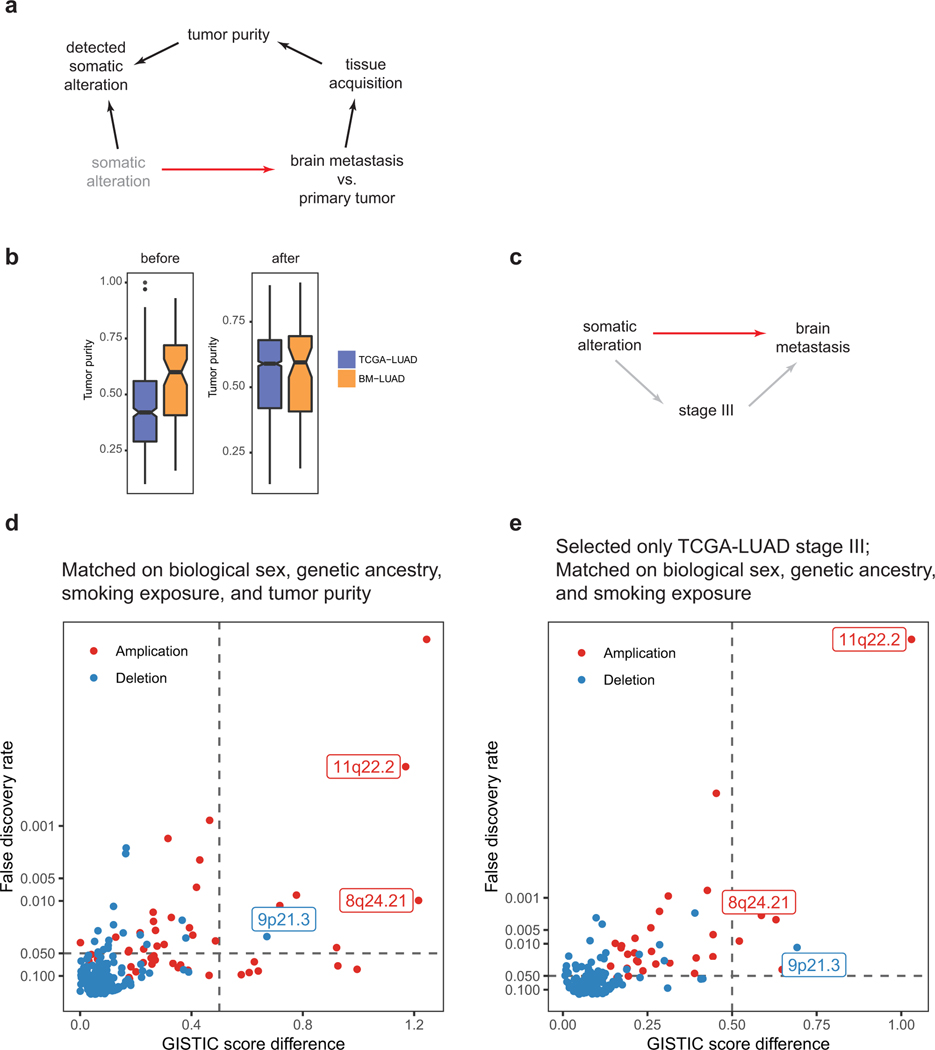
a, Proposed causal model for sample-level covariates involving tumor purity. Red arrow denotes main causal relationship of interest; black arrows, well-supported relationships; gray arrows, uncertain relationships. “Somatic alteration” (shown in gray) is not directly observable. In contrast, “detected somatic alterations” is directly observable. Observing “detected somatic alterations” (which is a collider) introduces a backdoor path from “somatic alteration” to “brain metastasis”, and this path may be closed by controlling for tumor purity.
b, Distributions of tumor purity in TCGA-LUAD and BM-LUAD before and after exact matching on biological sex, genetic ancestry, smoking exposure, and tumor purity.
c, Proposed causal model for patient-level covariates including stage. Stage III is a likely mediator variable that may be controlled in order to assess the direct effects of somatic alterations on incidence of brain metastasis.
d, Differentially amplified or deleted regions in BM-LUAD compared to TCGA-LUAD after additionally matching on tumor purity.
Differential regions of interest are labeled.
e, Differentially amplified or deleted regions in BM-LUAD compared to stage III samples in TCGA-LUAD.
Extended Data Fig. 8.
Power analysis and statistical simulation of case-control study.
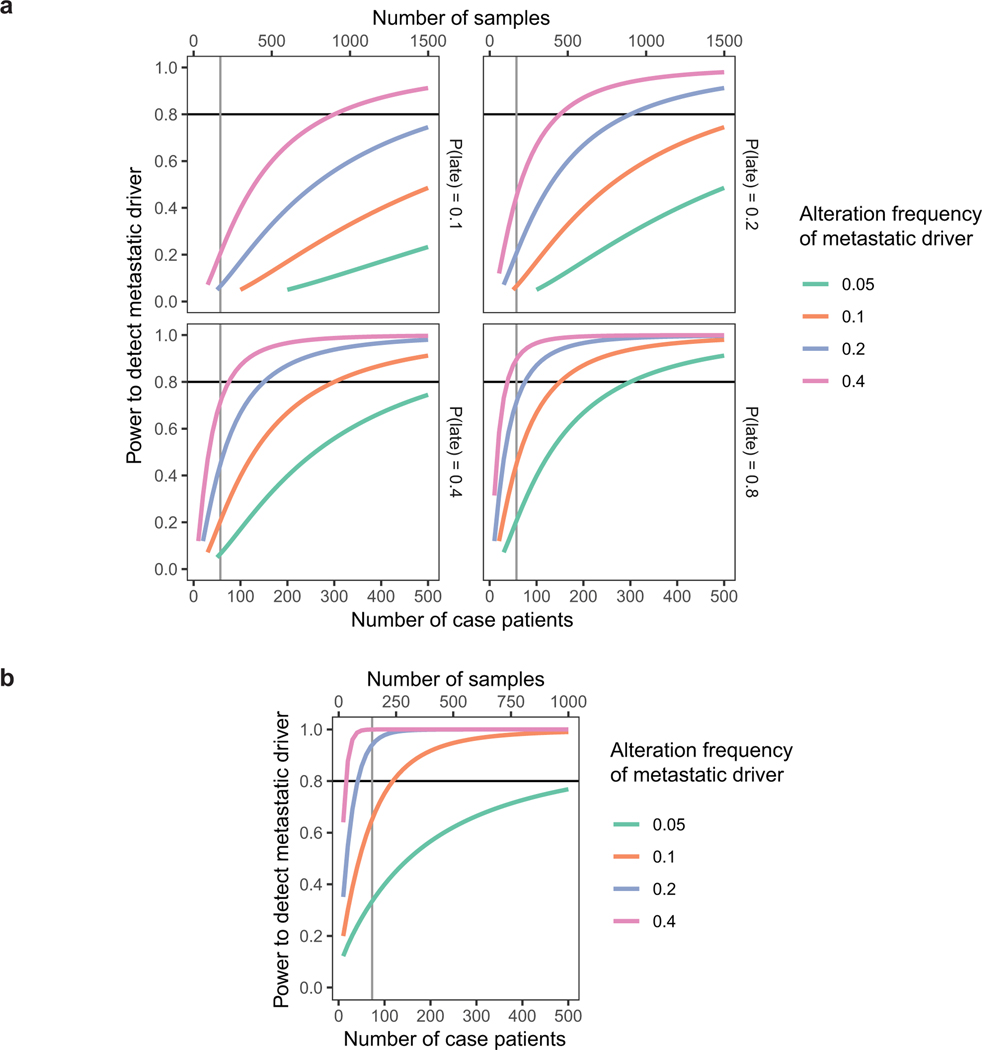
a, Estimated powers to detect metastatic driver under a matched-pairs primary-metastasis comparison study. Levels of driver alteration frequency among cases are shown in different line colors. Various probabilities of driver alteration occurring late during metastatic progression (see Fig. 3) are considered in separate subplots. Power is calculated for Poisson regression comparing absolute frequencies of late driver alterations against frequencies of late background alterations (which was estimated to be 1.0 from recurrently altered genes). Observations are assumed to be independent and identically distributed. Each case patient requires the processing of 3 samples (brain metastasis, matched primary tumor, and matched germline).
b, Estimated powers to detect metastatic driver under a case-control study. Levels of driver alteration frequency among cases are shown in different line colors. The driver alteration frequency is assumed to be 1% among TCGA-LUAD patients who do not develop brain metastasis (true controls). Power analysis corrects for the estimated 30% incidence of brain metastasis among TCGA-LUAD patients (cases-in-controls contamination). Each case patient requires the analysis of 2 samples (brain metastasis and germline).
Significance level is set to 0.05. Vertical line represents the realized sample size.
Extended Data Fig. 9.
Power analysis and statistical simulation of case-control study.
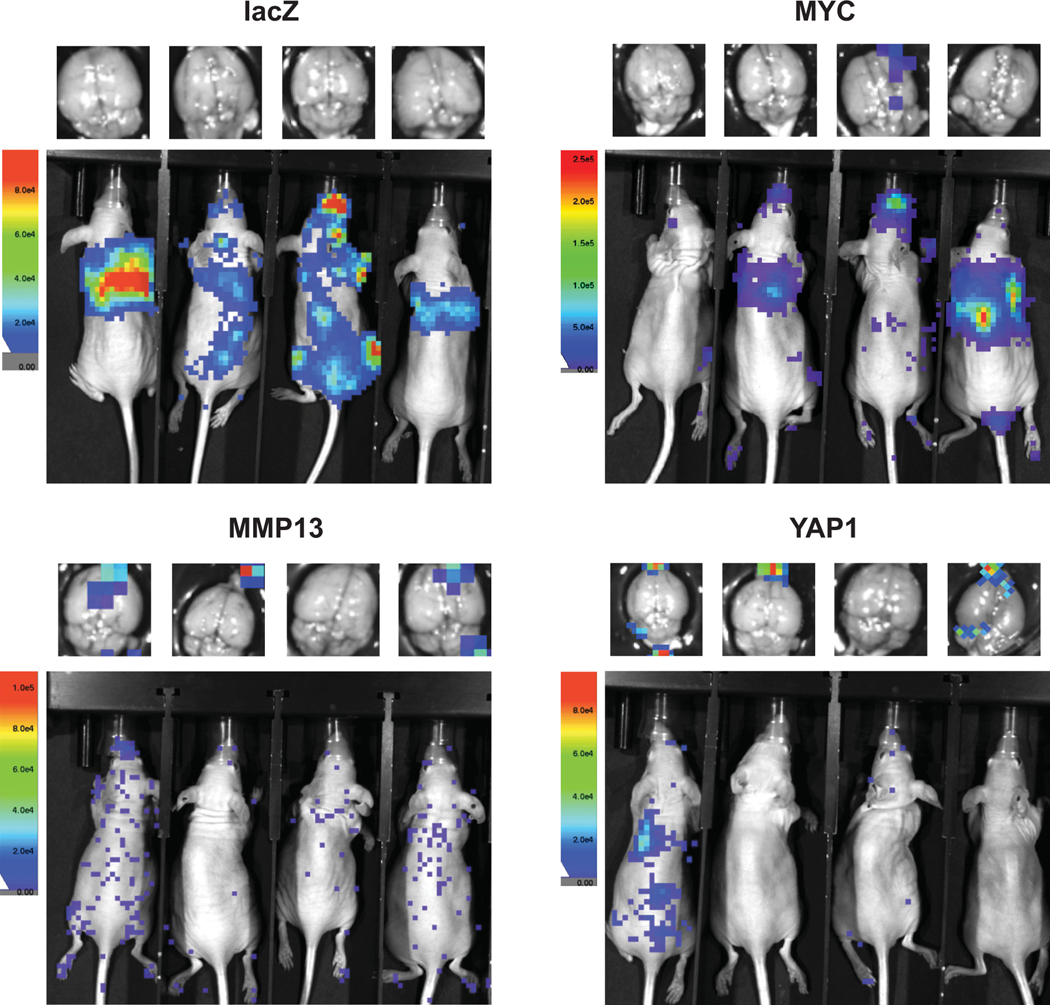
Representative in vivo and ex vivo brain bioluminescence images taken 12 days after intracardiac injections with tumor cells overexpressing lacZ, MYC, MMP13, or YAP1
Extended Data Fig. 10.
Power analysis and statistical simulation of case-control study.
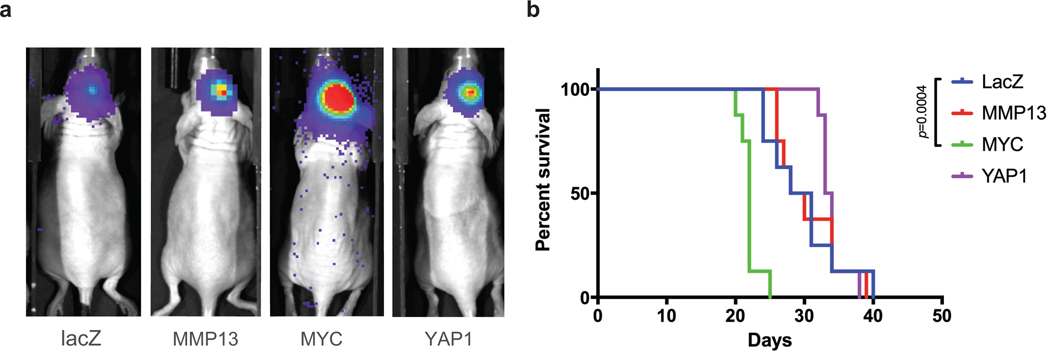
a, Representative in vivo bioluminescence images of xenograft mouse model 14 days post intracranial injections of 1 x 10⁴ tumor cells overexpressing lacZ, MYC, MMP13, or YAP1.
b, Overall mouse survival following intracranial injections of tumor cells. Median survival of the lacZ control group
(29.5 days; n = 8) was compared against those of the other groups by the log-rank test:
MYC (22 days; n = 8, p = 0.0004), MMP13 (29 days; n = 8, not significant), or YAP1 (33.5 days; n = 8, not significant).
Supplementary Material
Acknowledgments
This work was supported by a grant from the NCI (1R01CA227156–01) to P.K.B. and S.L.C; the Damon Runyon Foundation (to P.K.B.); the Conquer Cancer Foundation (to P.K.B.); the Breast Cancer Research Foundation (to P.K.B.) the Brain Science Foundation (to P.K.B.); Susan G. Komen for the Cure (to P.K.B.); the American Brain Tumor Association (to P.K.B.). P.K.B. is also supported by Breast Cancer Research Foundation and received institutional support from Massachusetts General Hospital. D.J.H.S. was supported by the Canadian Institutes of Health Research Fellowship. S.L.C. received institutional support from Dana-Farber Cancer Institute.
The authors would like to thank the patients for providing tissue samples; Loreal Brown, James Kim, and Bill Richards for assisting with sample collection; Giovanni Parmigiani, Jeffrey Miller, Masanao Yajima, Christopher Musco, Chip Stewart, Lee Lichtenstein, Samuel Lee, Mehrtash Babadi, David Benjamin, Brendan Reardon, and Keegan Korthauer for fruitful discussions.
Footnotes
Data availability
Sequencing data are deposited in dbGaP with accession number phs000730.v1.p1 and phs001920.v1.p1. This study makes use of data generated by The Cancer Genome Atlas Project.
Competing interests
I.D.J. has received honoraria from Foundation Medicine, consulting fees from Boehringer Ingelheim, travel support from Pfizer and Array, and research support from Pfizer, Genentech, Array, Novartis. A.S.B has research support from Daiichi Sankyo (≤ 10000€), Roche (> 10000€) and honoraria for lectures, consultation or advisory board participation from Roche Bristol-Meyers Squibb, Merck, Daiichi Sankyo (all < 5000€) as well as travel support from Roche, Amgen and AbbVie. B.E.J. has received post marketing royalties from Dana-Farber Cancer Institute for EGFR mutation testing, has ownership interest (including patents) in KEW Group and is a consultant/advisory board member for the same. T.B. reports receiving a commercial research grant from Pfizer; has received speakers’ bureau honoraria from Research To Practice, Imedex, and Oakstone; and is a consultant/advisory board member for Proximagen, Merck, Foundation Medicine, UpToDate, and Champions Biotechnology. No potential conflicts of interest were disclosed by the other authors. S.S. consults for Rarecyte, Inc. M.P. has received honoraria for lectures, consultation or advisory board participation from the following for-profit companies: Bayer, Bristol-Myers Squibb, Novartis, Gerson Lehrman Group (GLG), CMC Contrast, GlaxoSmithKline, Mundipharma, Roche, BMJ Journals, MedMedia, Astra Zeneca, AbbVie, Lilly, Medahead, Daiichi Sankyo, Sanofi, Merck Sharp & Dome, Tocagen. The following for-profit companies have supported clinical trials and contracted research conducted by MP with payments made to his institution: Böhringer-Ingelheim, Bristol-Myers Squibb, Roche, Daiichi Sankyo, Merck Sharp & Dome, Novocure, GlaxoSmithKline, AbbVie. P.K.B has consulted for Lilly, Tesaro, Elevate-Bio, Genentech-Roche and Angiochem, has received honoraria from Merck and Genentech and research funding from Merck, Pfizer, Lilly and BMS.
References
- 1.Cagney DN et al. Incidence and prognosis of patients with brain metastases at diagnosis of systemic malignancy: a population-based study. Neuro-oncology 19, 15111521, doi: 10.1093/neuonc/nox077 (2017). [DOI] [PMC free article] [PubMed] [Google Scholar]
- 2.Massague J. & Obenauf AC Metastatic colonization by circulating tumour cells. Nature 529, 298–306, doi: 10.1038/nature17038 (2016). [DOI] [PMC free article] [PubMed] [Google Scholar]
- 3.Steeg PS Tumor metastasis: mechanistic insights and clinical challenges. Nature medicine 12, 895–904, doi: 10.1038/nm1469 (2006). [DOI] [PubMed] [Google Scholar]
- 4.Martin JD, Fukumura D, Duda DG, Boucher Y. & Jain RK Reengineering the Tumor Microenvironment to Alleviate Hypoxia and Overcome Cancer Heterogeneity. Cold Spring Harbor perspectives in medicine 6, doi: 10.1101/cshperspect.a027094 (2016). [DOI] [PMC free article] [PubMed] [Google Scholar]
- 5.Brastianos PK et al. Genomic Characterization of Brain Metastases Reveals Branched Evolution and Potential Therapeutic Targets. Cancer discovery 5, 1164–1177, doi: 10.1158/2159-8290.CD-15-0369 (2015). [DOI] [PMC free article] [PubMed] [Google Scholar]
- 6.Cancer Genome Atlas Research, N. Comprehensive molecular profiling of lung adenocarcinoma. Nature 511, 543–550, doi: 10.1038/nature13385 (2014). [DOI] [PMC free article] [PubMed] [Google Scholar]
- 7.Porro SMIGKG Causal Inference without Balance Checking: Coarsened Exact Matching. Political Analysis 20, 1–24, doi: 10.1093/pan/mpr013 (2012). [DOI] [Google Scholar]
- 8.Lawrence MS et al. Mutational heterogeneity in cancer and the search for new cancerassociated genes. Nature 499, 214–218, doi: 10.1038/nature12213 (2013). [DOI] [PMC free article] [PubMed] [Google Scholar]
- 9.Martincorena I. et al. Universal Patterns of Selection in Cancer and Somatic Tissues. Cell 171, 1029–1041 e1021, doi: 10.1016/j.cell.2017.09.042 (2017). [DOI] [PMC free article] [PubMed] [Google Scholar]
- 10.Mermel CH et al. GISTIC2.0 facilitates sensitive and confident localization of the targets of focal somatic copy-number alteration in human cancers. Genome biology 12, R41, doi: 10.1186/gb-2011-12-4-r41 (2011). [DOI] [PMC free article] [PubMed] [Google Scholar]
- 11.Egeblad M. & Werb Z. New functions for the matrix metalloproteinases in cancer progression. Nature reviews. Cancer 2, 161–174, doi: 10.1038/nrc745 (2002). [DOI] [PubMed] [Google Scholar]
- 12.Harvey KF, Zhang X. & Thomas DM The Hippo pathway and human cancer. Nature reviews. Cancer 13, 246–257, doi: 10.1038/nrc3458 (2013). [DOI] [PubMed] [Google Scholar]
- 13.Porazinski S. et al. YAP is essential for tissue tension to ensure vertebrate 3D body shape. Nature 521, 217–221, doi: 10.1038/nature14215 (2015). [DOI] [PMC free article] [PubMed] [Google Scholar]
- 14.Overholtzer M. et al. Transforming properties of YAP, a candidate oncogene on the chromosome 11q22 amplicon. Proceedings of the National Academy of Sciences of the United States of America 103, 12405–12410, doi: 10.1073/pnas.0605579103 (2006). [DOI] [PMC free article] [PubMed] [Google Scholar]
- 15.Kapoor A. et al. Yap1 activation enables bypass of oncogenic Kras addiction in pancreatic cancer. Cell 158, 185–197, doi: 10.1016/j.cell.2014.06.003 (2014). [DOI] [PMC free article] [PubMed] [Google Scholar]
- 16.Shao DD et al. KRAS and YAP1 converge to regulate EMT and tumor survival. Cell 158, 171–184, doi: 10.1016/j.cell.2014.06.004 (2014). [DOI] [PMC free article] [PubMed] [Google Scholar]
- 17.Riihimaki M. et al. Metastatic sites and survival in lung cancer. Lung cancer 86, 78–84, doi: 10.1016/j.lungcan.2014.07.020 (2014). [DOI] [PubMed] [Google Scholar]
- 18.Lambert AW, Pattabiraman DR & Weinberg RA Emerging Biological Principles of Metastasis. Cell 168, 670–691, doi: 10.1016/j.cell.2016.11.037 (2017). [DOI] [PMC free article] [PubMed] [Google Scholar]
- 19.Davies JA Mesenchyme to epithelium transition during development of the mammalian kidney tubule. Acta anatomica 156, 187–201 (1996). [DOI] [PubMed] [Google Scholar]
- 20.McDonald OG et al. Epigenomic reprogramming during pancreatic cancer progression links anabolic glucose metabolism to distant metastasis. Nature genetics 49, 367–376, doi: 10.1038/ng.3753 (2017). [DOI] [PMC free article] [PubMed] [Google Scholar]
- 21.Nakatani K. et al. Targeting the Hippo signalling pathway for cancer treatment. Journal of biochemistry 161, 237–244, doi: 10.1093/jb/mvw074 (2017). [DOI] [PubMed] [Google Scholar]
- 22.The Cancer Genome Atlas Research Network. Nature 511(7511), 543–50 (2014). [DOI] [PMC free article] [PubMed] [Google Scholar]
- 23.Iacus SM, King G, and Porro G. Political Analysis 20(1), 1–24 (2012). [Google Scholar]
- 24.Ho D, Imai K, King G, and Stuart E. Journal of Statistical Software , Articles 42(8), 1–28 (2011). [Google Scholar]
- 25.Heon S, Yeap BY, Lindeman NI, Joshi VA, Butaney M, Britt GJ, Costa DB, Rabin MS, Jackman DM, and Johnson BE Clin Cancer Res 18(16), 4406–14 (2012). [DOI] [PMC free article] [PubMed] [Google Scholar]
- 26.Takamochi K, Oh S, and Suzuki K. Oncol Lett 6(5), 1207–1212 (2013). [DOI] [PMC free article] [PubMed] [Google Scholar]
- 27.Midha A, Dearden S, and McCormack R. Am J Cancer Res 5(9), 2892–911 (2015). [PMC free article] [PubMed] [Google Scholar]
- 28.Soh J, Toyooka S, Matsuo K, Yamamoto H, Wistuba II, Lam S, Fong KM, Gazdar AF, and Miyoshi S. Oncol Lett 10(3), 1775–1782 (2015). [DOI] [PMC free article] [PubMed] [Google Scholar]
- 29.Zhang Y-L, Yuan J-Q, Wang K-F, Fu X-H, Han X-R, Threapleton D, Yang Z-Y, Mao C, and Tang J-L Oncotarget 7(48), 78985–78993 (2016). [DOI] [PMC free article] [PubMed] [Google Scholar]
- 30.Tseng C-H, Chiang C-J, Tseng J-S, Yang T-Y, Hsu K-H, Chen K-C, Wang C-L, Chen C-Y, Yen S-H, Tsai C-M, Huang M-S, Ho C-C, Yu C-J, Tsai Y-H, Chen J-S, Chou T-Y, Tsai M-H, Chen H-Y, Su K-Y, Chen JJW, Chen H-W, Yu S-L, Liu T-W, and Chang G-C Oncotarget 8(58), 98384–98393 (2017). [DOI] [PMC free article] [PubMed] [Google Scholar]
- 31.Demichelis F, Greulich H, Macoska JA, Beroukhim R, Sellers WR, Garraway L, and Rubin MA Nucleic Acids Res 36(7), 2446–56 (2008). [DOI] [PMC free article] [PubMed] [Google Scholar]
- 32.Cibulskis K, McKenna A, Fennell T, Banks E, DePristo M, and Getz G. Bioinformatics 27(18), 2601–2 (2011). [DOI] [PMC free article] [PubMed] [Google Scholar]
- 33.Brastianos PK, Carter SL, Santagata S, Cahill DP, Taylor-Weiner A, Jones RT, Van Allen EM, Lawrence MS, Horowitz PM, Cibulskis K, Ligon KL, Tabernero J, Seoane J, Martinez-Saez E, Curry WT, Dunn IF, Paek SH, Park S-H, McKenna A, Chevalier A, Rosenberg M, Barker F. G. n., Gill CM, Van Hummelen P, Thorner AR, Johnson BE, Hoang MP, Choueiri TK, Signoretti S, Sougnez C, Rabin MS, Lin NU, Winer EP, Stemmer-Rachamimov A, Meyerson M, Garraway L, Gabriel S, Lander ES, Beroukhim R, Batchelor TT, Baselga J, Louis DN, Getz G, and Hahn WC Cancer Discov 5(11), 1164–1177 (2015). [DOI] [PMC free article] [PubMed] [Google Scholar]
- 34.McKenna A, Hanna M, Banks E, Sivachenko A, Cibulskis K, Kernytsky A, Garimella K, Altshuler D, Gabriel S, Daly M, and DePristo MA Genome Res 20(9), 1297–303 (2010). [DOI] [PMC free article] [PubMed] [Google Scholar]
- 35.http://broadinstitute.github.io/picard. Accessed: 2018-03–19.
- 36.Li H. and Durbin R. Bioinformatics 25(14), 1754–60 (2009). [DOI] [PMC free article] [PubMed] [Google Scholar]
- 37.Li H, Handsaker B, Wysoker A, Fennell T, Ruan J, Homer N, Marth G, Abecasis G, and Durbin R. Bioinformatics 25(16), 2078–9 (2009). [DOI] [PMC free article] [PubMed] [Google Scholar]
- 38.http://exac.broadinstitute.org. Accessed: 2018-03–19.
- 39.http://evs.gs.washington.edu/EVS/. Accessed: 2018-03–23.
- 40.Cibulskis K, Lawrence MS, Carter SL, Sivachenko A, Jaffe D, Sougnez C, Gabriel S, Meyerson M, Lander ES, and Getz G. Nat Biotechnol 31(3), 213–9 (2013). [DOI] [PMC free article] [PubMed] [Google Scholar]
- 41.Saunders CT, Wong WSW, Swamy S, Becq J, Murray LJ, and Cheetham RK Bioinformatics 28(14), 1811–7 (2012). [DOI] [PubMed] [Google Scholar]
- 42.Costello M, Pugh TJ, Fennell TJ, Stewart C, Lichtenstein L, Meldrim JC, Fostel JL, Friedrich DC, Perrin D, Dionne D, Kim S, Gabriel SB, Lander ES, Fisher S, and Getz G. Nucleic Acids Res 41(6), e67 (2013). [DOI] [PMC free article] [PubMed] [Google Scholar]
- 43.Benjamini Y. and Hochberg Y. Journal of the Royal Statistical Society. Series B (Methodological) 57(1), 289–300 (1995). [Google Scholar]
- 44.Kent WJ Genome Res 12(4), 656–64 (2002). [DOI] [PMC free article] [PubMed] [Google Scholar]
- 45.https://github.com/samtools/htslib. Accessed: 2018-03–19.
- 46.https://github.com/broadinstitute/oncotator. Accessed: 2018-03–19.
- 47.Olshen AB, Venkatraman ES, Lucito R, and Wigler M. Biostatistics 5(4), 557–72 (2004). [DOI] [PubMed] [Google Scholar]
- 48.Carter SL, Cibulskis K, Helman E, McKenna A, Shen H, Zack T, Laird PW, Onofrio RC, Winckler W, Weir BA, Beroukhim R, Pellman D, Levine DA, Lander ES, Meyerson M, and Getz G. Nat Biotechnol 30(5), 413–21 (2012). [DOI] [PMC free article] [PubMed] [Google Scholar]
- 49.Lawrence MS, Stojanov P, Polak P, Kryukov GV, Cibulskis K, Sivachenko A, Carter SL, Stewart C, Mermel CH, Roberts SA, Kiezun A, Hammerman PS, McKenna A, Drier Y, Zou L, Ramos AH, Pugh TJ, Stransky N, Helman E, Kim J, Sougnez C, Ambrogio L, Nickerson E, Shefler E, Cortes ML, Auclair D, Saksena G, Voet D, Noble M, DiCara D, Lin P, Lichtenstein L, Heiman DI, Fennell T, Imielinski M, Hernandez B, Hodis E, Baca S, Dulak AM, Lohr J, Landau D-A, Wu CJ, Melendez-Zajgla J, Hidalgo-Miranda A, Koren A, McCarroll SA, Mora J, Crompton B, Onofrio R, Parkin M, Winckler W, Ardlie K, Gabriel SB, Roberts CWM, Biegel JA, Stegmaier K, Bass AJ, Garraway LA, Meyerson M, Golub TR, Gordenin DA, Sunyaev S, Lander ES, and Getz G. Nature 499(7457), 214–218 (2013). [DOI] [PMC free article] [PubMed] [Google Scholar]
- 50.Martincorena I, Raine KM, Gerstung M, Dawson KJ, Haase K, Van Loo P, Davies H, Stratton MR, and Campbell PJ Cell 171(5), 1029–1041.e21 (2017). [DOI] [PMC free article] [PubMed] [Google Scholar]
- 51.Mermel CH, Schumacher SE, Hill B, Meyerson ML, Beroukhim R, and Getz G. Genome Biol 12(4), R41 (2011). [DOI] [PMC free article] [PubMed] [Google Scholar]
- 52.Korthauer K, Chakraborty S, Benjamini Y, and Irizarry RA Biostatistics (2018). [DOI] [PMC free article] [PubMed] [Google Scholar]
- 53.Muller P, Parmigiani G, and Rice K. Johns Hopkins University, Dept. of Biostatistics Working Papers (2006). [Google Scholar]
- 54.Gu Z, Eils R, and Schlesner M. Bioinformatics 32(18), 2847–9 (2016). [DOI] [PubMed] [Google Scholar]
- 55.Carpenter B, Gelman A, Hoffman M, Lee D, Goodrich B, Betancourt M, Brubaker M, Guo J, Li P, and Riddell A. Journal of Statistical Software, Articles 76(1), 1–32 (2017). [DOI] [PMC free article] [PubMed] [Google Scholar]
Methods-only References:
Associated Data
This section collects any data citations, data availability statements, or supplementary materials included in this article.


