Abstract
Neurofibromatosis type 1 (NF1) and Neurofibromatosis type 2 (NF2) are two dominantly inherited disorders that cause tumors in Schwann cells. NF1 patients have a high risk for malignant peripheral nerve sheath tumors (MPNST), which are often inoperable and do not respond well to current chemotherapies or radiation. NF2 patients have a high risk for schwannomas. To identify potential therapeutic targets in these two tumors, we screened the NF1 MPNST cell line, ST88-14, and the NF2 schwannoma cell line, HEI-193, against ~2000 drugs of known mechanisms of action (including ~600 cancer relevant drugs), and also screened the cell lines against an siRNA library targeting most protein kinases. Both the drug screen and the siRNA screen identified Polo-like kinase 1 (PLK1) among the most potent hits in both cell lines. Since PLK1 acts on the cell cycle primarily at the G2/M transition, the same stage where aurora kinase (AURKA) acts, we explored PLK1 and its relationship to aurora kinase in MPNST. Quantitative profiling of PLK1 inhibitors against a panel of 10 neurofibromatosis cell lines found that they were potent inhibitors and, unlike AURKA inhibitors, were not more selective for NF1 over NF2 tumor cells. Furthermore, one PLK1 inhibitor, BI6727 stabilized tumor volume in MPNST xenografts. We conclude that PLK1 is a therapeutic target for MPNSTs and schwannomas, but inhibitors may have a narrow therapeutic index that limits their use as a single agent.
Keywords: HTS, high throughput screen, siRNA screen, signal transduction, von Recklinghausen disease, heat map, xenograft, synthetic lethal
Introduction
Neurofibromatosis type 1 (NF1) and neurofibromatosis type 2 (NF2) are genetic disorders that commonly cause Schwann cell tumors. NF1 patients predominantly develop neurofibromas, and Malignant Peripheral Nerve Sheath Tumors (MPNST) while NF2 patients develop schwannomas and meningiomas. Most of the tumors are benign, but they cannot always be surgically resected and can sometimes become malignant.
From 30 to 50% of NF1 patients develop benign peripheral nerve sheath tumors, called plexiform neurofibromas (PNFs), which may transform to MPNST [1]. MPNST are aggressive life-threatening sarcomas that have a high probability of recurring or metastasizing [2]. They can occur sporadically, but are a rare tumor with an overall incidence in the general population of about 1/100,000. MPNST are much more common in NF1 patients with a lifetime risk of 8-13% [2,3]. Common sarcoma treatment regimens have been adapted for MPNST and include surgical excision with radiation and chemotherapy with agents such as doxorubicin, etoposide and ifosfamide [4]. There have been few controlled clinical trials for MPNST chemotherapy so the effectiveness of chemotherapeutic agents for MPNST have been difficult to evaluate, although one is in progress (SARC006, NCT00304083) [5]. MPNST do not respond well to cytotoxic chemotherapy and patients have a 5-year survival rate of just 35%-50%, even with aggressive surgery and chemotherapy. Survival is even lower for MPNST in patients with NF1 than in patients with sporadic MPNST.
The predominant risk factor for MPNST is a diagnosis of NF1. NF1 is a dominantly inherited, autosomal disorder with an incidence of 1 in 2500 [6,7]. Largely because of their tumors, the life expectancy of NF1 patients is reduced by 10-15 years [3]. NF1 follows a typical two hit progression. Patients are born with loss-of-function mutations in the tumor suppressor NF1. When Schwann cells acquire sporadic mutations in the other chromosomal copy of NF1, they initiate a benign tumor called a neurofibroma. Neurofibromas can progress to an atypical neurofibroma after mutation of CDKN2A [8]. Complete progression to an MPNST requires mutations in other genes including p53, EED or SUZ12 [9-11]. The NF1 gene product, neurofibromin, is a Ras-GAP. GAPs are negative regulators of Ras that act by accelerating the GTPase activity of Ras proteins, so when neurofibromin is lost cells have elevated levels of GTP-bound Ras and subsequent activation of Ras signaling pathways.
Schwannomas are common in neurofibromatosis type 2 (NF2) patients, though sporadic schwannomas also frequently have mutations in NF2. NF2 is located on a different chromosome than NF1 and encodes a cytoskeletal protein that is a member of the ERM family of cytoskeletal proteins, called merlin. Merlin has distinct biochemical properties than neurofibromin and regulates different signaling pathways. Merlin inactivates Pak and MLK3 kinases through direct interaction [12-15]. Merlin also regulates Hippo signaling [16-18].
Several protein kinases including WEE1, CDKs, Aurora kinases and Polo-like kinases (e.g. PLK1) regulate progression through the cell cycle and make them promising targets for treatment of many cancers [19]. We recently found that Aurora kinase A (AURKA) was overexpressed in MPNST compared to neurofibromas, that inhibiting AURKA reduced the viability of MPNST cells and the AURKA inhibitor MLN8237 transiently inhibited xenografts in mice [20,21]. PLK1 can be phosphorylated by AURKA and additionally PLK1 was identified in a synthetic lethal siRNA screen for genes that are required in cells with mutant Ras [22].
Here we show that PLK1 inhibitors are among the top hits from high throughput drug screens and siRNA kinome screens of both an MPNST cell line (ST88-14) and an NF2 schwannoma cell line (HEI-193). PLK1 inhibitors were highly active compared with other cell cycle kinase inhibitors against a panel of cells representing NF1, NF2 and sporadic tumors, but did not distinguish between the different cell types. Since AURKA interacts with PLK1 to promote checkpoint recovery, we addressed if there was any synergy between inhibition of PLK1 and AURKA but did not find any [23]. Thus, PLK1 inhibitors are active against NF tumors, but unlike previous reports, do not show synthetic lethality with activated Ras [22].
Materials and methods
Cell culture
Human NF1-derived MPNST cell lines ST88-14, T265, 90-8, and the sporadic human MPNST cell line STS26T have been described [24]. ST88-3, S462TY, sNF02.2, sNF96.2 and KT21-MG1-Luc5D were provided by Dr. Jonathan Chernoff (Fox Chase Cancer Center, Philadelphia, PA, USA). The human schwannoma cell line, HEI-193, which was immortalized from a NF2 patient [25], and SC4 cells from NF2-/- mice, were generously provided by Dr. Marco Giovannini (University of California, Los Angeles, CA). The rat schwannoma line, RT4-67 (RT4), was obtained from Dr. Joseph Kissil (The Scripps Research Institute, Jupiter, Florida). ST88-14, T265, STS26T, ST88-3, S462TY, sNF96.2, sNF94.3, HEI-193, KT21-MG1-Luc5D, SC4 and RT4 cell lines were grown in Dulbecco’s Modified Eagle’s Medium (DMEM; Gibco, Life Technologies, NY, USA) supplemented with 10% fetal bovine serum (FBS; Sigma-Aldrich, MO, USA) and Penicillin Streptomycin (P/S; Gibco, Life Technologies, NY, USA). The 90-8 cell line was grown in RPMI 1640 (Corning, VA, USA) containing 10% FBS and 1% P/S. Cell lines were confirmed by STS marker profiling, documented to be Mycoplasma negative and cryobanked.
Drugs and compound management
We screened a library of small molecules enriched for FDA approved drugs (1164) and compounds with known bioactivity towards pharmacologically tractable targets with a history of clinical use in humans (Selleckchem, Houston, TX). The library is composed of 373 known kinase inhibitors, 246 compounds classified as cancer chemotherapeutics, 150 inhibitors of epigenetic regulators, 358 GPCR and Ion Channel inhibitors, with the remaining compounds falling into diverse target classes (e.g. protease, microbiology, etc.). Compounds were suspended in DMSO, arrayed as one compound per well at a single concentration in columns 3-22 of 384 well microplates, and stored at -40°C. Library plates are thawed a maximum of 10X to maintain compound integrity. A custom library of ~250-compounds (Selleckchem) was prepared for drug sensitivity profiling. Fortyfour drugs were arrayed per 384 well plate in 8-pt serial dilutions of each drug in 100% DMSO. Column one of each compound plate contained 100% DMSO as a solvent control. Column two contained 10 mM doxorubicin as a positive control for cytotoxicity. Multiple daughter plates for each source plate were prepared containing 5 μl of compound and stored at -40°C. Each daughter plate was thawed a maximum of 10 times.
High throughput screening and profiling
The workflow for high throughput profiling was previously described [26]. 2000 cells were plated in a volume of 25 μl per well of 384-well microplates (Corning 3707) using a Multidrop Combi Reagent Dispenser (Thermo Scientific) and allowed to attach overnight at 37°C, 5% CO2 in a humidified chamber. Drugs (50 nL) were transferred to assay plates using a 384 W, 50 nL slotted pin tool (V&P Scientific) and a JANUS Automated Workstation (Perkin Elmer). For screening, the concentrations of test compounds were 10 nM, 100 nM and 1.0 μM in 0.2% DMSO. Columns 1 and 23 of each assay plate were treated with 0.2% DMSO (negative control). Columns 2 and 24 were treated with 5 uM doxorubicin in 0.2% DMSO (positive control). For profiling, the final concentrations of each test compound were 4.6 nM, 14 nM, 41 nM, 123 nM, 370 nM, 1.11 μM, 3.33 μM, and 10 μM. Plates were incubated for 72 hours at 37°C, 5% CO2. Cell viability was measured using the ATPlite Luminescence Assay (PerkinElmer). Assay plates were removed from the incubator for 1 hour to equilibrate to room temperature prior to adding 25 μL of ATPlite per well using a Multidrop combi reagent dispenser. Luminescence was measured on an EnVision Xcite Multilabel Plate Reader (PerkinElmer), using the ultrasensitive luminescence measurement technology.
Data analysis
Raw values from Negative (DMSO) and Positive control (doxorubicin) wells were aggregated and used to calculate z’-factors for each assay plate, as a measure of assay performance and data quality, with a z’-factor >0.5 representing acceptable data. Raw data values of experimental sample wells were normalized to aggregate negative control and positive plate control wells and expressed as Normalized Percent Inhibition [NPI = ((DMSOavg-Test well)/(DMSOavg-Doxorubicinavg) × 100)] and Z-score [Z = (DMSOavg-Test well)/(DMSOsd]. A non-linear fit with variable slope (GraphPad Prism 7) of Normalized Percent Inhibition and log10 drug concentration values was used to define IC50 values for each drug cell line combination. Heat maps were generated in GraphPad Prism.
siRNA screening
The Ambion Silencer Select (Life Technologies, Carlsbad, CA) siRNA library was arrayed in 384 well plates with 3 siRNAs against a single gene target pooled in one well. Assay ready plates (384-well) were prepared by spotting 1 ul of 1.5 uM siRNA from a stock plate, heat sealed and stored at -80°C until use. Each assay plate contains siRNAs to 352 independent gene targets. Prior to use, assay plates were thawed at room temperature and 1 ul of 1.5 uM control siRNAs were manually added to columns 23 and 24. For negative controls, cells were transfected with 30 nM siRNA against GAPDH, Luciferase, GFP, and sequences that do not target a human cellular gene, respectively. For a positive transfection control, cells were transfected with 30 nM siDeath (Qiagen). The ST88-14 cell line was transfected with 0.1 ul/well RNAiMAX (LifeTechnologies). The HEI193 cell line was transfected with 0.5 ul/well HiPerFect (Qiagen). The transfection reagent was diluted in OptiMEM (Invitrogen) and equilibrated for 30 minutes at room temperature prior to dispensing 10 ul to siRNA containing assay ready plates using a Multidrop Combi Reagent Dispenser (Thermo Scientific). The siRNA lipid mixture was incubated at room temperature for 30 minutes. 2000 cells in 40 μL of complete growth medium were then dispensed to assay plates using a Multidrop combi. Assay plates were incubated for three days at 37°C, 5% CO2 in a humidified chamber. Cells were fixed with 4% formaldehyde and nuclei were stained with 4 ug/ml Hoescht dye. Nuclei were imaged at 10X on an automated ImageXpress Micro (Molecular Devices, Sunnyvale CA). The number of cells was quantified using Metaxpress 5.3.05 (Molecular Devices, Sunnyvale, CA). Nuclei counts were normalized to aggregated negative control wells and expressed as Percentage of Control (POC = observed/NegCavg) and z-score, a measure of standard deviation away from the mean, in Spotfire (PerkinElmer). Candidate hits were defined by a z-score >3.
Expression analysis
We used the published microarray dataset (GEO accession #: GSE41747-GPL10371, Affymetrix GeneChip HU133 Plus 2.0, [CDF: HGU133Plus2_Hs_REFSEQ_11.0.1]) for gene expression pattern analysis. This dataset includes 86 microarrays in total, consisting of 77 samples and 9 batch reference samples: Nerve (3), dNF (13), pNF (13) and MPNST (6). For gene annotation, custom CDF (custom GeneChip library file) based on RefSeq target definitions (Hs133P REFSEQ Version 8) was downloaded and used to provide accurate interpretation of GeneChip data. We also used published mouse microarray dataset (GEO accession #: GSE41747-GPL1475, Affymetrix GeneChip Mouse Genome 430 2.0 Array [CDF: Mouse4302_Mm_REFSEQ_v11]) for gene expression pattern analysis. The GEM Nf1 model tumor data set consisted of 15 littermate control nerves encompassing 3 genotypes (5 P0CreB, 5 Nf1 flox/flox, 5 Nf2 flox/flox), 15 GEM model neurofibromas encompassing 3 genotypes (4 DhhCre; Nf1 flox/-, 7 DhhCre; Nf1 flox/flox, 4 P0CreB; Nf1 flox/flox) and 18 GEM model MPNSTs encompassing 5 genotypes (5 P0CreB; Nf1 flox/flox; Nf2 flox/+, 3 P0CreB; Nf2 flox/flox, 3 P0CreB; Nf1 flox/+; Nf2 flox/flox, 3 P0CreB; Nf2 flox/flox; p53+/-, 4 NPcis).
In vitro cytotoxicity assay
MPNST cell lines were plated in 96-well plates at 500 cells per well in medium containing 10% fetal bovine serum and 1% antibiotic. Plates were incubated at 37°C and 5% CO2 overnight. Cells were then treated with media alone or inhibitors. Volasertib (BI6727) was purchased through Selleckchem, and Alisertib (MLN8237) was provided by Millennium Pharmaceuticals, Inc., Landsdowne Street, Cambridge, MA 02139. For the single reagent study (BI6727 alone), cells were treated in quintuplet for each dose. For the double reagent study (BI6727 and MLN8237 in combination), cells were treated in triplicate for each dose. The amount of proliferation was quantified 4 days post addition of drug by a 3-(4,5-dimethylthiazol-2-yl)-5-(3-carboxymethoxyphenyl)-2-(4-sulfophenyl)-2H-tetrazolium, inner salt (MTS) assay using Cell titer 96 Aqueous One proliferation kit (Promega). Absorbance was read at 490 nm in a Spectramax M2 plate reader (Molecular Devices).
MPNST xenograft
STS26T MPNST cells (1.5 × 10⁶) were suspended in 30% Matrigel (BD Biosciences) and were subcutaneously injected into the flank of 6-week-old female athymic nude mice (Harlan; Indianapolis, Indiana). Once tumors were visible tumor volumes were monitored using digital calipers once every 3 days. Dosing began when tumor volumes reached an average of 250 mm3. Tumor volume was calculated by: L × 2 W (π/6). Administration and dose of BI6727 was determined by Selleckchem’s suggested dose, followed by a toxicity trial. Mice in the vehicle group received the vehicles of which consisted of 0.1 N Hydrochloric Acid in 0.9% Saline solution in sterile water via oral gavage. Mice given BI6727 were given a dose of 10 or 35 mg/kg, dissolved in vehicle, via oral gavage three times weekly (Monday, Wednesday and Friday). Mice were sacrificed when tumor volume exceeded 10% body weight. We also weighed mice every three days to exclude toxicity effects. Survival was analyzed by log-rank tests using GraphPad Prism.
Immunohistochemistry and western blotting
For immunohistochemistry, paraffin sections were de-paraffinized, hydrated and transferred to 0.1 M citrate buffer (pH 6.0) for antigen retrieval. Slides were boiled for 10 minutes in citrate buffer, cooled at room temperature for 30 minutes, rinsed in water twice and in PBS 3 times. Sections were quenched with 3% hydrogen peroxide for 10 minutes, rinsed in PBS, and blocked in 10% normal goat serum with 0.3% Triton-X-100. Later, sections were incubated overnight in primary antibody; rabbit cleaved caspase-3 (1:8000, Cell Signaling, #9661), rabbit p-histone 3 (1:800, Cell Signaling, #9701), Rabbit Ki-67 (1:5000 NCL-Ki67-P; Novocastra) and rabbit cyclinB1 (1:500, Cell Signaling, #4138). Sections were then incubated in biotinylated goat anti-rabbit secondary antibodies (Vector, at a dilution of 1:200) for an hour, rinsed and incubated in Avidin Biotin complex (Vector Vectastain ABC Kit PK-6100) for another hour, rinsed and stained with DAB (Vector DAB Peroxidase Substrate Kit SK-4100), rinsed, dehydrated, counterstained with Harris hematoxylin and then mounted on a slide with histo-mount. Some sections were processed with the histological stain, Hematoxylin & Eosin. For nuclear staining, sections were incubated with propidium iodide/RNase staining solution (Cell Signaling, #4087) for 15 minutes at room temperature in the dark, rinsed in PBS 3 times and then cover glassed with Prolong® Gold Antifade Reagent (Life Technologies, #P36930). Sections were photographed on the Zeiss LSM 510 scanning confocal microscope equipped with an argon-ion multi line, HeNe 543, and HeNe 633 lasers. Western blots were probed with phosphor-PLK1 Thr210 D5H7 Cell Signaling, #9062) and PLK1 (Cell Signaling, #4535).
Cell cycle analysis
For cell cycle analysis, ST88-14 cells were plated in 60 mm culture dishes at a density of 300,000 cells. After 24 h, cells were synchronized with double thymidine block (2 mM) and treated with BI6727 (100 and 500 nM), MLN8237 (500 nM) or a combination of both drugs for 24 h. Cells were collected by pooling together the non-attached and attached cells and incubated in trypsin-EDTA, washed twice with cold PBS, fixed in ice cold 70% ethanol for 30 minutes and subsequently spun at 5000 rpm for 5 minutes. Cell pellets were washed in PBS+2% BSA and treated with Propidium iodide/RNAse staining solution (Cell Cycle Detection Kit, Becton Dickinson, Franklin Lakes, NJ) in the dark for 1 hour at 4°C. Flow cytometric analysis was performed with a FACSCalibur flow cytometer (Becton Dickinson). Finally, the cell cycle distribution was analyzed by Cell Quest software (Becton Dickinson).
Results
To identify drugs and drug targets in NF1 and NF2 cells, we screened a small molecule library of FDA approved drugs and known bioactive compounds suitable for repurposing. In addition, we screened a focused siRNA library targeting >1000 kinases and phosphatases. The cells chosen for screening were ST88-14, an NF1-/- MPNST derived from an NF1 patient and HEI-193, a schwannoma from an NF2 patient. From prior analysis, we determined that ST88-14 has responses typical of NF1-MPNST to a wide panel of anti-neoplastic agents. HEI-193 is one of the few Schwannoma cell lines isolated from NF2 patients and is NF2-/-. In all four of these unbiased screens PLK1 siRNA and PLK1 inhibitors were among the top hits. Although AURKA inhibition also reduced cell growth significantly, AURKA siRNA and small molecule inhibitors were not as potent as PLK1 in inhibiting cell growth (Figures 1 and 2). Repeats of the NF1 and NF2 siRNA screens showed high reproducibility, respectively. The Spearman rank correlation (Rs) for NF1 v. NF1 was 0.86. The Rs for NF2 vs. NF2 was 0.76. However, NF1 compared with NF2 yielded a Rs of 0.39 (Figure 3A-D). PLK1 was the top hit in comparing the two cell lines (Figure 3C).
Figure 1.
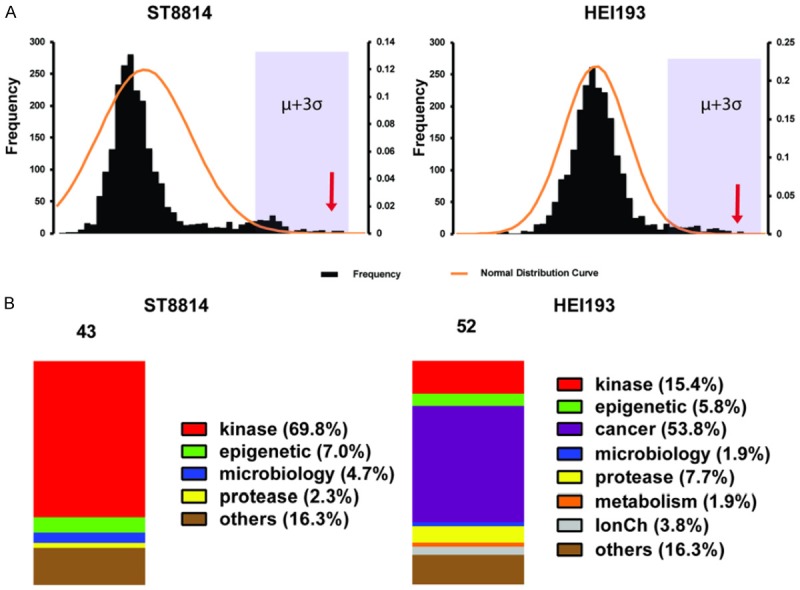
PLK1 inhibitors identified in a 2240 compound screen in NF1 (ST88-14) and NF2 (HEI-193) cells. (A) NF1 (left) and NF2 (right) cell line Z score distribution, Z scores higher than μ+3σ are presented in (B). μ, mean of Z scores; σ, standard deviation of Z scores. Arrows indicate where most PLK1 drugs ranked. (B) Category distribution of the top-ranked inhibitors according to a cut-off value of μ+3σ. Left, NF1; right, NF2.
Figure 2.
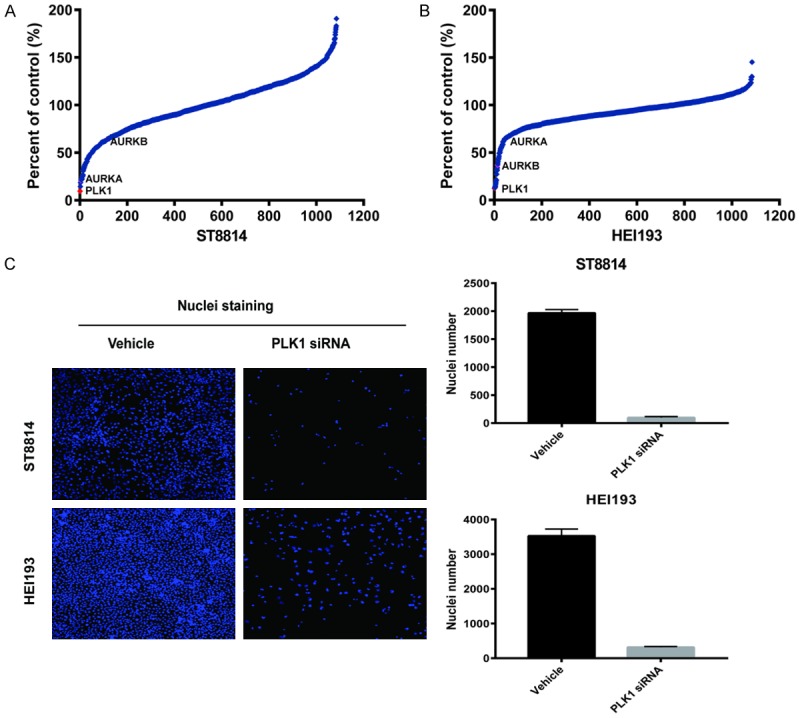
siRNA screen of NF1 (ST88-14) and NF2 (HEI-193) cells. Cell Viability of siRNA transfected cells was measured by counting Hoechst stained nuclei 72 hours post-transfection. (A and B) Z-score plots of siRNA knockdown in ST88-14 (A) and HEI-193 (B). The relative ranking of PLK1, AURKA, and AURKB kinases are indicated. (C) Representative images of nuclei from cells transfected with NegC and PLK1 siRNA. Right side graphs demonstrate the number of nuclei counted between NegC and PLK1 siRNA transfections.
Figure 3.
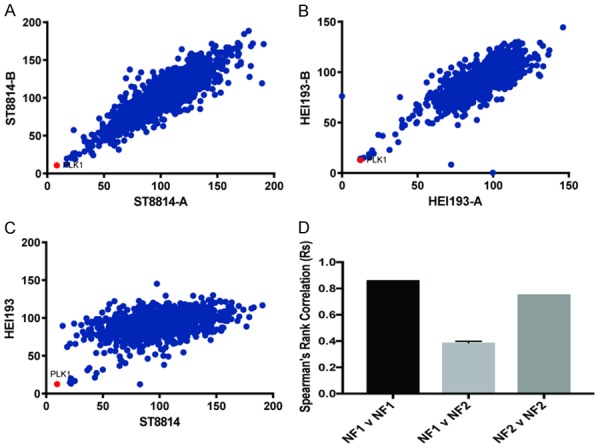
Comparison of NF1 and NF2 screens. Comparison of siRNA activity in independent replicates. (A) NF1 vs. NF1, (B) NF2 vs. NF2 and (C) NF1 vs. NF2. (D) Spearman’s correlation coefficients for siRNA screens.
We also analyzed expression levels of PLK1 in NF1 tumors by extracting data from microarray studies of human samples of (Figure 4A) and mouse tumors (Figure 4B) [24,27]. Compared to dermal nerves, neurofibromas (dNF) or peripheral neurofibromas (pNF) the MPNST had the highest levels of PLK1 expression and expression levels were comparable to that seen with AURKA or AURKB. When we examined MPNST cell lines on western blots, they expressed higher levels of PLK1 than primary Schwann cells (Figure 4C).
Figure 4.
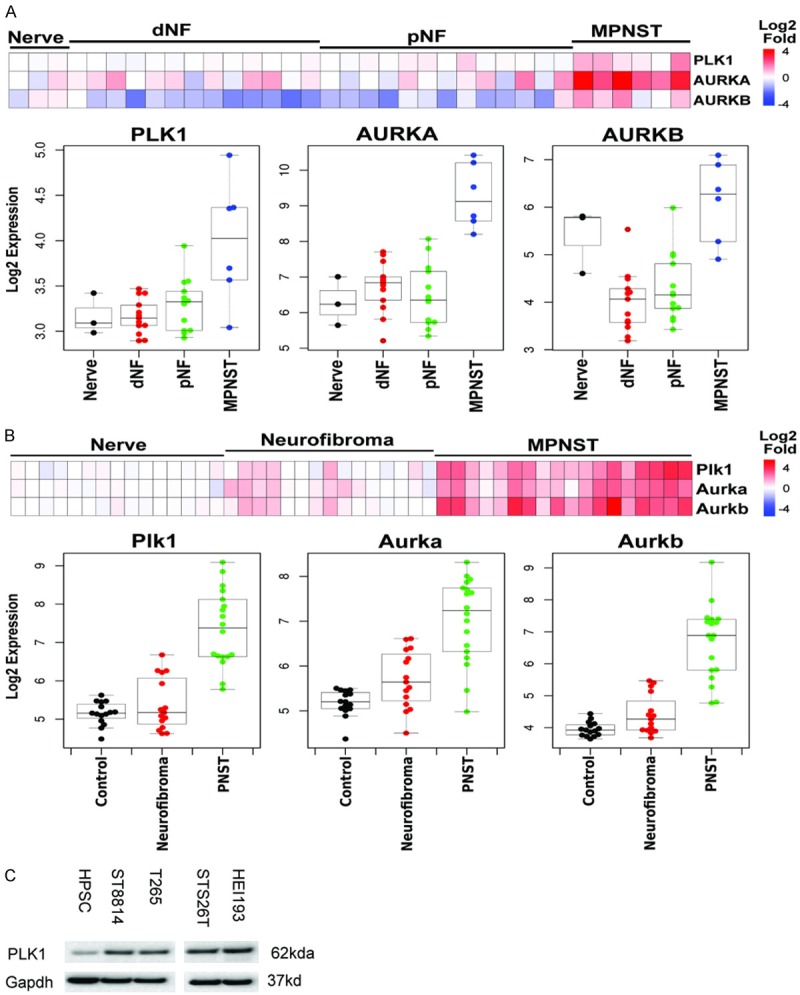
PLK1 and AURK expression is increased in MPNST. Expression levels were determined from microarrays. A. Human Nerves, dermal neurofibromas (dNF), peripheral neurofibromas (pNF) and MPNST. B. Mouse nerves neurofibromas and MPNST. C. Western blot of cells used in this study compared with human peripheral Schwann cells (HPSC). A lane was deleted from the gel, due to a loading error.
To confirm the activity of siRNA and drugs identified in our screens, we profiled four PLK1 kinase inhibitors at eight concentrations against seven NF1-associated MPNST cell lines (ST88-14, T265, ST88-3, 90-8, sNF02.2, S462TY, SNF96.2), one sporadic MPNST cell line (STS26), one schwannoma from a NF2 patient (HEI-193), one NF2-deficient malignant meningioma (KT21-MG-Luc5D), one mouse NF2 schwannoma (SC4) and one sporadic rat schwannoma (RT4-67 or RT4) (Figure 5, data shown only for the human cell lines). These cells lines represent the different genotypes of NF tumors, NF1-/-, NF2-/- and sporadic. The data was used to calculate the IC50 of each drug (Figure 5A-C). All PLK1 inhibitors were highly active at inhibiting growth in the cell lines. Both NF1 and NF2 cells arrested in G2 when treated with a PLK1 inhibitor and PLK1 inhibitors reduced phosphorylation of PLK1 (Figure 5D and 5E). No effects were seen on cell migration in a wound healing assay (Figure S1). Importantly, there was almost no difference in the response of the different cell lines to PLK1 inhibition, suggesting that neither NF1 status nor NF2 status influences the sensitivity to PLK1 inhibitors. Since PLK1 regulates the cell cycle, we also profiled the activity of other cell cycle protein kinase inhibitors. Most other cell cycle kinase inhibitors, with the exception of CDK4/6 inhibitors, showed considerable activity. Some inhibitors, including the CDK4/6 inhibitor LY2835219 and the AURKA inhibitor MLN8237, showed some preference for NF1 cell lines over NF2 cell lines (Figure 5A and 5B). AURKA siRNA were also more potent in NF1 than NF2 cells (Figure 2A). For comparison, we show that MEK1/2 inhibitors show a marked preference for inhibiting NF1 MPNST over NF2 cell lines (Figure 5B).
Figure 5.
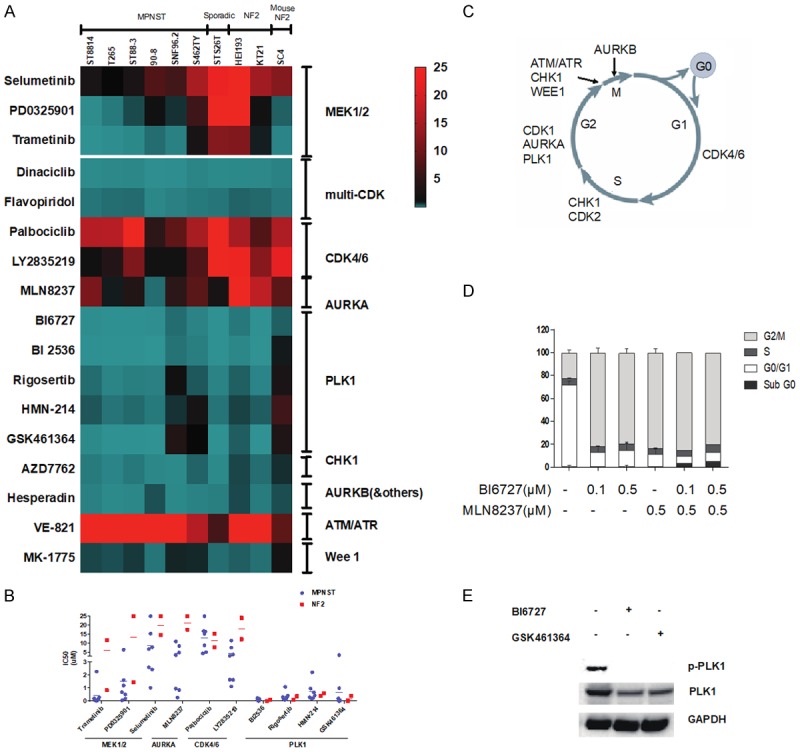
High throughput profiling of PLK1, AURKA and MEK1/2 inhibitors. (A) Eight concentrations of each drug were tested, and the data are expressed as a heat map of the IC50s. (B) IC50s of selected drugs were replotted. For this analysis only human cell lines were included that were derived from NF1 and NF2 patients. (C) The cell cycle kinases profiled against neurofibromatosis cells in (A). (D) Flow cytometry analysis of the effect of PLK1 inhibitor BI6727 and the Aurora Kinase inhibitor, MLN8237 using propidium iodide DNA staining. Cells were treated for 24 hours. The histogram shows the percentage of cells in different phases of the cell cycle. (E) ST8814 cells were synchronized by thymidine (2.5 mM, 24 h) treatment followed by washed with PBS and incubated for 18 h in fresh medium supplemented with nocodazole (1 μg/mL) to arrest cells in mitosis. Cells were treated with 10 μmol/L of BI6727 and 10 μmol/L of GSK461634 for 24 h and then harvested. A western blot was probed for p-PLK1, total PLK1, and GAPDH.
Since PLK1 is a target of AURKA, we co-treated cells with a PLK1 inhibitor and an AURKA inhibitor and used the Chou-Talalay method to determine if there were any synergistic effects between them [28]. The combination index was 1.05 indicating that the two drugs were additive in combination and not synergistic (data not shown).
We used an MPNST xenograft model to test BI6727 (Volasertib) a PLK1 inhibitor (Figure 6). BI6727 was highly effective in preventing tumor growth when administered at 50 mg/kg 3 times weekly (Figure 6A) in a pilot experiment testing it at a dose previously used in vivo [29]. However, the mice did not tolerate the drug well and ~25% died after one week. At lower doses BI6727 was not as effective and caused a temporary reduction in tumor volume at 35 mg/kg, and at 10 and 25 mg/kg it did not differ from the vehicle alone (Figure 6B). On histological analysis, at the end of the experiments, tumors from treated animals did not show obvious differences in cell death (cleaved caspase-3), cell proliferation (Ki67) or mitosis (phosphohistone-3), during drug response (Figures 7A and S2), or at the end of the experiment (Figure 7B). Previous studies showed that high doses of AURK inhibitor result in accumulation of multinucleated MPNST cells in xenografts [21]. We found that PLK1 inhibition also caused the appearance of multi-nucleated cells (Figure 7A and 7B) in MPNST xenografts. This is likely the result of cell cycle arrest as PLK1 and AURKA inhibitors both caused NF1 and NF2 cells to arrest in G2 (Figure 5C).
Figure 6.
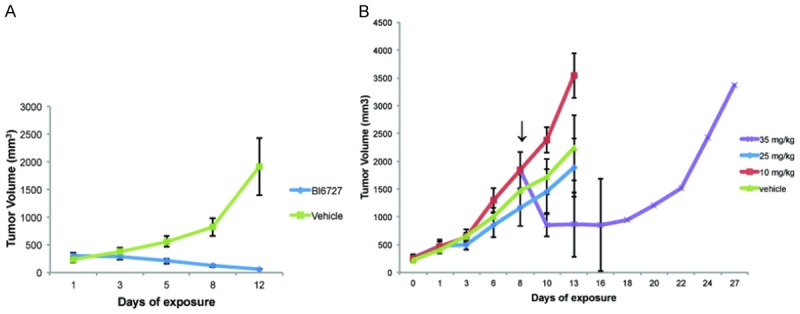
Xenografts with the PLK1 inhibitor BI6727. A. Mice treated with BI6727 at 50 mg/kg. B. Dose escalation study of BI6727.
Figure 7.
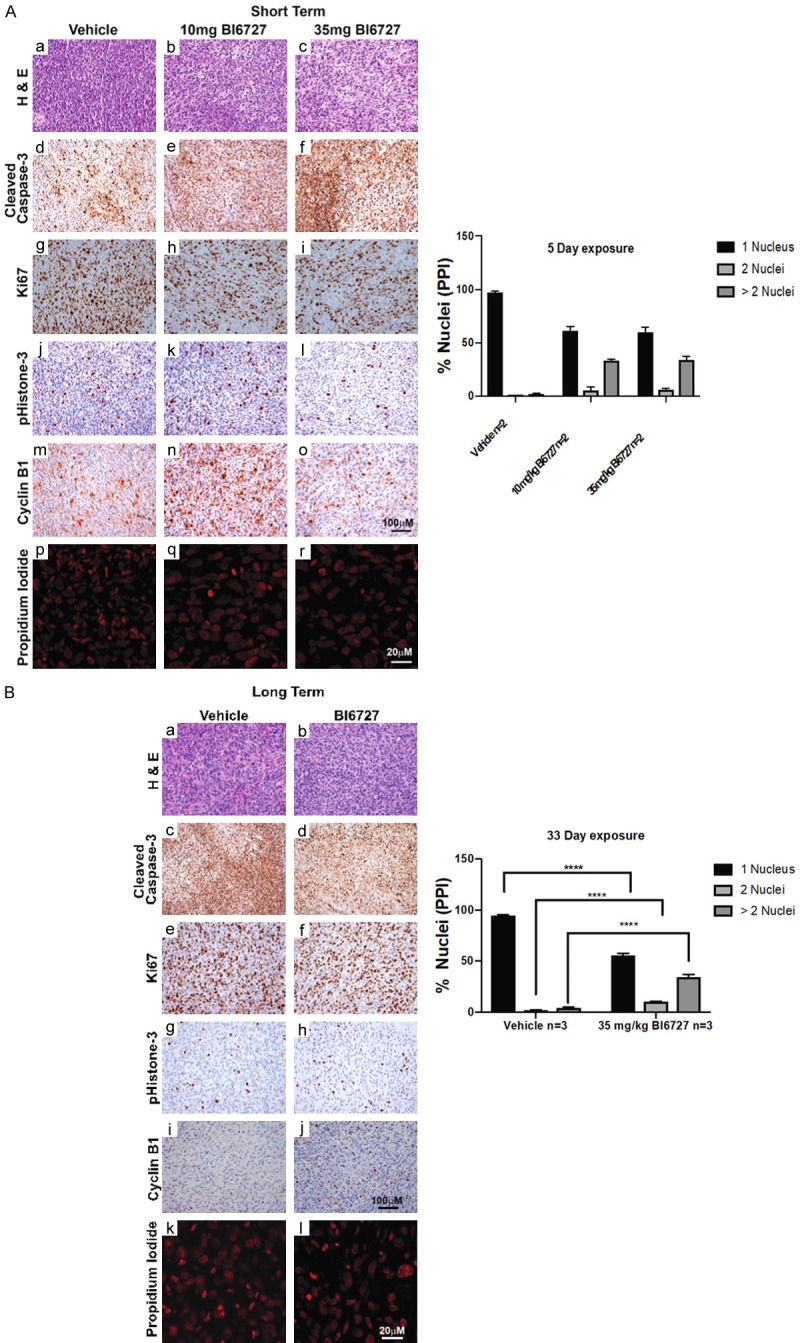
Histology of tumors from treated mice. A. Mice were treated for 5 days and stained as indicated. B. Mice were treated for 33 days and stained as indicated. Data were analyzed using multiple t-tests.
Discussion
We used high throughput screening of FDA approved drug libraries with content suitable for repurposing and siRNA libraries to identify candidate drugs and drug targets for NF1 and NF2. The NF1 MPNST hits in our diverse drug library screen was dominated by protein kinases. The NF2 screen had fewer protein kinase inhibitor hits amongst the top drugs. The common hits were dominated by cell cycle kinase inhibitors, while NF1 tumors (with the exception of the NF2 mouse line SC4) were sensitive to MEK inhibitors. We studied PLK1 in depth because it was a top screening hit, even among cell cycle kinases, it interacts with a documented target, AURKA, and several PLK1 inhibitors are in clinical trials [21]. Moreover, protein kinases are major cancer drug targets, with several kinase inhibitor drugs approved and many others in clinical trials.
Our diverse panel of neurofibromatosis tumors allowed us to determine if tumor origins were a factor in PLK1 sensitivity. A previous siRNA screen found that tumor cell lines with mutant Ras genes are especially sensitive to PLK1 inhibitors [22]. This was because there was a correlation between the presence of activated Ras and sensitivity of cells to PLK1 inhibition, a phenomenon called synthetic lethality. If synthetic lethality were occurring in NF cell lines, the cell lines with NF1 mutations would be more responsive to pathway inhibition compared to cell lines without NF1 mutations. Examples of this in our studies are the highly selective killing of NF1 cells by MEK1/2 inhibitors, as well as the somewhat less selective killing by AURKA and CDK4/6 inhibitors. However, we found that all cells were sensitive to PLK1 inhibition, regardless of origin-NF1, NF2 or sporadic MPNST. This observation was concordant across our siRNA screens, drug screens and in quantitative drug sensitivity profiling (Figures 2 and 5). Thus, while PLK1 inhibition was effective in all cells, we did not observe any evidence of selective synthetic lethality between Ras and PLK1 inhibition.
PLK1 inhibitors are common hits in drug and siRNA screens, though not always tested in xenografts [22,30]. When we tested a PLK1 inhibitor in xenografts, achievable doses failed to significantly block MPNST tumor growth. A higher dose was not well tolerated. We were not able to determine the reasons for the toxicity, but clinical trials with PLK1 inhibitors have found hematological toxicities and thrombosis [31-33]. It remains possible that other agents targeting cell cycle pathways, or combinations of agents, will be more effective. By way of comparison, achievable doses of MEK inhibitors as single agents show a transient delay in MPNST xenograft growth in the tumor model tested here [27], and higher doses of an AURKA inhibitor cause sustained suppression of MPNST xenograft growth [21]. Notably, a Phase 1 trial of an AURKA inhibitor showed some evidence of activity versus historical controls in advanced metastatic sarcoma patients with MPNST [34].
MEK inhibitors benefit NF1 patients with neurofibromas and two MEK inhibitors are already FDA approved for BRAF positive melanomas [35]. However, MEK inhibitors only extend life about two months for BRAF positive melanoma patients. Furthermore, malignant tumors with mutant Ras, even melanomas, do not respond to MEK inhibitors. When MEK inhibitors were tested in MPNST models as single agents using xenografts and genetically engineered mice, they only slowed tumor growth. They caused regression when combined with other agents such as bromodomain inhibitors [27,36]. Given the ineffectiveness of MEK inhibitors with other Ras-dependent malignant tumors, it is not clear that their success with benign neurofibromas will also be seen in MPNST tumors when used as a single agent. We identify PLK1 as another target for MPNST, though it is likely that PLK1 inhibitors will not be highly effective as a single agent.
Acknowledgements
We thank Drs. Marco Giovannini, Joseph Kissil and Jonathan Chernoff for generously providing cell lines and Dr. Tilat Aziz Rizvi for assistance with histology. This study was supported by the Children’s Tumor Foundation 2015-05-006 and 2019-05-004, DOD NF180079 and NIH grant R01HL134923 to JF and 1R21NS084885-01A1 (to NR).
Disclosure of conflict of interest
None.
Abbreviations
- HTS
High Throughput Screen
- NF1 or NF2
Neurofibromatosis types 1 or 2
- MPNST
Malignant Peripheral Nerve Sheath Tumors
- Rs
Spearman’s rank correlation coefficients
Supporting Information
References
- 1.Tucker T, Wolkenstein P, Revuz J, Zeller J, Friedman JM. Association between benign and malignant peripheral nerve sheath tumors in NF1. Neurology. 2005;65:205–211. doi: 10.1212/01.wnl.0000168830.79997.13. [DOI] [PubMed] [Google Scholar]
- 2.Farid M, Demicco EG, Garcia R, Ahn L, Merola PR, Cioffi A, Maki RG. Malignant peripheral nerve sheath tumors. Oncologist. 2014;19:193–201. doi: 10.1634/theoncologist.2013-0328. [DOI] [PMC free article] [PubMed] [Google Scholar]
- 3.Evans DG, O’Hara C, Wilding A, Ingham SL, Howard E, Dawson J, Moran A, Scott-Kitching V, Holt F, Huson SM. Mortality in neurofibromatosis 1: in North West England: an assessment of actuarial survival in a region of the UK since 1989. Eur J Hum Genet. 2011;19:1187–1191. doi: 10.1038/ejhg.2011.113. [DOI] [PMC free article] [PubMed] [Google Scholar]
- 4.Zehou O, Fabre E, Zelek L, Sbidian E, Ortonne N, Banu E, Wolkenstein P, Valeyrie-Allanore L. Chemotherapy for the treatment of malignant peripheral nerve sheath tumors in neurofibromatosis 1: a 10-year institutional review. Orphanet J Rare Dis. 2013;8:127. doi: 10.1186/1750-1172-8-127. [DOI] [PMC free article] [PubMed] [Google Scholar]
- 5.Moretti VM, Crawford EA, Staddon AP, Lackman RD, Ogilvie CM. Early outcomes for malignant peripheral nerve sheath tumor treated with chemotherapy. Am J Clin Oncol. 2011;34:417–421. doi: 10.1097/COC.0b013e3181e9c08a. [DOI] [PubMed] [Google Scholar]
- 6.Bhatheja K, Field J. Schwann cells: origins and role in axonal maintenance and regeneration. Int J Biochem Cell Biol. 2006;38:1995–1999. doi: 10.1016/j.biocel.2006.05.007. [DOI] [PubMed] [Google Scholar]
- 7.Ratner N, Miller SJ. A RASopathy gene commonly mutated in cancer: the neurofibromatosis type 1 tumour suppressor. Nat Rev Cancer. 2015;15:290–301. doi: 10.1038/nrc3911. [DOI] [PMC free article] [PubMed] [Google Scholar]
- 8.Beert E, Brems H, Daniëls B, De Wever I, Van Calenbergh F, Schoenaers J, Debiec-Rychter M, Gevaert O, De Raedt T, Van Den Bruel A, de Ravel T, Cichowski K, Kluwe L, Mautner V, Sciot R, Legius E. Atypical neurofibromas in neurofibromatosis type 1 are premalignant tumors. Genes Chromosomes Cancer. 2011;50:1021–1032. doi: 10.1002/gcc.20921. [DOI] [PubMed] [Google Scholar]
- 9.Lee W, Teckie S, Wiesner T, Ran L, Prieto Granada CN, Lin M, Zhu S, Cao Z, Liang Y, Sboner A, Tap WD, Fletcher JA, Huberman KH, Qin LX, Viale A, Singer S, Zheng D, Berger MF, Chen Y, Antonescu CR, Chi P. PRC2 is recurrently inactivated through EED or SUZ12 loss in malignant peripheral nerve sheath tumors. Nat Genet. 2014;46:1227–1232. doi: 10.1038/ng.3095. [DOI] [PMC free article] [PubMed] [Google Scholar]
- 10.Zhang M, Wang Y, Jones S, Sausen M, McMahon K, Sharma R, Wang Q, Belzberg AJ, Chaichana K, Gallia GL, Gokaslan ZL, Riggins GJ, Wolinksy JP, Wood LD, Montgomery EA, Hruban RH, Kinzler KW, Papadopoulos N, Vogelstein B, Bettegowda C. Somatic mutations of SUZ12 in malignant peripheral nerve sheath tumors. Nat Genet. 2014;46:1170–1172. doi: 10.1038/ng.3116. [DOI] [PMC free article] [PubMed] [Google Scholar]
- 11.Staedtke V, Bai RY, Blakeley JO. Cancer of the peripheral nerve in neurofibromatosis type 1. Neurotherapeutics. 2017;14:298–306. doi: 10.1007/s13311-017-0518-y. [DOI] [PMC free article] [PubMed] [Google Scholar]
- 12.Shaw RJ, Paez JG, Curto M, Yaktine A, Pruitt WM, Saotome I, O’Bryan JP, Gupta V, Ratner N, Der CJ, Jacks T, McClatchey AI. The Nf2 tumor suppressor, Merlin, functions in Rac-dependent signalling. Dev Cell. 2001;1:63–72. doi: 10.1016/s1534-5807(01)00009-0. [DOI] [PubMed] [Google Scholar]
- 13.Xiao GH, Beeser A, Chernoff J, Testa JR. p21-activated kinase links Rac/Cdc42 signaling to merlin. J Biol Chem. 2002;277:883–886. doi: 10.1074/jbc.C100553200. [DOI] [PubMed] [Google Scholar]
- 14.Kissil JL, Wilker EW, Johnson KC, Eckman MS, Yaffe MB, Jacks T. Merlin, the product of the Nf2 tumor suppressor gene, is an inhibitor of the p21-activated kinase, Pak1. Mol Cell. 2003;12:841–849. doi: 10.1016/s1097-2765(03)00382-4. [DOI] [PubMed] [Google Scholar]
- 15.Zhan Y, Modi N, Stewart AM, Hieronimus RI, Liu J, Gutmann DH, Chadee DN. Regulation of mixed lineage kinase 3 is required for Neurofibromatosis-2-mediated growth suppression in human cancer. Oncogene. 2011;30:781–789. doi: 10.1038/onc.2010.453. [DOI] [PMC free article] [PubMed] [Google Scholar]
- 16.Yu J, Zheng Y, Dong J, Klusza S, Deng WM, Pan D. Kibra functions as a tumor suppressor protein that regulates Hippo signaling in conjunction with Merlin and expanded. Dev Cell. 2010;18:288–299. doi: 10.1016/j.devcel.2009.12.012. [DOI] [PMC free article] [PubMed] [Google Scholar]
- 17.Li W, Cooper J, Zhou L, Yang C, Erdjument-Bromage H, Zagzag D, Snuderl M, Ladanyi M, Hanemann CO, Zhou P, Karajannis MA, Giancotti FG. Merlin/NF2 loss-driven tumorigenesis linked to CRL4DCAF1-mediated inhibition of the hippo pathway kinases Lats1 and 2 in the nucleus. Cancer Cell. 2014;26:48–60. doi: 10.1016/j.ccr.2014.05.001. [DOI] [PMC free article] [PubMed] [Google Scholar]
- 18.White SM, Avantaggiati ML, Nemazanyy I, Di Poto C, Yang Y, Pende M, Gibney GT, Ressom HW, Field J, Atkins MB, Yi C. YAP/TAZ inhibition induces metabolic and signaling rewiring resulting in targetable vulnerabilities in NF2-deficient tumor cells. Dev Cell. 2019;49:425–443. doi: 10.1016/j.devcel.2019.04.014. [DOI] [PMC free article] [PubMed] [Google Scholar]
- 19.Lapenna S, Giordano A. Cell cycle kinases as therapeutic targets for cancer. Nat Rev Drug Discov. 2009;8:547–566. doi: 10.1038/nrd2907. [DOI] [PubMed] [Google Scholar]
- 20.Manfredi MG, Ecsedy JA, Chakravarty A, Silverman L, Zhang M, Hoar KM, Stroud SG, Chen W, Shinde V, Huck JJ, Wysong DR, Janowick DA, Hyer ML, LeRoy PJ, Gershman RE, Silva MD, Germanos MS, Bolen JB, Claiborne CF, Sells TB. Characterization of Alisertib (MLN8237), an investigational small-molecule inhibitor of aurora A kinase using novel in vivo pharmacodynamic assays. Clin Cancer Res. 2011;17:7614–7624. doi: 10.1158/1078-0432.CCR-11-1536. [DOI] [PubMed] [Google Scholar]
- 21.Patel AV, Eaves D, Jessen WJ, Rizvi TA, Ecsedy JA, Qian MG, Aronow BJ, Perentesis JP, Serra E, Cripe TP, Miller SJ, Ratner N. Ras-driven transcriptome analysis identifies aurora kinase A as a potential malignant peripheral nerve sheath tumor therapeutic target. Clin Cancer Res. 2012;18:5020–5030. doi: 10.1158/1078-0432.CCR-12-1072. [DOI] [PMC free article] [PubMed] [Google Scholar]
- 22.Luo J, Emanuele MJ, Li D, Creighton CJ, Schlabach MR, Westbrook TF, Wong KK, Elledge SJ. A genome-wide RNAi screen identifies multiple synthetic lethal interactions with the Ras oncogene. Cell. 2009;137:835–848. doi: 10.1016/j.cell.2009.05.006. [DOI] [PMC free article] [PubMed] [Google Scholar]
- 23.Macurek L, Lindqvist A, Lim D, Lampson MA, Klompmaker R, Freire R, Clouin C, Taylor SS, Yaffe MB, Medema RH. Polo-like kinase-1 is activated by aurora A to promote checkpoint recovery. Nature. 2008;455:119–123. doi: 10.1038/nature07185. [DOI] [PubMed] [Google Scholar]
- 24.Miller SJ, Rangwala F, Williams J, Ackerman P, Kong S, Jegga AG, Kaiser S, Aronow BJ, Frahm S, Kluwe L, Mautner V, Upadhyaya M, Muir D, Wallace M, Hagen J, Quelle DE, Watson MA, Perry A, Gutmann DH, Ratner N. Large-scale molecular comparison of human schwann cells to malignant peripheral nerve sheath tumor cell lines and tissues. Cancer Res. 2006;66:2584–2591. doi: 10.1158/0008-5472.CAN-05-3330. [DOI] [PubMed] [Google Scholar]
- 25.Hung G, Li X, Faudoa R, Xeu Z, Kluwe L, Rhim JS, Slattery W, Lim D. Establishment and characterization of a schwannoma cell line from a patient with neurofibromatosis 2. Int J Oncol. 2002;20:475–482. [PubMed] [Google Scholar]
- 26.Guo J, Grovola MR, Xie H, Coggins GE, Duggan P, Hasan R, Huang J, Lin DW, Song C, Witek GM, Berritt S, Schultz DC, Field J. Comprehensive pharmacological profiling of neurofibromatosis cell lines. Am J Cancer Res. 2017;7:923–934. [PMC free article] [PubMed] [Google Scholar]
- 27.Jessen WJ, Miller SJ, Jousma E, Wu J, Rizvi TA, Brundage ME, Eaves D, Widemann B, Kim MO, Dombi E, Sabo J, Hardiman Dudley A, Niwa-Kawakita M, Page GP, Giovannini M, Aronow BJ, Cripe TP, Ratner N. MEK inhibition exhibits efficacy in human and mouse neurofibromatosis tumors. J Clin Invest. 2013;123:340–347. doi: 10.1172/JCI60578. [DOI] [PMC free article] [PubMed] [Google Scholar]
- 28.Chou TC, Talalay P. Quantitative analysis of dose-effect relationships: the combined effects of multiple drugs or enzyme inhibitors. Adv Enzyme Regul. 1984;22:27–55. doi: 10.1016/0065-2571(84)90007-4. [DOI] [PubMed] [Google Scholar]
- 29.Rudolph D, Steegmaier M, Hoffmann M, Grauert M, Baum A, Quant J, Haslinger C, Garin-Chesa P, Adolf GR. BI 6727, a Polo-like kinase inhibitor with improved pharmacokinetic profile and broad antitumor activity. Clin Cancer Res. 2009;15:3094–3102. doi: 10.1158/1078-0432.CCR-08-2445. [DOI] [PubMed] [Google Scholar]
- 30.Kolberg M, Bruun J, Murumägi A, Mpindi J P, Bergsland CH, Høland M, Eilertsen IA, Danielsen SA, Kallioniemi O, Lothe RA. Drug sensitivity and resistance testing identifies PLK1 inhibitors and gemcitabine as potent drugs for malignant peripheral nerve sheath tumors. Mol Oncol. 2017;11:1156–1171. doi: 10.1002/1878-0261.12086. [DOI] [PMC free article] [PubMed] [Google Scholar]
- 31.Olmos D, Barker D, Sharma R, Brunetto AT, Yap TA, Taegtmeyer AB, Barriuso J, Medani H, Degenhardt YY, Allred AJ, Smith DA, Murray SC, Lampkin TA, Dar MM, Wilson R, de Bono JS, Blagden SP. Phase I study of GSK461364, a specific and competitive Polo-like kinase 1 inhibitor, in patients with advanced solid malignancies. Clin Cancer Res. 2011;17:3420–3430. doi: 10.1158/1078-0432.CCR-10-2946. [DOI] [PubMed] [Google Scholar]
- 32.Schoffski P, Awada A, Dumez H, Gil T, Bartholomeus S, Wolter P, Taton M, Fritsch H, Glomb P, Munzert G. A phase I, dose-escalation study of the novel Polo-like kinase inhibitor volasertib (BI 6727) in patients with advanced solid tumours. Eur J Cancer. 2012;48:179–186. doi: 10.1016/j.ejca.2011.11.001. [DOI] [PubMed] [Google Scholar]
- 33.Gutteridge RE, Ndiaye MA, Liu X, Ahmad N. Plk1 inhibitors in cancer therapy: from laboratory to clinics. Mol Cancer Ther. 2016;15:1427–1435. doi: 10.1158/1535-7163.MCT-15-0897. [DOI] [PMC free article] [PubMed] [Google Scholar]
- 34.Dickson MA, Mahoney MR, Tap WD, D’Angelo SP, Keohan ML, Van Tine BA, Agulnik M, Horvath LE, Nair JS, Schwartz GK. Phase II study of MLN8237 (Alisertib) in advanced/metastatic sarcoma. Ann Oncol. 2016;27:1855–1860. doi: 10.1093/annonc/mdw281. [DOI] [PMC free article] [PubMed] [Google Scholar]
- 35.Dombi E, Baldwin A, Marcus LJ, Fisher MJ, Weiss B, Kim A, Whitcomb P, Martin S, Aschbacher-Smith LE, Rizvi TA, Wu J, Ershler R, Wolters P, Therrien J, Glod J, Belasco JB, Schorry E, Brofferio A, Starosta AJ, Gillespie A, Doyle AL, Ratner N, Widemann BC. Activity of selumetinib in neurofibromatosis type 1-related plexiform neurofibromas. N Engl J Med. 2016;375:2550–2560. doi: 10.1056/NEJMoa1605943. [DOI] [PMC free article] [PubMed] [Google Scholar]
- 36.De Raedt T, Beert E, Pasmant E, Luscan A, Brems H, Ortonne N, Helin K, Hornick JL, Mautner V, Kehrer-Sawatzki H, Clapp W, Bradner J, Vidaud M, Upadhyaya M, Legius E, Cichowski K. PRC2 loss amplifies Ras-driven transcription and confers sensitivity to BRD4-based therapies. Nature. 2014;514:247–251. doi: 10.1038/nature13561. [DOI] [PubMed] [Google Scholar]
Associated Data
This section collects any data citations, data availability statements, or supplementary materials included in this article.


