Abstract
Fluorite-type Zr-based oxides with the composition Ga2Zr2−xWxO7 (x = 0, 0.05, 0.1, 0.15 and 0.2) were prepared using the citrate technique. Appropriate characterizations of all prepared materials were carried out. X-ray diffraction clarified that the undoped and W-doped Ga2Zr2O7 samples were crystallized in the cubic fluorite phase structure. The average particle size of the samples was in the range of 3–8 nm. The lowest band gap (1.7 eV) and the highest surface area (124.3 m2 g−1) were recorded for Ga2Zr0.85W0.15O7. The photocatalytic impacts of the prepared systems were studied by removal of crystal violet (CV) dye employing visible light illumination and taking into consideration the initial dye concentrations, duration of visible irradiation treatment, catalysts dose and the dopant concentration. The obtained results showed higher dye removal with the boost of the catalyst dosage. W doping shifted the absorption to the visible light range by decreasing the band gap from 4.95 eV for parent Ga2Zr2O7 to 1.7 eV for 15 mol% tungsten-doped Ga2Zr2O7 enhancing the photocatalytic decolourization of CV from 4.2% to 83.6% for undoped and 15 mol% W-doped Ga2Zr2O7, respectively, at optimum operating conditions (pH 9, 1 g l−1 catalyst dose and 300 min) while heavily doped W sample containing 20 mol% W showed lower removal than 15 mol% W-doped Ga2Zr2O7. Complete CV degradation using 15 mol% W-doped Ga2Zr2O7 was attained with the assistance of 25 mmol l−1 hydrogen peroxide. The reaction is aligned to pseudo-first-order kinetics. Different scavengers were introduced to decide the significance of the reactive species in CV degradation. and h+ had the major role in the degradation of CV by Ga2Zr2−xWxO7 system compared with HO•.
Keywords: Ga2Zr2−xWxO7, fluorite phase, wastewater treatment, nanomaterials, crystal violet dye, photocatalytic degradation
1. Introduction
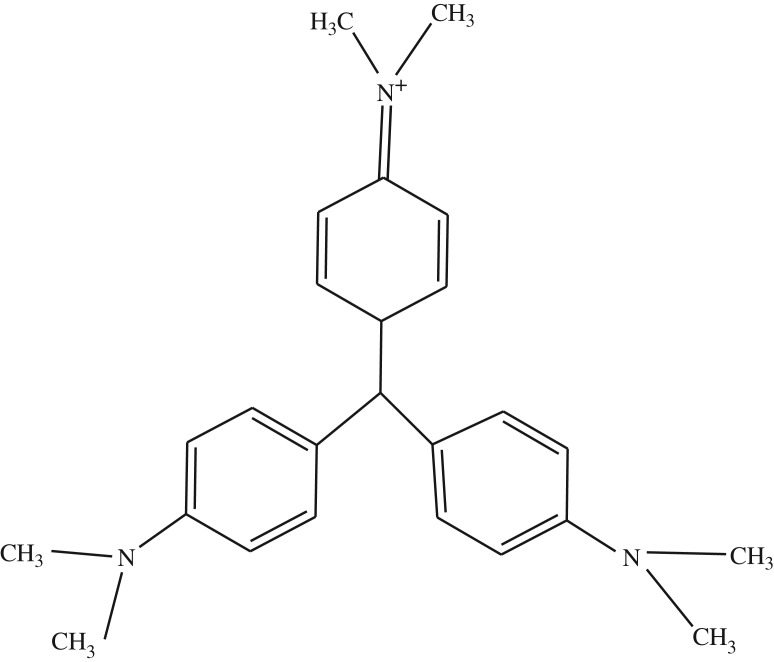
Crystal violet (CV) dye is triphenylmethane cationic dye (figure 1). It is used in textile and paper dye industries as well as navy blue and black inks for printing, ball-point pens and inkjet printers. It is also used to colourize diverse products such as fertilizers, antifreeze, detergents and leather. CV is also used as a histological stain, particularly in Gram staining for classifying bacteria [1,2].
Figure 1.
Chemical structure of crystal violet.
Disposal of dyes in wastewater is a source of water contamination and disturbance of aquatic life [3]. Therefore, a suitable and efficient method is critically required to treat the wastewater containing dyes such as CV [4,5] for its proven carcinogenic and mutagenic properties in animals [6,7] and in humans [8].
Conventional techniques such as biodegradation, coagulation, adsorption, physical deposition conventional oxidants and coagulants were inefficient for CV treatment [9,10]. On the other hand, advanced oxidation processes (AOPs) such as microwave catalysis, photocatalysis, membrane technique and advanced oxidants [11–13] are promising in CV decolourization.
The essential defect of physical treatment involves only moving the dyes from the liquid to the solid state which is not easy to decontaminate [14]. Therefore, chemical treatment using AOPs, especially the heterogeneous photocatalysis, received attention for degrading such pollutants [15]. In heterogeneous AOPs, the metal oxides produce some powerful non-selective hydroxyl radicals (HO•) that dissociate a wide range of organic contaminants [16] into short-chain aliphatic acid that is easier to be completely degraded [17]. In the UV–visible light, the electron–hole pair mechanism is demanded in order to introduce intermediate organic compounds that might be completely mineralized at the surface of metal oxides attaining green end products [17]. From the economic side, novel nano-sized photocatalysts' response to visible light received valuable consideration since it is cost-effective compared with UV light [18–20].
Decolourization of CV has been studied using different oxidants such as nanosphere TiO2 [20], Mn-doped and PVP-capped ZnO NPs [21], Ag-modified Ti-doped-Bi2O3 [22], ZnS NPS [23], CeO2–TiO2 nanocomposite [24], AgBr–ZnO nanocomposite [25], grafted sodium alginate/ZnO/graphene oxide [26]. Afterwards, the performance of the prementioned oxides will be compared with the results of the present study.
A2B2O7 oxides (where A and B abbreviate trivalent lanthanides elements and tetravalent D and F groups elements, respectively) have either a pyrochlore-type or a defect fluorite-type structure. They have attractive physical and chemical properties, such as high melting point, high thermal expansion coefficient, low thermal conductivity, high thermal stability, high radiation stability and high electrical conductivity. Consequently, they are used in several applications such as solid electrolytes, thermal barrier coating materials, nuclear waste host materials and high-temperature heating elements [27]. The electrical properties of the pyrochlores vary from highly insulating through semiconducting to metallic behaviour [28]. Many studies prepared various pyrochlore metal oxides such as La2Zr2O7 (that acts as thermal barrier coating), [29] Y2Sn2O7 (that acts as excellent host matrices for photoluminescence) [30] and Gd2Zr2O7 (that acts as a proper host material for fixation of some of the nuclear waste products) [31]. Several pyrochlore-type oxides such as K2Ta2O6 [32], Na2Ta2O6 [33], Pb2Sn2O6 [34], KAl0.33W1.67O6 [35], Ag/Sn-doped KSbTeO6 [36], Ag/Sn-doped KSbTeO6 [37], Na2Ta2O6 [38] and ASbO3 [39] were used for the decolourization of dyes such as acid red G, Congo red, methyl orange, methylene blue and rhodamine B. The luminescence properties of Ln2Ce2O7 fluorite-type is also studied [40]. There is a deficiency in the literature regarding the preparation of fluorite-type structure for various applications. Besides, the photocatalytic activity of Ga2Zr2−xWxO7 fluorite-type system for CV degradation has not been reported yet. In this frame, the present work aims to prepare and characterize nano-sized Ga2Zr2−xWxO7 fluorite-type system using a reliable, cost-effective, eco-friendly and easy method to optimize the shape and grain size of the nano-sized metal oxides (the Pechini method [41]). Tungsten as a dopant is selected due to the difference in the oxidation state and ionic radii of W6+ and Zr4+ that will permit studying the impact of doping on both the structural and photocatalytic activity of Ga2Zr2O7. Furthermore, W is used for the reduction of the band gap in order to use Ga2Zr2−xWxO7 system in visible light irradiation. Finally, the photocatalytic activity has been studied for the prepared systems in CV dye removal in visible light and the reaction operation conditions were adopted (reaction time, pH, catalyst dose and initial pollutant concentrations).
2. Experimental
2.1. Preparation and characterization of the prepared materials
Ga2Zr2−xWxO7 system was prepared; where x = 0, 0.05, 0.1, 0.15 and 0.2 using the citrate technique (Pechini method) which is a wet-chemical method based on polymeric precursor [41] that was used to prepare several metal oxides [42–46].
In this method, α-hydroxy acid (citric acid) is used to chelate the cations forming a polybasic acid. Polyhydroxy alcohol (ethylene glycol) reacts with these chelates forming ester and water. Heating the mixture leads to polyesterification and after the evolution of nitrous oxide and water, the gel is obtained. The thermal decomposition of this gel results in a chemically homogeneous powder containing the desired stoichiometry [42,43].
Zirconium (IV) oxynitrate hydrate (Sigma-Aldrich), tungsten (VI) chloride (Sigma-Aldrich), gallium (III) nitrate (Silverton, San Diego), ethylene glycol (Sandycroft, Deeside, Clwyd) and citric acid anhydrous extra pure (LobaChemie) are used as starting materials. All chemicals were reagent grade and used as received without any modification.
Ga2Zr2O7 was prepared using the Pechini method as follows: aqueous zirconium oxynitrate and gallium nitrate solutions were mixed, considering the desired stoichiometry of the metal oxides in the final ceramic powder solution (A). The citric acid (CA) was then added to the solution (A) to chelate metal cations at the CA : Me molar ratio of 4 : 1. Me denotes Ga3+, Zr4+ in the final ceramic powder. After dissolving the CA, ethylene glycol (EG) was added into the solution at a CA : EG molar ratio of 1 : 1.5. The solution was then heated at 140°C and kept under stirring to promote the esterification and polymerization reactions. After elimination of nitrous oxides and water, a gel was obtained. The gel was charred gradually up to 300°C then heated in the muffle furnace at 300°C for 2 h. The charred gel thus produced was ground and calcined for 2 h at 500°C, then ground and calcined for 2 h at 600°C. Ga2Zr2−xWxO7 systems where x = 0.05, 0.1, 0.15 and 0.2 were prepared using the same sequence. For the preparation of Ga2Zr2−xWxO7 samples, tungsten chloride was dissolved in ethanol and then added to the solution (A). Flowchart of the preparation of Ga2Zr2O7 powder is presented in the electronic supplementary material, S.1. The samples' identification, as well as their composition, are presented in table 1.
Table 1.
The composition determined by ICP compared to the expected composition of the prepared samples.
| sample | sample compositions | expected (wt%) |
experimental (wt%) |
||||
|---|---|---|---|---|---|---|---|
| Ga | Zr | W | Ga | Zr | W | ||
| ZG | Ga2Zr2O7 | 32.14 | 42.05 | 0 | 32.26 | 42.13 | 0 |
| ZGW1 | Ga2Zr1.95W0.05O7 | 31.80 | 40.57 | 2.10 | 32.91 | 40.43 | 2.13 |
| ZGW2 | Ga2Zr1.9W0.1O7 | 31.48 | 39.11 | 4.15 | 31.39 | 39.18 | 4.18 |
| ZGW3 | Ga2Zr1.85W0.15O7 | 31.14 | 37.69 | 6.16 | 31.19 | 37.63 | 6.20 |
| ZGW4 | Ga2Zr1.80W0.2O7 | 30.82 | 36.30 | 8.13 | 30.77 | 36.37 | 8.15 |
X-ray diffraction (XRD) is the standard technique for determination of the crystal structure of a solid. XRD is used to identify the crystal structure, to determine the lattice parameters. The XRD measurements were carried out using 7000 Shimadzo (Japan) 2 kW model X-ray spectrophotometer with a nickel-filtered Cu radiation (CuKα) with λ = 1.54056 Å. The scanning 2θ range was 5–80 with a step size of 0.2. The lattice parameters were determined using a program called UnitCellWin [47]. FTIR spectra were recorded in the frequency range 400–4000 cm−1 with a resolution of 4 cm−1 using FTIR 6100 Jasco (Japan) spectrum equipment.
Diffuse reflectance measurements were performed to study the optical properties of the prepared samples using Shimadzu UV-3600 (Japan). The free radicals created (EPR signals) were recorded at room temperature by X-band EMX spectrometer (Bruker, Germany) using a standard rectangular cavity of ER 4102 operating at 100 kHz field modulation. The microstructures were studied by transmission electron microscope (TEM, JEOL JEM2100, Japan). The specific surface area of the prepared samples was determined by NOVA surface area analyser from Thermo Pascal 140 mercury porosimetry under a pressure range of 0.1–200 MPa. Mercury surface tension of 480 dyne cm−1 and the contact angle of 141.3° were used. Elemental analysis was carried out using inductive coupled plasma-atomic spectrometry (Agilent ICP-OES).
2.2. Photodegradation activity
CV was obtained from Sigma-Aldrich Chemical Company. All solutions were prepared in double-distilled water. Photocatalytic experiments were carried out with CV dye solution using all the prepared catalysts under visible irradiation. Irradiation was carried out by commercial visible metal halide lamp (HQI-T250/Daylight, OSRAM GmbH, Germany) with a luminous efficacy of 82 lm W−1 and luminous flux of irradiation 20 000 lm.
A stirred slurry composed of dye solution and catalyst was placed in the dark for 30 min in order to establish equilibrium between adsorption and desorption phenomenon of dye molecule on the photocatalyst surface. Then the lamp was turned on and the slurry was magnetically stirred for homogeneous distribution of catalyst in the solution. At specific time intervals, an aliquot (5 ml) was collected and centrifuged for 2 min at 3500 r.p.m. to remove catalyst particles from aliquot to assess the extent of decolourization. The absorption spectra recorded 588 nm as λmax on the double-beam UV–visible spectrophotometer (Cary-100). The desired pH of the solution was adjusted by the addition of previously standardized 0.050 M H2SO4 and 1.0 M NaOH solutions. Performance efficiency was calculated as
| 2.1 |
where C and Co are initial and final dye concentration, respectively, for reaction time t.
2.3. Evaluation of active species
To check the influence of some active species on the catalytic activity of catalyst trapping experiments were carried out for difference species. In these experiments, 1 mmol l−1 of three scavengers were used which are isopropyl alcohol (IPA), ethylene diamine tetra acetic acid (EDTA) and benzoquinone for HO•, h+ and O2• species, respectively.
3. Results and discussion
3.1. Characterization of the prepared materials
The crystallization of pyrochlore or fluorite phases for the mixed oxides A2B2O7 depends on the radius ratio of A and B cations (rA/rB) in addition to the conditions of samples processing [48–50]. A2B2O7 crystallizes in the stable pyrochlore structure when the rA/rB is in the range of 1.46–1.78 [51] depending on the coordination number. The defect fluorite structure (cubic, Fm3m) is obtained for the lower or upper limits of the previously mentioned range of rA/rB. In the present study, the radius ratio rA/rB for A = Ga3+ (ionic radius = 62 pm) and B = Zr4+ (ionic radius = 72 pm [52]) ions was found to be 0.85 which is lower than the above-mentioned range. In this frame, it is predicted that Ga2Zr2O7 will be crystallized in the fluorite structure. This is confirmed by the XRD pattern of Ga2Zr2O7 (ZG sample) calcined at 600°C for 2 h (figure 2) where ZG sample has the cubic fluorite phase structure (PDF 78–1299 for Er0.5Zr0.5O1.75, which is the best-matched card that can be used where there is no card for the novel Ga2Zr2O7 material). The shift to lower 2θ value is due to the difference in the ionic radius between Er3+ (ionic radius = 89 pm [52]) and Ga3+ (ionic radius = 62 pm [52]) ions. The peaks at about 14°, 28°, 37°, 45° 2θ corresponding to (1 1 1), (3 1 1), (3 3 1), (5 1 1) planes [53], respectively, characteristic for the pyrochlore structure, do not exist. Accordingly, ZGW1, ZGW2 and ZGW3 samples have the cubic fluorite phase structure (figure 2). Traces of cubic fluorite phase structure were detected for ZGW4 sample, which means that this sample may need further calcination in order to improve its crystallinity, which is not in alliance with the calcination temperature of all the prepared samples in the manuscript.
Figure 2.
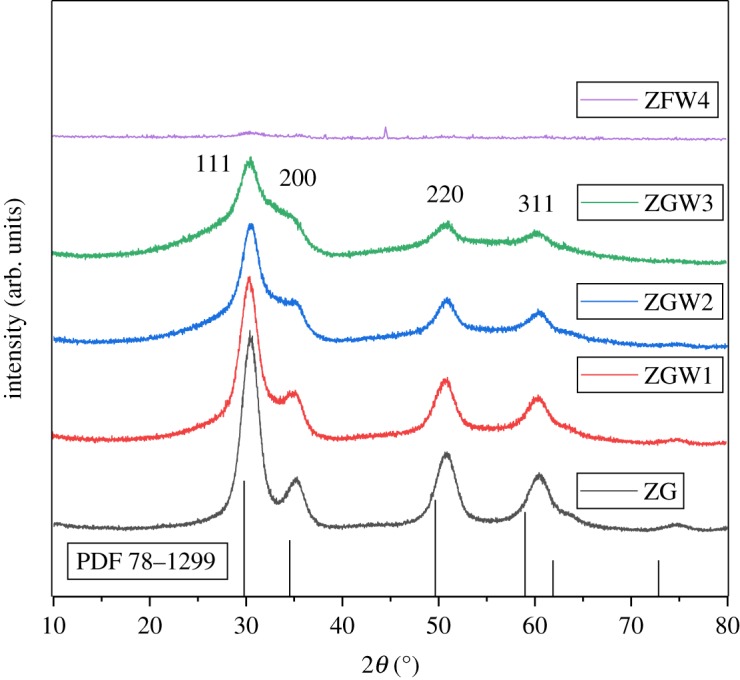
Powder X-ray diffraction pattern of Ga2Zr2−xWxO7 system calcined at 600°C/2 h (x = 0, 0.05, 0.1, 0.15 and 0.2).
According to the ionic radius of Zr4+ (ionic radius = 72 pm [52]) and W5+ (ionic radius = 62 pm [52]) or W6+ (ionic radius = 60 pm [52]) ions, it is predicted that the cubic lattice parameter and unit cell volume will decrease as the W concentration increases because ionic radius of W5,6+ ion is less than that of Zr4+ and also Ga3+ ions. Surprisingly, it was found that as the W concentration raised, the cubic lattice parameter and unit cell volume are increased (table 2). This might be attributed to the substitution of Zr4+ ions by W5,6+ ions creating a distorted coordination environment and leading to unit cell expansion [54].
Table 2.
Microstructural parameters, the estimated band gap from DRS, the TEM particle size range and surface area for Ga2Zr2−xWxO7 system.
| sample | a (Å) | V (Å3) | TEM particle size range (nm) | band gap (eV) | surface area m2 g−1 |
|---|---|---|---|---|---|
| ZG | 5.08693 | 131.6337 | 4–7 | 4.95 | 91.3 |
| ZGW1 | 5.08706 | 131.6437 | 4–8 | 3.88 | 96.5 |
| ZGW2 | 5.08824 | 131.7358 | 3–5 | 1.81 | 99.9 |
| ZGW3 | 5.09405 | 132.1876 | 3–4 | 1.7 | 124.3 |
| ZGW4 | — | — | — | 2.66 | 90 |
ICP was used to determine the chemical composition of the prepared materials by determining the wt% of Zr, Ga and W in all the prepared samples. The experimental wt% of Zr, Ga and W in all the prepared samples were in alliance with those of the expected wt% (table 1) indicating that the prepared materials have the exact proposed chemical compositions shown for ZG, ZGW1, ZGW2, ZGW3 and ZGW4.
The FTIR spectra of the prepared samples are shown in figure 3. For the parent ZG sample, the broad absorption peak at about 3422 cm−1 is due to the stretching vibration of OH group in water molecule. The absorption band at about 1634 cm−1 is characteristic to the bending vibration of the water molecules [55]. The band at about 460 cm−1 is due to Zr–O vibration [56]. The peaks at 1040 and 1080 cm−1 might be associated with stretching vibrations of Zr–O terminals [57]. The peak at about 880 cm−1 corresponds to the bending vibration of hydroxyl groups bounds to zirconium oxide [55]. The bands at about 510 and 620 cm−1 are assigned to Ga–O stretching and Ga–O–Ga torsion movements [58]. For the doped samples (ZGW1, ZGW2, ZGW3 and ZGW4), a little shift in the peak positions and peak intensities were observed with the increasing in the W concentration. The region 600–900 cm−1 might correspond to O–W–O stretching modes [59]. The peak at about 620 cm−1 is assigned to W–Ointer–W bridging vibration of the corner-sharing WO6 octahedron [60].
Figure 3.
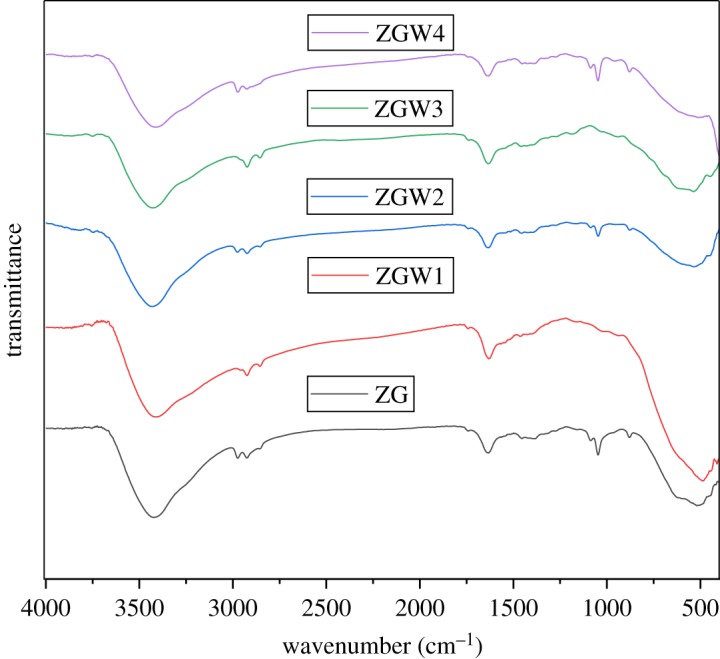
FTIR spectra of Ga2Zr2−xWxO7 system where x = 0, 0.05, 0.1, 0.15 and 0.2.
Diffuse reflectance spectroscopy (DRS) was used to determine the system optical properties. The absorption edge of ZG sample is about 247 nm. As shown in figure 4, W doping (till 15 mol%, ZGW3 sample) shifted the absorption to the visible light range (red shift). For ZGW4 sample (Ga2Zr0.18W0.2O7) the tungsten doping shifted the absorption to lower wavelength. The band gap is a very important parameter for the photocatalytic performance of the photocatalyst where it indicates the range at which the photocatalyst will be active (UV–visible light ranges).
Figure 4.
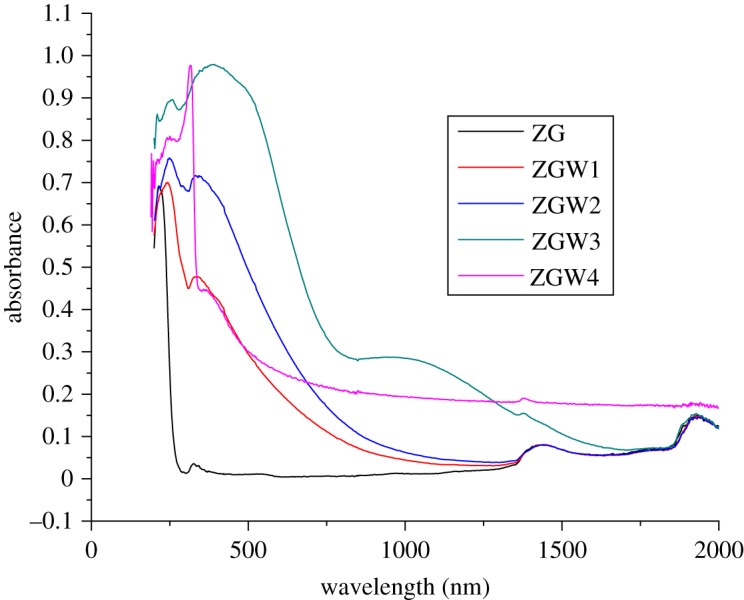
The diffuse reflectance spectra of ZG, ZGW1, ZGW2, ZGW3 and ZGW4 samples.
The Kubelka–Munk function F(R) is correlated to the diffuse reflectance R according to the following equation:
| 3.1 |
Figure 5 shows the plots of F(R∞)E)1/2 versus photo energy for the estimation of the band gap energy for ZG, ZGW1, ZGW2, ZGW3 and ZGW4 samples. The band gap value was determined by drawing (F(R).hʋ)1/2 against photo energy and extrapolating the linear part of the curve to (F(R).hʋ)1/2 = 0 according to Kubelka–Munk using linear fit [61] (electronic supplementary material, S.2).
Figure 5.
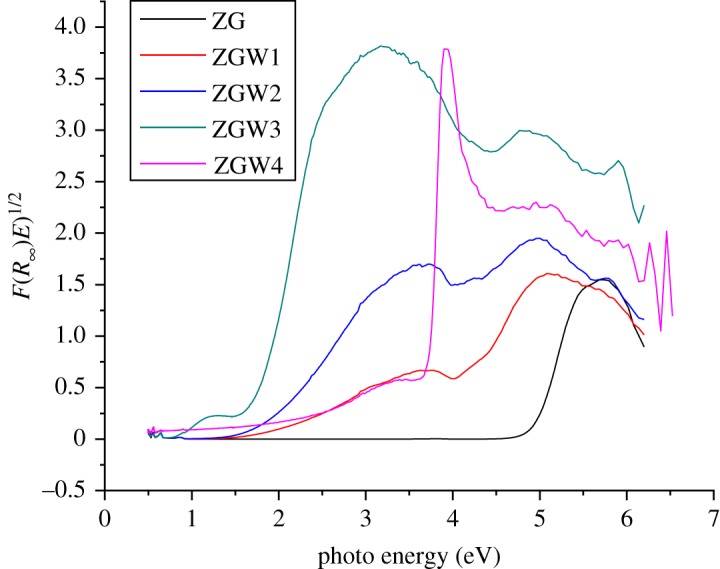
The plots of F(R∞)E)1/2 versus photo energy for the estimation of the band gap energy for ZG, ZGW1, ZGW2, ZGW3 and ZGW4 samples.
Table 2 shows that the band gap of ZG is 4.98 eV. The band gap is decreased from 3.88 to 1.7 by increasing the W concentration from 5 to 15 mol% while at 20 mol% W, the band gap increased again to be 2.66 eV.
For the understudied novel Ga2Zr2−xWxO7 system, the band gap of Ga2Zr2O7 (4.95 eV) is closer to that of ZrO2 (5 eV) [62] which renders its absorption of visible light accordingly, it is predicted to have a limited photocatalytic activity under visible light. The band gaps of ZGW2 and ZGW3 samples are smaller than that of ZrO2 [63], Sm2Zr2O7 (2.86 eV) [63] and Nd2Zr2O7 (2.67 eV) [63]. The band gap of ZGW4 sample is similar to that of Nd2Zr2O7.
For Ga2Zr2−xWxO7 system in this study, the conduction band (CB) is composed of Zr 4d orbitals whereas the valence band (VB) consists of the O 2p bands.
Electron paramagnetic resonance (EPR) is one of the most important tools used to describe the defects in solids because most of the defects contain unpaired electrons. Intrinsic or extrinsic point defects exist in solids. The intrinsic defects are present in the solid itself without introducing any impurity; when chemical impurity is introduced, the extrinsic defects are produced. Recently, the impurities (dopants) have been used in photocatalysis to modulate the optical properties to improve the photocatalytic performance of the catalyst [64]. EPR spectra for the prepared samples are presented in figure 6, where no EPR spectra are detected for the undoped Ga2Zr2O7 (ZG) sample. For W-doped samples (ZGW1, ZGW2, ZGW3 and ZGW4 samples), an EPR signal is detected. For W-doped samples, Zr4+ ion is substituted by W5+,6+ ion which results in the creation of free electrons for electroneutrality, these electrons are trapped to Zr4+ ion forming Zr3+ ion which corresponds to the detected EPR signal [65]. No signals were detected for the oxygen vacancy. Table 3 shows the spin number (free radicals) for the prepared samples. As the W concentration increases, the spin number increases up to 15 mol% W (ZGW3 sample) and for 20 mol% sample (ZGW4 sample) the spin number decreases which is in accordance with DRS results. DRS results demonstrated that, Zr3+ point defect might introduce a new energy level between the CB and the VB resulting in decreasing the band gap with increasing the W concentration up to 15 mol% W (ZGW3 sample). Increasing the band gap from 1.7 eV for ZFW3 sample to 2.66 eV for heavily doped ZGW4 sample might be due to the donor electrons of W filling the lowest level of the CB (the Burstein–Moss effect) [66]. The schematic energy level diagram for the prepared Ga2Zr2−xWxO7 system and its corresponding charge separation towards dye degradation under visible light illumination is presented in electronic supplementary material, S.3.
Figure 6.
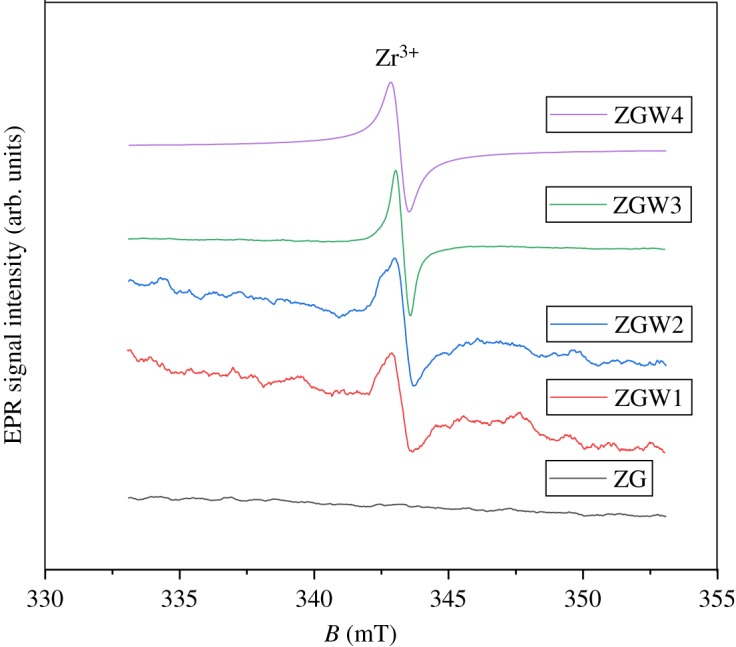
EPR spectra for ZG, ZGW1, ZGW2, ZGW3 and ZGW4 samples.
Table 3.
The spin numbers for the prepared samples.
| sample | spin numbers |
|---|---|
| ZG | 0 |
| ZGW1 | 4.83 × 10¹⁶ |
| ZGW2 | 4.33 ×10¹⁷ |
| ZGW3 | 1.89 ×10¹⁸ |
| ZGW4 | 1.25 × 10¹⁷ |
The TEM micrographs of samples are presented in the electronic supplementary material, S.4, S.5. Small quasi-spherical particles, which agglomerate into denser aggregates were observed. The TEM particle size range for all samples is presented in table 2. The lattice fringes with an interplanar distance of 0.25 nm which could be assigned to (2 0 0) plane were detected for the cubic phase of Ga2Zr2O7 for ZGW3 sample (electronic supplementary material, S.6).
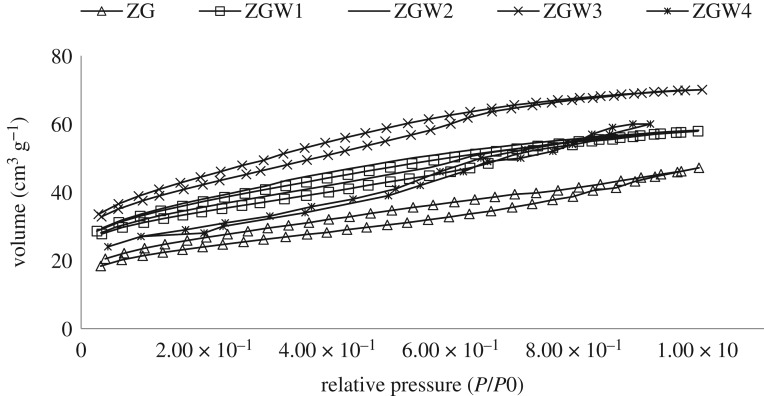
To manifest the surface area of the prepared oxides, the Barrett–Joyner–Halenda (BJH) nitrogen adsorption tests were used (figure 7). A type-IV isotherm demonstrates the typical mesopore materials that are related to aggregates presented in mesopores, and the little-marked uptake over a range of high P/Po [61,67]. Specific surface areas were significantly increased with the increment of tungsten concentration in the order of 91.3, 96.51, 99.9 and 124.3 m2 g−1 for ZG, ZGW1, ZGW2 and ZGW3 samples, respectively, and decreased to be 90 m2 g−1 for ZGW4 sample.
Figure 7.
N2 adsorption and desorption isotherms for prepared materials sample.
3.2. Photocatalytic activity of Ga2Zr2−xWxO7 system
3.2.1. Degradation time influence
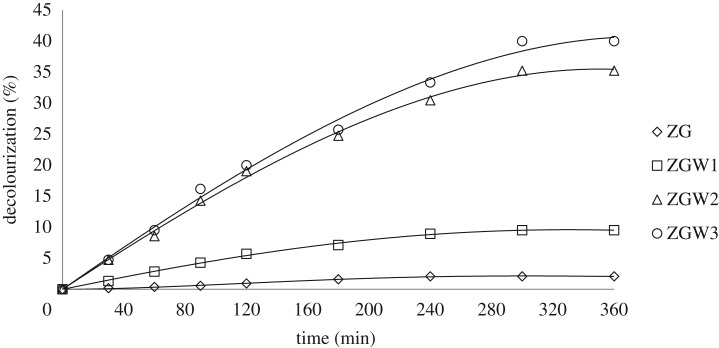
Figure 8 demonstrates the influence of reaction time on photodegradation of CV by using Ga2Zr2−xWxO7 system under visible irradiation for 6 h. The degradation rate was increased with the increment of time till 5 h then it became stable after that, concluding that 5 h is the optimum reaction time. The decolourization % of CV dye after 5 h was recorded 2.1%, 9.5%, 35.23% and 40% for ZG, ZGW1, ZGW2 and ZGW3, respectively, at initial CV concentration of 10 mg l−1 at pH 7 and 0.75 g l−1 catalyst dose. Concluding that the order of photocatalytic activity was in accordance with the reduction in their band gaps (table 2).
Figure 8.
Photocatalytic degradation of 10 mg l−1 CV under visible light by 0.75 g l−1 of all the prepared materials as a function of time at pH 7.
Moreover, O2 and HO groups on the surface were converted to and HO•, respectively. Both of them can assist in CV degradation in the following equations:
| 3.2 |
| 3.3 |
| 3.4 |
| 3.5 |
| 3.6 |
| 3.7 |
3.2.2. Catalyst load impact
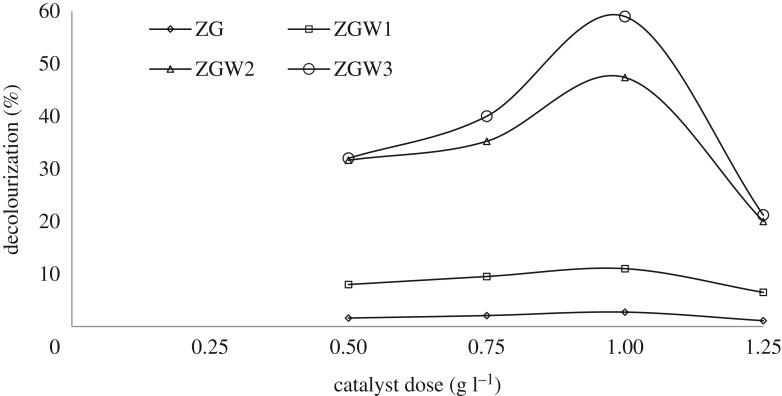
The degradation of 10 mg l−1 CV at optimum reaction time (5 h) and neutral pH were studied at different catalysts loads (0.5–1.25 g l−1).
Figure 9 displays the direct relation between the % decolourization and the catalyst's loads for both undoped and W-doped GZ catalysts up to 1 g l−1 due to intense numbers of catalytically active sites by increasing of catalysts load [68], that raises the rate of and HO• creation [19]. Reduction of decolourization rate after 1 g l−1 was noted and was owed to the excess catalyst amount impedes the light penetration [20,68,69]. Accordingly, 1 g l−1 was elected as the optimum dose for CV degradation.
Figure 9.
Photocatalytic decolourization under visible light for all the prepared materials as a function of catalysts dose (CV concentration 10 mg l−1 at pH 7).
3.2.3. Influence of pH
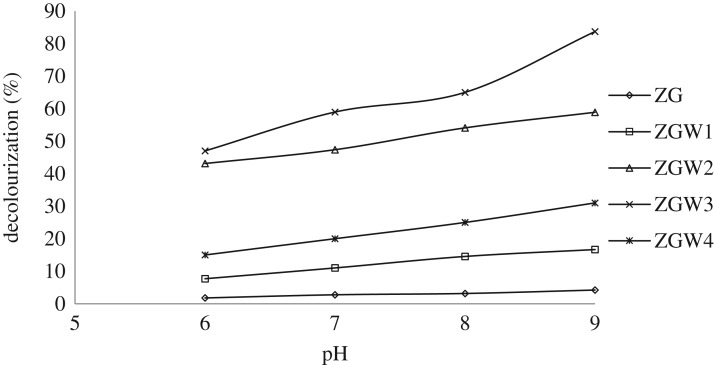
Different pH values (6–9) under pre-optimized time and catalyst load were employed to decolourize 10 mg l−1 CV. The % decolourization was directly proportional to pH value up to pH 9 with % decolourization of 4.2%, 16.6%, 58.88%, 83.7% and 31.2% for GZ, GZW1, GZW2, GZW3 and ZGW4, respectively (figure 10). In acidic medium, very low photodegradations of CV were spotted due to its hard deposition on the catalyst surface [70–73]. On the other hand, in alkaline medium, the amount of hydroxide ions increased and their availability to be converted to HO• increased leading to an acceleration of the degradation rate [72].
Figure 10.
Photocatalytic degradation under visible light for all the prepared materials as a function of pH (CV concentration 10 mg l−1 at 1 g l−1 catalyst dose).
Additionally, the impact of pH 10–pH 12 on dye decolourization were examined but not taken into consideration because at pH > 9, a colourless CV molecule occurred without illumination [73]. Consequently, pH 9 was elected to be the optimum pH.
3.2.4. Effect of doping on the photocatalytic performance
The effect of W doping was explained in several parts in the manuscript including XRD, DRS, EPR as well as the photocatalytic efficiency. The positive role of doping for certain concentration might be attributed to (i) formation of new energy levels between the VB and the CB; these levels act as effective charge carrier traps, and (ii) improving the adsorption of the molecules of the pollutant on the surface of the catalyst by altering the catalyst surface acid–base properties [74]. For the prepared samples, the photocatalytic degradation of CV increases as W concentration increases, as shown in figure 10, which is in accordance with their band gap values in the DRS part. ZGW3 sample has high CV removal compared with the undoped ZG sample. This might be attributed to the substitution of Zr4+ by W5+,6+ in the Ga2Zr2O7 lattice, which is reflected in the cubic lattice parameter and unit cell volume values for ZG and ZGW3 sample and introduction of new Zr3+ level between the VB and the CB of Ga2Zr2O7 (electronic supplementary material, S.3), decreasing the band gap as well as increasing the spin numbers detected by EPR. After visible light illumination, the electron is promoted from the VB to the CB through the Zr3+ level and the hole is formed. The electron and hole react with the adsorbed oxygen and hydrogen peroxide forming and HO• which are responsible for CV photodegradation [75]. For the highly W-doped sample (ZGW4), the decrease of the photocatalytic degradation of CV as compared with the other W-doped samples might be due to filling of the lowest level of CB by W donor electrons [66] which is matched with the band gap values calculated by DRS.
3.2.5. Effect of H2O2
Hydrogen peroxide is counted as one of the most fundamental photo-oxidants in water decontamination, hydrogen peroxide is used in the visible radiation to assess HO• radicals generation, which is the essential promoter for the destruction of toxic organic compounds as represented in the following equation [76]:
| 3.8 |
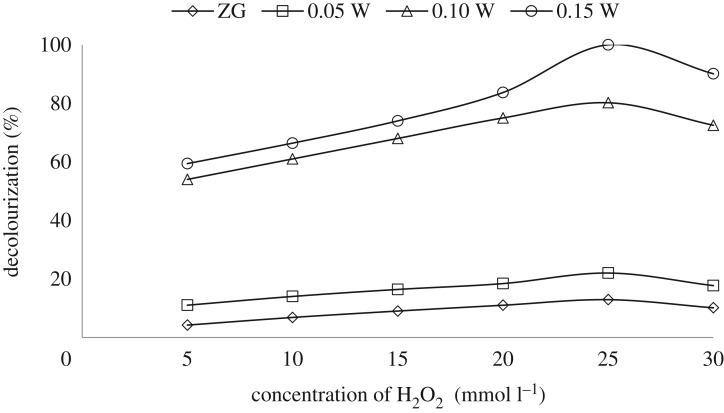
H2O2 doses of 0–30 mmol l−1 were used to study the effect of H2O2 on % decolourization of 10 ppm CV at pH 9 by 1 g l−1 catalyst as presented in figure 11. Increasing H2O2 dose from 0 to 25 mmol l−1 is directly proportional to the % CV degradation attaining complete degradation for ZGW3 after 5 h due to the increase in the amount of HO• promoting the degradation rate. Further addition of H2O2 to 30 mmol l−1 decreased the % decolourization of CV due to hydroxyl radical and hole scavenging effects (equation (3.9)) [77]. Hence the optimum dose of H2O2 was elected as 25 mmol l−1 [78,79].
| 3.9 |
Figure 11.
The effect of H2O2 doses on % decolourization of CV for ZGW3 (CV concentration 10 mg l−1 at 1 g l−1 catalyst dose and pH 9).
3.2.6. Influence of initial dye concentration
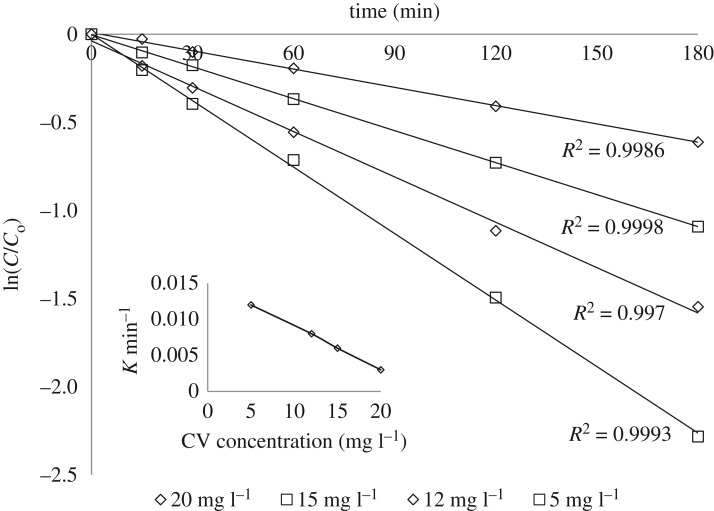
The influence of different initial CV concentrations was demonstrated under prementioned optimum conditions with ZGW3. As affirmed in figure 12 which was set up on the linear relationship, the decolourization of CV arraigned by the pseudo-order kinetics in the following equation:
| 3.10 |
where Kapp is the spotted rate constant, Co and C are the concentrations of CV at zero time and at a certain time, respectively.
Figure 12.
Pseudo-first-order kinetics for different CV doses for ZGW3 (CV concentration 10 mg l−1 at 1 g l−1 catalyst dose and pH 9). Inset: the effect of different CV doses on the rate of the degradation reaction for ZGW3.
Using ZGW3, the photocatalytic rate has increased with decreasing dye concentrations in the tested solutions which attained 0.012, 0.008, 0.006 and 0.003 min−1 at CV concentration 5, 12, 15 and 20 mg l−1, respectively (figure 12). For the adequately low initial CV concentration (5 mg l−1), the dye was completely degraded after the photocatalytic time of 3 h. Additionally, increment in initial CV concentrations, photocatalytic degradation time increased to attain the nearly complete decolourization of CV (figure 12). This might be credited to the augmentation of optical densities of the CV dye solutions with the increment of dye concentrations, which may act as a filter to the incident light [72] and consecutive possible restrict of irradiation penetration to the catalysts' surfaces in all of the test solutions. In this manner only, fewer photons can arrive at the catalyst surface, and therefore the creation of HO• free radical on the surface of the catalyst declined, since the available effective sites of catalyst become covered by the crowded dye ions. This results in decolourization rate reduction [68,72,73,76,77,80,81].
3.2.7. The degradation pathway of crystal violet
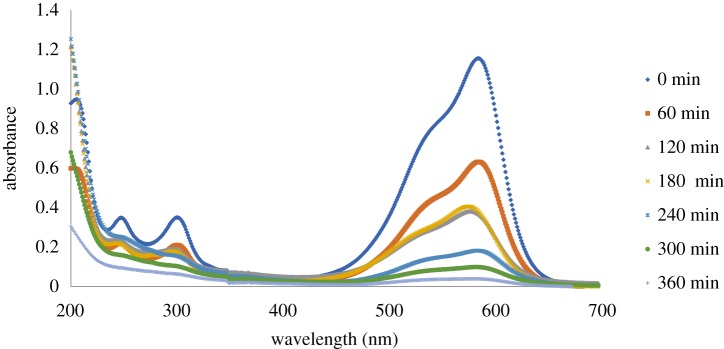
UV–visible spectra of CV dye solution as a function of reaction time for ZGW3 are depicted in figure 13. As noted from these spectra, at 0 time of the experiment prior to the oxidation reaction, the absorption spectrum of CV in water was distinguished by one main peak in the visible region (λ = 584 nm) and by two other peaks in the UV region (λ = 250 and 300 nm). The peaks at 250 and 300 nm were related to aromatic structures in the molecule, and that at 584 nm originated from the chromophore [82]. The gradual decay of the visible peaks with time was owing to the cleavage of the aromatic rings by oxidation. In addition to this rapid decolourization effect, the decrease of the absorbance at 250 or 300 nm was considered as an index of aromatic fragment degradation of the dye molecule and its intermediates [83,84].
Figure 13.
UV–visible spectra study of CV dye as a function of reaction time for ZGW3 (CV concentration 10 mg l−1 at 1 g l−1 catalyst dose and pH 9).
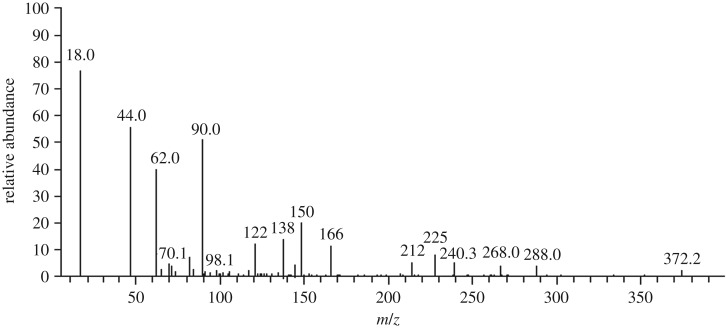
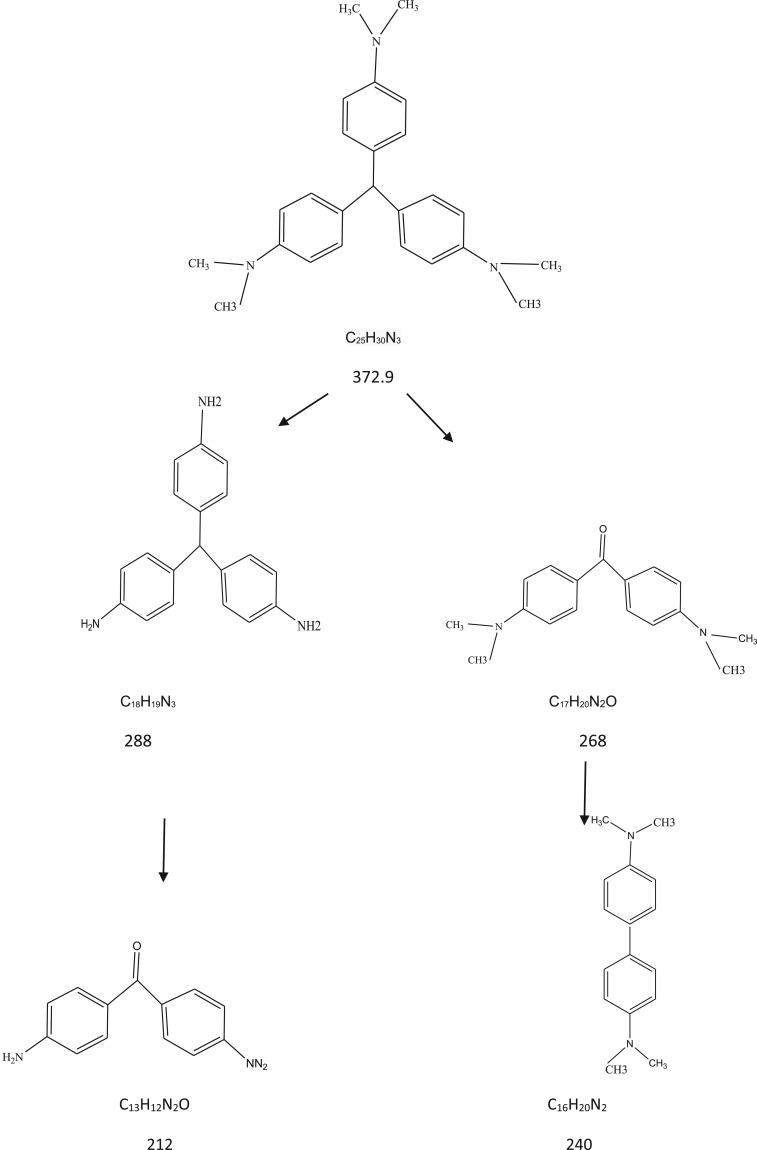
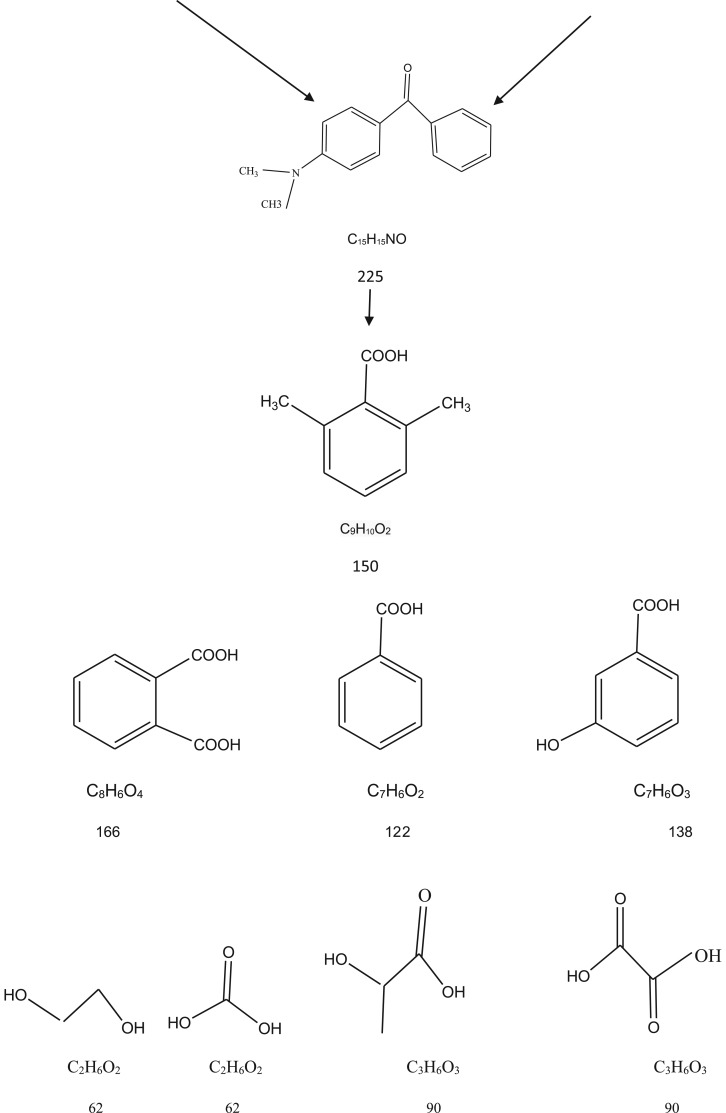
GC–MS study was conducted to further recognition of the intermediate products formed at the end of the photocatalytic reaction figure 14. Based on the results and previous studies [82–85], figure 15 proposed initial degradation pathways that start with N-de-methylation followed by an attack of the oxidizing species on the central carbon portion of the CV to form 4-(N,N-dimethylamino)-4′-(N′.N′-dimethylamino) benzophenone [82,85]. Then the central carbon was successively attacked by the active radicals [85]. Finally, the gradual cleavage of the aromatic intermediates would lead up to the formation of carboxylic acids before transformation into carbon dioxide and water. The treated water was safe to be used for water remediation since it was non-toxic for Vibrio fischeri organism according to the test performed by Microtox analyser 500 [86].
Figure 14.
The GC–MS mass spectra of photocatalytic degradation for CV using ZGW3 under optimum operating condition (CV concentration 10 mg l−1 at 1 g l−1 catalyst dose and pH 9).
Figure 15.
The proposed pathway for photocatalytic degradation for CV.
The Photocatalytic efficiency of the prepared Ga2Zr2−xWxO7 for CV dye degradation in comparison with that of various other photocatalysts is presented in table 4. The prepared nano-sized cubic fluorite Ga2Zr1.85W0.15O7 oxide showed promising photocatalytic activity for decolourization of the harmful CV dye under visible light irradiation (which is more applicable from an economic view) compared with modified TiO2.
Table 4.
Comparison of photocatalysts used for the degradation of CV dye.
| catalyst | efficiency % | irradiation source | time | cited by |
|---|---|---|---|---|
| BiOCl/H2O2 | 100 | visible | 8 h | [19] |
| anatase nanosphere TiO2 | 99 | UV | 6 h | [20] |
| Mn-doped and PVP-capped ZnO NPs | 100 | UV–visible irradiation | 3 h | [21] |
| Ag-modified Ti-doped-Bi2O3 |
65 | UV | 90 min | [22] |
| TG-capped ZnS NPs | 87 | UV–visible irradiation | 3 h | [23] |
| AgBr–ZnO/H2O2 nanocomposite |
86.93 | visible light | 50 min | [25] |
| grafted sodium alginate/ZnO/graphene oxide | 94 | sun light | 5 h | [26] |
| Ga2Zr2−xWxO7/H2O2 | 100 | visible light | 5 h | present work |
3.2.8. The reusability for ZGW3 sample
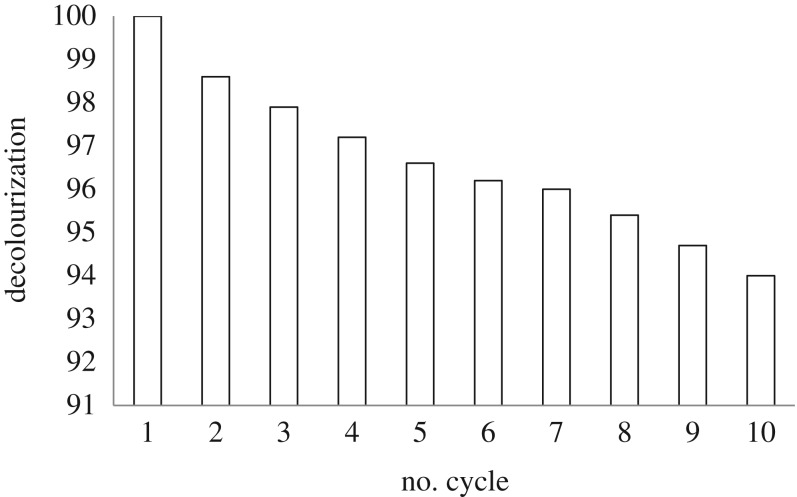
The reusability of the catalyst is one of the main obstacles to the application of photocatalyst in water treatment. In order to examine the reusability, 10 cycles for CV decolonization over ZGW3 sample were accomplished under the pre-optimized operating conditions. The catalyst was deposited settling the solution for enough time. After detaching the supernatant, the catalyst had been introduced for another cycle. The variation in % CV removals with various cycles is presented in figure 16. The trivial diminishment in photocatalytic adequacy (100–94%) pointed to satisfactory results obtained with increasing the number of runs up to 10 affirming that the prementioned sample can be reused without losing the profitable synergy activity.
Figure 16.
Number of cycles for CV over ZGW3 sample under visible light at optimum conditions (CV concentration 10 mg l−1 at 1 g l−1 catalyst dose and pH 9).
3.2.9. Evaluation of active species
Free radicals trapping experiments were conducted for ZGW3, as the highest catalytic activity sample, to explore the significant contributor in the photodegradation reaction under optimum operating condition (CV concentration 10 mg l−1 at 1 g l−1 catalyst dose and pH 9). When 1 mmol l−1 IPA was introduced as HO• scavenger, the degradation of CV was not clearly influenced (CV % removal accomplished 80%), which demonstrated that the HO• was not the major reactive species. However, the degradation process could be hindered proficiently when 1 mmol l−1 benzoquinone (BQ) was added, since CV removal was decreased to 45%. It indicated that the played a demonstrating role in the catalysis process. When 1 mmol l−1 EDTA was added, the catalytic degradation of CV could be extremely inhibited (CV removal accomplished to 21%), indicating the h+ also played a major role in the catalytic process. Consequently, h+ and had the major contribution to photocatalytic degradation of CV while, HO• had a minor contribution [87].
4. Conclusion
Nano-sized Ga2Zr2−xWxO7 system is prepared successfully in the cubic fluorite phase using the Pechini method where x = 0, 0.05, 0.1, 0.15 and 0.2. XRD, IR, EPR, XPS, TEM, BET, ICP and diffuse reflectance are used for the characterization of the prepared samples. The undoped in addition to W-doped Ga2Zr2O7 has cubic fluorite phase structure. According to XRD, it was found that the samples are in the nano-sized range (3–4 nm). The band gap of the Ga2Zr2O7 (4.95 eV) is close to that of ZrO2 (5 eV). W doping decreased the band gap so that the band gap of Ga2Zr1.9W0.1O7 (1.81 eV) and Ga2Zr1.85W0.15O7 (1.7 eV) samples were found to be smaller than that of pyrochlore Sm2Zr2O7 (2.86 eV) and Nd2Zr2O7 (2.67 eV), while Ga2Zr1.8W0.2O7 has band gap matched with Nd2Zr2O7 (2.67 eV). Full degradation for the CV dye (at 300 min, 25 mmol l−1 H2O2) is reached for Ga2Zr1.85W0.15O7 sample with 15 mol% W doping while lower removal was observed for 20 mol% W-doped sample which is in accordance with their band gaps obtained by DRS as well as the amount of free radical obtained from EPR analysis. The CV dye photocatalytic degradation followed the pseudo-first-order kinetics. UV–visible and GC–MS studies were conducted to identify the by-products at the end of the reaction of decolourization. GC–MS study indicated that the degradation processes might include N-de-methylation followed by aromatic ring rupture. Ga2Zr1.85W0.15O7 can be used as a promising photocatalyst to purify recalcitrant complicated structure dye for textile water decontamination.
Supplementary Material
Acknowledgements
Authors acknowledge the Science and Technology Development Fund in Egypt and the Scientific Research Support Fund in Jordan for financing that work through collaborative project no. 21734 in Egypt and no. Egy-Jor/1/01/2015 in Jordan.
Data accessibility
Data are available from the Dryad Digital Repository: https://doi.org/10.5061/dryad.zpc866t54 [88].
Authors' contributions
A.A.B. and R.A.-Z. carried out the preparation of nano materials, H.A.A. carried out the characterization of the prepared material, T.S.J. and R.A.N. carried out applications of the prepared materials for photocatalytic degradation of crystal violet dye as model compound of textile wastewater. H.A.A. and R.A.N. wrote the manuscript, and T.S.J. and A.A.B. critically revised the manuscript. R.A.N. submitted it.
Competing interests
We declare we have no competing interests.
Funding
This work was funded by the Science and Technology Development Fund in Egypt and the Scientific Research Support Fund in Jordan for financing that work through collaborative project no. 21734 in Egypt and no. Egy-Jor/1/01/2015 in Jordan.
References
- 1.Zahoor M. 2012. Removal of crystal violet from water by adsorbent prepared from Turkish coffee residue. Tenside Surfactants Deterg. 49, 107–113. ( 10.3139/113.110171) [DOI] [Google Scholar]
- 2.Thairu Y, Nasir IA, Usman Y. 2014. Laboratory perspective of gram staining and its significance in investigations of infectious diseases. Sub-Saharan Afr. J. Med. 1, 168 ( 10.4103/2384-5147.144725) [DOI] [Google Scholar]
- 3.Edokpayi JN, Odiyo JO, Durowoju OS. 2017. Impact of wastewater on surface water quality in developing countries: a case study of South Africa. In Water quality (ed. Tutu H.), pp. 401–416. Vienna, Austria: INTECH. [Google Scholar]
- 4.Song Y, Fang H, Xu H, Tan X, Chen S. 2016. Treatment of wastewater containing crystal violet using walnut shell. J. Residuals Sci. Technol. 13, 243–249. ( 10.12783/issn.1544-8053/13/4/1) [DOI] [Google Scholar]
- 5.Mashkoor F, Nasar A, Asiri AM. 2018. Exploring the reusability of synthetically contaminated wastewater containing crystal violet dye using Tectona grandis sawdust as a very low-cost adsorbent. Sci. Rep. 8, 8314 ( 10.1038/s41598-018-26655-3) [DOI] [PMC free article] [PubMed] [Google Scholar]
- 6.Mani S, Bharagava RN. 2016. Exposure to crystal violet, its toxic, genotoxic and carcinogenic effects on environment and its degradation and detoxification for environmental safety. In Reviews of environmental contamination and toxicology volume 237, pp. 71–104. Berlin, Germany: Springer. [DOI] [PubMed] [Google Scholar]
- 7.Sun M, Ricker K, Osborne G, Marder ME, Schmitz R.. 2018. Evidence on the carcinogenicity of gentian violet. Office of Environmental Health Hazard Assessment, California Environmental Protection Agency.
- 8.Wallace RB, Oria ME. 2010. Appendix E: The U.S. Food and Drug Administration and imported food safety. In Enhancing food safety: the role of the Food and Drug Administration (eds Wallace RB, Oria ME), pp. 451–492. Washington, DC: The National Academic Press. [Google Scholar]
- 9.Zhang X, Yang Y, Lv X, Wang Y, Liu N, Chen D, Cui L. 2019. Adsorption/desorption kinetics and breakthrough of gaseous toluene for modified microporous–mesoporous UiO-66 metal organic framework. J. Hazard. Mater. 366, 140–150. ( 10.1016/j.jhazmat.2018.11.099) [DOI] [PubMed] [Google Scholar]
- 10.Yang Y, Ding Q, Yang M, Wang Y, Liu N, Zhang X. 2018. Magnetic ion exchange resin for effective removal of perfluorooctanoate from water: study of a response surface methodology and adsorption performances. Environ. Sci. Pollut. Res. 25, 29 267–29 278. ( 10.1007/s11356-018-2797-1) [DOI] [PubMed] [Google Scholar]
- 11.Wei L, Sun H, Yang T, Deng S, Wu M, Li Z. 2018. Iron carbide encapsulated by porous carbon nitride as bifunctional electrocatalysts for oxygen reduction and evolution reactions. Appl. Surf. Sci. 439, 439–446. ( 10.1016/j.apsusc.2018.01.056) [DOI] [Google Scholar]
- 12.Zhang X, Yang Y, Huang W, Yang Y, Wang Y, He C, Liu N, Wu M, Tang L. 2018. g-C3N4/UiO-66 nanohybrids with enhanced photocatalytic activities for the oxidation of dye under visible light irradiation. Mater. Res. Bull. 99, 349–358. ( 10.1016/j.materresbull.2017.11.028) [DOI] [Google Scholar]
- 13.Liu N, Huang W, Tang M, Yin C, Gao B, Li Z, Tang L, Lei J, Cui L, Zhang X. 2019. In-situ fabrication of needle-shaped MIL-53 (Fe) with 1T-MoS2 and study on its enhanced photocatalytic mechanism of ibuprofen. Chem. Eng. J. 359, 254–264. ( 10.1016/j.cej.2018.11.143) [DOI] [Google Scholar]
- 14.Bhayani RB. 2014. Color removal of dyes wastewater by coagulation and microfiltration processes. Bachelor of Engineering in Civil Engineering, Maharaja Sayajirao University, Vadodara, India.
- 15.Sillanpää M, Ncibi MC, Matilainen A. 2018. Advanced oxidation processes for the removal of natural organic matter from drinking water sources: a comprehensive review. J. Environ. Manage. 208, 56–76. ( 10.1016/j.jenvman.2017.12.009) [DOI] [PubMed] [Google Scholar]
- 16.Wang B, Zhang H, Wang F, Xiong X, Tian K, Sun Y, Yu T. 2019. Application of heterogeneous catalytic ozonation for refractory organics in wastewater. Catalysts 9, 241 ( 10.3390/catal9030241) [DOI] [Google Scholar]
- 17.Matavos-Aramyan S, Moussavi M. 2017. Advances in Fenton and Fenton based oxidation processes for industrial effluent contaminants control: a review. Int. J. Environ. Sci. Nat. Resour. 2, 1–18. [Google Scholar]
- 18.Qiao Y. 2018. Preparation, characterization, and evaluation of photocatalytic properties of a novel NaNbO3/Bi2WO6 heterostructure photocatalyst for water treatment. Master of Applied Science degree in Chemical Engineering, University of Ottawa, Canada.
- 19.Pare B, Swami D, Thapak TR, Qureshi T. 2011. Photocatalytic degradation of environmentally hazardous crystal violet dye using bismuth oxychloride as photocatalyst. Int. J. Chem. Sci. 9, 1183–1193. [Google Scholar]
- 20.Jadhav VV, Dhabbe RS, Sabale SR, Nikam GH, Tamhankar BV. 2013. Degradation of dyes using high temperature stable anatase nanosphere TiO2 photocatalyst. Univers. J. Environ. Res. Technol. 3, 667–676. [Google Scholar]
- 21.Mittal M, Sharma M, Pandey OP. 2014. Photocatalytic studies of crystal violet dye using Mn doped and PVP capped ZnO nanoparticles. J. Nanosci. Nanotechnol. 14, 2725–2733. ( 10.1166/jnn.2014.8615) [DOI] [PubMed] [Google Scholar]
- 22.Zhang L, Niu J, Li D, Gao D, Shi J. 2014. Preparation and photocatalytic activity of Ag modified Ti-doped-Bi2O3 photocatalyst. Adv. Condens. Matter Phys. 2014, 1–6. [Google Scholar]
- 23.Sharma M, Jain T, Singh S, Pandey OP. 2012. Photocatalytic degradation of organic dyes under UV–visible light using capped ZnS nanoparticles. Sol. Energy 86, 626–633. ( 10.1016/j.solener.2011.11.006) [DOI] [Google Scholar]
- 24.Zahoor M, et al. 2018. Enhanced photocatalytic performance of CeO2–TiO2 nanocomposite for degradation of crystal violet dye and industrial waste effluent. Appl. Nanosci. 8, 1091–1099. ( 10.1007/s13204-018-0730-z) [DOI] [Google Scholar]
- 25.Abdel-Khalek AA, Mahmoud SA, Zaki AH. 2018. Visible light assisted photocatalytic degradation of crystal violet, bromophenol blue and eosin Y dyes using AgBr–ZnO nanocomposite. Environ. Nanotechnol. Monit. Manag. 9, 164–173. ( 10.1016/j.enmm.2018.03.002) [DOI] [Google Scholar]
- 26.Mohamed SK, Hegazy SH, Abdelwahab NA, Ramadan AM. 2018. Coupled adsorption-photocatalytic degradation of crystal violet under sunlight using chemically synthesized grafted sodium alginate/ZnO/graphene oxide composite. Int. J. Biol. Macromol. 108, 1185–1198. ( 10.1016/j.ijbiomac.2017.11.028) [DOI] [PubMed] [Google Scholar]
- 27.Liu ZG, Ouyang JH, Zhou Y, Xia XL. 2010. Electrical conductivity and thermal expansion of neodymium–ytterbium zirconate ceramics. J. Power Sources 195, 3261–3265. ( 10.1016/j.jpowsour.2009.11.135) [DOI] [Google Scholar]
- 28.Chon MP, Tan KB, Zainal Z, Taufiq-Yap YH, Tan PY, Khaw CC, Chen SK. 2016. Synthesis and electrical properties of Zn-substituted bismuth copper tantalate pyrochlores. Int. J. Appl. Ceram. Technol. 13, 718–725. ( 10.1111/ijac.12547) [DOI] [Google Scholar]
- 29.Hatnean MC, Lees MR, Balakrishnan G. 2015. Growth of single-crystals of rare-earth zirconate pyrochlores, Ln2Zr2O7 (with Ln = La, Nd, Sm, and Gd) by the floating zone technique. J. Cryst. Growth 418, 1–6. ( 10.1016/j.jcrysgro.2015.01.037) [DOI] [Google Scholar]
- 30.Nigam S, Sudarsan V, Vatsa RK. 2013. Effect of annealing temperature on the structural and photoluminescence properties of Y2Sn2O7:Eu nanoparticles. Eur. J. Inorg. Chem. 2013, 357–363. ( 10.1002/ejic.201200804) [DOI] [Google Scholar]
- 31.Mandal BP, Tyagi AK. 2010. Pyrochlores. Potential multifunctional material. BARC Newsletter 313, 6–13. [Google Scholar]
- 32.Zhang G, Jiang W, Yu S. 2010. Preparation, characterization and photocatalytic property of nanosized K–Ta mixed oxides via a sol-gel method. Mater. Res. Bull. 45, 1741–1747. ( 10.1016/j.materresbull.2010.06.052) [DOI] [Google Scholar]
- 33.Fowler P, Homan A, Atkins D, Whitwell J, Lloyd M, Bradford R. 2016. The utility of the in vitro micronucleus test for evaluating the genotoxicity of natural and manmade nano-scale fibres. Mutat. Res. Genet. Toxicol. Environ. Mutagen. 809, 33–42. ( 10.1016/j.mrgentox.2016.09.002) [DOI] [PubMed] [Google Scholar]
- 34.Wang W, Bi J, Wu L, Li Z, Wang X, Fu X. 2008. Hydrothermal synthesis and performance of a novel nanocrystalline Pb2Sn2O6 photocatalyst. Nanotechnology 19, 505705 ( 10.1088/0957-4484/19/50/505705) [DOI] [PubMed] [Google Scholar]
- 35.Ravi G, Veldurthi NK, Palla S, Velchuri R, Pola S, Reddy JR, Vithal M. 2013. Synthesis, characterization and photocatalytic activity of KAl0.33W1.67O6 and Sn0.5Al0.33W1.67O6xH2O. Photochem. Photobiol. 89, 824–831. ( 10.1111/php.12079) [DOI] [PubMed] [Google Scholar]
- 36.Jitta RR, Guje R, Veldurthi NK, Prathapuram S, Velchuri R, Muga V. 2015. Preparation, characterization and photocatalytic studies of N, Sn-doped defect pyrochlore oxide KTi0.5W1.5O6. J. Alloys Compd. 618, 815–823. ( 10.1016/j.jallcom.2014.08.157) [DOI] [Google Scholar]
- 37.Guje R, Shrujana P, Veldurthi NK, Gundeboina R, Kappera NR, Muga V. 2014. Synthesis, characterization and photocatalytic activity of Ag+-and Sn2+ substituted KSbTeO6. Chem. Pap. 69, 269–278. ( 10.1515/chempap-2015-0013) [DOI] [Google Scholar]
- 38.Kanhere P, Tang Y, Zheng J, Chen Z. 2013. Synthesis, photophysical properties, and photocatalytic applications of Bi doped NaTaO3 and Bi doped Na2Ta2O6 nanoparticles. J. Phys. Chem. Solids 74, 1708–1713. ( 10.1016/j.jpcs.2013.06.013) [DOI] [Google Scholar]
- 39.Singh J, Uma S. 2009. Efficient photocatalytic degradation of organic compounds byilmenite AgSbO3 under visible and UV light irradiation. J. Phys. Chem. C 113, 12 483–12 488. [Google Scholar]
- 40.Malathi M, Sreenu K, Ravi G, Kumar PV, Reddy CS, Guje R, Velchuri R, Vithal M. 2017. Low temperature synthesis of fluorite-type Ce-based oxides of composition Ln2Ce2O7 (Ln = Pr, Nd and Eu): photodegradation and luminescence studies. J. Chem. Sci. 129, 1193–1203. ( 10.1007/s12039-017-1321-3) [DOI] [Google Scholar]
- 41.Pechini M.1967. Method for preparing lead and alkaline earth titanates and niobates and coating method using the same to form a capacitor. Patent no. US3330697A.
- 42.Carrillo AJ, Serrano DP, Pizarro P, Coronado JM. 2016. Design of efficient Mn-based redox materials for thermochemical heat storage at high temperatures. In AIP Conf. Proc., 21st SolarPACES Conf., Cape Town, South Africa, 13–16 October, p. 50009 AIP Publishing. [Google Scholar]
- 43.Ribeiro PC, De Melo Da Costa ACF, Kiminami RHGA, Sasaki JM, Lira HL. 2013. Synthesis of TiO2 by the Pechini method and photocatalytic degradation of methyl red. Mater. Res. 16, 468–472. ( 10.1590/S1516-14392012005000176) [DOI] [Google Scholar]
- 44.Danks AE, Hall SR, Schnepp Z. 2016. The evolution of ‘sol-gel’ chemistry as a technique for materials synthesis. Mater. Horizons 3, 91–112. ( 10.1039/c5mh00260e) [DOI] [Google Scholar]
- 45.Sunde TOL, Grande T, Einarsrud M-A. 2016. Modified Pechini synthesis of oxide powders and thin films. In Handbook of sol-gel science and technology (eds L Klein, M Aparicio, A Jitianu), pp. 1–30. Cham, Switzerland: Springer.
- 46.Zhang L, Yang J, Li J. 2014. A novel composite cathode for intermediate temperature solid oxide fuel cell. J. Power Sources 269, 723–726. ( 10.1016/j.jpowsour.2014.07.076) [DOI] [Google Scholar]
- 47.Holland TJB, Redfern SAT. 1997. Unit cell refinement from powder diffraction data; the use of regression diagnostics. Miner. Mag. 61, 65–77. ( 10.1180/minmag.1997.061.404.07) [DOI] [Google Scholar]
- 48.Mandal BP, Garg N, Sharma SM, Tyagi AK. 2006. Preparation, XRD and Raman spectroscopic studies on new compounds RE2Hf2O7 (RE = Dy, Ho, Er, Tm, Lu, Y): pyrochlores or defect-fluorite? J. Solid State Chem. 179, 1990–1994. ( 10.1016/j.jssc.2006.03.036) [DOI] [Google Scholar]
- 49.Catchen GL, Rearick TM. 1995. O-anion transport measured in several R2M2O7 pyrochlores using perturbed-angular-correlation spectroscopy. Phys. Rev. B 52, 9890–9899. ( 10.1103/PhysRevB.52.9890) [DOI] [PubMed] [Google Scholar]
- 50.Mandal BP, Banerji A, Sathe V, Deb SK, Tyagi AK. 2007. Order–disorder transition in Nd2−yGdyZr2O7 pyrochlore solid solution: an X-ray diffraction and Raman spectroscopic study. J. Solid State Chem. 180, 2643–2648. ( 10.1016/j.jssc.2007.07.007) [DOI] [Google Scholar]
- 51.Whittle KR, Cranswick LMD, Redfern SAT, Swainson IP, Lumpkin GR. 2009. Lanthanum pyrochlores and the effect of yttrium addition in the systems La2−xYxZr2O7 and La2−xYxHf2O7. J. Solid State Chem. 182, 442–450. ( 10.1016/j.jssc.2008.11.008) [DOI] [Google Scholar]
- 52.Shannon RD. 1976. Revised effective ionic radii and systematic studies on inter-atomic distances in halides and chalcogenides. Acta Cryst. A 32, 751–767. ( 10.1107/S0567739476001551) [DOI] [Google Scholar]
- 53.Zhang Y, Guo L, Zhao X, Ye F. 2014. Effects of non-stoichiometry on the mechanical properties of Nd2−xZr2+xO7+x/2 (x = 0, 0.1, 0.2, 0.3, 0.4, 0.5) ceramics. Mater. Lett. 136, 157–159. ( 10.1016/j.matlet.2014.08.065) [DOI] [Google Scholar]
- 54.Hao CK, Lee CS. 2013. Metal-doped pyrochlore as novel electrode materials for intermediate temperature solid oxide fuel cell. ECS Trans. 58, 165–173. ( 10.1149/05803.0165ecst) [DOI] [Google Scholar]
- 55.Yakout SM, Hassan HS. 2014. Adsorption characteristics of sol gel-derived zirconia for cesium ions from aqueous solutions. Molecules 19, 9160–9172. ( 10.3390/molecules19079160) [DOI] [PMC free article] [PubMed] [Google Scholar]
- 56.Gurushantha K, Anantharaju KS, Nagabhushana H, Sharma SC, Vidya YS, Shivakumara C, Nagaswarupa HP, Prashantha SC, Anilkumar MR. 2015. Facile green fabrication of iron-doped cubic ZrO2 nanoparticles by Phyllanthus acidus: structural, photocatalytic and photoluminescent properties. J. Mol. Catal. A Chem. 397, 36–47. ( 10.1016/j.molcata.2014.10.025) [DOI] [Google Scholar]
- 57.Badenes JA, Vicent JB, Llusar M, Tena MA, Monros G. 2002. The nature of Pr-ZrSiO4 yellow ceramic pigment. J. Mater. Sci. 37, 1413–1420. ( 10.1023/A:1014537000690) [DOI] [Google Scholar]
- 58.Krehula S, Ristić M, Kubuki S, Iida Y, Fabián M, Musić S. 2015. The formation and microstructural properties of uniform α-GaOOH particles and their calcination products. J. Alloys Compd. 620, 217–227. ( 10.1016/j.jallcom.2014.09.134) [DOI] [Google Scholar]
- 59.Rougier A, Portemer F, Quédé A, El Marssi M. 1999. Characterization of pulsed laser deposited WO3 thin films for electrochromic devices. Appl. Surf. Sci. 153, 1–9. ( 10.1016/S0169-4332(99)00335-9) [DOI] [Google Scholar]
- 60.Orel B, Grošelj N, Krašovec UO, Ješe R, Georg A. 2002. IR spectroscopic investigations of gasochromic and electrochromic sol-gel—derived peroxotungstic acid/ormosil composite and crystalline WO3 films. J. Sol-Gel Sci. Technol. 24, 5–22. ( 10.1023/A:1015147530846) [DOI] [Google Scholar]
- 61.Jamil TS, Mansor ES, Nasr RA. 2016. Degradation of Lindane using two nanosized BiOXs and their heterojunction under visible light. Desalin. Water Treat. 57, 14 750–14 761. ( 10.1080/19443994.2015.1063461) [DOI] [Google Scholar]
- 62.Sayama K, Arakawa H. 1994. Effect of Na2CO3 addition on photocatalytic decomposition of liquid water over various semiconductor catalysis. J. Photochem. Photobiol. A Chem. 77, 243–247. ( 10.1016/1010-6030(94)80049-9) [DOI] [Google Scholar]
- 63.Sayarna K, Arakawa H. 1996. Effect of carbonate addition on the photocatalytic decomposition of liquid water over a ZrO2 catalyst. J. Photochem. Photobiol. A Chem. 94, 67–76. [Google Scholar]
- 64.Chiesa M, Giamello E, Livraghi S, Paganini MC, Polliotto V, Salvadori E. 2019. Electron magnetic resonance in heterogeneous photocatalysis research. J. Phys. Condens. Matter 31, 444001 ( 10.1088/1361-648X/ab32c6) [DOI] [PubMed] [Google Scholar]
- 65.Li X, Mao X, Feng M, Xie J, Jiang B, Zhang L. 2016. Optical absorption and mechanism of vacuum-sintered ZrO2-doped Y2O3 ceramics. J. Eur. Ceram. Soc. 36, 4181–4184. ( 10.1016/j.jeurceramsoc.2016.05.046) [DOI] [Google Scholar]
- 66.Venkatesan M, Stamenov P, Dorneles LS, Gunning RD, Bernoux B, Coey JMD. 2007. Magnetic, magnetotransport, and optical properties of Al-doped Zn0.95Co0.05O thin films. Appl. Phys. Lett. 90, 100–103. ( 10.1063/1.2748343) [DOI] [Google Scholar]
- 67.Sharaf El-Deen SE, Ammar NS, Jamil TS. 2016. Adsorption behavior of Co(II) and Ni(II) from aqueous solutions onto titanate nanotubes. Fuller. Nanotub. Carbon Nanostructure 24, 455–466. ( 10.1080/1536383X.2016.1179287) [DOI] [Google Scholar]
- 68.Vasic MB, Ranđelović MS, Momčilović MZ, Matović B, Zarubica AR. 2016. Degradation of crystal violet over heterogeneous TiO2-based catalysts: the effect of process parameters. Process. Appl. Ceram. 10, 189–198. ( 10.2298/PAC1603189V) [DOI] [Google Scholar]
- 69.Pare B, Singh P, Jonnalagadda SB. 2010. Visible light driven photocatalytic degradation and mineralization of neutral red dye in slurry photoreactor. Indian J. Chem. Technol. 17, 391 ( 10.1080/02726351.2016.1168893) [DOI] [Google Scholar]
- 70.Ksibi M, Ben AS, Cherif S, Elaloui E, Houas A, Elaloui M. 2003. Photodegradation of lignin from black liquor using a UV/TiO2 system. J. Photochem. Photobiol. A Chem. 154, 211–218. ( 10.1016/S1010-6030(02)00316-7) [DOI] [Google Scholar]
- 71.Alex S, Santhosh U, Das S. 2005. Dye sensitization of nanocrystalline TiO2: enhanced efficiency of unsymmetrical versus symmetrical squaraine dyes. J. Photochem. Photobiol. A Chem. 172, 63–71. ( 10.1016/j.jphotochem.2004.11.005) [DOI] [Google Scholar]
- 72.Verma NK, Gurjar L, Bhardwaj S. 2011. Use of Ta2O5 as a photocatalyst for degradation of crystal violet using solar energy. Der Chem. Sin. 2, 258–264. [Google Scholar]
- 73.Suhail FS, Mashkour MS, Saeb D. 2015. The study on photo degradation of crystal violet by polarographic technique. Int. J. Basic Appl. Sci. 15, 12–21. [Google Scholar]
- 74.Devi LG, Kumar SG. 2012. Exploring the critical dependence of adsorption of various dyes on the degradation rate using Ln3+-TiO2 surface under UV/solar light. Appl. Surf. Sci. 261, 137–146. ( 10.1016/j.apsusc.2012.07.121) [DOI] [Google Scholar]
- 75.Abbas HA, Jamil TS, Hammad FF. 2016. Synthesis, characterization and photocatalytic activity of nano sized undoped and Ga doped SrTi0.7Fe0.3O3 for 2,4,6-trichlorophenol photodegradation. J. Environ. Chem. Eng. 4, 2384–2393. ( 10.1016/j.jece.2016.04.019) [DOI] [Google Scholar]
- 76.Karim A, Soltani RD, Khataee A, Soltani B, Arefi-Oskoui S. 2015. Sonochemical synthesis of Pr-doped ZnO nanoparticles for sonocatalytic degradation of Acid Red 17. Ultrason. Sonochem. 22, 371–381. ( 10.1016/j.ultsonch.2014.05.023) [DOI] [PubMed] [Google Scholar]
- 77.Subash B, Krishnakumar B, Swaminathan M, Shanthi M. 2013. Highly efficient, solar active, and reusable photocatalyst: Zr-loaded Ag–ZnO for reactive red 120 dye degradation with synergistic effect and dye-sensitized mechanism. Langmuir 3, 939–949. ( 10.1021/la303842c) [DOI] [PubMed] [Google Scholar]
- 78.Dong C, Ji J, Shen B, Xing M, Zhang J. 2018. Enhancement of H2O2 decomposition by the co-catalytic effect of WS2 on the Fenton reaction for the synchronous reduction of Cr(VI) and remediation of phenol. Environ. Sci. Technol. 52, 11 297–11 308. ( 10.1021/acs.est.8b02403) [DOI] [PubMed] [Google Scholar]
- 79.Yi Q, Ji J, Shen B, Dong C, Liu J, Zhang J, Xing M. 2019. Singlet oxygen triggered by superoxide radicals in a molybdenum cocatalytic Fenton reaction with enhanced REDOX activity in the environment. Environ. Sci. Technol. 53, 9725–9733. ( 10.1021/acs.est.9b01676) [DOI] [PubMed] [Google Scholar]
- 80.Liu Y, Yu H, Lv Z, Zhan S, Yang J, Peng X, Ren Y, Wu X. 2012. Simulated-sunlight-activated photocatalysis of Methylene Blue using cerium-doped SiO2/TiO2 nanostructured fibers. J. Environ. Sci. 24, 1867–1875. ( 10.1016/S1001-0742(11)61008-5) [DOI] [PubMed] [Google Scholar]
- 81.Kumar R, Rashid J, Barakat MA. 2015. Zero valent Ag deposited TiO2 for the efficient photocatalysis of methylene blue under UV-C light irradiation. Colloids Interface Sci. Commun. 5, 1–4. ( 10.1016/j.colcom.2015.05.001) [DOI] [Google Scholar]
- 82.Palma-Goyes RE, Guzmán-Duque FL, Peñuela G, González I, Nava JL, Torres-Palma RA. 2010. Electrochemical degradation of crystal violet with BDD electrodes: effect of electrochemical parameters and identification of organic by-products. Chemosphere 81, 26–32. ( 10.1016/j.chemosphere.2010.07.020) [DOI] [PubMed] [Google Scholar]
- 83.Zhang H, Wu J, Wang Z, Zhang D. 2010. Electrochemical oxidation of crystal violet in the presence of hydrogen peroxide. J. Chem. Technol. Biotechnol. 85, 1436–1444. ( 10.1002/jctb.2447) [DOI] [Google Scholar]
- 84.He H, Yang S, Yu K, Ju Y, Sun C, Wang L. 2010. Microwave induced catalytic degradation of crystal violet in nano-nickel dioxide suspensions. J. Hazard. Mater. 173, 393–400. ( 10.1016/j.jhazmat.2009.08.084) [DOI] [PubMed] [Google Scholar]
- 85.Guzman-Duque F, Pétrier C, Pulgarin C, Peñuela G, Torres-Palma RA. 2011. Effects of sonochemical parameters and inorganic ions during the sonochemical degradation of crystal violet in water. Ultrason. Sonochem. 18, 440–446. ( 10.1016/j.ultsonch.2010.07.019) [DOI] [PubMed] [Google Scholar]
- 86.Jamil TS, Abbas HA, Nasr RA, El-Kady AA, Ibrahim MIM. 2017. Detoxification of aflatoxin B1 using nano-sized Sc-doped SrTi0.7Fe0.3O3 under visible light. J. Photochem. Photobiol. A Chem. 341, 127–135. ( 10.1016/j.jphotochem.2017.03.023) [DOI] [Google Scholar]
- 87.Chiu YH, Chang TFM, Chen CY, Sone M, Hsu YJ. 2019. Mechanistic insights into photodegradation of organic dyes using heterostructure photocatalysts. Catalysts 9, 430 ( 10.3390/catal9050430) [DOI] [Google Scholar]
- 88.Abbas HA, Nasr RA, Abu-Zurayk R, Al Bawab A, Jamil TS. 2020. Data from: Decolorization of crystal violet using nano-sized novel fluorite structure Ga2Zr2−xWxO7 photocatalyst under visible light irradiation Dryad Digital Repository. 10.5061/dryad.zpc866t54. [DOI] [PMC free article] [PubMed]
Associated Data
This section collects any data citations, data availability statements, or supplementary materials included in this article.
Data Citations
- Abbas HA, Nasr RA, Abu-Zurayk R, Al Bawab A, Jamil TS. 2020. Data from: Decolorization of crystal violet using nano-sized novel fluorite structure Ga2Zr2−xWxO7 photocatalyst under visible light irradiation Dryad Digital Repository. 10.5061/dryad.zpc866t54. [DOI] [PMC free article] [PubMed]
Supplementary Materials
Data Availability Statement
Data are available from the Dryad Digital Repository: https://doi.org/10.5061/dryad.zpc866t54 [88].


