Abstract
Progress toward better diagnosis and treatment of lipid metabolism-related diseases requires high throughput approaches for multiplexed quantitative analysis of structurally diverse lipids, including phospholipids (PLs). This work demonstrates a simplified “one-pot” phospholipid extraction protocol, as an alternative to conventional liquid-liquid extraction. Performed in a 96-well format, the extraction was coupled with high throughput UPLC and multiplexed tandem mass spectrometry (MS/MS) detection, allowing non-targeted quantification of phosphatidylcholines (PC), sphingomyelins (SM), lysophosphatidylcholines (LPC), phosphatidylethanolamines (PE), and phosphatidylinositols (PI). Using 50 μL aliquots of serum samples from 110 individuals, lipoproteins were fractionated by size, and analyzed for phospholipids and non-polar lipids including free cholesterol (FC), cholesteryl esters (CEs) and triglycerides (TGs). Analysis of serum samples with wide range of Total-TG levels showed significant differences in PL composition. The correlations of molar ratios in lipoprotein size fractions, SM/PL with FC/PL, PE/PL with TG/CE, and PE/PL with PI/PL, demonstrate the applicability of the method for quantitative composition analysis of high, low and very-low density lipoproteins (HDL, LDL and VLDL), and characterization of lipid metabolism related disease states.
Keywords: HILIC, Phospholipids, Lipids, Lipidomics, Lipoproteins, UHPLC-MS/MS
1. Introduction
Lipoproteins are complex molecular assemblies that function as particle-like extracellular molecule transporters [1]. The lipoprotein consists of a core of cholesteryl esters (CE) and triglycerides (TG) that is surrounded by an amphipathic monolayer of phospholipids (PL) with the polar head groups positioned toward the aqueous plasma matrix. Studying the PL composition of lipoproteins is important for better understanding energy homeostasis and the transport of various biomolecules in different disease states [2]. Among the main PL classes on the monolayer surface of lipoproteins are phosphatidylcholines (PC), lysophosphatidylcholines (LPC), sphingomyelins (SM), phosphatidylethanolamines (PE), and phosphatidylinositols (PI). Within these PL classes the non-polar tails of individual PL species vary by carbon chain length and number of double bonds. Each PL species has a characteristic molecular shape due to differences in the cross-sectional area of the headgroup relative to the cross-sectional area of the acyl chains with various length and number/position of double bounds [3, 4]. The PL monolayer surface of lipoproteins is strengthened by incorporation of free un-esterified cholesterol (FC) [5, 6]. Apolipoproteins, with amphipathic alpha helices and beta sheets are able to penetrate among the nonpolar PL tails, and with their favorably positioned lysine, arginine and tyrosine side chains interact with the PL head groups [7–9]. Polar, non-polar, and steric interactions among PLs, FC, and proteins create a stable monolayer surface pressure that leads to a distinctive lipoprotein particle size range, shape, and density [10, 11].
Historically, epidemiologic studies correlated the density of lipoproteins with risk for coronary heart and vascular diseases, resulting in the diagnostically convenient classification into high, low, intermediate, and very low density lipoproteins (HDL, LDL, IDL and VLDL), and chylomicrons. These density classes are further divided into sub-classes. Studying the relationships between lipid/protein composition and metabolic functions of lipoprotein sub-classes requires preparative fractionation; resulting in numerous, several fold diluted, size-separated fractions. Developing fit-for-purpose, multiplexed high throughput analytical methods for the characterization of PL composition of lipoproteins is necessary to facilitate these efforts.
The analytical detection of PLs is usually preceded with liquid/liquid extraction protocols [12, 13]. Traditional liquid-liquid extraction protocols by Folch et al. [14] or by Bligh and Dyer [15] use ternary solvent systems of chloroform, methanol, and water (with or without saturated salt). After phase separation, the upper water-rich phase contains extracted polar compounds and the bottom chloroform-rich phase contains lipids and non-polar compounds. The bottom layer has to be removed manually by carefully avoiding picking up the top layer or precipitated proteins from the center. As an alternative, Matyash et al. [16] replaced chloroform with methyl-tert-butyl ether (MTBE), where the lipid containing organic phase is the top layer which can be more conveniently removed. Löfgren et al. [17] suggested a two-step protocol, one-phase extraction with butanol, followed by a two-phase extraction with the addition of heptane and ethyl acetate. Although, these various two-phase extraction methods are universally applicable for total lipid extraction from most biological matrices, they require a substantial amount of specimen and substantial volume of organic solvents, especially in projects involving the extraction of large numbers of samples. A single phase method for serum samples utilized a mix of methanol, MTBE and chloroform (MMC) [18] to precipitate the serum proteins while the lipids remain solubilized in the supernatant. This method provided recovery across multiple lipid classes which was comparable to two-phase extraction methods.
In this report we describe the development of a simple, high-throughput method for small volume samples, where the entire protocol can be performed in a single 96-well plate. This one-pot extraction protocol was used with liquid chromatography and tandem mass spectrometry (LC-MS/MS) detection, based on previous publications [19–22]. We demonstrate the ruggedness of our method by quantification of PLs in 110 size-fractionated serum samples displaying a wide range of total cholesterol (Total-C = FC+CE) and total TG (Total-TG) levels. From each serum sample, 40 monodisperse size fractions were generated in a range of 7–60 nm in hydrodynamic diameter using asymmetric flow field-flow fractionation (AF4) [23]. The PL composition data was examined in relation to FC, CE, and TG content of the fractions revealing structural and metabolic relationships between nonpolar lipids and phospholipids.
2. Methods
2.1. Materials
All organic solvents were HPLC grade. The labeled phospholipids 1-pentadecanoyl-2-oleoyl(16-d2,17-d2,18-d3)-sn-glycero-3-phosphoinositol ammonium salt (15:0 −18:1-d7 PI), 1-pentadecanoyl-2-oleoyl(16-d2,17-d2,18-d3)-sn-glycero-3-phosphoethanolamine (15:0– 18:1-d7 PE), 1-pentadecanoyl-2-oleoyl(16-d2,17-d2,18-d3)-sn-glycero-3-phosphocholine (15:0–18:1-d7-PC), N-oleoyl(15-d2,16-d2,17-d2,18-d3)-D-erythro-sphingosylphosphorylcholine (18:1-d9 SM), 1-oleoyl(16-d2,17-d2,18-d3)-2-hydroxy-sn-glycero-3-phosphocholine (18:1-d7 LPC), and native phosphatidylinositol (PI) purified from soybean were purchased from Avanti Polar Lipids (AL, USA). All isotopically labeled standards had a specified purity of >99% by the manufacturer.
2.2. Serum samples
De-identified serum samples (110 samples) were purchased frozen from Bioreclamation IVT (NY, USA), stored at −80 ⁰C until analysis. Sample collection was conducted in accordance with an IRB approved protocol (WIRB protocol number 20161665). All individual donor samples were viral tested before shipment. After analysis for Total-C and Total-TG levels the samples were grouped into four categories from normolipidemic (n=19), hypercholesterolemic (n=16), hypertriglyceridemic (n=46), and hyperlipidemic donors (n=30) using cut-off values of 230 mg/dL for Total-C and 150 mg/dL for Total-TG.
2.3. Preparation of phospholipid calibrators and quality controls
A calibrator serum pool was prepared from four de-identified serum samples, purchased frozen from Bioreclamation IVT (NY, USA). The dilution series of the calibrator pool was distributed into small aliquots and stored at −70 ⁰C until analysis. The calibrator pool was value assigned by flow-injection DMS-MS/MS analysis using the Sciex Lipidizer platform, consisting of a Sciex 5500 QTrap equipped with a Selexion DMS cell, Shimadzu HPLC system configured for flow-injection, and Sciex Lipidizer software. The results of the DMS-MS/MS analysis (n=5) were used to assign calibrator values for PE, PC, SM, and LPC. The calibrator serum pool was also analyzed by LC-MS/MS along with a solvent standard of the native PI. The result of this analysis (n=5) was used to assign a calibrator value for PI.
2.4. Preparation of internal standard spiking solutions
Internal standards were 15:0–18:1-d7 PI, 15:0–18:1-d7 PE, 15:0–18:1-d7 PC, 18:1-d9 SM, and 18:1-d7 LPC 1 mg/mL in chloroform. An IS containing precipitation solvent was prepared to a concentration of 60 ng/mL 15:0–18:1-d7 PI, 70 ng/mL 15:0–18:1-d7 PE, 600 ng/mL 15:0–18:1-d7 PC, 220 ng/mL 18:1-d9 SM, and 100 ng/mL 18:1-d7 LPC, in a diluent of 70:15:15 Ethanol:MTBE:Dichloromethane.
2.5. Size fractionation of serum lipoproteins
The optimization and validation of the asymmetric flow field-flow fractionation (AF4) method was reported in a previous publication [23]. The AF4 System (AF2000, PostNova Analytics, Salt Lake City, USA) was used with a carrier fluid of 10 mM sodium bicarbonate and 150 mM sodium chloride in deionized water (pH 7.4). Schematic representation of the AF4 channel design is shown in supplementary information, Figure S1. The AF4 method program consisted of a 12 minute injection/focusing step, a 1 minute transition step, a 96 minute elution step, and a 30 minute channel purge. Throughout these steps of the AF4 method, the total flow rate out of the channel was kept constant at 0.4 mL/min, and split into slot and detector flow, with flow rates of 0.3 mL/min and 0.1 mL/min, respectively. The detector outlet was outfitted with a Shimadzu UV detector measuring absorbance at λ=280 nm followed by a flow meter (Elveflow Microfluidics, Paris, France) and finally an automated fraction collector (1260 Infinity, Agilent Technologies, Santa Clara, USA). An 80 μL draw from each serum sample vial was loaded into the 50-μL injection loop. During the 12 min injection/focusing step, 0.2 mL/min tip flow rate, 3.4 mL/min focusing flow rate, and 3.2 mL/min cross flow rate were used with the purge valve open. During the 1 min transition step, the tip flow rate was increased from 0.2 mL/min to 3.6 mL/min, the focusing flow rate was reduced to zero, and a cross flow rate was constant 3.2 mL/min. After closing the purge valve, the elution step followed a power decay program reducing the cross flow rate from 3.2 mL/min to 0.75 mL/min during first 80 minutes, followed by a constant cross flow rate of 0.75 mL/min for the final 16 minutes. A total of 40 fractions were collected at the UV detector outlet (0.1 mL/min); 38 fractions in 2.5 min intervals during the elution step (6–36 nm), and the last 2 fractions in 4 min increments during channel purge (>36 nm). At the end of the elution, the cross flow was turned off completely for 30 minutes with open purge valve and 0.4 mL/min tip flow rate.
2.6. One-pot extraction of phospholipids
The sample preparation was achieved in 500 μL round bottom 96 well-plates (Agilent, polypropylene). Each well contained 20 μL from each AF4 fraction (2 serum sample collections per plate), each of an eight-level calibrator series, a blank, three replicate dilutions of a QC serum pool, and two 1:100 (v/v) dilutions of the un-fractionated unknown whole serum samples in AF4 carrier fluid. To each well 180 μL of the IS containing mix of ethanol, methyl-t-butyl ether and dichloromethane (EtOH/MTBE/DCM) was added. Each plate was vortex-mixed on an orbital shaker at 500 rpm for 2 minutes. Samples were evaporated until dryness with air on a heated analytical evaporator (Glas-Col, Terre Haute, IN) with plate temperature kept at 60 °C. During the typical 20–25 min evaporation time, the actual temperature in the samples, when measured, remained 30–40 °C. After evaporation, 200 μL of reconstitution solvent, consisting of 55:43:2 mix of nonane, isopropanol and water, was added to each well, then mixed on an orbital shaker at 500 rpm for 2 minutes. The plate was sealed with a heat-sealed foil mat and centrifuged for 3 min at 3700 rpm creating an insoluble pellet at the bottom of the wells. The entire extraction protocol was typically less than 40 min, performed simultaneously on 3–4 96-well plates.
2.7. LC-MS/MS analysis of phospholipids
From the supernatant in each well, 5μL was injected into the Acquity UHPLC system (Waters, USA) equipped with a Kinetex HILIC 100Å pore, 2.1×100mm, 1.7μm particle column. The separation was a gradient elution with a flow rate of 0.7 mL/min. Mobile phase A was 99:1 acetonitrile:isopropanol. Mobile phase B was 2.5 mM aqueous ammonium acetate in1:1 acetonitrile:water. The gradient was from 20% B to 50% B over 1.0 minute, held for 0.3 minutes, 50% to 100% B over 0.1 minutes, held for 0.8 minutes, returned to 80% A and 20% B over 0.01 minutes, and held for 0.79 minutes. The total run time was 3.0 minutes. A 6500 Qtrap (Sciex, Framingham, MA) was operated in MRM scanning mode with the TurboSpray IonDrive source (ESI) installed. PI species were monitored in negative ion mode, and the remaining classes were monitored in positive ion mode. Fifteen transitions were monitored for PI, with all product ions being 241 Da. Nineteen transitions were monitored for PE, varying both the precursor and product, and all transitions having a neutral loss of 141 Da. Nineteen transitions were monitored for PC, 18 for SM, and eight for LPC. The common 184 Da product ion was monitored for PC, SM, and LPC. The calibration curve was constructed with the sum of all transitions for each PL class. The list of PL species used for quantification is shown in Table S1. A typical batch consisted 112 injections including a blank, calibration series, QCs at 3 levels (low, mid, high), diluted whole serum samples and corresponding AF4 fractions. Standards were run in duplicate, while QCs and diluted whole serum samples in triplicate.
2.8. Other lipid extraction methods for comparison
The two-phase Bligh & Dyer extraction [15] was modified using DCM instead of chloroform for safety reasons. A 20 μL diluted plasma aliquot was placed into a 10-mL glass centrifuge tube, then 0.9 mL water, 2.0 mL methanol, and 0.9 mL DCM were added. The sample was vortexed, then methanol was added in 50 μL increments until a single liquid phase was observed. The samples were then allowed to stand on the bench for 30 minutes. Then to each sample 1.0 mL water and 0.9 mL DCM was added. Samples were gently mixed and then centrifuged at 1200 rpm for 10 minutes. The bottom layer was removed and transferred to a glass test tube. An additional 1.8 mL DCM was added to the extraction tubes, gently mixed, and centrifuged. The bottom layer was removed and combined with the initially recovered DCM bottom layer. The combined DCM extract was evaporated to dryness under nitrogen at 30°C. For compatibility with our chromatographic system, the extract was reconstituted in 55:43:2 mix of nonane, isopropanol and water.
We also replicated a published single-phase extraction protocol [18], utilizing methanol, MTBE and chloroform with 4:3:3 ratios (MMC method). The solvent volumes were scaled in proportion to our 20 μL diluted sample volume. To each 20 μL sample in a glass centrifuge tube, 400 μL of extraction solvent was added, and the tube was vortexed for 30 s, shaken for 20 minutes at 1000 rpm, then centrifuged at 3000 rpm for 5 minutes. The supernatant was transferred to a glass test tube and evaporated to dryness under nitrogen at 30°C. For compatibility with our chromatographic system, the extract was reconstituted in a 55:43:2 mix of nonane, isopropanol and water.
2.9. Determination of extraction recovery
Extraction recoveries were assessed on the basis of IS peak area and native-PL/IS-PL response ratio (RR) measurements at three dilution levels. At each of the three dilution levels, two sets of samples were prepared. To one of the sets, the internal standard was added before, yielding RRIS_added_before. To the other set, the internal standard was added after sample preparation, yielding RRIS_added_ after. Assuming similar recoveries for the endogenous native PLs and the IS, when spiked in before sample preparation, the recoveries were calculated by RRIS_added_ after/RRIS_added_before.
2.10. Other methods
The complete workflow is shown in Figure 1. The average hydrodynamic size in each fraction was determined based on AF4 retention time and dynamic light scattering (DLS) measurements using a Dynapro plate reader (Wyatt Technologies, USA). The fractions and diluted serum samples were also analyzed for FC, CE and TG content using a mass spectrometry based method as reported previously [24]; repeated analysis of a quality control pool showed intra-day CV of 5–6% (n=2) and inter-day CV of 8–10% (n=17).
Figure 1.
Workflow for size fractionation, size measurement and lipid analysis of lipoprotein fractions.
2.11. Data processing
LC-MS/MS data was processed using Multiquant (Sciex, Framingham, MA). The MRM chromatogram peak areas of the individual species were summed by PL class, and each PL class concentration was calculated using Multiquant software functions. All concentrations and hydrodynamic size in each fraction were compiled in one data base using JMP (SAS Institute, USA).
3. Results and Discussion
3.1. Optimization of the one-pot phospholipid extraction
Protein precipitation is a common cleanup step prior to extraction and LC-MS/MS analysis of small molecules from biological samples. After protein precipitation, remaining phospholipids in the supernatant are often considered undesirable as they are thought to cause ionization suppression during LC-MS/MS analysis of small molecules; in these cases, organic solvents for protein precipitation are selected based on their ability to minimize the solubility of phospholipids [25, 26]. However, because our goal was the analysis of the phospholipids, we selected organic solvents to maximize the solubility of phospholipids. DCM and MTBE are known to be efficient lipid solvents. The majority of phospholipid classes also have a good solubility in ethanol. Sufficient volume of ethanol mixed with DCM, MTBE, and water gave a single liquid phase. We also considered the volatility of the organic solvents to minimize evaporation times, concerned that extended evaporation times increase the probability of the oxidation of unsaturated fatty acyl moieties.
In order to achieve the optimal combination of solvent mix for protein precipitation, evaporation, and reconstitution from the dry pellet, we performed a design-of-experiment (DOE) optimization. Following a 12 experiment design constructed with the DOE function in the statistical software package (JMP®), we systematically varied the percent of ethanol, MTBE, and DCM in the protein precipitation step, while keeping 49:49:2 nonane:isopropanol:water ratio constant in the reconstitution step. The MTBE and DCM concentrations were each limited to 20% to prevent organic/aqueous phase separation. The DOE optimization yielded maximum percent recovery of total phospholipid at optimum solvent composition of 70:10:20 EtOH:MTBE:DCM. This composition was similar to the one previously found optimal for nonpolar lipids (FC, CE and TG) [24]. Because both polar phospholipid and non-polar lipid analysis are routinely performed on the same set of serum samples in our laboratory, we chose a mix of 70:15:15 EtOH:MTBE:DCM which yielded acceptable analyte recoveries in both methods (70–80%).
Without transferring the supernatant, the precipitated samples were evaporated to dry pellets in the same well. Complete evaporation was important for controlling the injection solvent composition and maintaining consistent HILIC column retention and peak shape. Removal of the plates from heat immediately upon drying was important to minimize oxidation of unsaturated fatty acyl moieties. Samples were evaporated under a stream of air on a 60 °C heating plate for approximately 20 min until dryness was observed by visual inspection. The temperature of selected sample wells were monitored during a typical evaporation step by placing a Type K thermocouple at the bottom of the well. Although the heating plate of the analytical evaporator was held at 60 °C, the actual temperature in the samples remained between 30 °C and 40 °C during the entire process. Although nitrogen is more commonly utilized in lipid analysis to minimize oxidation, we used dry air. We evaluated the observed differences in our analytes using nitrogen for evaporation versus air on six randomly selected whole plasma samples analyzed in replicate (n=5). On the basis of area ratio, differences were mostly not significant (within one standard deviation). Data shown in Supplementary Information Figure S2.
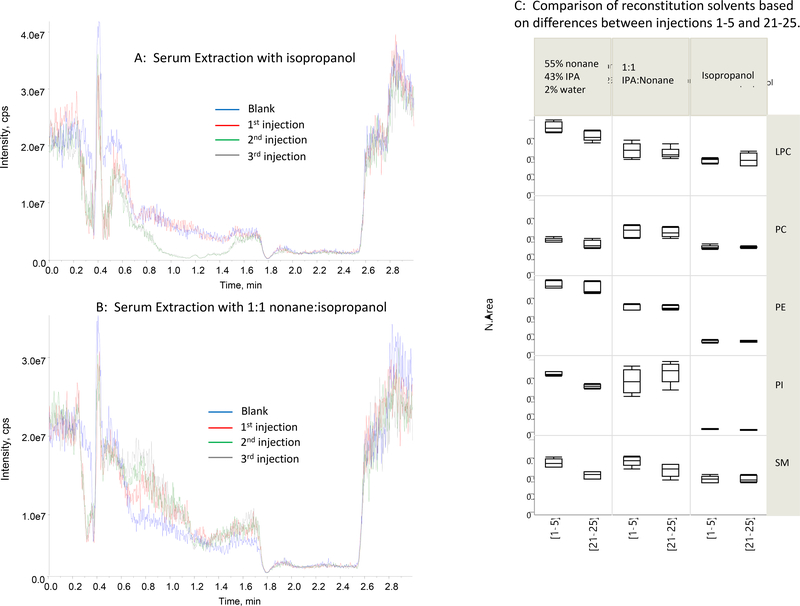
After reconstitution of lipids from the dry pellets, the well-plates were centrifuged, and 5 μL of the supernatant was injected into the LC-MS system. In order to test for the effect of co-extractives on the ionization of PLs in the LC-MS interface during the solvent gradient run, we continuously post-column infused the internal standard mix and monitored the corresponding MRM signal while injecting either a solvent blank or serum extracts [27]. In Figure 2A and 2B, the MRM profiles from the infusion of 15:0–18:1-d7 PC during three consecutive serum extract injections are shown, and compared to the MRM profile during injection of the solvent blank. In addition to IS infusion experiments, we extracted the same plasma pool using three different reconstitution solvents and injected the extracts 25 times, monitoring peak area counts for the endogenous LPC, PC, PE, PI and SM. Injections 1–5 versus 21–25 are compared in Figure 2C.
Figure 2.
Effect of co-extractives on the ionization of post-column infused 15:0–18:1-d7 PC. A: Samples were prepared by protein precipitation with 70:15:15 ethanol:MTBE:DCM, evaporation under air, and extraction with isopropanol. B: precipitation with 70:15:15 ethanol:MTBE:DCM, evaporation, and reconstitution in 1:1 nonane:isopropanol. Colors: Blue = Blank; Red = 1st injection of serum extract; Green = 2nd injection of serum extract; Gray = 3rd injection of serum extract. C: Comparison of normalized peak area for reconstitution solvents based on differences between injections 1–5 and 21–25.
During the post-column infusion of 15:0–18:1-d7 PC while injecting from isopropanol-only extracts (Figure 2A), we observed substantial suppression of the 15:0–18:1-d7 PC signal in the 0.2 to 0.5 minute range, where PI eluted. During the second and third injections from the isopropanol extract, significant suppression was observed also in the 0.8 and 1.6 minutes range, bracketing the retention times of PE, PC, SM, and LPC. The native PL signal intensities (Figure 2C) were generally suppressed also but did not change significantly after 25 consecutive injections.
On the contrary, when using 1:1 nonane:isopropanol extracts while post-column infusing 15:0–18:1-d7 PC, the profiles from the three consecutive serum extract injections all looked similar to the solvent blank, as well as to one another. The native LPC, PC, PE, PI and SM signals also remained constant after 25 injections (Figure 2C). Suppression was still evident for PI, but the effect was relatively constant. Therefore, the presence of nonane and isopropanol was essential for selective reconstitution of PLs from the dry pellets.
Separation in HILIC mode usually requires a minimum water content in the eluent. We also found that the presence of minimal water in the LC eluent was necessary to achieve stable LC retention times. According to literature data [28], 4% water, 55% nonane and 41% isopropanol could be used without phase separation. Within these constraints, a greater percent of nonane and water in the extraction solvent improved LC-MS/MS performance. We speculate that nonane improved the solubility and extraction recovery of the less polar phospholipids, such as PI and PE, while water formed an immiscible water-rich layer on the bottom of the well, causing polar co-extractives to partition into this layer.
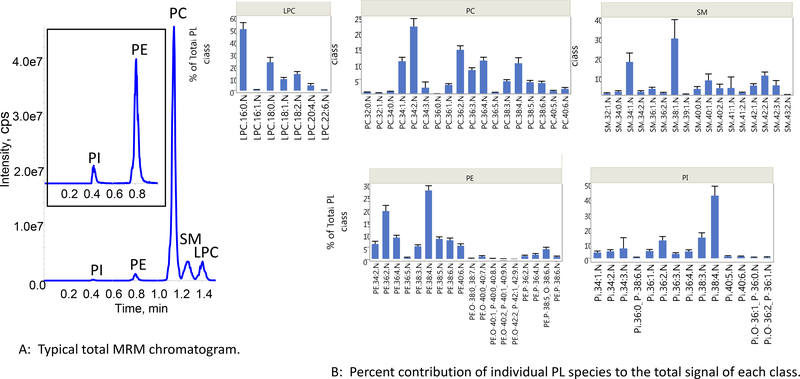
By performing an additional round of optimization using DOE, as mentioned previously, we found the optimum reconstitution/injection solvent to be 2% water, 43% IPA, 55% nonane. The superiority of using this solvent mix over isopropanol-only became most evident after trying to analyze 100–300 samples daily in continuous overnight runs with normal QC failure rates. With this sample load, the LC columns typically had to be replaced after ~2000 injections. A typical total ion chromatogram obtained with the final method is shown in Figure 3A, along with bar graphs showing the percent contribution of the individual lipid species to the total of each PL class (3B). The internal standard peak areas from the quality control serum pool had 15–20% CVs. Interestingly, the internal standard signal intensities from the diluted serum aliquots, compared to the spiked solvent blank, were 10–30% higher in intensity. The salts and proteins in the serum and pellet after evaporation may have enhanced the partitioning of PLs into the supernatant while retaining polar co-extractives in the pellet, an effect that is lacking in pure solvent.
Figure 3:
(A) Typical total MRM chromatogram of phospholipid classes; (B). Bar graphs showing percent contribution of individual PL species to the total signal of each PL class.
3.2. Extraction recovery, reproducibility, precision and sample stability
Extraction recoveries were assessed on the basis of IS peak area and native-PL/IS-PL response ratio (RR) measurements at three dilution levels where the internal standard was added before and after sample preparation (protein precipitation, evaporation, and extraction). The recoveries calculated from the internal standard peak areas ranged between 75–90% (before/after). The recoveries calculated from the ratio of the response ratios, RRIS_added_ after/RRIS_added_before ranged between 87 to 111%. Recoveries for SM tended to be 5–10% lower than other PL classes at all dilution levels (primarily originating from the high concentration SM species), while PCs and PEs were higher than 100% in the 400x and 1400x diluted (v/v) serum samples (originating from the low concentration species).
The accuracy of the back calculated phospholipid class concentrations are summarized in Table 2. The reproducibility of the concentration measurements were evaluated by duplicate analysis of the quality control serum pool at three dilution levels over 30 days, summarized in Table 2. With consideration of the lowest calibrator concentration, back-calculated concentration accuracy and the reproducibility, whichever were the highest, the lowest limits of quantification (LLOQ) were the following: PC, 368 nM; SM, 81 nM; PE, 29 nM; LPC, 370 nM; and PI, 9 nM. The diluted calibrator series (or samples and fractions) could be stored in 5°C refrigerator for up to 6 days and at −80°C freezer for over one year without significant effect on accuracy. However, the isopropanol/nonane extracts were stable in the 5°C refrigerator or 8°C autosampler for only 2 days, mainly due to evaporation.
Table 2.
The mean accuracy (and SD) of the calculated phospholipid concentrations in the calibrator serum pool over 30 days at 8 dilution levels, and mean measured concentration (and coefficient of variation) in the quality controls over 30 days at three dilution levels.
| Calibration Series Accuracy (%) of Calculated Concentration (SD) | Quality Control Pool Mean (CV (%)) (μM) | ||||||||||
|---|---|---|---|---|---|---|---|---|---|---|---|
| Dilution (v/v) | Dilution (v/v) | ||||||||||
| 25x | 50x | 100x | 222x | 500x | 1078x | 2155x | 4310x | 1400x | 400x | 100x | |
| PC | 99 (6) | 101 (9) | 103 (13) | 105 (15) | 100 (17) | 89 (24) | 76 (44) | 57 (96) | 2186 (21%) | 1901 (8%) | 1935 (5%) |
| LPC | 98 (9) | 101 (11) | 101 (11) | 106 (11) | 105 (16) | 100 (25) | 94 (49) | 171 (98) | 408 (14%) | 290 (6%) | 316 (9%) |
| SM | 98 (7) | 105 (11) | 104 (13) | 99 (15) | 88 (17) | 85 (22) | 108 (67) | 98 (101) | 465 (18%) | 414 (10%) | 419 (7%) |
| PE | 97 (22) | 103 (20) | 106 (19) | 106 (22) | 97 (27) | 85 (34) | 74 (50) | 75 (97) | 149 (15%) | 142 (10%) | 150 (9%) |
| PI | 96 (9) | 103 (14) | 105 (19) | 108 (25) | 99 (33) | 80 (49) | 60 (98) | 47 (237) | 50 (12%) | 45 (6%) | 48 (6%) |
3.3. The effect of sample dilution on the species composition of phospholipid classes
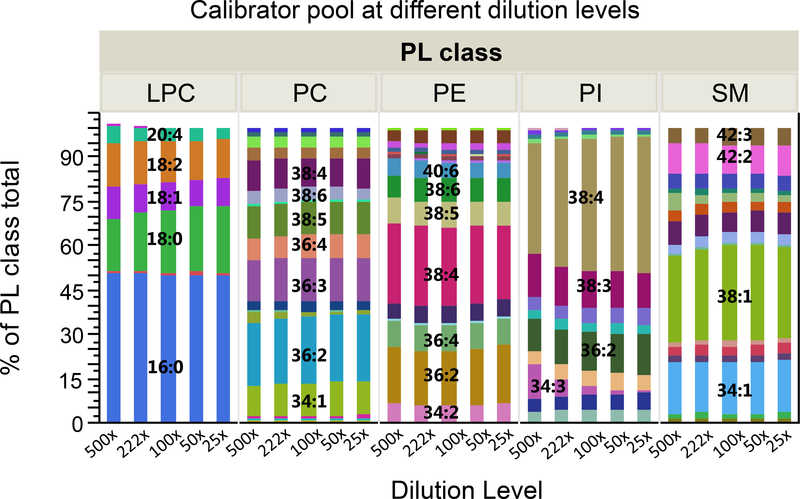
The non-targeted quantification approach of lipids is based on the assumption that the sum of the MRM peak areas of individual species is the measure of the total concentration by lipid class, and not affected by species composition. In addition to the presumptive similar ionization efficiency in the LC-MS interface, all species within a lipid class are assumed to be extracted with an equal percentage recovery, regardless of absolute concentration. To confirm this, the MRM peak areas were normalized with the corresponding sum of the peak areas for each PL class at each dilution level of the calibrator pool. Graphical representation of the results in Figure 4 shows a <10% average difference between dilution levels for most of the species within the PL classes, except for PIs due to its generally low concentration in the most diluted calibrators.
Figure 4.
The effect of dilution on the species composition of phospholipid classes in the calibrator serum pool, on the basis of relative peak areas by phospholipid class. The graph is based on average of duplicate injections of serum calibrators in 20 runs.
3.4. Comparison to other lipid extraction methods
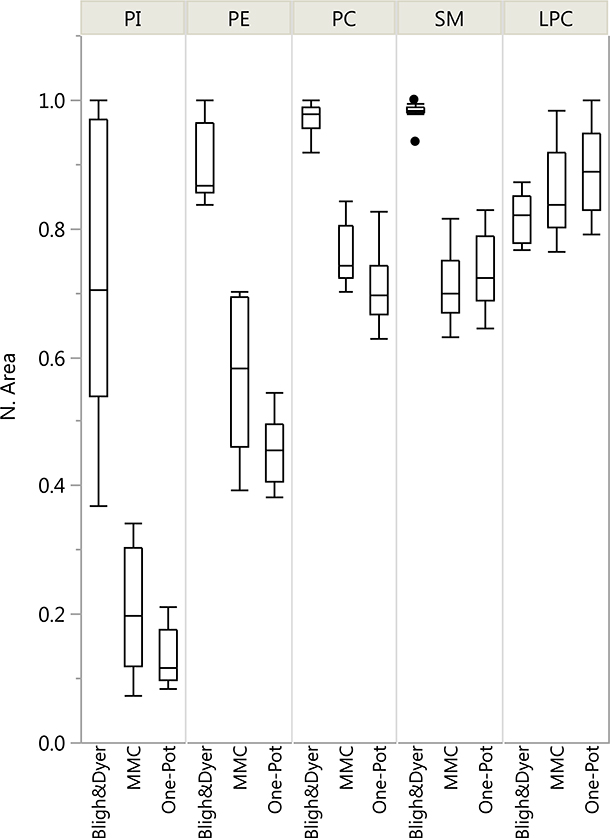
The main advantage of our method over traditional lipid extraction methods is simplicity and throughput. To achieve high throughput and LC-MS ruggedness we had to sacrifice some on extraction recovery. To assess this quantitatively, we performed experiments for comparison with other reported methods. Using 20 μL aliquots of a diluted plasma sample (1:100 (v/v) in AF4 carrier fluid), the extractions were performed by a two-phase (Bligh-Dyer) [15] method and a one-phase (MMC) [18] method, as described in the Methods section. The absolute recoveries were expressed as mean area counts normalized by the maximum in in each PL class (n=10). As shown in Figure 5 and in Table 3, the two-phase extraction gave significantly better signal intensities than the two one-phase extraction methods (MMC and one-pot), except for LPC. However, in terms of reproducibility the three methods were comparable. Any accuracy bias from lack of recovery is automatically corrected by using external calibration, where all calibrators go through the same extraction protocol as the unknowns.
Figure 5.
Mean peak area of recovered phospholipids for three extraction methods: Bligh-Dyer, MMC and one-pot methods
Table 3.
Single-Phase Extraction Recoveries Relative to Modified Bligh & Dyer Extraction.
| Lipid Class | Recovery (%) (SD) relative to Bligh&Dyer | |
|---|---|---|
| MeOH:MTBE:chloroform 4:3:3 (n=10) | EtOH/MTBE/DCM 70:15:15 (n=10) | |
| PI | 28.3 (13.5) | 18.1 (6.3) |
| PE | 63.2 (13.5) | 51.0 (5.7) |
| PC | 78.0 (4.8) | 72.8 (6.4) |
| SM | 72.5 (5.9) | 75.0 (6.0) |
| LPC | 104.2 (8.7) | 108.5 (8.5) |
3.5. Application to measurement of phospholipid composition of lipoprotein fractions from serum samples grouped by Total-C and Total-TG levels
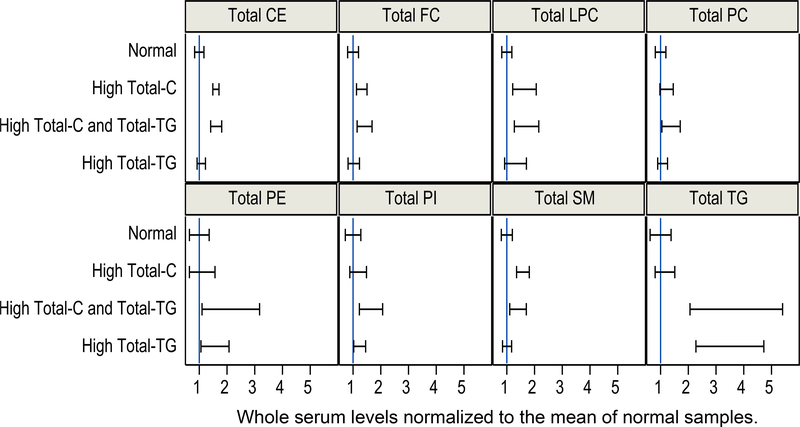
Total cholesterol (Total-C) and total TG (Total-TG) were measured in 100 diluted serum samples using our previously published method for non-polar lipids [24]. Samples were grouped into the following clinically relevant categories: normolipidemic (NL, Total-C<230 mg/dL and Total-TG<150 mg/dL), hypercholesteremic (HC, Total-C>230 mg/dL and Total-TG<150 mg/dL), hyperlipidemic (HL, Total-C>230 mg/dL and Total-TG>150 mg/dL), and hypertriglyceridemic (HT, Total-C<230 mg/dL and Total-TG>150 mg/dL). The corresponding concentration ranges of PL classes in whole serum are summarized in Table S3. By design, these sample groups had significant differences for nonpolar lipids, however significant differences were also observed in the measured total phospholipids (Figure 6). Furthermore, there was significant pairwise correlation among total, unfractionated sample concentrations: PE with TG, LPC with CE, and SM with both FC and CE (Figure S3).
Figure 6.
Comparison of whole serum levels of measured lipid classes divided by the mean of normal samples. Error bars indicate SD of the mean.
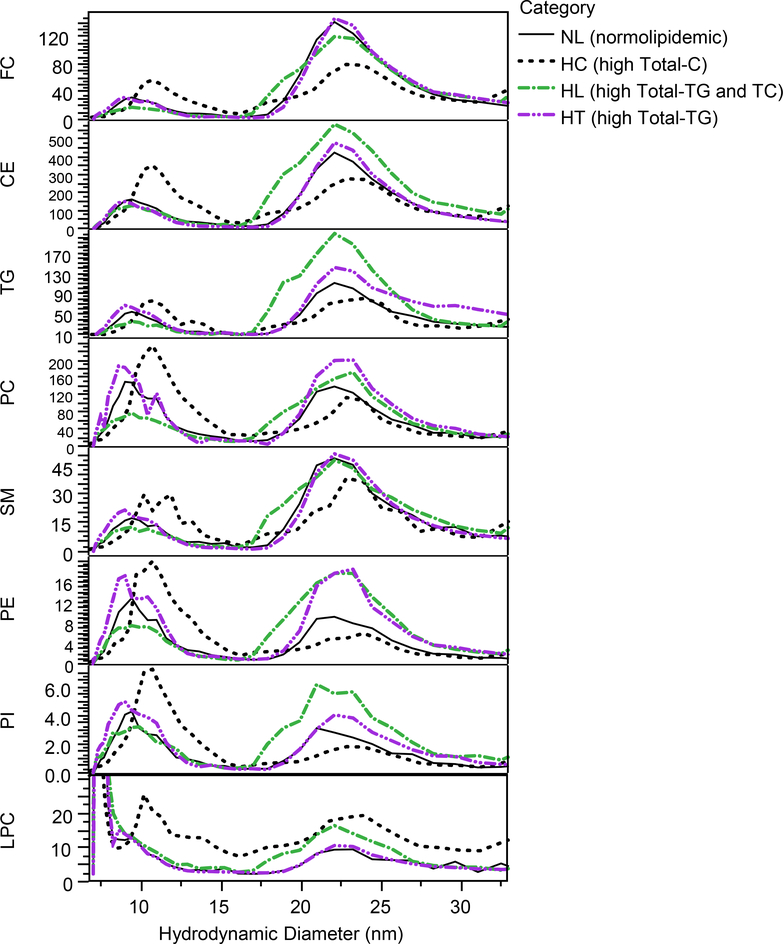
In addition to the total serum concentration measurements, the method was also applied to the measurement of polar lipids in size-fractionated lipoproteins. Examples of concentration profiles of the measured lipid constituents as a function of size for samples selected from four different categories (NL, HC, HL and HT) are shown in Figure 7. The differences in distribution of PLs in size fractions of lipoproteins between sample categories demonstrate the heterogeneous nature of HDL (7–15 nm) and LDL (18–30 nm). For example, in this case the hyperlipidemic sample has a greater abundance of small LDL in the 18–20 nm range than the other samples depicted, while the hypercholesterolemic sample has a larger overall size distribution of HDL.
Figure 7.
Overlay of lipid class concentrations profiles in fractions (μM) for selected individual samples from different sample categories: normolipidemic (NL), high Total-C (HC), high Total-C/Total-TG (HC/HT), and high Total-TG (HT) using 230 mg/dL Total-C and 150 mg/dL total-TG cutoff values.
In most lipidomics studies the absolute concentration of lipids are reported [2]. These absolute concentration levels are dependent both on the number and composition of particles (HDL, LDL and VLDL). However, we gain some insights about the composition of lipoprotein particles, independently from particle numbers, by calculating molar ratios such as FC/PL, SM/PL, PE/PL, PI/PL and LPC/PL, where PL in the denominator is the total concentration of all measured PLs (PC+SM+PE+LPC+PI). Across individual samples, SM/PL ratios in the LDL fractions positively correlated with FC/PL but negatively with PE/PL ratios (Figure S4). In the same fractions, the correlation of LPC/PL and PI/PL with ratios of FC/PL, SM/PL and PE/PL were weaker but significant. These correlations are consistent with previous studies [6, 10] and indirectly demonstrate the comparable accuracy of our non-polar lipid and PL measurements.
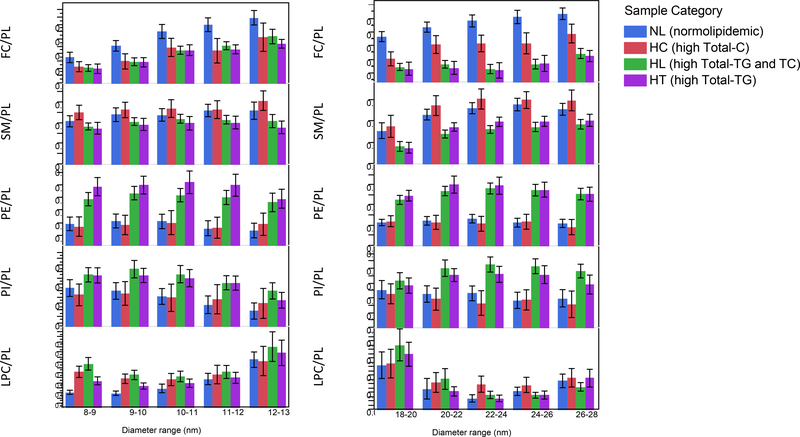
Sample groups with high Total-TG (HL and HT) had lower FC/PL and SM/PL ratios and higher PE/PL ratios both in HDL and LDL fractions (Figure 8). There was also significant correlation of TG/CE ratios with FC/PL, SM/PL and LPC/PL (Figure S4), suggesting a metabolic link between the non-polar lipid core and PL monolayer composition of lipoprotein particles. This link is interesting in view of monolayer studies that related the PL composition to the physicochemical characteristics of PL monolayers, surface pressure and fluidity. Furthermore, lower surface pressure was related to the enhanced penetrability of the PL monolayer by apolipoproteins. For example, in case of pure phospholipid films the order of penetrability was PE>PC>SM>LPC by apolipoproteins such as apoCs and apoE [6, 10, 29]. These apolipoproteins are known to regulate the activity of lipase enzymes, transfer proteins and cellular receptors [30–32]. Therefore, FC/PL, SM/PL, PE/PL and TG/CE molar ratios in HDL, LDL and VLDL are informative measures for more complete characterization and understanding of lipid metabolism related disease states.
Figure 8.
Comparison of lipid ratios as a function of hydrodynamic diameter in different sample categories. Samples were categorized using 230 mg/dL Total-C and 150 mg/dL Total-TG cut-off values: normal (NL), high Total-C (HC), high Total-C/Total-TG (HL), and high Total-TG (HT).
3.6. Phospholipid species composition of lipoprotein fractions
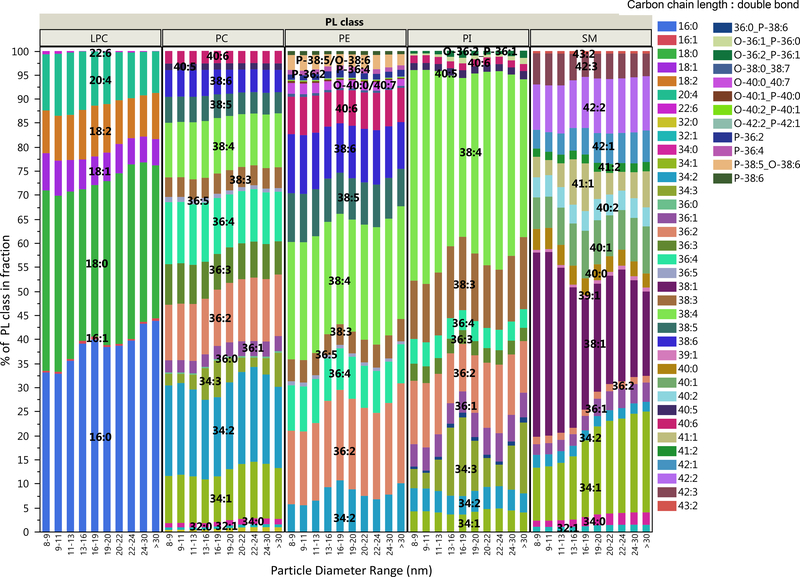
The non-targeted quantification PL classes also allows relative assessment PL species composition (carbon chain length and number of double bounds). We examined the species composition differences within PL classes in the HDL and LDL fractions. As shown in Figure 9, most PL species showed <15% differences in their contribution to the sum of their corresponding PL classes, in range of method variability. Differences of >15% were only seen in the low concentration fractions from 16–20 nm, where method variability is expected to be higher as well. Therefore, these differences do not significantly affect the accuracy of the total PL class measurements.
Figure 9.
Comparison of average phospholipid species composition in lipoprotein fractions.
However, on the scales of individual species concentrations, the differences between lipoprotein fractions showed significant trends as a function of lipoprotein size (Figure 9). Most strikingly, HDL fractions contained a significantly higher percent of 38:1 SM and lower percent of 34:1 SM relative to LDL fractions. HDL fractions also contained higher percent of 20:4 LPC. In both HDL and LDL fractions, the most prominent PE and PI species were 38:4, confirming the enrichment of 20:4 arachidonic acid derivatives as observed in other studies [33]. Discriminant analysis of the percent contribution of individual species to corresponding PL classes by sample categories and by size fractions showed that the most significant difference was the higher abundance of polyunsaturated 36:5, 38:5 and 38:6 PCs in LDL fractions from normolipidemic samples (NL). Interestingly, in samples with normal Total-TG levels (NL and HC), where PE/PL molar ratios in the size fractions were significantly lower, we observed significantly higher abundance of ether PEs, shown in Figure S5. In these ether PEs the alkyl group in the sn-1 position, with typically polyunsaturated carbon chains, are connected to the glycerol backbone through an ether bond instead of an ester bond. Plasmalogen PEs, where the ether bond is connected to an alkenyl moiety, have a demonstrated protective role against reactive oxygen species [34]. Unfortunately, several other PEs had identical (isobaric) molecular masses with ester PEs and could not be differentiated by our HILIC separation and MRM based detection, highlighting the limitations of our method.
4. Conclusions
The main contribution from this work was the demonstration of a high throughput simple “one-pot” extraction protocol for the quantitative LC-MS/MS analysis of main phospholipid classes that are present in lipoproteins, PC, SM, PE, LPC and PI. The accuracy and precision of the method allows high throughput analysis of small volumes of diluted serum samples or lipoprotein fractions, which is highly important for the analysis of a large number of precious archived samples from longitudinal studies. Developing risk models that include metabolically relevant lipoprotein composition measures such as FC/PL, SM/PL and PE/PL ratios has the potential to significantly improve the diagnosis and more targeted treatment of lipid metabolism related diseases.
Supplementary Material
Table 1.
Recovery of phospholipid classes from diluted serum samples prepared in triplicate and run in duplicate LC-MS/MS runs.
| Phospholipid Class | n | Recovery (%) calculated from IS peak areas (IS added before)/(IS added after) | Recovery (%) calculated from area ratios (IS added after)/(IS added before) | ||||
|---|---|---|---|---|---|---|---|
| 100x | 400x | 1400x | 100x | 400x | 1400x | ||
| LPC | 3 | 82% | 90% | 84% | 95% | 105% | 98% |
| PC | 3 | 83% | 90% | 92% | 99% | 108% | 111% |
| PE | 3 | 81% | 90% | 87% | 94% | 104% | 102% |
| PI | 3 | 82% | 89% | 86% | 90% | 100% | 94% |
| SM | 3 | 75% | 75% | 75% | 87% | 87% | 88% |
Footnotes
Conflict of Interest
None.
Appendix A. Supplementary data
Disclaimer
The findings and conclusions in this report are those of the authors and do not necessarily represent the official position of the Centers for Disease Control and Prevention. Use of trade names and commercial sources is for identification only and does not constitute endorsement by the U.S. Department of Health and Human Services, or the U.S. Centers for Disease Control and Prevention.
References
- [1].Ramasamy I, Recent advances in physiological lipoprotein metabolism, Clinical Chemistry and Laboratory Medicine, 52 (2014) 1695–1727. [DOI] [PubMed] [Google Scholar]
- [2].Brown JM, Hazen SL, Seeking a unique lipid signature predicting cardiovascular disease risk, Circulation, 129 (2014) 1799–1803. [DOI] [PMC free article] [PubMed] [Google Scholar]
- [3].Valiakhmetov AY, Membrane geometry and protein functions, Biochemistry (Moscow) Supplement Series A: Membrane and Cell Biology, 2 (2008) 83–95. [Google Scholar]
- [4].Brown MF, Curvature forces in membrane lipid-protein interactions, Biochemistry, 51 (2012) 9782–9795. [DOI] [PMC free article] [PubMed] [Google Scholar]
- [5].Phillips MC, Molecular Mechanisms of Cellular Cholesterol Efflux, Journal of Biological Chemistry, 289 (2014) 24020–24029. [DOI] [PMC free article] [PubMed] [Google Scholar]
- [6].Ohvo-Rekilä H, Ramstedt B, Leppimäki P, Peter Slotte J, Cholesterol interactions with phospholipids in membranes, Progress in Lipid Research, 41 (2002) 66–97. [DOI] [PubMed] [Google Scholar]
- [7].Hamai C, Yang TL, Kataoka S, Cremer PS, Musser SM, Effect of average phospholipid curvature on supported bilayer formation on glass by vesicle fusion, Biophysical Journal, 90 (2006) 1241–1248. [DOI] [PMC free article] [PubMed] [Google Scholar]
- [8].Meyers NL, Larsson M, Olivecrona G, Small DM, A pressure-dependent model for the regulation of lipoprotein lipase by apolipoprotein C-II, Journal of Biological Chemistry, 290 (2015) 18029–18044. [DOI] [PMC free article] [PubMed] [Google Scholar]
- [9].Mitsche MA, Small DM, Surface pressure-dependent conformation change of apolipoprotein-derived amphipathic alpha-helices, Journal of Lipid Research, 54 (2013) 1578–1588. [DOI] [PMC free article] [PubMed] [Google Scholar]
- [10].Ibdah JA, Lund-Katz S, Phillips MC, Molecular packing of high-density and low-density lipoprotein surface lipids and apolipoprotein A-I binding, Biochemistry, 28 (1989) 1126–1133. [DOI] [PubMed] [Google Scholar]
- [11].Chièze L, Bolanos-Garcia VM, Le Caër G, Renault A, Vié V, Beaufils S, Difference in lipid packing sensitivity of exchangeable apolipoproteins apoA-I and apoA-II: An important determinant for their distinctive role in lipid metabolism, Biochimica et Biophysica Acta - Biomembranes, 1818 (2012) 2732–2741. [DOI] [PubMed] [Google Scholar]
- [12].Reis A, Rudnitskaya A, Blackburn GJ, Fauzi NM, Pitt AR, Spickett CM, A comparison of five lipid extraction solvent systems for lipidomic studies of human LDL, Journal of Lipid Research, 54 (2013) 1812–1824. [DOI] [PMC free article] [PubMed] [Google Scholar]
- [13].Cajka T, Fiehn O, Comprehensive analysis of lipids in biological systems by liquid chromatography-mass spectrometry, Trends in Analytical Chemistry, 61 (2014) 192–206. [DOI] [PMC free article] [PubMed] [Google Scholar]
- [14].Folch J, Lees M, Sloane Stanley GH, A simple method for the isolation and purification of total lipides from animal tissues, The Journal of biological chemistry, 226 (1957) 497–509. [PubMed] [Google Scholar]
- [15].Bligh EG, Dyer WJ, A rapid method of total lipid extraction and purification, Canadian journal of biochemistry and physiology, 37 (1959) 911–917. [DOI] [PubMed] [Google Scholar]
- [16].Matyash V, Liebisch G, Kurzchalia TV, Shevchenko A, Schwudke D, Lipid extraction by methyl-terf-butyl ether for high-throughput lipidomics, Journal of Lipid Research, 49 (2008) 1137–1146. [DOI] [PMC free article] [PubMed] [Google Scholar]
- [17].Löfgren L, Ståhlman M, Forsberg GB, Saarinen S, Nilsson R, Hansson GI, The BUME method: A novel automated chloroform-free 96-well total lipid extraction method for blood plasma, Journal of Lipid Research, 53 (2012) 1690–1700. [DOI] [PMC free article] [PubMed] [Google Scholar]
- [18].Pellegrino RM, Di Veroli A, Valeri A, Goracci L, Cruciani G, LC/MS lipid profiling from human serum: a new method for global lipid extraction, Analytical and Bioanalytical Chemistry, 406 (2014) 7937–7948. [DOI] [PubMed] [Google Scholar]
- [19].Cífková E, Holčapek M, Lísa M, Ovčačíková M, Lyčka A, Lynen F, Sandra P, Nontargeted quantitation of lipid classes using hydrophilic interaction liquid chromatography-electrospray ionization mass spectrometry with single internal standard and response factor approach, Analytical Chemistry, 84 (2012) 10064–10070. [DOI] [PubMed] [Google Scholar]
- [20].Holčapek M, Lísa M, Jandera P, Kabátová N, Quantitation of triacylglycerols in plant oils using HPLC with APCI-MS, evaporative light-scattering, and UV detection, Journal of Separation Science, 28 (2005) 1315–1333. [DOI] [PubMed] [Google Scholar]
- [21].Postle AD, Hunt AN, Dynamic lipidomics with stable isotope labelling, Journal of Chromatography B: Analytical Technologies in the Biomedical and Life Sciences, 877 (2009) 2716–2721. [DOI] [PubMed] [Google Scholar]
- [22].Wiesner P, Leidl K, Boettcher A, Schmitz G, Liebisch G, Lipid profiling of FPLC-separated lipoprotein fractions by electrospray ionization tandem mass spectrometry, Journal of Lipid Research, 50 (2009) 574–585. [DOI] [PubMed] [Google Scholar]
- [23].Kuklenyik ZG, M. S.; Parks B; Schieltx DM; Rees JC; Mcwilliams LG; Williamson YM; Pirkle JL; and Barr JR;, Multivariate DoE Optimization of Asymmetric Flow Field Flow Fractionation Coupled to Quantitative LC-MS/MS for Analysis of Lipoprotein Subclasses, Chromatography - Open access, 2 (2015) 96–117. [Google Scholar]
- [24].Gardner MS, McWilliams LG, Jones JI, Kuklenyik Z, Pirkle JL, Barr JR, Simultaneous Quantification of Free Cholesterol, Cholesteryl Esters, and Triglycerides without Ester Hydrolysis by UHPLC Separation and In-Source Collision Induced Dissociation Coupled MS/MS, Journal of The American Society for Mass Spectrometry, DOI 10.1007/s13361-017-1756-2(2017). [DOI] [PMC free article] [PubMed] [Google Scholar]
- [25].Little JL, Wempe MF, Buchanan CM, Liquid chromatography–mass spectrometry/mass spectrometry method development for drug metabolism studies: Examining lipid matrix ionization effects in plasma, Journal of Chromatography B, 833 (2006) 219–230. [DOI] [PubMed] [Google Scholar]
- [26].Bylda C, Thiele R, Kobold U, Volmer DA, Recent advances in sample preparation techniques to overcome difficulties encountered during quantitative analysis of small molecules from biofluids using LC-MS/MS, Analyst, 139 (2014) 2265–2276. [DOI] [PubMed] [Google Scholar]
- [27].Bonfiglio R, King RC, Olah TV, Merkle K, The effects of sample preparation methods on the variability of the electrospray ionization response for model drug compounds, Rapid Communications in Mass Spectrometry, 13 (1999) 1175–1185. [DOI] [PubMed] [Google Scholar]
- [28].Skrzecz A, Shaw D, Maczynski A, Skrzecz A, IUPAC-NIST solubility data series 69. Ternary alcohol-hydrocarbon-water systems, Journal of Physical and Chemical Reference Data, 28 (1999) 983–992. [Google Scholar]
- [29].Noga AA, Zhao Y, Vance DE, An unexpected requirement for phosphatidylethanolamine N-methyltransferase in the secretion of very low density lipoproteins, Journal of Biological Chemistry, 277 (2002) 42358–42365. [DOI] [PubMed] [Google Scholar]
- [30].MacRaild CA, Howlett GJ, Gooley PR, The structure and interactions of human apolipoprotein C-II in dodecyl phosphocholine, Biochemistry, 43 (2004) 8084–8093. [DOI] [PubMed] [Google Scholar]
- [31].Jackson RL, Balasubramaniam A, Murphy RF, Demel RA, Interaction of synthetic peptides of apolipoprotein C-II and lipoprotein lipase at monomolecular lipid films, Biochimica et Biophysica Acta (BBA)/Lipids and Lipid Metabolism, 875 (1986) 203–210. [DOI] [PubMed] [Google Scholar]
- [32].Smith LE, Segrest JP, Davidson WS, Helical domains that mediate lipid solubilization and ABCA1-specific cholesterol efflux in apolipoproteins C-I and A-II, Journal of Lipid Research, 54 (2013) 1939–1948. [DOI] [PMC free article] [PubMed] [Google Scholar]
- [33].Harkewicz R, Fahy E, Andreyev A, Dennis EA, Arachidonate-derived dihomoprostaglandin production observed in endotoxin-stimulated macrophage-like cells, Journal of Biological Chemistry, 282 (2007) 2899–2910. [DOI] [PubMed] [Google Scholar]
- [34].Sweeney G, Nazir D, Clarke C, Goettsche G, Ethanolamine and choline phospholipids in nascent very-low-density lipoprotein particles, Clinical and Investigative Medicine, 19 (1996) 243–250. [PubMed] [Google Scholar]
Associated Data
This section collects any data citations, data availability statements, or supplementary materials included in this article.


