Abstract
Ultrasound shear wave elastography (SWE) is an increasingly used noninvasive modality for quantitative evaluation of tissue mechanical properties. SWE typically uses an acoustic radiation force to produce laterally propagating shear waves that are tracked in the spatial and temporal domains, in order to obtain the wave velocity. One of the ways to study the viscoelasticity is through studying the shear wave phase velocity dispersion curves. Shear wave attenuation can be also characterized in viscoelastic tissues with methods that use multiple lateral data samples. In this paper, we present an alternative method for measuring the shear wave attenuation without using a rheological model (2P-FS). The technique uses information related to the amplitude spectra frequency shift of shear waves measured at only two lateral locations. The theoretical basis for the 2P-FS is derived and validated. We examined how the first signal position and the distance between the two locations affect the shear wave attenuation estimation in the 2P-FS method. We tested this new method on digital phantom data created using the local interaction simulation approach (LISA) in viscoelastic media. Moreover, we tested data acquired from custom made tissue mimicking viscoelastic phantom experiments and ex vivo porcine liver measurements. We compared results from the 2P-FS method with other two techniques used for assessing a shear wave attenuation: the frequency-shift-based method (FS) and the attenuation measuring ultrasound shearwave elastography (AMUSE) technique. In addition, we evaluated the 2P-FS algorithm with different levels of added white Gaussian noise to the shear wave particle velocity using numerical phantoms. Tests conducted showed that the 2P-FS method gives robust results based on only two measurements and can be used to measure attenuation of viscoelastic soft tissues.
Keywords: Shear wave elastography (SWE), attenuation, viscoelastic, frequency shift, ultrasound, acoustic radiation force, soft tissue, phantom, attenuation measuring ultrasound shear-wave elastography (AMUSE), Full Width at Half Maximum (FWHM)
I. Introduction
Shear wave elastography (SWE) has been used in many clinical applications including examination of liver, breast, thyroid, skeletal muscle, kidney, and other organs [1], [2]. SWE methods use focused ultrasound ”push” beams to generate acoustic radiation force (ARF) to produce propagating shear waves [3], [4]. Ultrafast ultrasound imaging techniques are then used for acquiring data for estimation of the shear wave motion [5], [6]. From this shear wave motion data, the shear wave group velocity is estimated using various time-of-flight methods [7]–[10].
Most clinical implementations of SWE assume that the tissue is linear, elastic, isotropic, homogeneous and incompressible. However, soft tissues are inherently viscoelastic and so specialized techniques are necessary for their characterization. Many different approaches have been proposed to characterize the viscoelasticity based on shear wave propagation. To fully characterize the viscoelasticity, this can be done either by measuring the storage and loss shear moduli or by extension the shear wave velocity and attenuation over a wide frequency range [11].
Shear wave phase velocity dispersion, or variation with frequency, has been measured in many different applications [11]–[18]. Measurement of the phase velocity dispersion has typically been accomplished either through a phase gradient or a two-dimensional Fourier transform (2D-FT) [19], [20]. Recently, other methods using a Multiple Signal Classification (MUSIC) method and a two-point wavelet transform (2P-CWT) have been proposed [21], [22].
Additional efforts have been made to measure the shear wave attenuation. One method is to characterize the exponential decay of the shear wave amplitude with distance [23], [24]. However, when using an ARF push beam, it is assumed that a cylindrical shear wave is produced, and it is necessary to correct for the geometric diffraction decay associated with the cylindrical wave, as proposed by [25], [26]. Additional methods have used a 2D-FT method and characterized the width of the frequency-domain magnitude distribution in the spatial frequency direction for estimating the attenuation [27]–[29]. Recently, a frequency-shift method has been proposed to evaluate shear wave attenuation through a model-fitting approach [30].
However, with these attenuation measurement methods a drawback is the amount of data needed for the measurements and the diffraction correction issue. Van Sloun, et al., proposed a method for the shear wave velocity and viscosity estimation from limited data points. In this work a transfer function between measurement points was estimated using a curve fit to a Green’s function of the Navier-Stokes equation [31]. We propose a method that uses data from two spatial locations that can be used for robust shear wave attenuation measurement where the transfer function is related to the centroid frequencies of the individual spectra. The frequency-shift-based (FS) method proposed by Bernard, et al., makes a few assumptions about the shear wave motion and its frequency distribution, which may not hold in all viscoelastic materials [30].
The rest of the paper is organized as follows. First, we present the two-point frequency shift (2P-FS) method applied for shear wave attenuation estimation. This method was tested on digital phantom data created using local interaction simulation approach (LISA) in viscoelastic media. We also applied the method on experimental data from custom made tissue-mimicking (TM) viscoelastic elastography phantoms and ex vivo porcine livers, respectively. 2P-FS is compared against the FS method, as well as, the attenuation measuring ultrasound shearwave elastography (AMUSE) technique or analytical predictions. Results from these digital and physical phantoms will be presented. The results will be followed with a discussion and conclusions.
II. Theory
In this section, the theory for the 2P-FS method is developed for an attenuation coefficient estimation in viscoelastic media. The attenuation coefficient can be evaluated using a methodology which involves waveforms acquired from two measurement locations only. The method is based on the change of amplitude spectra in the frequency content of the wave, as it travels through an attenuating medium, similar to the work presented by Bernard, et al., [30]. In our work however, we present a solution where a shape parameter of the Gamma distribution function does not need to be constant, as opposed to the work described in [30]. Moreover, we use only two spatial points in order to estimate the attenuation coefficient in contrast to data measured from multiple points over a selected lateral segment length. A theoretical basis of the method is provided in this section.
A. The Gamma Distribution Function Estimates
A two-parameter Gamma distribution is a general type of statistical distribution, which is related to the exponential and normal distributions [32]. The Gamma function, as opposed to the Gaussian one (which is symmetric around the mean of the distribution), can be fit to various asymmetric amplitude spectra. This makes it applicable to data which exhibit non-symmetric properties, i.e. shear wave amplitude spectra in SWE. A general form of the Gamma distribution function can be expressed as
| (1) |
where A is a constant value for amplitude scaling. n is the shape parameter responsible for controlling the symmetry property, and fβ is the rate parameter controlling the bandwidth. The centroid frequency of the W(f) function can be calculated as
| (2) |
which in a discrete form can be rewritten in a form
| (3) |
In a similar way the variance, σ2, of the W(f) function can be calculated. Mathematically σ2 can be described as
| (4) |
which takes a discrete form in a way
| (5) |
Both, the centroid frequency, fc (Eqs. (2) and (3)), and the variance, σ2 (Eqs. (4) and (5)), are related to the shape, n, and the rate, fβ, parameters as
| (6) |
and inversely, fc and σ2 can be described using the shape and rate parameters, as follows
| (7) |
At this point, one can appreciate that the Gamma distribution function can be easily fit to the asymmetric amplitude spectra twofold. First, by simply using Eqs. (3) and (5) along with Eq. (6) adapted to the amplitude spectra. Second, by formulating the following nonlinear least-squares (NLSQ) problem in a form
| (8) |
in order to estimate three parameters of the Gamma function. stands for an experimental amplitude spectrum obtained from a Fourier transform analysis.
B. The Ratio of Total Energy Restored and the Energy Loss Estimates
The amplitude spectrum of the attenuated signal, Wa(f), assuming that the amplitude spectrum of the source signal is Ws(f), can be, in general, expressed as
| (9) |
where Ws(f) is a general form of the Gamma distribution function described in Eq. (1). T(t) is assumed to be frequency independent factor including the effects of geometrical spreading, reflection/transmission coefficients, etc. H(f) describes the attenuation effect on the amplitude. t2 is a time for which the shear wave particle velocity was measured. Taking into account that the amplitude attenuation is proportional to frequency, that is, H(f) can be expressed as
| (10) |
where, R is related to the loss tangent as , and is defined as the ratio of total energy restored and the energy loss in one cycle. μ*(ω) is the complex shear modulus, and ω = 2πf is an angular frequency. Δt is the time in which shear wave traveled from one point to another over lateral distance (i.e. Δt = t2 − t1). Given that T(t) is frequency-independent and using Eq. (10), the amplitude spectrum of the attenuated signal from Eq. (9) can be written as
| (11) |
The attenuated amplitude spectrum Wa(f, t2) compared to the source amplitude spectrum, Ws(f, t1), has a constant shape parameter, na = ns, during the propagation. The bandwidth factor instead is modified as
| (12) |
In Eq. (12) the bandwidth factor variation between the source and attenuated amplitude spectra is associated with the R ratio (inverse of the loss tangent) and the travel time Δt of the source amplitude spectrum. Consequently, R can be estimated by the decrease in the bandwidth factor between Ws(f, t1) and Wa(f, t2) as
| (13) |
At this point, one can appreciate that we can estimate the R ratio by using the Gamma distribution function to fit the amplitude spectra of the source and attenuated amplitude spectra, to obtain the symmetry and bandwidth parameters. However, as it was mentioned earlier, the shape parameter is assumed to remain constant. This is a considerable weakness because it may be very difficult to keep the shape parameter of the source and attenuated amplitude spectra the same, as will be presented in Sec. V. One of the solutions to overcome this problem is to recalculate the bandwidth factors based on the centroid frequency as [33]
| (14) |
where the shape parameter of the source amplitude spectrum, ns, and the shape parameter of the attenuated amplitude spectrum, na, are not necessarily equal. and are the recalculated bandwidth factors, and and denote the centroid frequencies for the source and attenuated amplitude spectra, respectively. This step ensures that the recalculated shape parameter, , is constant for the source and attenuated amplitude spectra. Next, the R ratio from Eq. (13), using the quantities from Eq. (14), can be recalculated as
| (15) |
which omits the necessity to ensure the constant shape parameter for Ws(f, t1) and Wa(f, t2) over a lateral distance.
C. Attenuation Coefficient Estimates
For a linear viscoelastic medium, the shear modulus, μ*(ω), is a complex variable which can be written as
| (16) |
where the real part, μ1(ω), is the shear storage modulus, and the imaginary part, μ2(ω), is the loss modulus. The storage modulus represents the energy stored under deformation. The loss modulus instead, relates to the energy lost under deformation.
The complex shear modulus, for a viscoelastic medium, is related to the complex wavenumber which can be described as
| (17) |
where, ρ is the density of the medium, and k*(ω) is a complex wavenumber, which can be divided into real and imaginary parts as follows
| (18) |
where, k1(ω) and k2(ω) are the real and imaginary parts of the wavenumber, respectively. The real part of the wavenumber is defined as k1(ω) = ω/cph(ω) where, cph(ω) is the shear wave phase velocity. The imaginary part of the wavenumber, k2(ω), is a frequency-dependent shear wave attenuation. Knowing the ratio from Eq. (15) and the real wavenumber k1(ω), the attenuation of a medium can be computed as [34]
| (19) |
Then, the complex shear modulus for the viscoelastic medium, from Eq. (17), can be written as
| (20) |
| (21) |
III. Materials and Methods
A. Numerical LISA Phantoms Description
To produce digital phantoms of viscoelastic materials for which the mechanical properties are known, we used a 2D LISA model [35]–[37]. One of the major advantages of the LISA algorithm when used for wave propagation is the local interaction nature of boundaries in the model. LISA is a finite difference based approach where the sharp interface model is used to average physical properties at interface grid points, which represent intersections of four elementary cells [38].
The LISA technique for an elastic, isotropic, homogeneous, and nearly incompressible model for soft tissue is described by Navier’s equation
| (22) |
where, λ1 and G are the first Lamé constant and shear modulus, respectively, and ρ is the density. u is the local particle displacement, F is the induced body force, and t is the time. When the Kelvin-Voigt (KV) model for viscous loss is incorporated, Navier’s equation becomes [39]
| (23) |
where, λ2 and η denote the first Lamé constant and shear viscosity, respectively.
The entire process was implemented in MATLAB software using parallel computation technology, offered by modern graphics processing units (GPUs) and compute unified device architecture (CUDA) used in low-cost graphical cards. The domains were uniformly spatially sampled at 0.1 mm. The dimensions of the simulated domain are x = ±60 mm in the lateral direction and z = 60 mm in the axial dimension. We adopted a KV material model with a constant G of 3.24 kPa and four varying η values, i.e. 0.25, 0.5, 1 and 2 Pa·s, for Models A, B, C and D, respectively.
The acoustic radiation force push beam, for the numerical models, was simulated using Field II [40], [41]. A linear array with 48 active elements, with element width of 0.283 mm, element height of 7 mm, element pitch of 0.308 mm, elevation focus of 25 mm was simulated with a center frequency of 5.0 MHz, and using a medium attenuation of 0.5 dB/cm/MHz and sound velocity of 1540 m/s. The intensity, I, was calculated by squaring the pressure to be used in the body force defined by F = 2αI/c. A focal depth of 21.6 mm was used for the push beams with a fixed f-number (F/N) of 2.
Resulting shear wave velocity responses were interpolated with a temporal sampling frequency of 4.167 kHz and then used for further data processing.
The 2P-FS method for numerical phantoms of viscoelastic materials is studied twofold. Examples of a ”clean” (without any additional noise) as well as in the presence of noise, as added white Gaussian noise, wave motions are studied. The white Gaussian noise was generated in MATLAB software using the ‘awgn’ function and then added to the shear wave time-domain particle velocity signals. The power of the wave motion was measured. Subsequently, white Gaussian noise was added to the time-domain vector signals. A signal-to-noise ratio (SNR) for the noise-added models was set to vary from 5 to 25 dB.
B. Tissue Mimicking (TM) Phantoms Description
Custom tissue-mimicking viscoelastic phantoms, similar to those used in a comparison study [42], were used (CIRS Inc., Norfolk, VA, USA) in this work to test robustness of the 2P-FS approach for shear wave attenuation measurement. A Verasonics ultrasound system equipped with a linear array transducer (L7–4, Verasonics, Inc., Kirkland, WA, USA) was used for data acquisition. The acoustic radiation force push beams were focused at 20.02 mm. The push duration was 400 μs and the push frequency was 4.09 MHz. The push beam was generated by 48 active elements, which was placed on a side of the L7–4 probe. A plane wave acquisition was used using 3 angularly directed plane waves (−4°, 0°, +4°) that were coherently compounded [5]. The effective frame rate after compounding was 4.167 kHz. The motion (shear wave particle velocity) was calculated from the in-phase/quadrature data using an autocorrelation algorithm [43]. The particle velocity waveforms were averaged from 5 mm in axial direction at the focal depth. Then, the DC component was removed from the waveforms by subtracting a mean value.
C. Ex vivo Liver Data Description
In our experiments, two ex vivo porcine livers were also used to test the effectiveness of the 2P-FS approach in soft tissues. The livers were obtained from pigs after euthanasia where the pigs were used for studies dedicated to medical education or cardiovascular research on protocols approved by the Mayo Clinic Institutional Animal Care and Use Committee. The same Verasonics ultrasound system, with the same acquisition parameters and data processing as for the TM phantom experiments were used, with the difference that three frames at −3°, 0° and +3° steering angles were used for the angular compounding. Measurements were done at room temperature. The acoustic radiation force push beam was focused at 25 mm. The particle velocity waveforms were averaged from 5 mm in axial direction at the focal depth. Then, the DC component was removed from resulting waveforms.
IV. Data Processing
In our work we examined a frequency-independent attenuation coefficient, α0, in the unit of Np/m/Hz. Hence, from a frequency-dependent attenuation coefficient in the unit of Np/m, the α0 coefficient was estimated for the 2P-FS and AMUSE techniques, as well as, for the analytical predictions. The FS method, according to the theory provided in [30], gives results in the form of the α0 coefficient, so no further analytical transformations are needed.
A. Two-point Frequency Shift (2P-FS) Method
For the 2P-FS method the attenuation coefficient α0 was calculated as
| (24) |
where, fc(x1) and fc(x2) are centroid frequencies for the first and second measurement locations, respectively. k2(ω) is the attenuation calculated using Eq. (19). Frequency-dependent real wavenumbers, k1(ω), present in Eq. (19) were estimated from the k-space spectrum. The k-space spectrum was computed using the 2D-FT method by searching for locations of maximum peaks [20]. The ratio was calculated using Eq. (15) for selected spatial locations. The travel time between two measurement points, Δt, was computed as a lag for a cross-correlation of the two shear wave velocity waveforms.
First, an amplitude spectrum in the time domain was calculated using a one-dimensional fast Fourier transform (1D-FT) without using a padding factor. Then, the resulting amplitude spectrum in the frequency domain was interpolated, in order to improve a sampling rate. Afterwards, the ratio parameter, fβ(Δx) was estimated by applying a NLSQ algorithm (using a built-in ‘lsqcurvefit’ function in MATLAB) to the Gamma distribution function (Eq. (8)), to the resulting, interpolated amplitude spectrum data.
Calculations were performed for various first signal positions and distance between two measurement positions. Then, a map of estimated attenuation coefficients was created, presenting sensitivity of the 2P-FS method over various combinations of selected measurement points.
B. Frequency Shift (FS) Method
The FS approach was implemented according to the theory presented by Bernard, et al., [30], to the best of our knowledge. In summary, processing steps for FS are as follows. For a given first signal position, x0, a NLSQ algorithm (Eq. (8), the ‘lsqcurvefit’ function in MATLAB) was used to estimate three parameters of the Gamma distribution function, i.e. A(x0), n(x0), and fβ(x0), respectively. Then, by assuming that the shape parameter, n, is constant for each location in lateral direction, i.e. n(Δx) = n(x0), the rate parameter, fβ(Δx), was evaluated by solving a two-parameter nonlinear optimization problem for the Gamma distribution function. Afterwards, the curve 1/fβ(Δx) was fit to a linear function. The attenuation coefficient, α0, was then estimated as the slope of the varying 1/fβ(Δx) parameter over selected spatial distance in the lateral direction. These calculations were repeated for various combinations of first signal positions and varying lateral segment length. As a result, a map of estimated attenuation coefficients was created, similar to the map for the 2P-FS method, representing sensitivity of FS on the first signal position and a total lateral segment length.
The amplitude spectra were computed using a 1D-FT in the same manner as for 2P-FS.
C. Attenuation Measuring Ultrasound Shearwave Elastography (AMUSE) Method
The AMUSE method was implemented according to the theory described by Nenadic, et al., [27], and it was adopted in this work as an additional comparison for the 2P-FS and FS methods, for the experimental TM and ex vivo liver data. The AMUSE technique was applied as follows. First, a k-space spectrum for the shear wave motion data was computed using the 2D-FT. Then, frequency-dependent attenuation measurements were estimated using the AMUSE method for a predefined frequency range. Next, a linear model function was fit to the frequency-dependent attenuation measurements in order to estimate a slope of the attenuation, which yields the attenuation coefficient α0. The linear model fit was applied to a predefined frequency range with ±25 Hz, in order to get a standard deviation of the estimates. The AMUSE method was applied to spatiotemporal shear wave motion data in spatial and temporal ranges as it was shown in Sec. V, Figs. 1a, 8a, and 13a.
Fig. 1:
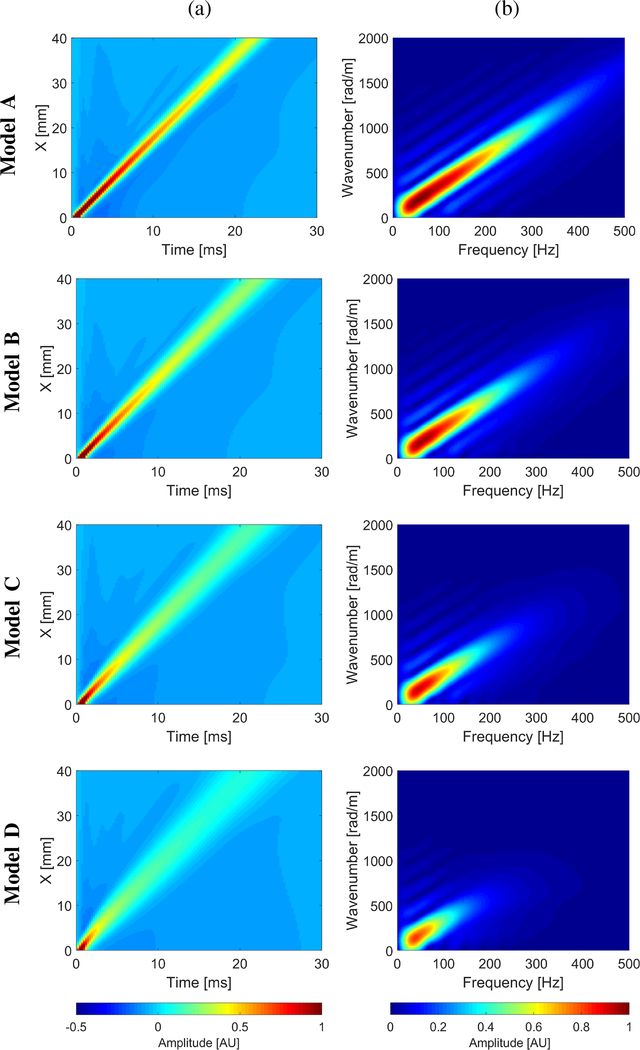
(a) Spatiotemporal shear wave velocity motion data, and (b) corresponding k-space spectra. Results are presented for the numerical LISA tissue mimicking viscoelastic models with assumed a constant shear modulus of 3.24 kPa and a viscosity of 0.25 Pa·s (Model A), 0.5 Pa·s (Model B), 1 Pa·s (Model C), and 2 Pa·s (Model D), respectively.
Fig. 8:
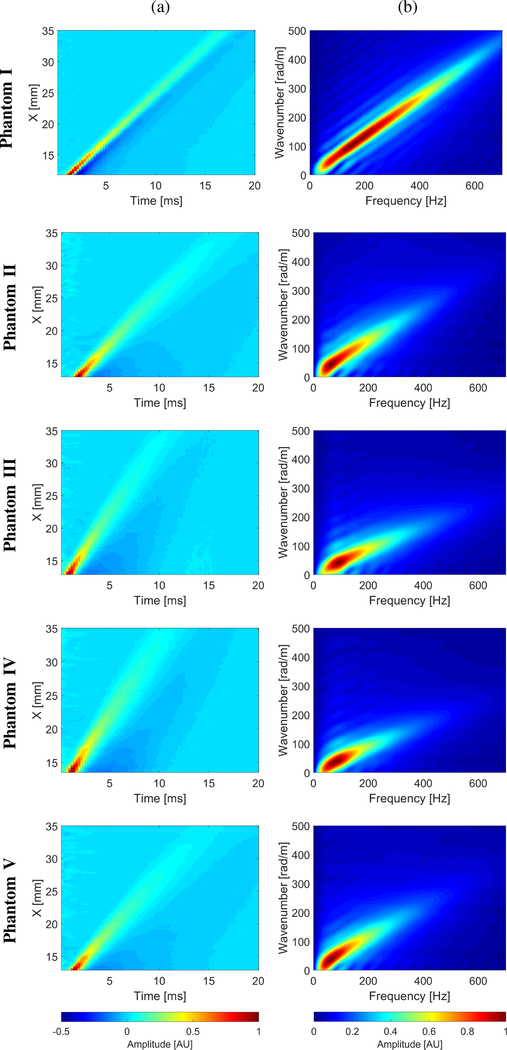
(a) Spatiotemporal shear wave velocity motion data, and (b) corresponding k-space spectra, for the TM viscoelastic phantoms I - V, respectively.
Fig. 13:
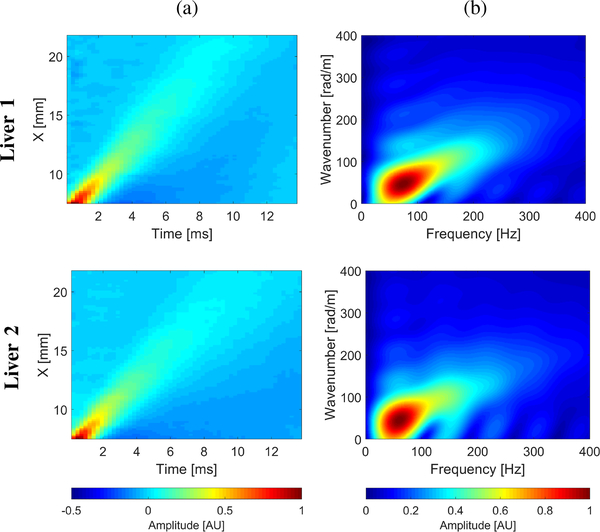
(a) Spatiotemporal shear wave velocity motion data, and (b) corresponding k-space spectra, for the ex vivo liver data.
D. Analytical Attenuation Coefficient Estimation
The analytical predictions were used in this work as an additional comparison to the 2P-FS and FS methods, for the numerical LISA tissue mimicking models. First, shear wave phase velocity dispersion curves were calculated using the 2D-FT method by searching for maximum peaks. Then, a NLSQ function was applied to the KV model in order to evaluate the real and imaginary parts of the shear modulus. Following, resulting values were applied to the analytical KV model in order to calculate a frequency-dependent attenuation. Next, a linear model function was fit to the attenuation estimates in order to evaluate a slope of the attenuation, which yields the attenuation coefficient α0. The linear model fit was applied to a predefined frequency range, corresponding to the main frequency content present in the k-space spectra (values corresponding to magnitudes >0.2) in Fig. 1b.
V. Results
A. Numerical LISA Viscoelastic Models Results
Shear wave spatiotemporal data for the numerical, tissue mimicking viscoelastic LISA models are presented in Fig. 1a, for Models A, B, C, and D (rows counting from top to bottom). The corresponding k-space spectra for each model, representing the main shear wave energy distribution in the frequency domain, are positioned in Fig. 1b, in the same order. Normalized data are shown for the spatiotemporal maps, as well as, the k-space spectra shown in Fig. 1.
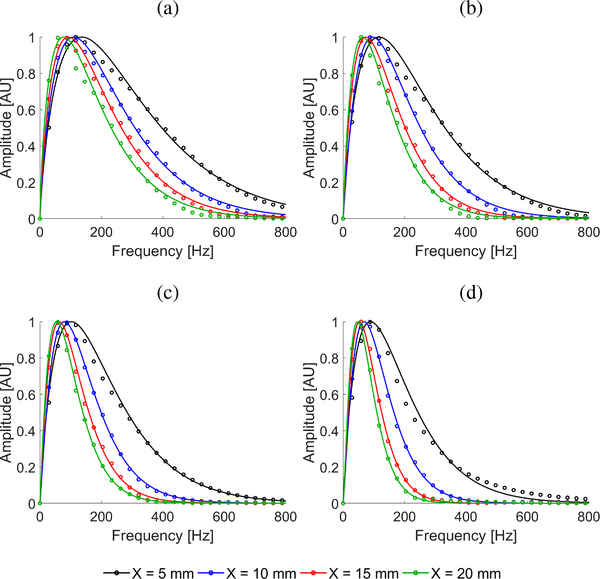
Normalized one-dimensional amplitude spectra calculated at the focal depth of 21.6 mm, and for four selected lateral locations (x = 5, 10, 15, and 20 mm) away from the excitation push beam position, are shown in Fig. 2 by open circles. Their corresponding Gamma distribution functions fit are superimposed by continuous lines, for each position investigated. Results for the numerical LISA models A, B, C, and D, for clean data (without added noise) are shown in Figs. 2a, 2b, 2c, and 2d, respectively. One can appreciate that, since the real part of the shear modulus is constant within each model and only the imaginary part (i.e. viscosity) varies, changes of the amplitude spectrum shape can be clearly recognized between less and more viscous materials.
Fig. 2:
Normalized amplitude spectra (markers) with their Gamma distribution fit function (continuous lines) for shear waves measured at various lateral locations from the focused radiation force push beam. Results are presented for the numerical LISA tissue mimicking viscoelastic models, for clean data (without added noise) with assumed a constant shear modulus of 3.24 kPa and a viscosity of (a) 0.25 Pa·s (Model A), (b) 0.5 Pa·s (Model B), (c) 1 Pa·s (Model C), and (d) 2 Pa·s (Model D), respectively.
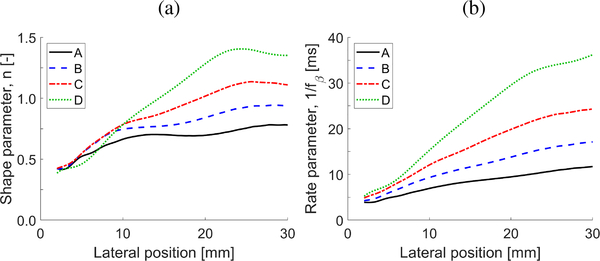
Figure 3 shows estimated shape parameters, n (Fig. 3a), along with rate parameters, 1/fβ (Fig. 3b), by applying a NLSQ algorithm to a three parameter Gamma distribution function. Results are presented for the numerical LISA models, for the clean shear wave motion data measured at various lateral locations away from the focused ultrasound push beam position. Variations of the shape and rate parameters, as an increasing trend, can be observed with progressing lateral distance.
Fig. 3:
(a) Shape parameter, n, and (b) the rate parameter, 1/fβ, estimated using the Gamma distribution fit for shear waves measured at various lateral locations from the focused radiation force push beam. Results are presented for the numerical LISA tissue mimicking viscoelastic models, for clean data (without added noise) with assumed a constant shear modulus of 3.24 kPa and a viscosity of 0.25 Pa·s (Model A), 0.5 Pa·s (Model B), 1 Pa·s (Model C), and 2 Pa·s (Model D), respectively.
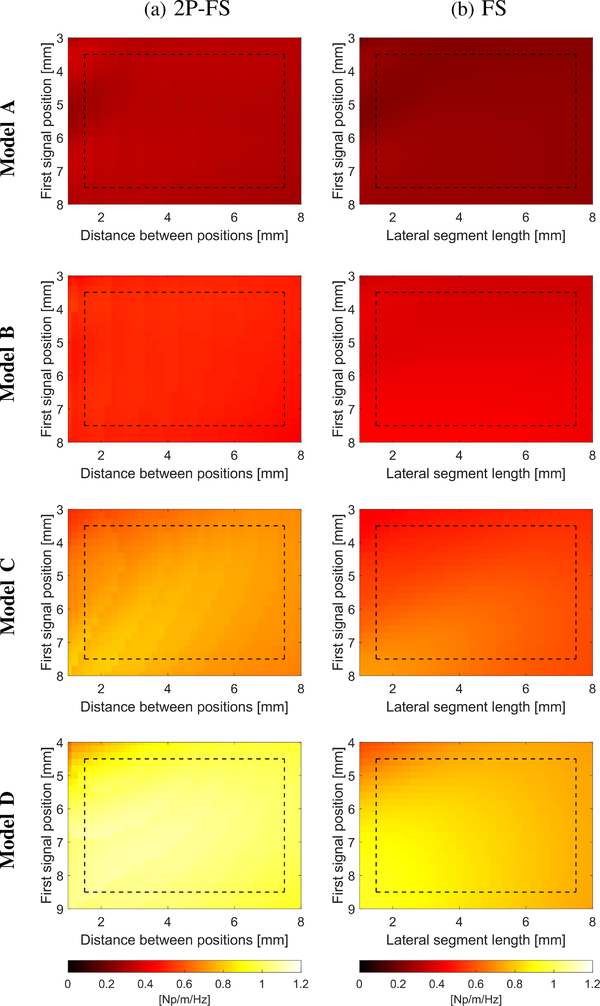
The attenuation coefficient estimates for the 2P-FS and FS methods are presented graphically in Fig. 4. First signal position versus the distance between two measurement signals is investigated for the 2P-FS technique in Fig. 4a. At the same time, the attenuation coefficients for the first signal position versus distance to the last signal position (with multiple acquisition points in between), for FS, are examined in Fig. 4b. Results for the numerical Models A, B, C, and D, for clean data, are introduced in the rows counting from top to bottom, respectively. Smooth transition of the data, within selected regions, can be observed for the 2P-FS and FS methods, respectively. A progressive attenuation change is observed between all numerical models investigated. Changes are visible for both 2P-FS and FS, respectively.
Fig. 4:
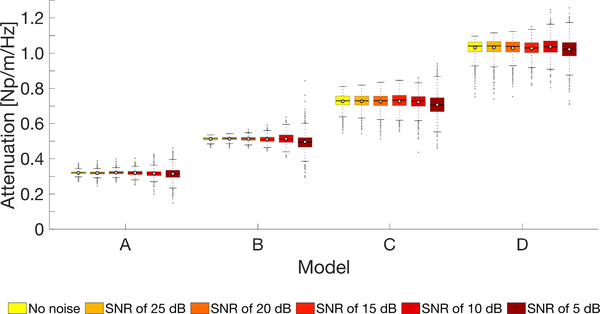
Attenuation measurements for the (a) 2P-FS, and (b) FS methods, respectively. Results are presented for the numerical LISA viscoelastic phantoms, for clean data (without added noise) with assumed the shear modulus of 3.24 kPa and viscosity of 0.25 Pa·s (Model A), 0.5 Pa·s (Model B), 1 Pa·s (Model C), and 2 Pa·s (Model D), respectively. Results for various first signal positions and distance between two positions for 2P-FS, and lateral segment length for FS, are shown. Analogous results for various levels of SNR and the 2P-FS method are presented in the Supplementary material in Fig. S1.
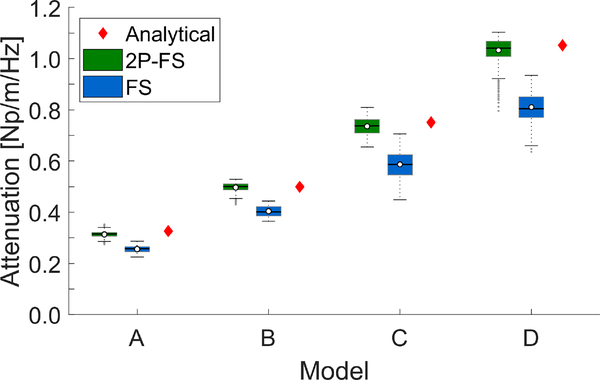
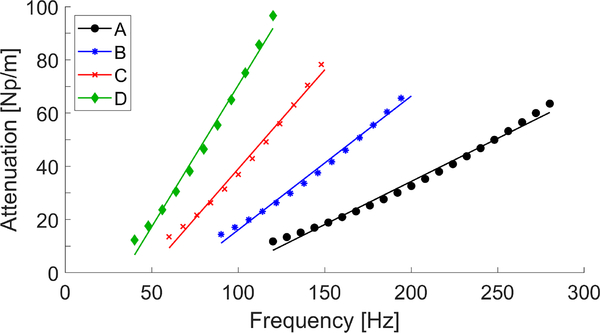
Boxplots of the attenuation coefficients within selected regions-of-interest (ROI) marked in Fig. 4, for the four models investigated, were calculated for the 2P-FT and FS techniques. Results are summarized in Fig. 5. The bottom and top edges of the box indicate the 25th and 75th percentiles, respectively. White circles represent mean values of the attenuation coefficient whereas, the solid line within each box corresponds to a median value. Outliers were also plotted if values are greater than q3 + w(q3 − q1) or less than q1 − w(q3 − q1), where w is the maximum whisker length, and q1 and q3 are the 25th and 75th percentiles of the sample data, respectively. w was selected to be 1.5. Results for Models A, B, C, and D are presented. Additionally, the analytical attenuation coefficient values are provided for each model. The analytical estimates were computed according to the processing scheme described in Sec. IV-D. Frequency-dependent attenuation data used for a linear function fit, for each numerical model, are shown in Fig. 6. Markers represent data from the KV analytical model whereas, continues lines stand for the linear function fit.
Fig. 5:
Boxplots computed for the attenuation measured within the ROI presented in Fig. 4 for 2P-FS, and FS methods, respectively. Results are presented for the numerical LISA viscoelastic phantoms, for clean data (without added noise) with assumed the shear modulus of 3.24 kPa and viscosity of 0.25 Pa·s (Model A), 0.5 Pa·s (Model B), 1 Pa·s (Model C), and 2 Pa·s (Model D), respectively.
Fig. 6:
Frequency-dependent attenuation calculated using the analytical KV model (markers), and its a linear fit function (continuous lines). Results are presented for the numerical LISA viscoelastic phantoms with assumed the shear modulus of 3.24 kPa and viscosity of 0.25 Pa·s (Model A), 0.5 Pa·s (Model B), 1 Pa·s (Model C), and 2 Pa·s (Model D), respectively.
Attenuation coefficients within the ROI, for all models investigated, for the 2P-FS method give similar median and interquartile range (IQR) estimates to the analytical findings. The analytical predictions for Models A, B, C, and D are 0.326, 0.499, 0.751, and 1.052 Np/m/Hz, respectively. At the same time 2P-FS provided median values of the α0 coefficient at the levels of 0.315, 0.501, 0.738, and 1.041 Np/m/Hz for Models A, B, C, and D, respectively. The FS technique resulted in underestimated median values for the numerical models. Resulting values of the median α0 coefficients, for the same models, are: 0.258, 0.401, 0.588, and 0.805 Np/m/Hz, respectively. The level of underestimation of the attenuation coefficient increases with progressive viscosity. The main reason for this behavior is, more likely, the fact that the shape parameters of the Gamma distribution fit are not constant along the lateral direction as can be seen in Fig. 3a. This however, is one of the assumptions made in FS, i.e. the shape parameters are assumed to be constant for all lateral locations.
Fig. 7 presents boxplots of the attenuation coefficients within selected ROIs marked in Figs. 4 and S1 (see the Supplementary material), for the four numerical models investigated. Results for the 2P-FS technique, for clean data as well as for different levels of added white Gausian noise to the shear wave particle velocity are summarized. Attenuation coefficients within the ROI give similar mean and median values for clean data and data with a SNR of 25, 20, 15 and 10 dB, for all models investigated. IQR estimates are also similar for these cases. The most noisy signal with a SNR of 5 dB exhibits the largest α0 coefficient variation. Resulting values of the median α0 coefficients for models A, B, C, and D, for various SNR levels are summarized in Table I. For lower SNR values a slight decrease of the median α0 coefficient was observed.
Fig. 7:
Boxplots computed for the attenuation measured within the ROI presented in Fig. 4 for clean data, and in Fig. S1 summarized in the Supplementary material for various levels of SNR. Results are presented for 2P-FS, for the numerical LISA viscoelastic phantoms with assumed the shear modulus of 3.24 kPa and viscosity of 0.25 Pa·s (Model A), 0.5 Pa·s (Model B), 1 Pa·s (Model C), and 2 Pa·s (Model D), respectively.
TABLE I:
Resulting values of the median α0 coefficients, for models A, B, C, and D, for various SNR levels. Values are presented in the unit of Np/m/Hz.
| Model | SNR [dB] | |||||
|---|---|---|---|---|---|---|
| Clean | 25 | 20 | 15 | 10 | 5 | |
| A | 0.315 | 0.319 | 0.322 | 0.319 | 0.317 | 0.315 |
| B | 0.501 | 0.501 | 0.500 | 0.496 | 0.497 | 0.481 |
| C | 0.738 | 0.738 | 0.738 | 0.741 | 0.736 | 0.715 |
| D | 1.041 | 1.041 | 1.039 | 1.030 | 1.037 | 1.023 |
B. Experimental TM Viscoelastic Phantoms Results
In this section, the 2P-FS method used for attenuation coefficient estimation of the shear waves was used for experimental TM phantoms data. As in the previous section, results for the 2P-FS method are compared with those from the FS technique. Moreover, attenuation coefficients were estimated using the AMUSE technique as described in Sec. IV-C. In this section, five different custom made TM phantoms were investigated (I, II, III, IV, and V), and the results are shown in Figs. 8 – 12.
Fig. 12:
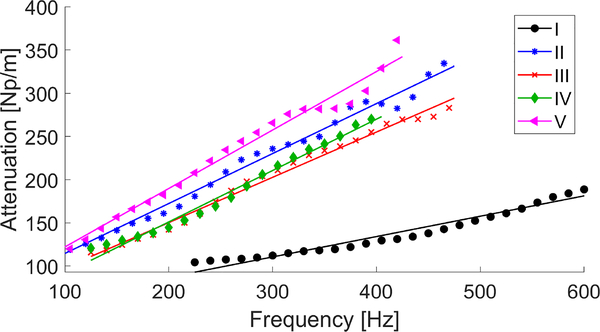
Frequency-dependent attenuation calculated using the AMUSE method. Results are presented for the TM viscoelastic phantoms I - V.
Figure 8a presents the spatiotemporal particle velocity for all five phantoms on a linear scale. Figure 8b shows normalized magnitude of the k-space spectra calculated using the 2-D FT method for TM phantoms I - V.
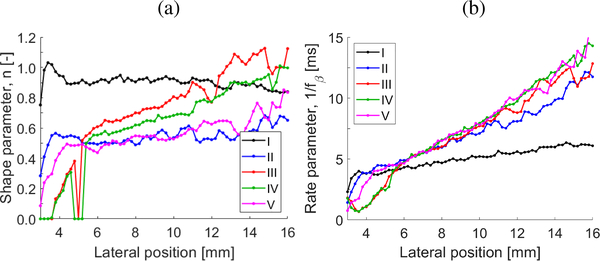
Similar as for the numerical data in Sec. V-A, the shape and rate parameters of the amplitude spectra were estimated for each TM phantom using the Gamma fit function. Results are shown in Figs. 9a and 9b, respectively. Measurements for shear wave motion data at various lateral locations away from the focused ultrasound push beam position are depicted. Different variations of the shape and rate parameters can be observed with a lateral distance for each TM phantoms. It can be observed that for Phantoms I, and II, for certain lateral positions, the shaper parameter is approximately constant. Hence, the condition of assuming constant shape parameters over spatial distance, with some variation, is met for the FS method.
Fig. 9:
(a) Shape parameter, n, and the (b) rate parameter, 1/fβ, estimated using the Gamma fit for shear waves motion data measured at various lateral locations from the focused radiation force. Results are presented for the TM viscoelastic phantoms.
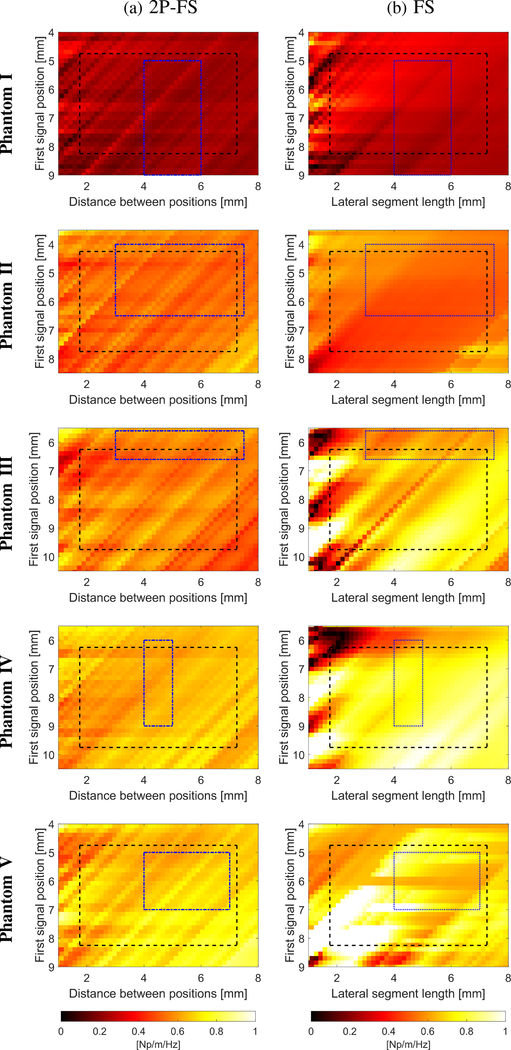
The attenuation coefficients, α0, for the custom made TM phantoms are presented graphically in Fig. 10. Results for 2P-FS are compared against the FS technique. Different combinations of first signal position and distance between two measurement points were studied for the 2P-FS method (Fig. 10a). Likewise, first signal position versus distance to the last measurement point (with multiple measurement locations in order to project the same lateral distance as in 2P-FS) was examined for the FS method. Results are presented in Fig. 10b. Comparing the attenuation coefficient results for both methods, differences can be distinguished. The 2P-FS method gives more uniform estimates for almost any selected measurement points, for all TM phantoms investigated in this work (Fig. 10a). However, for the FS technique intensified variations are observed depending of the phantom and the spatial location considered (Fig. 10b).
Fig. 10:
Attenuation measurements for the TM viscoelastic phantoms for the (a) 2P-FS, and (b) FS methods, respectively. Results are presented for Phantoms I - V, for various first signal positions and distance between two measurement positions for 2P-FS, and lateral segment length for FS, respectively. The ROI region, marked with a black dashed line, represents the full ROI. The blue, dash-dotted line stands for the truncated ROI. The truncated ROI was estimated based on the evaluated shape parameters shown in Fig. 9a.
For each TM phantom, two versions of ROIs were marked in Fig. 10a. ROIs, marked with a black dashed line, with a constant area for each TM phantom, represent the full ROI. The blue, dash-dotted line stands for a truncated ROI. The truncated ROI was estimated based on the examined shape parameters shown in Fig. 9a. First and last lateral positions were selected in a way that the shape parameters in Fig. 9a were approximately constant or have low variation over the lateral distance. For example, for the TM Phantom II, the first signal position was selected to vary from 4 to 6.5 mm, and the lateral segment length was chosen to be from 3 to 7.5 mm. This in turn gives the total lateral segment length from 4 to 14 mm in Fig. 9a. For this lateral range, one can appreciate, that the shape parameter for the TM Phantom II is approximately constant with some variation. In a similar way truncated ROIs were selected for the remaining TM phantoms. They are imposed on each map in Fig. 10.
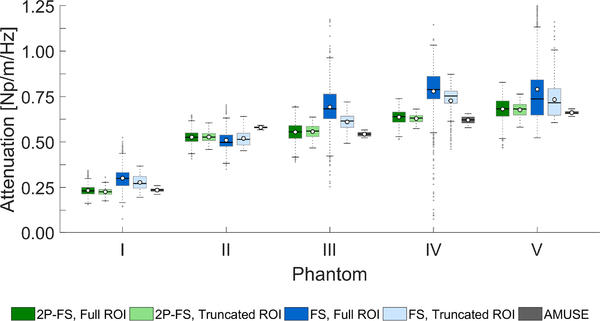
Figure 11 presents boxplots of the attenuation coefficient within selected the full and truncated ROIs marked in Fig. 10. Results for five TM phantoms investigated in this work are presented for the 2P-FS and FS techniques. Moreover, as an additional comparison, attenuation coefficient values, for each TM phantom, are provided based on the AMUSE method. The AMUSE estimates were acquired according to the processing steps described in Sec. IV-C. Frequency-dependent attenuation data used for a linear function fit, for each TM phantom, are presented in Fig. 12. Similar as for the numerical models, markers represent data from AMUSE whereas, continuous lines stand for the linear function fit.
Fig. 11:
Boxplots computed for the attenuation measured within the ROI presented in Fig. 10 for 2P-FS, FS, and AMUSE methods, respectively. Results are presented for the TM viscoelastic phantoms I - V.
Attenuation coefficients within the full and truncated ROIs for 2P-FS give similar median and IQR estimates to the AMUSE findings. Median attenuation coefficients for Phantom I and for the truncated ROIs are 0.226 and 0.272 Np/m/Hz for 2P-FS and FS, respectively. Median values for Phantom II are 0.527 and 0.514 Np/m/Hz, respectively. At the same time median attenuation coefficients for AMUSE are 0.235 and 0.580 Np/m/Hz, for Phantoms I and II, respectively. When a wider lateral region was considered (full ROIs) in contrast to the truncated ROIs, shifts of the attenuation coefficients were observed for the 2P-FS method (α0 = 0.231 and 0.525 Np/m/Hz) and for the FS technique (α0 = 0.299 and 0.498 Np/m/Hz), respectively. Attenuation coefficients for Phantoms III, IV, and V, exhibited higher variation of the shape parameter over lateral direction (Fig. 9a), show larger mismatch between FS and 2P-FS, and AMUSE, as can be observed in Fig. 11. Moreover, it can be seen that larger IQRs for the FS technique are observed for all TM phantoms. IQRs for truncated ROIs are reduced.
C. Experimental Ex vivo Liver Results
In this section, the 2P-FS method used for attenuation estimation of shear waves was used for the experimental ex vivo liver data. As in the previous section, results for the 2P-FS method are compared with those from the FS and AMUSE techniques. In this section, two different porcine livers were investigated, and results are shown in Figs. 13 – 16.
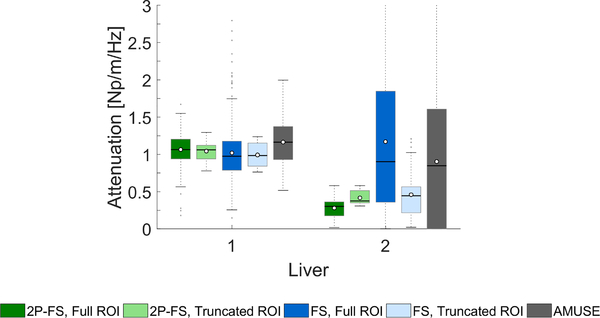
Fig. 16:
Boxplots computed for the attenuation measured within the ROI presented in Fig. 15 for 2P-FS, FS, and AMUSE methods, respectively. Results are presented for the ex vivo liver data.
Figure 13 shows the spatiotemporal shear wave propagation (Fig. 13a) using the particle velocity signal, as well as, corresponding the k-space spectra (Fig. 13b).
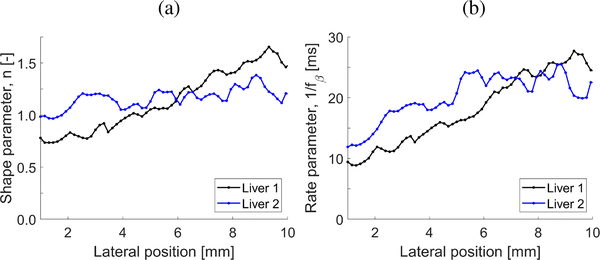
The shape and rate parameters of the amplitude spectra, for various lateral positions away from the ultrasound focused push beam, for two ex vivo livers, are shown in Fig. 14. Similar to the numerical LISA and experimental TM phantoms, these parameters were estimated using the Gamma distribution fit function applied to amplitude spectra.
Fig. 14:
(a) Shape parameter, n, and the (b) rate parameter, 1/fβ, estimated using the Gamma fit for shear waves motion data measured at various lateral locations from the focused radiation force. Results are presented for the ex vivo liver data.
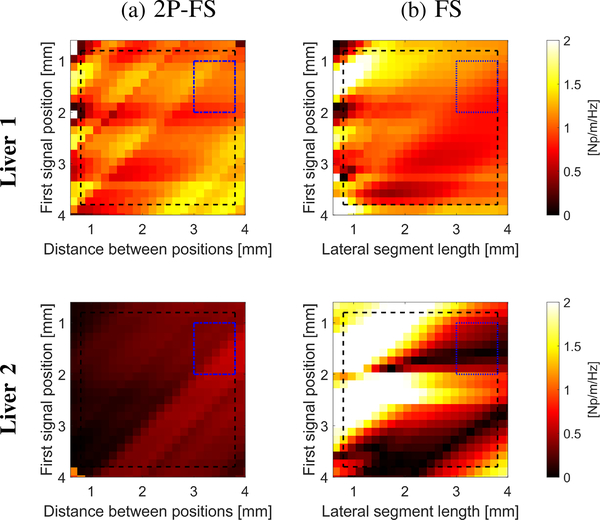
The attenuation coefficients, α0, for the ex vivo livers are presented graphically in Fig. 15. Results for different first signal positions and distance between two signals for 2P-FS (lateral segment length for FS) are shown. Similar as for the custom made TM phantoms, differences between the two methods can be distinguished. Again, full and truncated ROIs are imposed for each liver and method investigated. The truncated ROIs were evaluated based on the shape parameters shown in Fig. 14a.
Fig. 15:
Attenuation measurements for the ex vivo liver data for (a) 2P-FS, and (b) FS methods, respectively. Results are presented for various first signal positions and distance between positions for 2P-FS, and lateral segment length for FS, respectively. The ROI region, marked with a black dashed line, represents the full ROI. Whereas, a blue, dash-dotted line stands for the truncated ROI. The truncated ROI was estimated based on the evaluated shape parameters shown in Fig. 14a.
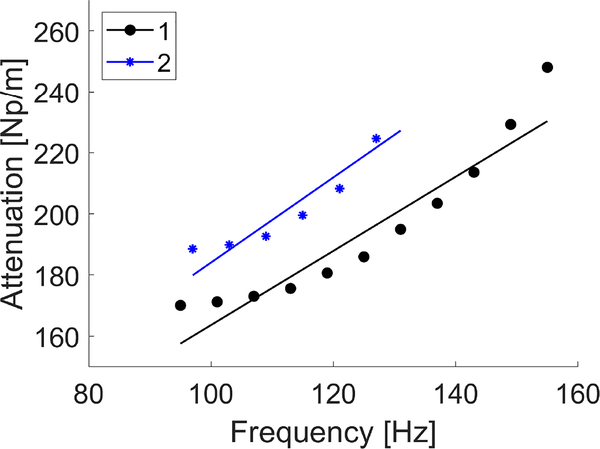
Figure 16 presents boxplots of the attenuation coefficients within selected the full and truncated ROIs marked in Fig. 15. Results for both ex vivo livers investigated in this work are presented for the 2P-FS and FS techniques. Attenuation coefficient values, for each liver, are also measured with the AMUSE method (according to the theory in Sec. IV-C), as an additional comparison. Frequency-dependent attenuation data used for a linear function fit for AMUSE, for each liver, are shown in Fig. 17. Similarly, markers represent data from AMUSE whereas, continues lines stand for the linear function fit.
Fig. 17:
Frequency-dependent attenuation calculated using the AMUSE method. Results are presented for the ex vivo porcine liver experimental data.
The IQR estimates of the attenuation coefficients for liver 1 are at nearly the same level for the 2P-FS and FS methods, respectively. Median values of α0 are 1.064, and 1.061 Np/m/Hz for the full and truncated ROIs and the 2P-FS method, respectively. At the same time, FS predicted the α0 coefficient at the levels of 0.975, and 0.986 Np/m/Hz for the full and truncated ROIs, respectively. AMUSE provided higher IQR range and effective mean and median values of the attenuation coefficient. On the other hand, higher variations of the IQR for liver 2 are observed between investigated methods. 2P-FS, for full and truncated ROIs, gives similar estimates with slight offset (0.301 and 0.375 Np/m/Hz). Results for the FS method and truncated ROI are at the level of 0.443 Np/m/Hz with larger IQR. On the other hand, IQR of the attenuation coefficient for the full ROI for FS and AMUSE is very wide with median values of 0.902 and 0.847 Np/m/Hz, respectively.
VI. Discussion
In this work we demonstrated the theoretical basis for recovering shear wave attenuation using a frequency shift technique and shear wave velocity waveforms measured at two locations only. 2P-FS uses a shear wave velocity one-dimensional amplitude spectrum and the Gamma distribution function, which is related to exponential and normal distributions. The Gamma distribution function due to its asymmetric properties can be easily related to the shear wave amplitude spectrum. Similar to the FS technique, 2P-FS relates to the linear attenuation hypothesis. However, as opposed to FS, the 2P-FS method presented in this work does not assume that the shape parameter remains constant for the source, x0, and attenuated, Δx, wavelets. This is one of the important advantageous of 2P-FS. As it was shown in Sec. V in Figs. 3a, 9a, and 14a, the shape parameter of the amplitude spectrum for the x0 is not always similar to the shape parameter of the spectrum at a position Δx further away from the pushing line. For FS this knowledge needs to be known a priori, and the condition has to be fulfilled, before estimating the shear wave attenuation coefficient as it was discussed in [30].
It is possible that, for a different type of excitation, e.g. Supersonic Shear Imaging (SSI), and higher excitation frequencies, the shape parameter will be similar for each lateral locations, as it was demonstrated by Bernard, et al. [30]. We did not investigate these types of excitations in our current work. In our study instead, we used a single focused push beam with the push duration of 400 μs, as this processing scenario is often used in clinical scanners. Moreover, we used only a single acquisition data, without repeating the push beam excitation and shear wave measurements. Hence, we did not average the acquired shear wave motion data from multiple acquisitions, in order to show the 2P-FS method efficiency in the most critical scenario. For in vivo measurements, due to tissue motion, there may not be possibility to repeat measurements for an exactly the same spatial location. Hence, the experimental case scenarios examined in this work reflect real life conditions.
We validated the theoretical findings for 2P-FS using the numerical tissue mimicking viscoelastic materials, as well as, the experimental TM phantoms and ex vivo porcine liver data. We compared results from 2P-FS with the analytical and/or other, previously proposed and validated techniques, i.e. FS, and AMUSE [27], [30].
Figures 4 and 5 show results for the numerical data. Based on results presented in Fig. 3a it was shown that the shape parameter of the amplitude spectra is not constant, or very similar, for each lateral spatial location. Interestingly, more viscous materials exhibit higher variation of the shape parameter at a position further away from the pushing line, for numerical models and lateral positions investigated in this work (Fig. 3a). Knowing this fact, we did not expect that the FS technique to give the same results as 2P-FS. This was observed for the boxplots shown in Fig. 5. A divergence of the median values between 2P-FS and FS for Model 1 was 0.057 Np/m/Hz whereas, for Model 4 it was 0.237 Np/m/Hz. Model 1 is the least viscous (with the shape parameter of the amplitude spectrum the least variant along lateral positions) and Model 4 is the most viscous (with the most variant shape parameters for the amplitude spectra at positions further away from the pushing line), respectively. The reason why the FS predicted underestimated attenuation coefficients is more likely due to the fact, that one of a very important assumptions was not fulfilled in the investigated cases. Median and mean values of the attenuation coefficients evaluated for 2P-FS were at similar levels as analytical findings, as can be seen in Fig. 5.
We also tested the performance of the 2P-FS method using the LISA models and different levels of added white Gaussian noise to the shear wave particle velocity. The results in Figs. 7 and S1 (see the Supplementary material) showed that, in general, the 2P-FS method is very robust for noisy data. The α0 coefficient did not vary significantly as the SNR varied.
It should be noted that we have implemented the numerical LISA with the Kelvin-Voigt-based model only, in order to test our method where true values are known. The 2P-FS method itself does not assume any information about a rheological model and is fully data driven method, as can be seen from the mathematical equations derived in Sec. II. Equations (20) and (21) are general and could be used in the Navier’s equation to define different media.
Various viscoelastic models give different dispersion curves results. This difference may vary depending on the frequency band being considered. In our work the main excited shear wave frequency component is considered. For another viscoelastic model a shear wave of a different frequency component could be excited and different phase velocity and viscosity values can be measured. Hence, we expect that our method can give different attenuation estimates for various viscoelastic models, but still reliable to the considered viscoelastic model used.
For the TM phantoms the shape parameters of the amplitude spectra, for some cases, were close to a constant value for various lateral positions. Phantoms I and II exhibit nearly constant shape parameters for certain lateral positions (Fig. 9a). For these phantoms evaluated attenuation coefficients were at similar levels for each method investigated, i.e. 2P-FS, FS, and AMUSE, respectively. For other phantoms, i.e. III, IV, and V (where the shape parameters were not constant or similar over the lateral distance), greater divergence was observed between FS and the 2P-FS, and AMUSE methods, respectively.
We also examined the influence of the first signal position from the focused push beam and distance between two measurement points for the 2P-FS method and corresponding to the same lateral segment of data for the FS method. Using the 2P-FS method, data acquired with a very short distance (1–2 mm) were sufficient in order to provide robust estimates of the attenuation coefficient. For the same lateral segment of data with multiple acquisitions for FS, the attenuation coefficient experienced higher IQR range.
This confirms that shear waveforms measured along a very short lateral distance (e.g. 1–2 mm), at only two points, are sufficient in order to properly reconstruct the shear wave attenuation. This is confirmed with boxplots for the numerical and experimental data in Figs. 5 and 11. Generally, the 2P-FS method exhibit lower IQRs for the numerical models and experimental phantoms investigated.
The 2P-FS method was also tested using two ex vivo porcine livers data in Fig. 13 - 17. The 2P-FS method provides smaller IQRs than the FS and AMUSE approaches. Differences between both samples in terms of attenuation were observed. We cannot unambiguously state where this difference is coming from. These pigs were different, but were not from diseased animals.
It is worth mentioning that attenuation measurements for the 2P-FS method, for the numerical data with various SNR levels (Fig. S1 in the Supplementary material), correspond, in general, to the experimental data investigated in this paper. For example, results for Model C with a SNR of 5 or 10 dB (Fig. S1c) have similar attenuation variation as the attenuation measurements for the TM viscoelastic phantoms (Fig. 10a). IQR ranges between these data are also comparable, as is shown in Figs. 7 and 11.
It should be mentioned that the shear wave attenuation from either the 2P-FS or FS methods are dependent on the data input to the algorithm. We have also observed that adjusting the distance range of the data, i.e., the distance from the excitation source can cause changes to the attenuation. Because of the shear wave variations within the near field, it can be difficult to accurately evaluate attenuation in materials within this area. Hence, the area beyond the near field where the shear wave is more uniform (a full particle velocity waveform is present) is recommended to use. This behavior was also observed for the FS method and for calculating a shear wave phase velocity [21], [22], [29], [30].
Moreover, since the 2P-FS method uses a reduced number of data points (from two spatially distributed points only), it has a strong potential in scenarios where shear waves decay very fast and do not propagate over a long distance. In some scenarios, it may be useful to have these locations closely spaced due to high attenuation in viscoelastic media. However, in other cases, it may be necessary to have some minimum spacing if, for example, the material has higher shear wave velocities.
Another advantage is that the 2P-FS method requires shear wave velocity waveforms measured at two locations. Thereby, the temporal resolution of acquisitions can be increased by tracking shear waves at a reduced number of spatial locations. This in turn, may increase the signal-to-noise ratio of shear wave tracking [6]. Moreover, instead of using plane waves, focused transmit beams could also increase SNR at the two locations of interest [44].
Additionally, recent efforts have been made to reconstruct images of phase velocity and attenuation. Budelli, et al., have demonstrated this by using phase gradient and amplitude decay methods with a moving window [25]. Additional related work has been conducted by van Sloun, et al., to use a model-fitting approach on the shear wave motion for reconstructing images of the shear wave velocity and viscosity [31]. Local phase velocity imaging (LPVI) was proposed by Kijanka and Urban to create images of phase velocity at different frequencies in homogeneous and inhomogeneous media using Fourier decomposition and a moving window [45], [46]. Additional efforts will be devoted for evaluating whether the two-point frequency shift method can be extended for imaging purposes. The first point and the distance between the two points have an effect on reconstructed attenuation and hence, the comb-push ultrasound shear elastography (CUSE) approach which uses multiple simultaneous acoustic radiation force pushes for of the shear wave excitation may be beneficial [47].
One of the limitations of this method is that results might be corrupted by outliers or motion recordings with high noise content. Hence, additional steps in order to overcome these outliers will be necessary. For example, a comparison of the attenuation results for two different sets of measurement points can be done and further evaluated for their agreement. Secondly, an averaging of the shape parameter in Eq. (14) from more than two measurement points can be executed resulting in a more robust results. In future work, we will use this method on data from in vivo tissue measurements to determine the robustness of the 2P-FS method.
VII. Conclusions
A method for the estimation of shear wave attenuation based on the frequency shift and measurements from only two lateral positions was presented. The newly developed method was tested on simulated and experimental phantom data. In comparison with the FS method, the 2P-FS technique does not assumes a hypothesis that the shape parameter of the Gamma distribution function is constant over a lateral distance which, for some cases, may be difficult to achieve. Future work will be devoted to use this method for analyzing data acquired from in vivo studies.
Supplementary Material
Acknowledgment
The content is solely the responsibility of authors and does not necessarily represent the official views of the National Institute of Diabetes and Digestive and Kidney Diseases or the National Institutes of Health.
This work was supported by grant R01DK092255 from the National Institutes of Health.
Footnotes
This article has supplementary material provided by the authors.
Contributor Information
Piotr Kijanka, Department of Radiology, Mayo Clinic, Rochester, MN 55905 USA, and also with the Department of Robotics and Mechatronics, AGH University of Science and Technology, 30-059 Krakow, Poland.
Matthew W. Urban, Department of Radiology, Mayo Clinic, Rochester, MN 55905 USA and also with the Department of Physiology and Biomedical Engineering, Mayo Clinic, Rochester, MN 55905 USA.
References
- [1].Sarvazyan A, Hall T, Urban M, Fatemi M, Aglyamov S, and Garra B, “Elasticity imaging-an emerging branch of medical imaging. an overview,” Curr. Med. Imaging Rev, vol. 7, no. 4, pp. 255–282, 2011. [DOI] [PMC free article] [PubMed] [Google Scholar]
- [2].Cosgrove D, Piscaglia F, Bamber J, Bojunga J, Correas J-M, Gilja O, Klauser A, Sporea I, Calliada F, Cantisani V et al. , “Efsumb guidelines and recommendations on the clinical use of ultrasound elastography. part 2: Clinical applications,” Ultraschall in der Medizin-European Journal of Ultrasound, vol. 34, no. 03, pp. 238–253, 2013. [DOI] [PubMed] [Google Scholar]
- [3].Nightingale KR, Palmeri ML, Nightingale RW, and Trahey GE, “On the feasibility of remote palpation using acoustic radiation force,” The Journal of the Acoustical Society of America, vol. 110, no. 1, pp. 625–634, 2001. [DOI] [PubMed] [Google Scholar]
- [4].Urban MW, “Production of acoustic radiation force using ultrasound: methods and applications,” Expert Review of Medical Devices, vol. 15, no. 11, pp. 819–834, 2018. [DOI] [PMC free article] [PubMed] [Google Scholar]
- [5].Montaldo G, Tanter M, Bercoff J, Benech N, and Fink M, “Coherent plane-wave compounding for very high frame rate ultrasonography and transient elastography,” IEEE Trans. Ultrason., Ferroelect., Freq. Control, vol. 56, no. 3, pp. 489–506, 2009. [DOI] [PubMed] [Google Scholar]
- [6].Song P, Macdonald MC, Behler RH, Lanning JD, Wang MH, Urban MW, Manduca A, Zhao H, Callstrom MR, Alizad A et al. , “Two-dimensional shear-wave elastography on conventional ultrasound scanners with time-aligned sequential tracking (tast) and shear elastography (cuse),” IEEE Trans. Ultrason., Ferroelect., Freq. Control, vol. 62, no. 2, pp. 290–302, 2015. [DOI] [PMC free article] [PubMed] [Google Scholar]
- [7].Palmeri ML, Wang MH, Dahl JJ, Frinkley KD, and Nightingale KR, “Quantifying hepatic shear modulus in vivo using acoustic radiation force,” Ultrasound in medicine & biology, vol. 34, no. 4, pp. 546–558, 2008. [DOI] [PMC free article] [PubMed] [Google Scholar]
- [8].Rouze NC, Wang MH, Palmeri ML, and Nightingale KR, “Parameters affecting the resolution and accuracy of 2-d quantitative shear wave images,” IEEE Trans. Ultrason., Ferroelect., Freq. Control, vol. 59, no. 8, pp. 1729–1740, 2012. [DOI] [PMC free article] [PubMed] [Google Scholar]
- [9].Bercoff J, Tanter M, and Fink M, “Supersonic shear imaging: a new technique for soft tissue elasticity mapping,” IEEE Trans. Ultrason., Ferroelect., Freq. Control, vol. 51, no. 4, pp. 396–409, 2004. [DOI] [PubMed] [Google Scholar]
- [10].Song P, Manduca A, Zhao H, Urban MW, Greenleaf JF, and Chen S, “Fast shear compounding using robust 2-d shear wave speed calculation and multi-directional filtering,” Ultrasound in Medicine and Biology, vol. 40, no. 6, pp. 1343–1355, 2014. [DOI] [PMC free article] [PubMed] [Google Scholar]
- [11].W Urban M, Chen S, and Fatemi M, “A review of shearwave dispersion ultrasound vibrometry (sduv) and its applications,” Current medical imaging reviews, vol. 8, no. 1, pp. 27–36, 2012. [DOI] [PMC free article] [PubMed] [Google Scholar]
- [12].Chen S, Urban MW, Pislaru C, Kinnick R, Zheng Y, Yao A, and Greenleaf JF, “Shearwave dispersion ultrasound vibrometry (sduv) for measuring tissue elasticity and viscosity,” IEEE Trans. Ultrason., Ferroelect., Freq. Control, vol. 56, no. 1, pp. 55–62, 2009. [DOI] [PMC free article] [PubMed] [Google Scholar]
- [13].Deffieux T, Montaldo G, Tanter M, and Fink M, “Shear wave spectroscopy for in vivo quantification of human soft tissues viscoelasticity,” IEEE Trans. Med. Imag, vol. 28, no. 3, pp. 313–322, 2009. [DOI] [PubMed] [Google Scholar]
- [14].Chen S, Sanchez W, Callstrom MR, Gorman B, Lewis JT, Sanderson SO, Greenleaf JF, Xie H, Shi Y, Pashley M, Shamdasani V, Lachman M, and Metz S, “Assessment of liver viscoelasticity by using shear waves induced by ultrasound radiation force,” Radiology, vol. 266, no. 3, pp. 964–970, 2013. [DOI] [PMC free article] [PubMed] [Google Scholar]
- [15].Nightingale KR, Rouze NC, Rosenzweig SJ, Wang MH, Abdelmalek MF, Guy CD, and Palmeri ML, “Derivation and analysis of viscoelastic properties in human liver: Impact of frequency on fibrosis and steatosis staging,” IEEE Trans. Ultrason., Ferroelect., Freq. Control, vol. 62, no. 1, pp. 165–175, 2015. [DOI] [PMC free article] [PubMed] [Google Scholar]
- [16].Deffieux T, Gennisson J-L, Bousquet L, Corouge M, Cosconea S, Amroun D, Tripon S, Terris B, Mallet V, Sogni P et al. , “Investigating liver stiffness and viscosity for fibrosis, steatosis and activity staging using shear wave elastography,” Journal of hepatology, vol. 62, no. 2, pp. 317–324, 2015. [DOI] [PubMed] [Google Scholar]
- [17].Gennisson J-L, Deffieux T, Macé E, Montaldo G, Fink M, and Tanter M, “Viscoelastic and anisotropic mechanical properties of in vivo muscle tissue assessed by supersonic shear imaging,” Ultrasound in medicine & biology, vol. 36, no. 5, pp. 789–801, 2010. [DOI] [PubMed] [Google Scholar]
- [18].Tanter M, Bercoff J, Athanasiou A, Deffieux T, Gennisson J-L, Montaldo G, Muller M, Tardivon A, and Fink M, “Quantitative assessment of breast lesion viscoelasticity: initial clinical results using supersonic shear imaging,” Ultrasound in medicine & biology, vol. 34, no. 9, pp. 1373–1386, 2008. [DOI] [PubMed] [Google Scholar]
- [19].Chen S, Fatemi M, and Greenleaf JF, “Quantifying elasticity and viscosity from measurement of shear wave speed dispersion,” The Journal of the Acoust. Soc. of America, vol. 115, no. 6, pp. 2781–2785, 2004. [DOI] [PubMed] [Google Scholar]
- [20].Bernal M, Nenadic I, Urban MW, and Greenleaf JF, “Material property estimation for tubes and arteries using ultrasound radiation force and analysis of propagating modes,” The Journal of the Acoustical Society of America, vol. 129, no. 3, pp. 1344–1354, 2011. [DOI] [PMC free article] [PubMed] [Google Scholar]
- [21].Kijanka P, Qiang B, Song P, Amador C, Chen S, and Urban MW, “Robust phase velocity dispersion estimation of viscoelastic materials used for medical applications based on the multiple signal classification method,” IEEE Trans. Ultrason., Ferroelect., Freq. Control, vol. 65, no. 3, pp. 423–439, 2018. [DOI] [PMC free article] [PubMed] [Google Scholar]
- [22].Kijanka P, Ambrozinski L, and Urban MW, “Two point method for robust shear wave phase velocity dispersion estimation of viscoelastic materials,” Ultrasound in Medicine & Biology, vol. 45, no. 9, pp. 2540–2553, 2019. [DOI] [PMC free article] [PubMed] [Google Scholar]
- [23].Catheline S, Gennisson J-L, Delon G, Fink M, Sinkus R, Abouelkaram S, and Culioli J, “Measurement of viscoelastic properties of homogeneous soft solid using transient elastography: an inverse problem approach,” The Journal of the Acoustical Society of America, vol. 116, no. 6, pp. 3734–3741, 2004. [DOI] [PubMed] [Google Scholar]
- [24].Urban M and Greenleaf J, “A kramers–kronig-based quality factor for shear wave propagation in soft tissue,” Physics in Medicine & Biology, vol. 54, no. 19, p. 5919, 2009. [DOI] [PMC free article] [PubMed] [Google Scholar]
- [25].Budelli E, Brum J, Bernal M, Deffieux T, Tanter M, Lema P, Negreira C, and Gennisson J-L, “A diffraction correction for storage and loss moduli imaging using radiation force based elastography,” Physics in medicine and biology, vol. 62, no. 1, p. 91, 2017. [DOI] [PubMed] [Google Scholar]
- [26].Kazemirad S, Bernard S, Hybois S, Tang A, and Cloutier G, “Ultrasound shear wave viscoelastography: Model-independent quantification of the complex shear modulus,” IEEE Trans. Ultrason., Ferroelect., Freq. Control, vol. 63, no. 9, pp. 1399–1408, 2016. [DOI] [PubMed] [Google Scholar]
- [27].Nenadic IZ, Qiang B, Urban MW, Zhao H, Sanchez W, Greenleaf JF, and Chen S, “Attenuation measuring ultrasound shearwave elastography and in vivo application in post-transplant liver patients,” Physics in medicine and biology, vol. 62, no. 2, p. 484, 2016. [DOI] [PMC free article] [PubMed] [Google Scholar]
- [28].Rouze NC, Palmeri ML, and Nightingale KR, “An analytic, fourier domain description of shear wave propagation in a viscoelastic medium using asymmetric gaussian sources,” The Journal of the Acoustical Society of America, vol. 138, no. 2, pp. 1012–1022, 2015. [DOI] [PMC free article] [PubMed] [Google Scholar]
- [29].Rouze NC, Deng Y, Palmeri ML, and Nightingale KR, “Accounting for the spatial observation window in the 2-d fourier transform analysis of shear wave attenuation,” Ultrasound in Medicine & Biology, vol. 43, no. 10, pp. 2500–2506, 2017. [DOI] [PMC free article] [PubMed] [Google Scholar]
- [30].Bernard S, Kazemirad S, and Cloutier G, “A frequency-shift method to measure shear-wave attenuation in soft tissues,” IEEE Trans. Ultrason., Ferroelect., Freq. Control, vol. 64, no. 3, pp. 514–524, 2017. [DOI] [PubMed] [Google Scholar]
- [31].van Sloun RJ, Wildeboer RR, Wijkstra H, and Mischi M, “Viscoelasticity mapping by identification of local shear wave dynamics,” IEEE Trans. Ultrason., Ferroelect., Freq. Control, vol. 64, no. 11, pp. 1666–1673, 2017. [DOI] [PubMed] [Google Scholar]
- [32].Davis PJ, “Leonhard euler’s integral: A historical profile of the gamma function: In memoriam: Milton abramowitz,” The American Mathematical Monthly, vol. 66, no. 10, pp. 849–869, 1959. [Google Scholar]
- [33].Li C and Liu X, “A new method for interval q-factor inversion from seismic reflection data,” Geophysics, vol. 80, no. 6, pp. R361–R373, 2015. [Google Scholar]
- [34].Vappou J, Maleke C, and Konofagou EE, “Quantitative viscoelastic parameters measured by harmonic motion imaging,” Physics in Medicine & Biology, vol. 54, no. 11, p. 3579, 2009. [DOI] [PubMed] [Google Scholar]
- [35].Delsanto P, Schechter R, Chaskelis H, Mignogna R, and Kline R, “Connection machine simulation of ultrasonic wave propagation in materials. ii: the two-dimensional case,” Wave Motion, vol. 20, no. 4, pp. 295–314, 1994. [Google Scholar]
- [36].Kijanka P, Radecki R, Packo P, Staszewski W, and Uhl T, “Gpu-based local interaction simulation approach for simplified temperature effect modelling in lamb wave propagation used for damage detection,” Smart materials and structures, vol. 22, no. 3, p. 035014, 2013. [Google Scholar]
- [37].Packo P, Radecki R, Kijanka P, Staszewski WJ, Uhl T, and Leamy MJ, “Local numerical modelling of ultrasonic guided waves in linear and nonlinear media,” in Health Monitoring of Structural and Biological Systems 2017, vol. 10170 International Society for Optics and Photonics, 2017, p. 1017023. [Google Scholar]
- [38].Lee B and Staszewski W, “Modelling of lamb waves for damage detection in metallic structures: Part ii. wave interactions with damage,” Smart Materials and Structures, vol. 12, no. 5, p. 815, 2003. [Google Scholar]
- [39].Bercoff J, Tanter M, Muller M, and Fink M, “The role of viscosity in the impulse diffraction field of elastic waves induced by the acoustic radiation force,” IEEE Trans. Ultrason., Ferroelect., Freq. Control, vol. 51, no. 11, pp. 1523–1536, 2004. [DOI] [PubMed] [Google Scholar]
- [40].Jensen JA and Svendsen NB, “Calculation of pressure fields from arbitrarily shaped, apodized, and excited ultrasound transducers,” IEEE Trans. Ultrason., Ferroelect., Freq. Control, vol. 39, no. 2, pp. 262–267, 1992. [DOI] [PubMed] [Google Scholar]
- [41].Jensen JA, “Field: A program for simulating ultrasound systems,” in 10th Nordicbaltic Conference On Biomedical Imaging, Vol. 4, Supplement 1, Part 1: 351–353. Citeseer, 1996. [Google Scholar]
- [42].Palmeri M, Nightingale K, Fielding S, Rouze N, Deng Y, Lynch T, Chen S, Song P, Urban M, Xie H et al. , “Rsna qiba ultrasound shear wave speed phase ii phantom study in viscoelastic media,” in Ultrasonics Symposium (IUS), 2015 IEEE International IEEE, 2015, pp. 1–4. [Google Scholar]
- [43].Kasai C, Namekawa K, Koyano A, and Omoto R, “Real-time two-dimensional blood flow imaging using an autocorrelation technique,” IEEE Trans. Sonics Ultrason, vol. 32, no. 3, pp. 458–464, 1985. [Google Scholar]
- [44].Palmeri ML, Deng Y, Rouze NC, and Nightingale KR, “Dependence of shear wave spectral content on acoustic radiation force excitation duration and spatial beamwidth,” in Ultrasonics Symposium (IUS), 2014 IEEE International IEEE, 2014, pp. 1105–1108. [Google Scholar]
- [45].Kijanka P and Urban MW, “Local phase velocity based imaging (lpvi): A new technique used for ultrasound shear wave elastography,” IEEE Trans. Med. Imag, vol. 38, no. 4, pp. 894–908, 2019. [DOI] [PMC free article] [PubMed] [Google Scholar]
- [46].——, “Local phase velocity based imaging (lpvi) of homogeneous viscoelastic phantoms and tissues,” Submitted to IEEE Trans. Ultrason., Ferroelect., Freq. Control, 2019. [DOI] [PMC free article] [PubMed] [Google Scholar]
- [47].Song P, Zhao H, Manduca A, Urban MW, Greenleaf JF, and Chen S, “Comb-push ultrasound shear elastography (cuse): a novel method for two-dimensional shear elasticity imaging of soft tissues,” IEEE Trans. Med. Imag, vol. 31, no. 9, pp. 1821–1832, 2012. [DOI] [PMC free article] [PubMed] [Google Scholar]
Associated Data
This section collects any data citations, data availability statements, or supplementary materials included in this article.


