Abstract
This study characterizes annual changes in enrollment of Medicare and non-Medicare patients treated at dialysis facilities before and after 2011 payment reforms and 2014 Affordable Care Act changes that influenced reimbursements.
Medicare finances health care for 80% of US patients with end-stage kidney disease (ESKD), the only condition eligible for near-universal coverage regardless of age.1 Patients not already enrolled in Medicare at diagnosis undergo a 3-month enrollment period for hemodialysis. Medicare acts as the secondary payer for privately insured patients for 30 months, before becoming the primary payer. Medicare becomes the primary payer at 3 months for patients who were not previously privately insured.
Private insurers generally reimburse at higher rates than Medicare,2,3 and policy changes in the last decade may have influenced dialysis facilities to adjust their payer mix to private insurance. Medicare’s 2011 implementation of dialysis bundled payment effectively reduced Medicare reimbursement for hemodialysis (the dominant modality),4 potentially increasing the difference between Medicare and private reimbursement. In 2014, the Affordable Care Act Marketplaces also increased access to private insurance.2 Both policy changes may have influenced the types of patients that dialysis facilities cared for over time, but no study has examined changes in facility payer mix. We report 2005 through 2016 trends in Medicare and non-Medicare insurance enrollment in dialysis facilities.
Methods
A national longitudinal cohort of US, nonfederal outpatient dialysis facilities between 2005 and 2016 was identified using the Annual Facility Survey (CMS Form 2744) and Medicare Provider of Service files. The primary outcomes were annual proportions of dialysis facilities’ year-end Medicare patient census across 3 mutually exclusive categories: enrolled in Medicare (primary or secondary payer), pending Medicare application, and not enrolled in Medicare (non-Medicare).
Trends in insurance enrollment were evaluated using observed means. The annual proportion with non-Medicare coverage and annual change were estimated using the generalized least-squares model with random effects and a linear spline and was adjusted for facility-level (profit status, chain status) and market-level (US region; competition measured via Herfindahl Index; patients aged <65 years with ESKD) characteristics using Stata version 15 (xtreg command; StataCorp). Significance was evaluated in 2-sided tests with an α of .05. Observed trends by dialysis facility for-profit status and affiliation with the 2 largest dialysis chains were also examined.
Results
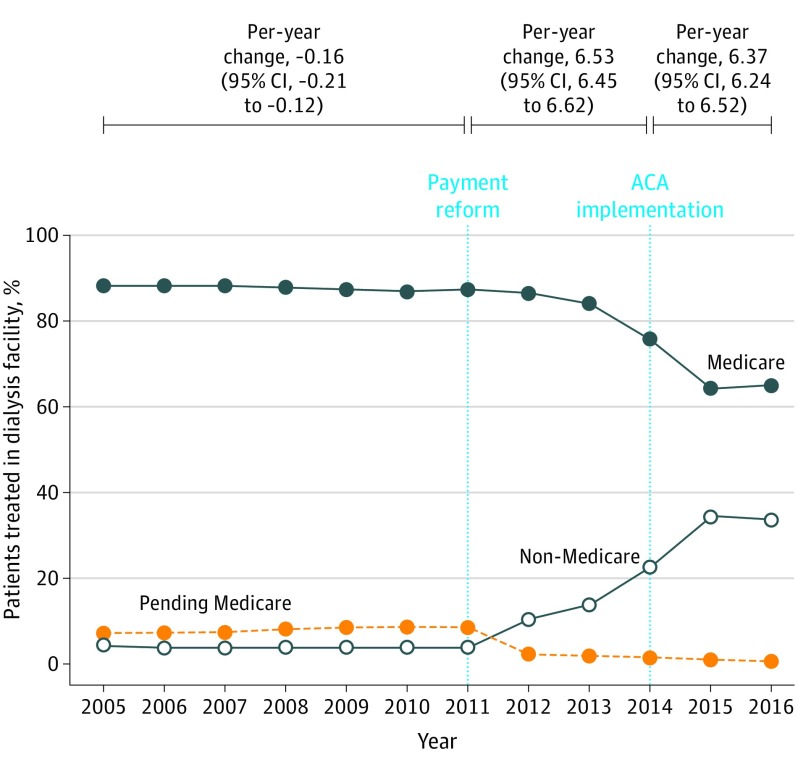
The number of dialysis facilities (65 231 facility-years) increased from 4439 in 2005 to 6522 in 2016. The percentage of for-profit dialysis facilities increased from 79.6% in 2005 to 87.6% in 2016 (P < .001). The percentage of those affiliated with large chains increased from 44.3% to 72.7% (P < .001). In 2005, dialysis facilities reported that 88.5% (95% CI, 88.2%-88.7%) of their patients with ESKD were enrolled in Medicare, on average, which decreased to 87.3% (95% CI, 87.1%-87.6%) in 2011, 75.9% (95% CI, 75.5%-76.2%) in 2014, and 65.3% (95% CI, 64.9%-65.7%) in 2016 (Figure 1). The mean percentage of patients with pending Medicare applications treated at dialysis facilities decreased from 7.4% (95% CI, 7.2%-7.6%) in 2005 to 0.83% (95% CI, 0.74%-0.91%) in 2016.
Figure 1. Annual Change in Medicare and Non-Medicare Enrollment Reported by Dialysis Facilities, 2005-2016.
The data points represent the mean percentage of patients at dialysis facilities; the annual change (95% CI) represents patients with non-Medicare coverage. Direct tests of differences between periods indicated that the growth in non-Medicare coverage was statistically significantly different between 2011-2014 and 2005-2011 (6.70 percentage points; 95% CI, 6.58-6.81), but not between 2014-2016 and 2011-2014 (–0.16 percentage points; 95% CI, –0.36 to 0.04). The slopes were generated using a generalized least-squares model with random effects, linear splines, and adjustment for facility-level characteristics (profit status, membership in 2 of the largest chains) and hospital referral region characteristics (US region, competition [Herfindahl Index], percentage of patients aged <65 years with end-stage kidney disease). ACA indicates Affordable Care Act.
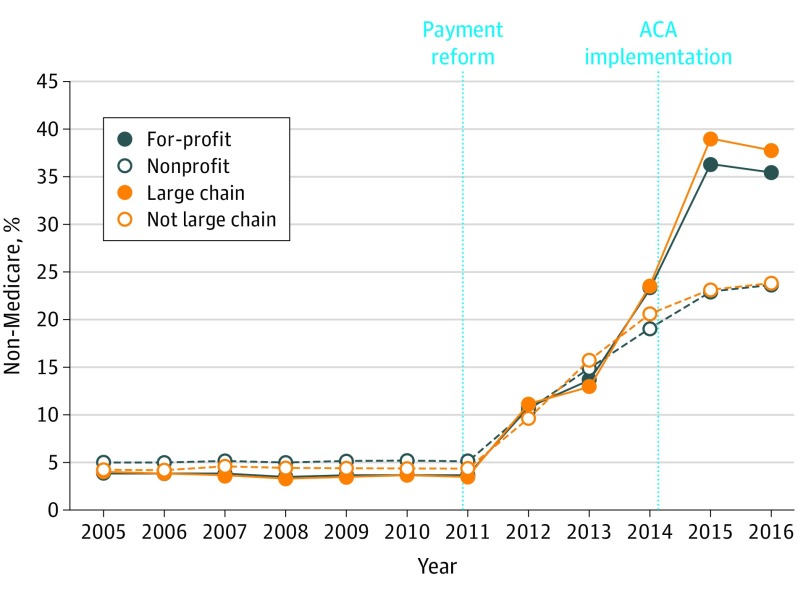
The percentage of patients enrolled in non-Medicare plans increased from 4.1% (95% CI, 4.0% to 4.3%) in 2005 to 33.9% (95% CI, 33.5% to 34.1%) in 2016. The largest annual increases occurred in the 2011-2014 period (6.5 percentage points; 95% CI, 6.5 to 6.6). The annual change in non-Medicare coverage was significantly different in the 2005-2011 vs 2011-2014 period (6.70 percentage points; 95% CI, 6.58 to 6.81), but not in the 2014-2016 vs 2011-2014 period (–0.16 percentage points; 95% CI, –0.36 to 0.04; Figure 1). Observed increases in non-Medicare coverage were more pronounced among for-profit and large chain–affiliated facilities (Figure 2).
Figure 2. Annual Change in Non-Medicare Enrollment by Dialysis Facilities’ Profit and Large Chain Status, 2005-2016.
The figure shows the mean percentage of patients at the facility level who do not have Medicare coverage. Facilities are categorized by affiliation with 1 of the 2 largest dialysis chains and by profit status. These 2 categories are highly collinear with a correlation of 53.3%. ACA indicates Affordable Care Act.
Discussion
After policy changes in 2011 and 2014, dialysis facilities decreased their reliance on Medicare, as reflected in payer mix shifting from Medicare to non-Medicare revenue sources.
These trends are consistent with concerns that some dialysis facilities may be encouraging patients to maintain commercial insurance or are subsidizing private insurance coverage via charitable premium assistance programs partially funded by dialysis organizations.2,3 There is no evidence that increased non-Medicare coverage is associated with patient harm,5 and private insurance may cost less than Medicare for some patients. Yet, declines in Medicare enrollment may lead to higher societal costs and could decrease access to care for some patients.2
Limitations include that the data preclude specifying insurance types in non-Medicare coverage, differentiating Medicare as the primary vs secondary payer, and inferring causality. Future work should examine the effects of shifts in payer mix at dialysis facilities on outcomes for patients.
Section Editor: Jody W. Zylke, MD, Deputy Editor.
References
- 1.US Renal Data System USRDS 2018 Annual Data Report: Atlas of End-Stage Renal Disease in the United States. National Institute of Diabetes and Digestive and Kidney Diseases; 2018. [Google Scholar]
- 2.Centers for Medicare & Medicaid Services Medicare Program; conditions for coverage for end-stage renal disease facilities-third party payment. Fed Regist. 2016;81(240)90211-90228. [PubMed] [Google Scholar]
- 3.Jost T. CMS acts on premium payments by dialysis facilities, special enrollment period eligibility. Health Affairs blog. December 13, 2016. Accessed August 15, 2019. https://www.healthaffairs.org/do/10.1377/hblog20161213.057930/full/
- 4.Sloan CE, Coffman CJ, Sanders LL, et al. Trends in peritoneal dialysis use in the United States after Medicare payment reform. Clin J Am Soc Nephrol. 2019;14(12):1763-1772. doi: 10.2215/CJN.05910519 [DOI] [PMC free article] [PubMed] [Google Scholar]
- 5.Dialysis Patient Citizens et al v Burwell et al, Case No. 4:2017cv00016 (ED Tex 2017).


