

Abstract
Objectives:
To evaluate whether combining stability and discriminability criteria in building radiomic classifiers will improve the prognosis of cancer recurrence in early stage non-small cell lung cancer on non-contrast computer tomography (CT).
Materials and Methods:
CT scans of 610 patients with early stage (IA, IB, IIA) NSCLC from four independent cohorts were evaluated. A total of 350 patients from Cleveland Clinic Foundation and University of Pennsylvania were divided into two equal sets for training (D1) and validation set (D2). 80 patients from The Cancer Genome Atlas Lung Adenocarcinoma and Squamous Cell Carcinoma and 195 patients from The Cancer Imaging Archive, were used as independent second (D3) and third (D4) validation sets. A linear discriminant analysis (LDA) classifier was built based on the most stable and discriminate features. In addition, a radiomic risk score (RRS) was generated by using least absolute shrinkage and selection operator, Cox regression model to predict time to progression (TTP) following surgery.
Results:
A feature selection strategy focusing on both feature discriminability and stability resulted in the classifier having a higher discriminability on validation datasets compared to the discriminability alone criteria in discriminating cancer recurrence (D2, AUC of 0.75 vs. 0.65; D3, 0.74 vs. 0.62; D4, 0.76 vs. 0.63). The RRS generated by most stable-discriminating features was significantly associated with TTP compared to discriminating alone criteria (HR=1.66, C-index of 0.72 vs. HR=1.04, C-index of 0.62).
Conclusion:
Accounting for both stability and discriminability yielded a more generalizable classifier for predicting cancer recurrence and TTP in early stage NSCLC.
Keywords: NSCLC, Surgery, Adjuvant chemotherapy, Radiomics, Quantitative imaging
1. Introduction
Surgery is a potentially curative treatment modality for early-stage (stage I, II by AJCC 8th edition) non-small cell lung cancer patients [1]. Currently, therapeutic decisions regarding adjuvant chemotherapy are made based on the AJCC TNM staging which takes into account the size of tumor and nodal involvement [2]. However, despite the curative intent of therapy, about 40–55% of lung cancer patients develop recurrence [3, 4]. Improved risk stratification of these patient may justify a role for intensifying adjuvant therapies in a high risk for recurrence subgroup of early stage lung cancer patients [5].
While vascular invasion, pleural invasion and genetic mutations are histologic markers that suggest higher risk disease, there is no consensus regarding their use in making decisions about adjuvant therapy. Additionally, there are no approved non-invasive biomarkers for the identification of patients who are at increased risk for recurrence post-surgery.
Radiomics is the comprehensive quantification of tumor phenotypes visualized on radiographic scans in order to identify subtle image-based tumor attributes that may correlate with disease prognosis. However, the quality of computerized tomographic (CT) scans for radiomic feature analysis in NSCLC often varies due to different equipment and acquisition protocols. These pre-analytic sources of variance can lead to differences in the quality and appearance of the resulting CT scans and hence potentially affect the generalizability of the developed radiomic model [6, 7, 8].
In order to construct radiomic classifiers, existing approaches rely on a statistical feature selection scheme which identifies the best radiomic features to incorporate. Many of these schemes identify features that either mitigate correlation between the features themselves or maximize discriminability between the target classes; however, these approaches do not explicitly invoke criteria which guarantee the stability or the generalizability of the features across sites, scanners, reconstruction kernels, slice thickness, resolution and other acquisition parameters. These pre-analytic sources of variance have been shown to influence downstream radiomic analysis which have been shown to work well when the data is homogeneous but typically tends to degrade in performance when images with heterogeneity in these parameters are introduced [9]. To construct generalizable classifiers, one needs to identify features that are both discriminating and stable.
In this study, we sought to create a novel prognostic radiomics risk model using routine pre-treatment CT scans by explicitly invoking and selecting both stable and discriminative features. To this end, we sought to demonstrate that the developed prognostic radiomic risk model was generalizable across multiple institutions and sites.
2. Materials and Methods
2.1. Patients
This study was compliant with Health Insurance Portability and Accountability Act (HIPAA) and approved by the institutional review board at each of the participating institutions, where a retrospective chart review with de-identified data was used and no protected health information was needed. Thus, need for an informed consent from all patients was waived. A total of 700 early stage (I and II) NSCLC patients who had surgery were retrospectively documented from Cleveland Clinic Foundation (CCF, N1 = 556) and University of Pennsylvania (UPenn, N2 = 144) between November 10, 2004 and January 12, 2017. Patients without CT scans, lack of adequate outcome data, no identifiable nodule and a history of adjuvant or radiation therapy were excluded. In addition, there were 14 patients with R1/R2 resection margins that were excluded from our study. All remaining patients had R0 resection margins that indicates a microscopically margin-negative resection, in which no gross or microscopic tumor remains in the primary tumor bed.
After applying the exclusion criteria, the final cohort comprised of 350 early stage (IA, IB or IIA based on TNM 8th Edition) NSCLC patients from two sites (260 from CCF and 90 from UPenn) that was randomly divided into training (D1) and hold-out validation (D2) cohorts. We used an in-house developed algorithm implemented on MATLAB to select patients. We divided patients into two groups, comprising respectively recurrence and non-recurrence patients. For every four patients selected randomly from the non-recurrence group, one patient from the recurrence group was also randomly selected. By this way, we ensured that roughly 25% of the training set patients had recurred following surgery. The training set consisted of D1 = 175 patients, 52 with recurrence and 123 non-recurrences while the hold out validation set comprising D2 = 175 patients contained 55 cancer recurrences and 120 non-recurrences. In addition, 106 NSCLC patients who had previously undergone surgery from The Cancer Genome Atlas Lung Adenocarcinoma (TCGA-LUAD) and The Cancer Genome Atlas Lung Squamous Cell Carcinoma (TCGA-LUSC) collected from many sites all over the world (D3) [10], and 211 patients who had preoperative CT between April 7, 2008, and May 21, 2010 [11] from The Cancer Imaging Archive (TCIA) collected from two sites (Stanford University and Veterans Administration)(D4), were included and after applying the above mentioned exclusion criteria, the remaining D3 = 80 and D4 = 195 patients were used as two independent validation sets. Figure 1 illustrates the process of patient enrollment, eligibility, and exclusion criteria for the data sets used in this study.
Figure 1.
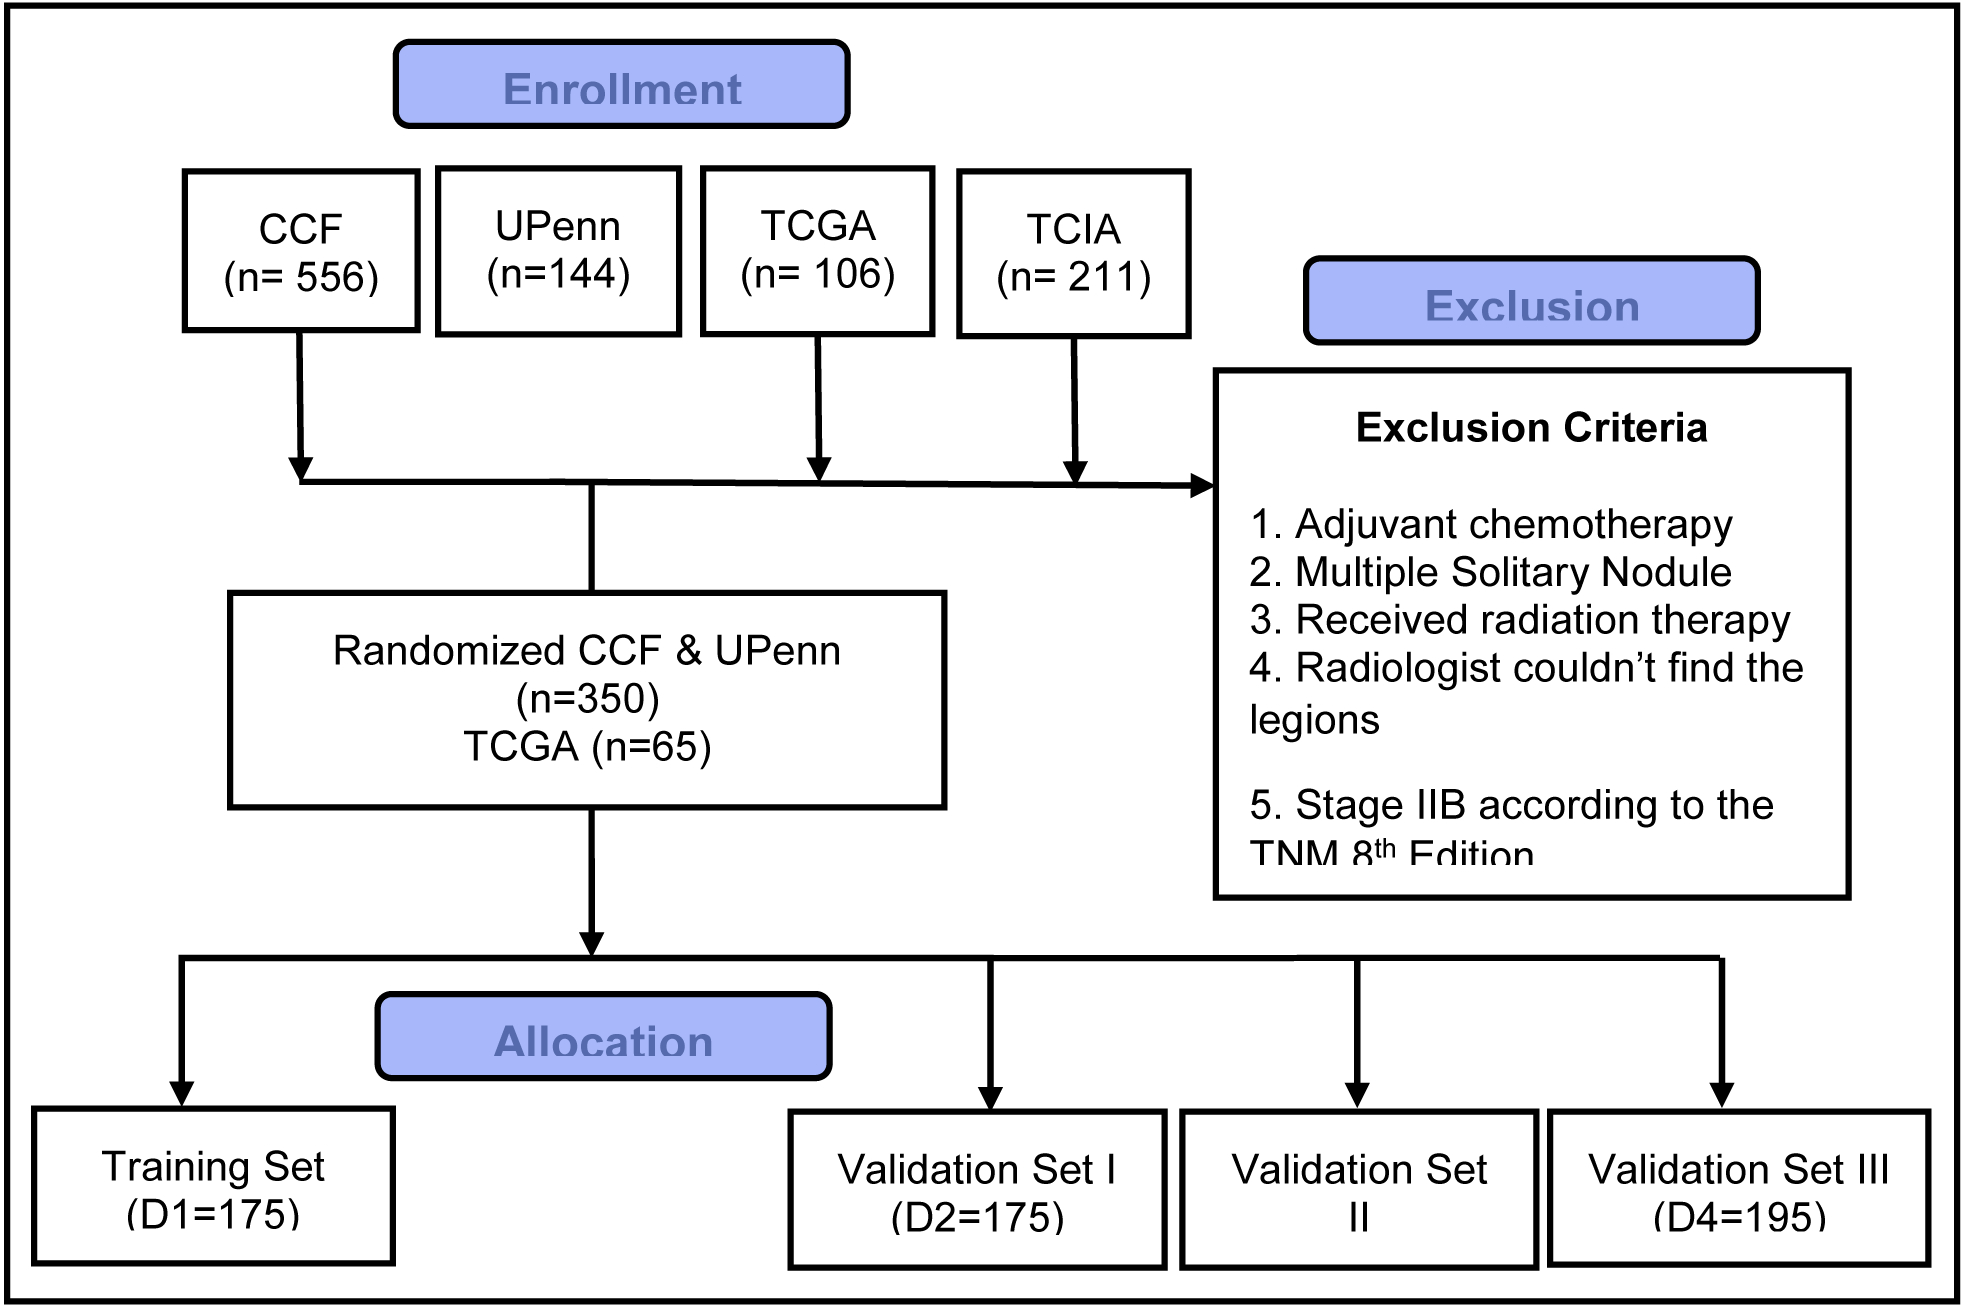
Consolidated Standards of Reporting Trials, flow diagram of patient enrollment, eligibility, and exclusion criteria of data set.
2.2. Follow-up
The primary end point of this study was time to progression (TTP), which was defined as the time from surgery until the disease starts to get worse (recurrence) or spread to other organs. The secondary end point was recurrence free survival (RFS), which was defined as the time from surgery to recurrence (to lung or other organs) or death due to cancer or non-cancer causes, whichever occurred earlier, or until the date of last follow up for alive and recurrence-free patients (censored). All patients from D1 and D2 were biopsied at recurrence and the recurrences were histologically proven. More details about locoregional or systematic recurrence can be found in Supplementary Material Table S1. The range of follow-up time was 16 – 81 months (median, 44.5 months).
2.3. CT Acquisition Protocols
All patients underwent non-contrast enhanced chest CT which were acquired using multi-slice CT systems from three different manufacturers, Siemens, Toshiba and Philips. Slice thicknesses varied from 0.6mm to 5mm. The datasets also had images acquired using multiple reconstruction kernels. Pixel sizes ranged from 0.44 × 0.44 mm to 0.99 × 0.99mm with an average size of 0.75 × 0.75mm. Each slice had a XY planar resolution of 512 × 512 pixels with a 16-bit gray scale resolution in Hounsfield Units (HU). The images for 200 patients were reconstructed by standard (low pass) convolution kernels (Siemens: ‘B321f’, ‘B35f’; Philips: ‘B’, ‘C’, ‘D’; Toshiba: ‘FC01’, ‘FC08’, ‘FC18’; GE: ‘SOFT’, ‘STANDARD’) while for 150 cases of 350, CT images were available for sharp (high pass) convolution kernels (Siemens: ‘B321s’, ‘B35fs; GE: ‘LUNG’). The median of peak tube voltage (kVp) was 120 (110 – 140) and the median x-ray tube current (mA) was 240 (80 – 400).
2.4. Nodule Segmentation and Imaging Texture Analysis
The target lesions were identified by board-certified cardiothoracic radiologist and subsequently the nodule with available pathologic diagnosis (to which the radiologist was blinded) was segmented using 3D-Slicer® software where a free hand tool was used to annotate the region of interest. The radiologist was blinded to all clinical and outcome information but had the ability to vary the window and level setting within 3D-Slicer®. The peritumoral compartment around the nodule was defined using morphological operations (dilation) as a region extending radially from the nodule boundary up to roughly 15 mm based on previous findings, where a resection margin >15mm did not have a prognostic effect in the context of disease recurrence [12, 13]. The region corresponding to air, chest or pericardial cavity was eliminated from within the peritumoral compartment and radiomic texture features subsequently extracted. Two-dimensional texture features were extracted slice by slice containing the whole volume of the nodule as well. The detailed description of the extracted features (Haralick, wavelet-based Gabor responses, Laws energy, and Laws-Laplacian energy) are provided in Supplementary Material Table S2. Additionally, a total of 12 computerized shape features were also extracted from annotated CT scans [14]. The radiomic features were ranked based on their discriminability and stability in the training set based on the preparation-induced instability score (PI), introduced by Leo et al in [15] (see Supplementary Material). Stable and discriminating features were identified and a subset of these features were then selected by a Minimum Redundancy Maximum Relevance (mRMR) feature selection algorithm [16] and subsequently used to construct a prognostic classifier.
2.5. Statistical Analysis
A linear discriminant analysis (LDA) classifier was used to evaluate the ability of the radiomic features to predict cancer recurrence in two validation sets. The classifier was modeled on the training set by using the most stable- discriminating and discriminative alone features.
In addition to predicting time to recurrence, the association of radiomic risk-score (RRS) with time to progression (TTP) and recurrence-free survival (RFS) was also evaluated. Multivariable Cox regression analysis with LASSO regularization to select A) the most stable and discriminating and B) the most discriminating (without accounting for stability) radiomic features, was used to build two RRS models to predict TTP and RFS. The risk score was calculated using a linear combination of those selected features with corresponding coefficients calculated by each model. Patients were stratified based on the median risk-score for each model and were divided into high-risk (i.e., surgery nonbenefit) and low-risk (i.e., surgery benefit) categories. The RRS models were then subsequently validated in three sets by using the Kaplan-Meier method and the Cox model. Additionally, evaluation of the radiomic risk score as an independent biomarker was performed by integrating the following clinical-pathologic risk factors into the multivariable Cox proportional hazards model: TNM stage (I, II), histologic grade (adenocarcinoma or squamous), sex (female or male), age, race, type of surgery, lymphatic invasion and vascular invasion.
Finally, the reproducibility of stable-discriminating and discriminating alone features was evaluated in the context of test/retest (RIDER) lung dataset [17] and intra-class correlation coefficient (ICC) was used to assess the reproducibility of features.
3. Results
3.1. Data analysis
A total of 350 patients with NSCLC from D1 and D2 were included in this study with a median age of 67 years (range 22−87 years), and majority of women (61%). Tumor histology was predominantly adenocarcinoma (79.3%) vs. 14.9% squamous cell carcinoma and 5.8% large cell carcinoma. The majority of patients had stage IA, B (63.6%), while 36.4% were in stage IIA N2. The median follow-up time was 35.53 months (range: 1.56 –107.5 months). The median time to recurrence after surgery was 17.5 months (range: 1.3 – 75.3 months). 78% (273) patients underwent lobectomy, 5.4% (19) underwent pneumonectomy and remaining 16.5% (58) underwent wedge resection (segmentectomy). The mean size of the tumors in the cohort was 3.1 cm (range: 2.5 – 4.8 cm). Supplementary Material Table S3 shows demographics and clinical characteristics for the 350 patients from D1 and D2. The data characteristic of two independent validation sets D3 and D4 can be found in [10, 11].
3.2. Machine based Classification in predicting the risk of recurrence
Figure 2 shows the PI-AUC space for 1356 features for D1 = 175 early stage NSCLC tumors based on inter-site variability in the training set. The X-axis corresponds to the PI values and the Y-axis corresponds to the AUC, each dot in the plane represents a pair of AUC and PI values for a specific radiomic feature. Different colors correspond to different feature families as reflected in Figure 2. The most stable and discriminating features are found around (0, 1), representing perfect discriminability and 100% stability. No single feature was found to be perfectly discriminating nor 100% stable.
Figure 2.
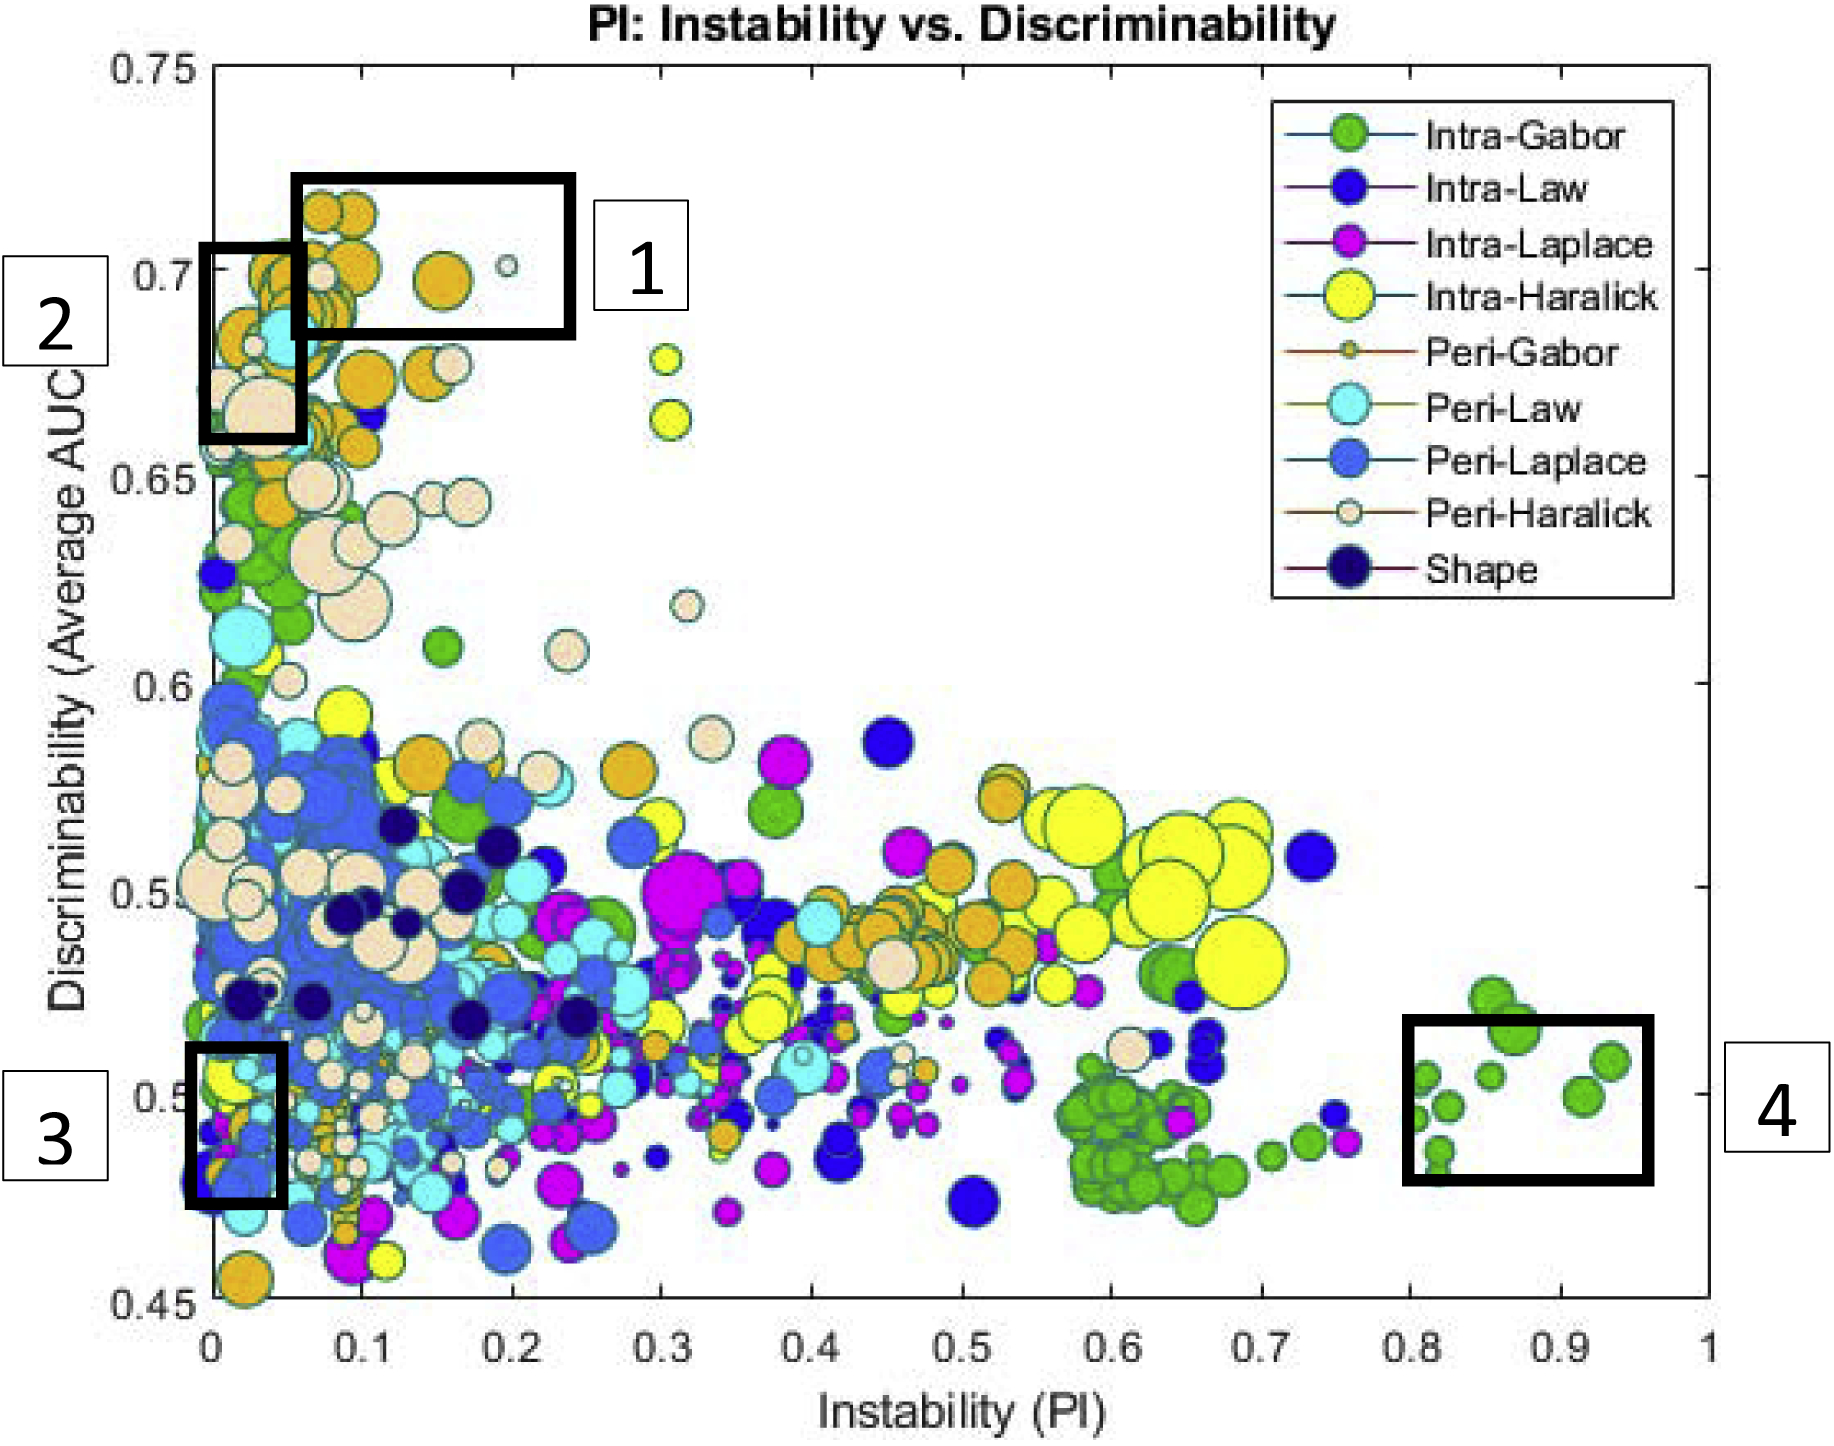
PI-AUC plot for 1356 features for 175 patients (training set) across two sites for prognosis classification task. Each feature is represented by a dot, color coded according to feature family. The size of each ball is the standard deviation of 12 different classifiers used for calculating average AUC. On the X-axis is the PI value for each feature associated with the cancer recurrence across the two sites. On the Y-axis is the corresponding AUC value for each feature. The AUC values were averaged across 100 iterations of 3-fold cross validation across all 175 patients from the two sites.
A total of 120 features passed the stability- discriminability threshold criteria and 213 features were identified based on the discriminability threshold alone. These features are summarized in Supplementary Material Figure S1. An LDA classifier trained with the most stable-discriminating features could discriminate cancer recurrence from non-recurrence with an AUC of 0.77 ± 0.02 in D1 and corresponding AUC of 0.75, 0.74 and 0.76 in D2, D3 and D4 respectively; while the LDA classifier trained with the discriminating features alone reached an AUC of 0.73 ± 0.06 in D1 and a corresponding AUC of 0.65, 0.62 and 0.63 in D2, D3 and D4 respectively.
In the context of test/retest (RIDER) dataset, stable- discriminate features had a higher ICC compared to features based on the discriminability criteria alone (ICC = 0.78 vs. 0.71).
Figure 3 visually illustrates two texture features color map from the Haralick feature family; 4(b) shows stable intranodular Haralick entropy feature (PI = 0.1, AUC = 0.67) and 4(c) shows unstable intranodular Haralick entropy (PI = 1, AUC = 0.68). As figure 4 suggests, the presence of a higher textural pattern disorder or heterogeneity within lesions on CT images can be seen in cancer recurrence as compared in lesions with cancer non-recurrence.
Figure 3.
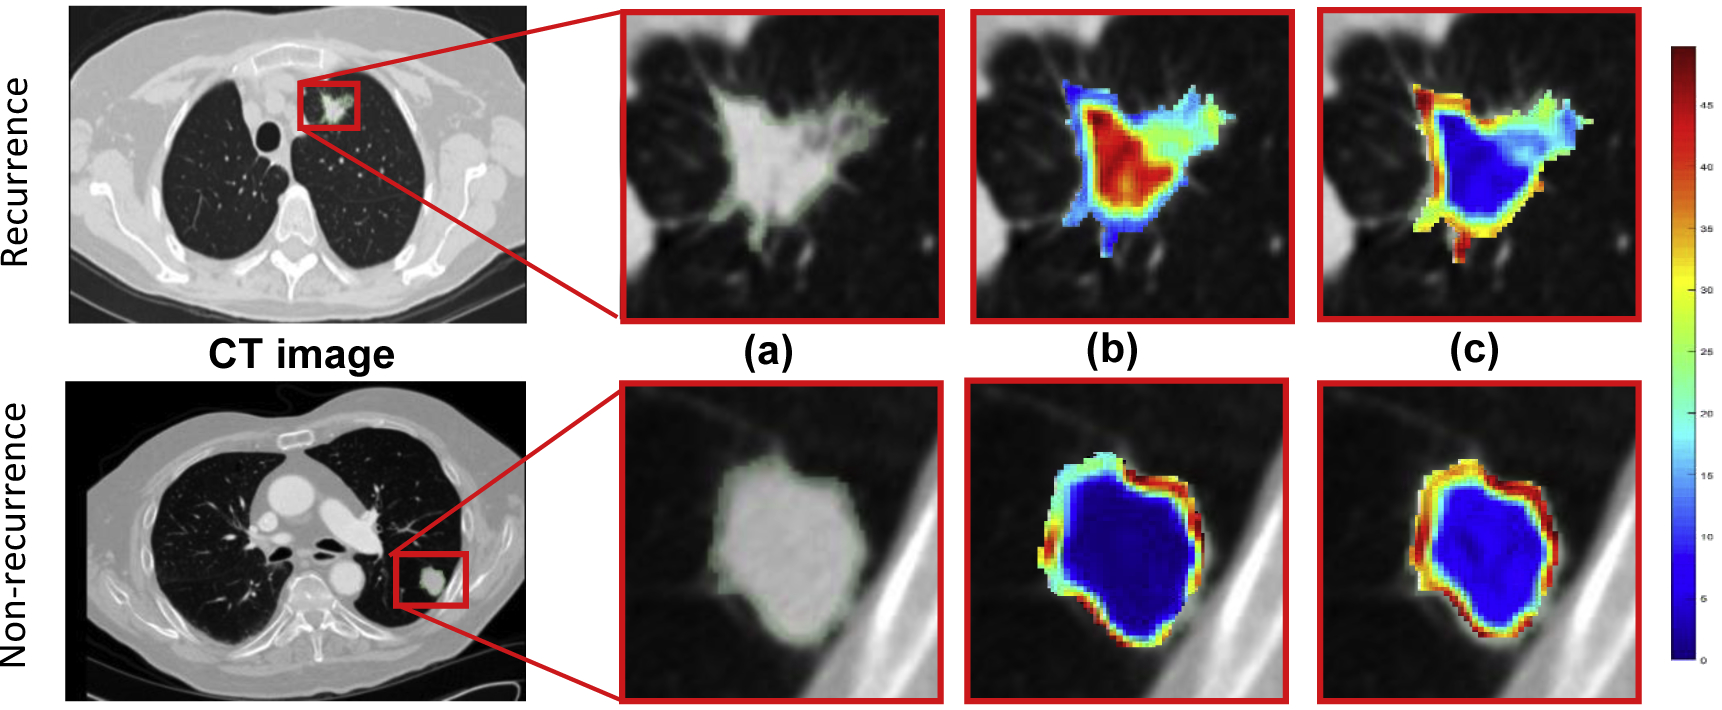
An illustration of lung nodule CT scans and associated feature maps. (a) ROI corresponding to the nodule within the CT scan of a recurrence (top) and a non-recurrence (bottom). Feature heat maps corresponding to two different intratumoral Haralick entropy feature with (b) PI = 0.1, AUC = 0.67 and (c) PI = 1, AUC = 0.68. Both have equivalent discrimination, but one is significantly more stable than the other.
Figure 4.
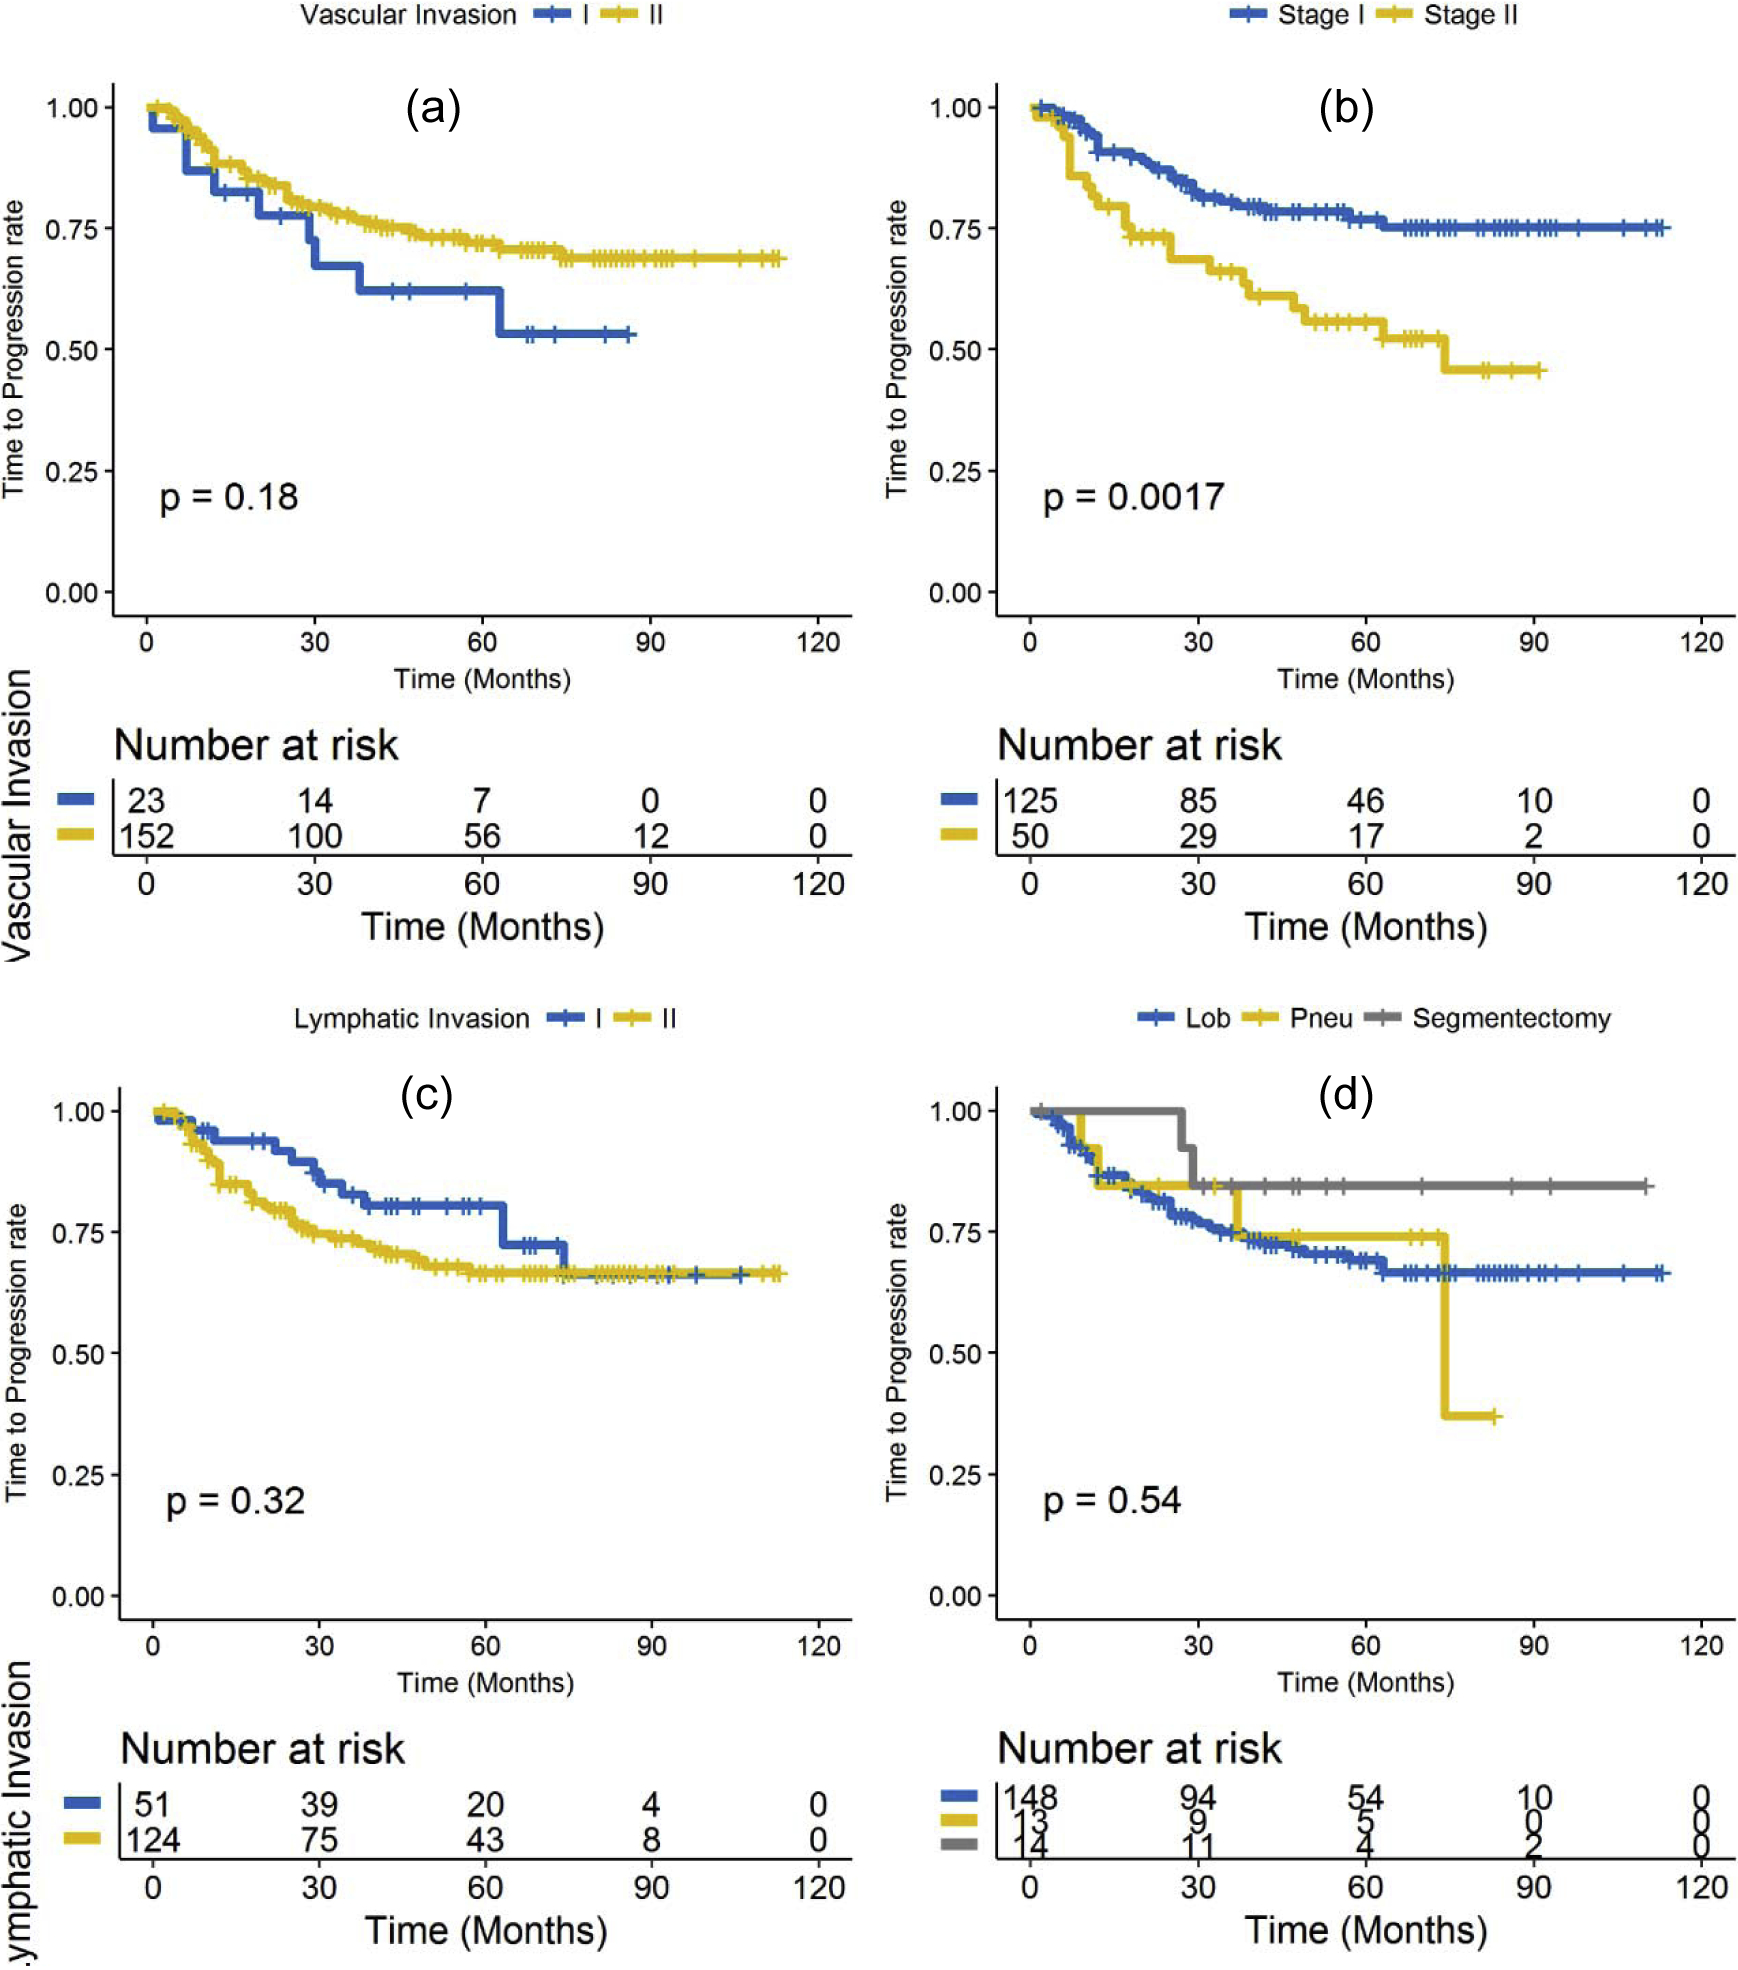
Kaplan-Meier time to progression for: (a) vascular invasion, (b) cancer stage, (c) lymphatic invasion and (d) type of surgery.
3.3. Time to Progression analysis
The progression rate after surgery for patients in D1 and D2 was 23% and the mean duration of recurrence after surgery was 20.81 ± 16.22 months and the median was 17 months. Kaplan-Meier for TTP were not significantly different for gender (P = 0.56), vascular invasion (P = 0.18), tumor histology (adenocarcinoma, squamous cell carcinoma (SCC), large cell carcinoma, P = 0.52), race (P = 0.77), lymphatic invasion (P = 0.32), surgery type (lobectomy, pneumonectomy or segmentectomy, p-value = 0.54) or PD-L1 expression level (high PD-L1 score and low PD-L1 score categories based on 10% cut off criteria, P = 0.073). However, a significant difference in TTP was observed in cancer stage (patients with stage II had a significantly higher rate of progression than those with stage I; P = 0.0017). The corresponding Kaplan Meier curves for vascular invasion, cancer stage, lymphatic invasion and surgery type are shown in Figure 4 (a – d).
Multivariable Cox regression analysis with LASSO regularization to predict TTP was developed using textural features. All those radiomic features with a nonzero coefficient in the LASSO Cox regression model were used in generating the RRS from A) most stable- discriminating and B) discriminating only features. On the training set D1, the RRS generated by selected features from set A predicted TTP with HR = 1.87 (95% CI: 1.42 – 2.2, P = 1.4e-05) and C-index of 0.78, while the RRS generated using the feature discriminability criteria alone (Set B) had a significantly lower HR of 1.1 (95% CI: 1.05 – 2.82, P = 0.026) and C-index of 0.69 in prediction of TTP. On validation set D2, the RRS generated by selected features from set A predicted TTP with HR = 1.66 (95% CI: 1.3 – 2.1, P = 4.7e-05) and C-index of 0.72, while the RRS generated using the feature discriminability criteria alone (Set B) had a significantly lower HR of 1.04 (95% CI: 1.02 – 2.95, P = 0.031) and C-index of 0.62 in prediction of TTP.
Similarly, on D3, the RRS generated by selected features from set A predicted TTP with HR = 1.74 (95% CI: 1.32 – 2.24, P = 0.0024) and C-index of 0.7, while the RRS generated using Set B was not prognostic (HR = 0.96, 95% CI: 0.74 – 1.62, P = 0.098) and C-index of 0.52. Finally, on validation set D4, the RRS generated by selected features from set A predicted TTP with HR = 1.83 (95% CI: 1.41 – 2.38, P = 2.3e-05) and C-index of 0.68, while the RRS generated using Set B was not prognostic (HR =1.32, 95% CI: 0.83 – 2.8, p-value = 0.34) and C-index of 0.57. The corresponding Kaplan Meier curves for D2, D3 and D4 are shown in Figure 5 (a, b and c).
Figure 5.

Kaplan-Meier time to progression for: (a) radiomic risk score for patients in validation set D2, (b) radiomic risk score for patients in D3 and (c) radiomic risk score for patients in D4. A significant association of the radiomics signature with TTP was observed in the validation dataset D2, D3 and D4.
A multivariate Cox regression analysis identified the RRS and TNM cancer staging as two risk factors in TTP for patients in the training set (RRS: HR, 1.52, 95% CI: 1.18, 1.94, P = 0.0013; clinical stage: HR, 2.1, 95% CI: 1.3, 3.36, P = 0.0035; sex: HR, 0.88, 95% CI: 0.56, 1.41, P = 0.61; race: HR, 1.04, 95% CI: 0.5, 2.18, P = 0.9; and PD-L1: HR, 1.34, 95% CI: 0.82, 2.18, P = 0.23; C-index = 0.78). The corresponding results for D2, D3 and D4 are shown in Table 1.
Table 1.
Hazard ratios and p-values for time to progression in the training and validation datasets.
| variable | HR (95% CI), p-value | |||
|---|---|---|---|---|
| D1 | D2 | D3 | D4 | |
| RRS | 1.87 (1.42 – 2.2), 1.4e-05 | 1.66 (1.3 – 2.1), 4.7e-05 | 1.74 (1.32 – 2.24), 0.0024 | 1.83 (1.41 – 2.38), 2.3e-05 |
| RRS + TNM staging | RRS: 1.52 (1.18 – 1.94), 0.0013 stage: 2.1 (1.3 – 3.36), 0.0035 | RRS: 1.49 (1.11 – 1.95), 0.0043 stage: 1.91 (1.1 – 3.87), 0.0077 | RRS: 1.44 (1.24 – 2.1), 0.0077 stage: 1.84 (1.4 – 3.9), 0.0085 | RRS: 1.33 (1.1 – 2.14), 0.U26 stage: 1.64 (1.5 – 4.2), 0.0092 |
3.4. Recurrence Free Survival analysis
The recurrence rate after surgery for patients in D1 and D2 was 39% and the mean duration of recurrence after surgery was 21.7 ± 16.42 months and the median was 17.5 months.
On the validation set D2, the RRS generated by selected features from set A predicted RFS with HR = 1.53 (95% CI: 1.27 – 1.86, p-value = 1.13e-05) and C-index of 0.70, while the RFS generated using the feature discriminability criteria alone (Set B) had a significantly lower HR of 1.02 (95% CI: 1.01 – 2.86, p-value = 0.026) and C-index of 0.61. Similarly, on D3, the RRS generated by selected features from set A predicted RFS with HR = 1.78 (95% CI: 1.24 – 2.55, p-value = 0.0015) and C-index of 0.68, while the RFS generated using Set B was not prognostic (HR = 0.98, 95% CI: 0.7 – 1.5, p-value = 0.095) and C-index of 0.52. On D4, the RRS generated by selected features from set A predicted RFS with HR = 1.79 (95% CI: 1.39 – 2.3, p-value = 6.1e-06) and C-index of 0.67, while the RFS generated using Set B was not prognostic (HR =1.38, 95% CI: 0.8 – 3.5, p-value = 0.27) and C-index of 0.56.
4. Discussion
In early stage NSCLC, following potentially curative resection, a large proportion of patients are at substantial risk for recurrence and death, [18, 19, 20]. While it is the single best treatment, the question is whether we can accurately identify higher risk patients in a manner that performs better than TNM staging, so that these patients receive intensive adjuvant therapies to reduce recurrence.
Radiomic analysis, the high-throughput extraction of quantitative subtle imaging features which are often invisible to the human eye has been shown to enhance the ability of diagnosis of lung cancer and early response prediction in cancer treatment [21, 22, 23]. However, many radiomic approaches emphasize texture and shape features of the lesion, while ignoring features within the tumor microenvironment (e.g. the peritumoral). There has also been great recent interest in the use of deep learning approaches to predict therapeutic outcome, however such approaches are largely “black-box” and provide little insight into the features driving the prognostic prediction. A growing body of research suggests that the tumor microenvironment has a key role to play in lung cancer development and progression. Physical and genetic changes surrounding the tumor help its ability to grow and spread and resist therapeutic intervention. There is thus a need for new radiomic approaches that offer comprehensive characterization of cancer biology by interrogating both the tumor and microenvironment. The field of radiogenomics [24], which seeks to identify connections between imaging features and the molecular profile of disease, provides greater biologic intuition to radiomic features, but often emphasizes biological correlations without application to clinical outcomes. Radiomic features extracted from lung CT have been shown to be representative of many facets of lung cancer biology, such as clinical receptor status, molecular subtype identified by gene expression, and gene mutations and have hence shown immense value in predicting outcomes. However, one major issue impeding the wide adoption of radiomic analysis is the lack of generalizability of the radiomic classifiers which have been shown in a number of recent studies [25, 26, 27, 28].
In this study, we presented a novel prognostic radiomic risk model for predicting outcome and likelihood of recurrence following curative resection in early stage NSCLC, by integrating stability measurements in tandem with feature discriminability in selecting radiomic features to develop a more generalizable classifier that is more robust to variations in lung CT scans across sites (scanners) and acquisition parameters. We evaluated this approach for its stability across multiple different sites and CT scanner vendors. We evaluated intra- and peritumoral radiomic texture and shape features and built comparative radiomic classifiers that did and did not explicitly include stability considerations. Towards this, we studied the effect of site variability in a prognostic problem of predicting cancer recurrence, RFS and TTP in early stage NSCLC patients following surgery.
We found that radiomic models constructed with the most stable- discriminating features outperformed models built with features accounting for discriminability alone, to predict cancer recurrence. We also found that the most stable-discriminating features are associated with recurrence free survival and time to progression while features accounting for discriminability alone were not associated or had a significantly lower HR.
Our model, when it used the selected stable features had corresponding AUCs of 0.75, 0.74 and 0.76 in D2 (n=175), D3 (n=65) and D4 (n=195) in differentiating between patients who recurred versus those who did not using only pre-surgical CT scans. This was almost a 10% improvement in prediction performance across the board when our stability criterion was not employed. The ability to recognize and identify which patients would be most likely to recur before initiation of treatment has immense clinical significance, as that would allow treatment strategies to be tailor-made according to their risk of recurrence. Simultaneously, we also evaluated the ability of the model to risk stratify patients based on their time to recurrence, with patients defined as high-risk who recurred early versus those who did not recur/recurred late. Interestingly, we found that our model when it used features with the stability criterion applied, could stratify patients based on their RFS with an HR = 1.53, 1.78 and 1.79 (p-value < 0.05) on D2, D3 and D4 but the model was ambiguous in its performance when explicit stability criterion was not applied, being prognostic on one dataset (HR = 1.02 in D2) while not prognostic on D3 and D4.
A deeper evaluation of the feature space showed that Laws-Laplacian and low frequency Gabor texture features that might capture patterns of heterogeneous enhancement and disruption of textural patterns within the nodules tend to be more stable while Haralick and Laws texture features tend to be more unstable across sites. This could potentially be on account of the implicit data filtering that occurs in generating the Gabor and Laplacian filter representations.
Additionally, we observed that peritumoral texture features were more stable than intranodular texture features. A potential explanation for this resiliency could be that while intranodular features essentially capture heterogeneity in the lesion which are influenced by variability in pre-analytic scanning, the peritumoral features usually represent the tumor microenvironment (TME) comprising tumor infiltrating lymphocytes (TILs), immune infiltrates and blood vessels which have a smooth texture on CT scans and have shown to be less affected by variations in acquisition parameters [29, 30, 31, 32, 33]. In the peritumoral region, we observed that Laws and Laws-Laplacian features were relatively stable (mean PI = 0.15). Peritumoral Laws features have been shown to be differentially expressed in responders and non-responders to chemotherapy in cancers of the breast and lung and have also shown to be associated with the relative density of tumor infiltrating lymphocytes in the tumor microenvironment [29, 30, 34]. Tumor infiltrating lymphocyte density has been shown to be correlated with OS and disease free survival (DFS) in resectable NSCLC patients [35].
In a previous study by Aerts et al [36], the authors built a prognostic radiomic signature of stable features based on their stability across test-retest image scans to predict overall survival in patients with lung, head and neck cancer. Their analysis showed that features selected on the basis of their stability and reproducibility were also the most informative features, which reinforces the importance of integrating independent data sets for radiomic feature selection and model building. However, there are a few drawbacks of test/re-test style studies. The first is that scans are generally repeated on the same scanner after a short period of time. So, the study does not evaluate inter-scanner dependence or the impact of acquisition parameters. Also, patient anatomy changes over time even from one scan to the next. In addition, repeating scans subject patients to additional discomfort and radiation dose.
Our work was different from previous related studies [37, 38, 39] in several ways. Firstly, we used a novel approach to build a generalizable radiomic classifier based on inter-site stability. Secondly, our study included both intra and peritumoral texture features as compared to previous work focusing on radiomic analysis from within the tumor. Thirdly, our results were validated on a multi-institutional dataset from multiple different scanners and four independent validation sites, thus allowing us to demonstrate the generalizability of our method.
We acknowledge that our study did have its limitations. Firstly, we did not explicitly analyze the effect of reconstruction kernels, radiation dose, tube voltage or tube current in our study, though it was shown that they have an effect on radiomic features [9, 40]. Secondly, lesion annotations were done by a single reader, as opposed to aggregating the segmentation contours from multiple readers. Additionally, with retrospective analyses, the time to progression data is inevitably influenced by timing of the follow up CT, which may be more intensive in some groups, thus creating the impression of shorter time to progression.
However, in spite of these limitations, our findings appear to suggest that explicitly accounting for feature stability in the construction of radiomic classifiers may results in more generalizable prognostic classifiers compared to strategies that are focused on maximizing discriminability alone.
5. Conclusion
In conclusion, our study revealed that accounting for both stability and discriminability yielded a more generalizable classifier for predicting cancer recurrence, time to progression and recurrence free survival in resectable early stage NSCLC.
Supplementary Material
Highlights.
Surgery is a potentially curative treatment modality for early-stage NSCLC.
Despite the curative intent of therapy, about 40–55% of NSCLC develop recurrence.
There is no consensus regarding the use of histologic markers about adjuvant therapy.
There is no non-invasive biomarker to identify cancer recurrence post-surgery.
Stable and discriminate radiomic features can predict cancer recurrence post-surgery.
Financial Support
Research reported in this publication was supported by the National Cancer Institute of the National Institutes of Health under award numbers 1U24CA199374-01, R01CA202752-01A1, National Institutes of Health, R01CA216579-01A1 and R01CA220581-01A1. National Center for Research Resources under award number 1C06-RR12463-01. VA Merit Review Award IBX004121A from the United States Department of Veterans Affairs Biomedical Laboratory Research and Development Service, the DOD Prostate Cancer Idea Development Award (W81XWH-15-1-0558), the DOD Lung Cancer Investigator-Initiated Translational Research Award (W81XWH-18-1-0440), the DOD Peer Reviewed Cancer Research Program (W81XWH-16-1-0329), the Ohio Third Frontier Technology Validation Fund the Wallace H. Coulter Foundation Program in the Department of Biomedical Engineering and the Clinical and Translational Science Award Program (CTSA) at Case Western Reserve University. The content is solely the responsibility of the authors and does not necessarily represent the official views of the National Institutes of Health, the U.S. Department of Veterans Affairs, the Department of Defense, or the United States Government.
Footnotes
Publisher's Disclaimer: This is a PDF file of an unedited manuscript that has been accepted for publication. As a service to our customers we are providing this early version of the manuscript. The manuscript will undergo copyediting, typesetting, and review of the resulting proof before it is published in its final form. Please note that during the production process errors may be discovered which could affect the content, and all legal disclaimers that apply to the journal pertain.
Conflicts of interest
Vamsidhar Velcheti is a Consultant for Clovis Oncology, Genentech, Bristol-Myers Squibb, Merck, Celgene, Foundation Medicine, AstraZeneca/MedImmune and Genoptix. He has received research funding from Genentech, Trovagene, Eisai, OncoPlex Diagnostics, Alkermes, NantOmics, Genoptix, Altor BioScience, Merck, Bristol-Myers Squibb, Atreca, Heat Biologics and Leap Therapeutics. Anant Madabhushi is an equity holder in Elucid Bioimaging and in Inspirata Inc. He is also a scientific advisory consultant for Inspirata Inc and also sits on its scientific advisory board. He is also an equity holder in Inspirata Inc. Additionally his technology has been licensed to Elucid Bioimaging and Inspirata Inc. He is also involved in a NIH U24 grant with PathCore Inc. Part of his research work is sponsored by Philips.
References
- 1.Uramoto H, Tanaka F. Recurrence after surgery in patients with NSCLC. Transl Lung Cancer Res. 2014;3(4):242–249. doi: 10.3978/j.issn.2218-6751.2013.12.05. [DOI] [PMC free article] [PubMed] [Google Scholar]
- 2.Rami‐Porta R, Asamura H, Travis WD, Rusch VW. Lung cancer — major changes in the American Joint Committee on Cancer eighth edition cancer staging manual. A cancer journal for clinicians. 31 January 2017. 10.3322/caac.21390. [DOI] [PubMed] [Google Scholar]
- 3.al-Kattan K, Sepsas E, Fountain SW, et al. Disease recurrence after resection for stage I lung cancer. Eur J Cardiothorac Surg 1997;12:380–4. [DOI] [PubMed] [Google Scholar]
- 4.Carnio S, Novello S, Papotti M, et al. Prognostic and predictive biomarkers in early stage non small-cell lung cancer: tumor based approaches including gene signatures. Transl Lung Cancer Res 2013;2:372–81. [DOI] [PMC free article] [PubMed] [Google Scholar]
- 5.Liang W, Zhang L, Jiang G, Wang Q, Liu L, et al. Development and validation of a nomogram for predicting survival in patients with resected non-small-cell lung cancer. J Clin Oncol. 2015. March 10;33(8):861–9. doi: 10.1200/JCO.2014.56.6661. Epub 2015 Jan 26. [DOI] [PubMed] [Google Scholar]
- 6.Stoel BC, Bakker ME, Stolk J, Dirksen A, et al. Comparison of the sensitivities of 5 different computed tomography scanners for the assessment of the progression of pulmonary emphysema: a phantom study. Invest Radiol. 2004. January;39(1):1–7. [DOI] [PubMed] [Google Scholar]
- 7.Petrou M, Quint LE, Nan B, Baker LH. Pulmonary nodule volumetric measurement variability as a function of CT slice thickness and nodule morphology. AJR Am J Roentgenol. 2007. February;188(2):306–12. [DOI] [PubMed] [Google Scholar]
- 8.Lafata K, Cai J, Wang C, Hong J, Kelsey CR, Yin FF. Spatial-temporal variability of radiomic features and its effect on the classification of lung cancer histology. Phys Med Biol. 2018. November 8;63(22):225003. doi: 10.1088/1361-6560/aae56a. [DOI] [PubMed] [Google Scholar]
- 9.He L, et al. , Effects of contrast-enhancement, reconstruction slice thickness and convolution kernel on the diagnostic performance of radiomics signature in solitary pulmonary nodule. Sci Rep, 2016. 6: p. 34921. [DOI] [PMC free article] [PubMed] [Google Scholar]
- 10.Clark K, Vendt B, Smith K, Freymann J, Kirby J, Koppel P, Moore S, Phillips S, Maffitt D, Pringle M, Tarbox L, Prior F. The Cancer Imaging Archive (TCIA): Maintaining and Operating a Public Information Repository, Journal of Digital Imaging, Volume 26, Number 6, December, 2013, pp 1045–1057. [DOI] [PMC free article] [PubMed] [Google Scholar]
- 11.Napel Sandy, & Plevritis Sylvia K. (2014). NSCLC Radiogenomics: Initial Stanford Study of 26 Cases. The Cancer Imaging Archive. 10.7937/K9/TCIA.2014.X7ONY6B1. [DOI] [Google Scholar]
- 12.Mohiuddin K, et al. , Relationship between margin distance and local recurrence among patients undergoing wedge resection for small (</=2 cm) non-small cell lung cancer. J Thorac Cardiovasc Surg, 2014;147(4): p. 1169–75. [DOI] [PubMed] [Google Scholar]
- 13.Wolf AS, Swanson SJ, Yip R, Liu B, Tarras ES, et al. The Impact of Margins on Outcomes After Wedge Resection for Stage I Non-Small Cell Lung Cancer. Ann Thorac Surg. 2017. October;104(4):1171–1178. doi: 10.1016/j.athoracsur.2017.04.024. Epub 2017 Jun 29. [DOI] [PubMed] [Google Scholar]
- 14.Orooji M, Alilou M, et al. , Combination of computer extracted shape and texture features enables discrimination of granulomas from adenocarcinoma on chest computed tomography, J. Med. Imag 5(2) 024501. [DOI] [PMC free article] [PubMed] [Google Scholar]
- 15.Leo P, Lee G, Shih NNC, Elliott R, Feldman MD, Madabhushi A. Evaluating stability of histomorphometric features across scanner and staining variations: prostate cancer diagnosis from whole slide images. Journal of Medical Imaging. 2016;3(4):047502. doi: 10.1117/1.JMI.3.4.047502. [DOI] [PMC free article] [PubMed] [Google Scholar]
- 16.Ding C, Peng H. Minimum redundancy feature selection from microarray gene expression data. J Bioinform Comput Biol. 2005. April; 3(2):185–205. [DOI] [PubMed] [Google Scholar]
- 17.Armato SG, Meyer CR, Mcnitt-Gray MF et al. The Reference Image Database to Evaluate Response to therapy in lung cancer (RIDER) project: a resource for the development of change-analysis software. Clin Pharmacol Ther 2008;84(4):448–456. [DOI] [PMC free article] [PubMed] [Google Scholar]
- 18.Sangha R, Price J, Butts CA, et al. Adjuvant therapy in non-small cell lung cancer: current and future directions. Oncologist. 2010;15(8):862–72. doi: 10.1634/theoncologist.2009-0186. [DOI] [PMC free article] [PubMed] [Google Scholar]
- 19.Arriagada R, Bergman B, Dunant A, et al. Cisplatin-based adjuvant chemotherapy in patients with completely resected non-small-cell lung cancer. N Engl J Med. 2004. January 22;350(4):351–60. [DOI] [PubMed] [Google Scholar]
- 20.Winton T, Livingston R, Johnson D, Rigas J, et al. Vinorelbine plus cisplatin vs. observation in resected non-small-cell lung cancer. N Engl J Med. 2005. June 23;352(25):2589–97. [DOI] [PubMed] [Google Scholar]
- 21.Beig N, Khorrami M, Alilou M, Prasanna P, Braman N, Orooji M, et al. Perinodular and intranodular radiomic features on lung CT images distinguish adenocarcinomas from granulomas. Radiology 2019;290:783–92. [DOI] [PMC free article] [PubMed] [Google Scholar]
- 22.Madabhushi A, Khorrami M, Velcheti V, inventors; Eschweiler & Potashnik, LLC, assignee. Predicting disease recurrence following trimodality therapy in non-small cell lung cancer using computed tomography derived radiomic features and clinico-pathologic features. United States patent US 20190254611. 2019. August 22. [Google Scholar]
- 23.Khorrami M, Prasanna P, Gupta A, Patil P, et al. Changes in CT Radiomic Features Associated with Lymphocyte Distribution Predict Overall Survival and Response to Immunotherapy in Non-Small Cell Lung Cancer. Cancer Immunol Res. 2019. November 12. doi: 10.1158/2326-6066.CIR-19-0476. [DOI] [PMC free article] [PubMed] [Google Scholar]
- 24.Thawani R, McLane M, Beig N, Ghose S, et al. Radiomics and radiogenomics in lung cancer: A review for the clinician. Lung Cancer. 2018. January;115:34–41. doi: 10.1016/j.lungcan.2017. [DOI] [PubMed] [Google Scholar]
- 25.Zech JR, Badgeley MA, Liu M, Costa AB, Titano JJ, Oermann EK. Variable generalization performance of a deep learning model to detect pneumonia in chest radiographs: A cross-sectional study. PLoS Med. 2018;15(11):e1002683 Published 2018 Nov 6. doi: 10.1371/journal.pmed.1002683. [DOI] [PMC free article] [PubMed] [Google Scholar]
- 26.Pavic M, Bogowicz M, et al. , Influence of inter-observer delineation variability on radiomics stability in different tumor sites. Acta Oncol. 2018. August;57(8):1070–1074. [DOI] [PubMed] [Google Scholar]
- 27.Larue RTHM, van Timmeren JE, et al. , Influence of gray level discretization on radiomic feature stability for different CT scanners, tube currents and slice thicknesses: a comprehensive phantom study. Acta Oncol. 2017. November;56(11):1544–1553. [DOI] [PubMed] [Google Scholar]
- 28.Shafiq-Ul-Hassan M, Zhang GG, Hunt DC, et al. , Accounting for reconstruction kernel-induced variability in CT radiomic features using noise power spectra. J Med Imaging (Bellingham). 2018. January;5(1):011013. [DOI] [PMC free article] [PubMed] [Google Scholar]
- 29.Khorrami M, Khunger M, Zagouras A, Patil P, Thawani R, Bera K, et al. Combination of peri- and intratumoral radiomic features on baseline CT scans predicts response to chemotherapy in lung adenocarcinoma. Radiol Artif Intell 2019;1:e180012. [DOI] [PMC free article] [PubMed] [Google Scholar]
- 30.Khorrami M, Jain P, Bera K, Alilou M, Thawani R, Patil P, et al. Predicting pathologic response to neoadjuvant chemoradiation in resectable stage III non-small cell lung cancer patients using computed tomography radiomic features. Lung Cancer 2019;135:1–9. [DOI] [PMC free article] [PubMed] [Google Scholar]
- 31.Khorrami M, Alilou M, Prasanna P, Patil P, Velu P, Bera K, et al. A combination of intra- and peritumoral features on baseline CT scans is associated with overall survival in non-small cell lung cancer patients treated with immune checkpoint inhibitors: a multi-agent multi-site study In: Proceedings of SPIE Medical Imaging 2019; 2019. February 16–21; San Diego, CA. Bellingham (WA): Society of Photo-Optical Instrumentation Engineers; 2019. [Google Scholar]
- 32.Alilou M, Vaidya P, Khorrami M, Zagouras A, Patil P, Bera K, et al. Quantitative vessel tortuosity radiomics on baseline non-contrast lung CT predict response to immunotherapy and are prognostic of overall survival In: Proceedings of SPIE Medical Imaging 2019; 2019. February 16–21; San Diego, CA. Bellingham (WA): Society of Photo-Optical Instrumentation Engineers; 2019. [Google Scholar]
- 33.Dou TH, Coroller TP, van Griethuysen JJM, Mak RH, Aerts HJWL. Peritumoral radiomics features predict distant metastasis in locally advanced NSCLC. PLoS One. 2018;13(11):e0206108 Published 2018 Nov 2. doi: 10.1371/journal.pone.0206108. [DOI] [PMC free article] [PubMed] [Google Scholar]
- 34.Bera K, Velcheti V, Madabhushi A. Novel Quantitative Imaging for Predicting Response to Therapy: Techniques and Clinical Applications. Am Soc Clin Oncol Educ Book. 2018;38(38):1008–1018. doi: 10.1200/EDBK_199747. [DOI] [PMC free article] [PubMed] [Google Scholar]
- 35.Brambilla E, Le Teuff G, Marguet S, Lantuejoul S, et al. Prognostic Effect of Tumor Lymphocytic Infiltration in Resectable Non-Small-Cell Lung Cancer. J Clin Oncol. 2016. April 10;34(11):1223–30. doi: 10.1200/JCO.2015.63.0970. [DOI] [PMC free article] [PubMed] [Google Scholar]
- 36.Aerts HJ, Velazquez ER, Leijenaar RT, et al. Decoding tumour phenotype by noninvasive imaging using a quantitative radiomics approach. Nat Commun. 2014;5:4006 Published 2014 Jun 3. doi: 10.1038/ncomms5006. [DOI] [PMC free article] [PubMed] [Google Scholar]
- 37.Balagurunathan Y, Gu Y, Wang H, et al. Reproducibility and Prognosis of Quantitative Features Extracted from CT Images. Translational Oncology. 2014;7(1):72–87. [DOI] [PMC free article] [PubMed] [Google Scholar]
- 38.Kalousis A, Prados J, Hilario M, Stability of feature selection algorithms: A study on high-dimensional spaces. Knowledge and Information Systems, 2007;12(1):95–116. DOI: 10.1007/s10115-006-0040-8. [DOI] [Google Scholar]
- 39.Yu L, Ding C, Loscalzo S, Stable Feature Selection via Dense Feature Groups. In: Proceedings of the 14th ACM International Conference on Knowledge Discovery and Data Mining (KDD 2008), pp. 803–811. doi> 10.1145/1401890.1401986. [DOI] [Google Scholar]
- 40.Buch K, Li B, Qureshi MM, Kuno H, Anderson SW, Sakai O. Quantitative Assessment of Variation in CT Parameters on Texture Features: Pilot Study Using a Nonanatomic Phantom. American Journal of Neuroradiology. 2017. May;38(5):981–985. doi: 10.3174/ajnr.A5139. [DOI] [PMC free article] [PubMed] [Google Scholar]
Associated Data
This section collects any data citations, data availability statements, or supplementary materials included in this article.