

Abstract
Motivation
The accuracy and success rate of de novo protein design remain limited, mainly due to the parameter over-fitting of current energy functions and their inability to discriminate incorrect designs from correct designs.
Results
We developed an extended energy function, EvoEF2, for efficient de novo protein sequence design, based on a previously proposed physical energy function, EvoEF. Remarkably, EvoEF2 recovered 32.5%, 47.9% and 22.3% of all, core and surface residues for 148 test monomers, and was generally applicable to protein–protein interaction design, as it recapitulated 30.9%, 42.4%, 31.3% and 21.4% of all, core, interface and surface residues for 88 test dimers, significantly outperforming EvoEF on the native sequence recapitulation. We further used I-TASSER to evaluate the foldability of the 148 designed monomer sequences, where all of them were predicted to fold into structures with high fold- and atomic-level similarity to their corresponding native structures, as demonstrated by the fact that 87.8% of the predicted structures shared a root-mean-square-deviation less than 2 Å to their native counterparts. The study also demonstrated that the usefulness of physical energy functions is highly correlated with the parameter optimization processes, and EvoEF2, with parameters optimized using sequence recapitulation, is more suitable for computational protein sequence design than EvoEF, which was optimized on thermodynamic mutation data.
Availability and implementation
The source code of EvoEF2 and the benchmark datasets are freely available at https://zhanglab.ccmb.med.umich.edu/EvoEF.
Supplementary information
Supplementary data are available at Bioinformatics online.
1 Introduction
Computational protein design aims to create new protein molecules that adopt specific folds and perform desirable biological functions by using effective computational sampling, scoring and searching techniques. Since scoring functions play a central role in discriminating correct designs from incorrect designs in protein design algorithms, the development of effective and efficient energy functions is of critical importance for improving the accuracy of protein design algorithms. In previous studies, we developed an automatic protein design protocol, EvoDesign (Pearce et al., 2019), based on the combination of fold-level evolutionary profiles derived from multiple sequence alignments of structural analogs and an atomic-level physical energy function. Constraining the sequence selection space using evolutionary profiles showed improved performance over many other algorithms that only utilize physics- or knowledge-based energy functions (Huang et al., 2013; Kuhlman and Baker, 2000; Tian et al., 2015). Our previous studies showed that EvoDesign can yield very high success rates when designing new thermostable monomer proteins (Mitra et al., 2013; Shultis et al., 2015) and protein–protein interactions (PPIs) (Shultis et al., 2019).
Although EvoDesign has many advantages, it still has several limitations. First, it must obtain reliable, structurally-derived evolutionary profiles, which requires obtaining a sufficient number of structural analogs. In previous studies (Mitra et al., 2013; Shultis et al., 2019), a relatively large number (>10) of structural analogs were always identified for the target scaffolds of design interest. However, we have recently found that for many newly released targets, an insufficient number of structural analogs could be identified, which can reduce the effectiveness of evolution-based design. In these situations, the design procedure should be performed using the physical energy component only. In previous work, we developed the EvoEF energy function to assist protein design (Pearce et al., 2019). EvoEF was rigorously evaluated on thermodynamic mutation data and it outperformed FoldX (Guerois et al., 2002) on two large sets of experimental protein stability change (ΔΔGstability) and protein–protein binding free energy change (ΔΔGbind) data, with a 3∼5 times faster running speed. However, the performance of EvoEF alone on de novo sequence design had never been examined in the situation where the evolutionary profile information was unreliable.
In this study, we first tested EvoEF’s ability to perform de novo protein sequence design using a simulated annealing Monte Carlo procedure (Kirkpatrick et al., 1983). We found that EvoEF only yielded overall sequence recapitulation rates of 16.8% for the 148 test monomers and 15.6% for the 88 test PPIs, which was much worse than the results for some other protein design algorithms like Rosetta (Saunders and Baker, 2005), Medusa (Ding and Dokholyan, 2006) and even FoldX (Bazzoli et al., 2011), thereby demonstrating the inability of EvoEF to produce native-like sequences or perform protein sequence design. Since our ultimate goal is to use EvoEF for protein design in addition to ΔΔG estimation, we extended EvoEF to EvoEF2 by introducing four new energy terms, including terms for disulfide bonds, amino acid propensities, Ramachandran biases and rotamer probabilities, the weights of which were systematically re-optimized through protein sequence design simulations. The benchmark experiments showed that EvoEF2 was much more effective at generating native-like sequences for given protein scaffolds for both monomer and PPI design, yielding overall native sequence recapitulation rates of 32.5% for the 148 monomers and 30.9% for the 88 PPIs. The sequence recovery performance of EvoEF2 was comparable to those obtained by the state-of-the-art Rosetta (Saunders and Baker, 2005) and Medusa (Ding and Dokholyan, 2006) algorithms. Furthermore, the foldability of the designed sequences for the 148 monomer proteins in the test set was assessed using the leading protein structure modeling software, I-TASSER (Yang et al., 2015), where each pair of predicted and native structures for all 148 designs were found to possess the same fold with TM-scores > 0.5 and root-mean-square-deviations (RMSDs) < 4 Å; these results were much better than those obtained in a previous large-scale assessment on 52 single-domain proteins (Bazzoli et al., 2011). Moreover, 87.8% and 87.1% of the designs were predicted to fold within 2 Å or with TM-scores > 0.9 to the native structures, suggesting that the EvoEF2 designs were of high quality. Despite the fact that EvoEF2 was optimized for sequence design, it also performed reasonably well on ΔΔG estimation. Nevertheless, the results showed that, based on the thermodynamic data estimation, EvoEF, which was specifically optimized for this task, might be more appropriate than EvoEF2 for ΔΔG estimation.
2 Materials and methods
2.1 Dataset construction
Monomer Dataset. X-ray determined monomer structures were collected from the datasets used in previous side-chain packing studies (Krivov et al., 2009), and protein design simulations (Mitra et al., 2013). Structures with missing main-chain atoms (N, Cα, C and O) were discarded, and protein chains with more than 300 amino acids were excluded for fast protein design simulations. CD-HIT (Fu et al., 2012) was then used to cluster the remaining dataset with a sequence identity cutoff of 30%, and the representative protein was selected from each cluster to construct a set of 370 monomers. 60% of these structures (222 monomers) were randomly chosen as the training set, while the other 148 structures were used for testing. To compare the protein design results on X-ray and NMR structures, 29 monomers that had both X-ray and ≥10 NMR models were used (Schneider et al., 2009). Dimer Dataset. X-ray determined dimer structures were collected from our previous work for EvoEF’s benchmark tests (Pearce et al., 2019), from the dimers used by Sharabi et al. to optimize ORBIT for protein–protein interface design (Sharabi et al., 2011a, b) and from the dimers used by Cui et al. to compare the subunit interfaces of heterodimers and homodimers (Zhanhua et al., 2005). The dimers were filtered and clustered using similar criteria as the monomer datasets (Fu et al., 2012), where dimers whose shortest chains had more than 300 amino acids were excluded for the sake of rapid design simulations. Following this procedure, 120 heterodimers and 100 homodimers were selected; 60% of them (72 heterodimers and 60 homodimers) were randomly selected for training, while the other 48 heterodimers and 40 homodimers were used for testing. ΔΔGstability and ΔΔGbind Datasets. Two sets of non-redundant experimental thermodynamic data (3989 ΔΔGstability entries from 210 monomers and 2204 ΔΔGbind entries from 177 dimers), which were collected in a previous study (Pearce et al., 2019), were used to assess the ability of EvoEF and EvoEF2 to predict the thermodynamic changes upon mutation.
2.2 Energy function and protein design
EvoEF was first proposed and implemented in our evolutionary profile-based protein design protocol, EvoDesign (Pearce et al., 2019). In general, EvoEF consists of five energy terms:
| (1) |
Here, , , , and represent the total van der Waals, electrostatic, hydrogen bonding, desolvation and reference energy terms for a protein system, respectively. Here, the protein reference energy term, , is used to model the energy of the protein in the unfolded state and it is calculated as the sum of amino acid-specific reference energy values (Pearce et al., 2019). The five terms were preserved in EvoEF2 and four new terms were introduced to make it capable of tackling more difficult design cases. The complete EvoEF2 energy function is written as:
| (2) |
Here, describes the disulfide-bonding interactions, represents the energy for calculating amino acid propensities at given backbone (φ/ψ) angles, is the Ramachandran term for choosing specific backbone angles (φ/ψ) given a particular amino acid and is the energy term for modeling the rotamer probabilities from the rotamer library.
The details of the mathematic formulas for the EvoEF and EvoEF2 energy terms and the parameterization of EvoEF2 are described in Supplementary Materials S1–S3, respectively. We extended the EvoDesign Monte Carlo pipeline (Pearce et al., 2019) to test the ability of EvoEF and EvoEF2 to perform protein design and the detailed procedure is described in Supplementary Material S4. In general, the design procedure was very fast; for instance, it took less than 15 min to completely design a protein that was about 200 amino acids long.
2.3 Definition of core, surface and interface residues
The core and surface residues were defined using criteria similar to (Kortemme et al., 2003; Kuhlman and Baker, 2000). Specifically, we defined core residues as those positions that had more than 20 Cβ atoms within 10 Å of the Cβ atom of the residue of interest, while the surface residues were required to have less than 15 Cβ atoms within the same region. Cα atoms were counted for glycine. In protein–protein interfaces, a residue was denoted as an interface residue if at least one of its atoms was within 5 Å of the other chain.
3 Results
3.1 Recapitulation of native monomer sequences
The ability to recapitulate native sequences for given protein scaffolds has been regarded as an important in silico benchmark test of protein design algorithms (Ding and Dokholyan, 2006; Kuhlman and Baker, 2000; Leaver-Fay et al., 2013). For this purpose, the native sequence recapitulation rate is defined as the ratio of the number of designed residues that are identical to the naturally occurring amino acids at the corresponding design positions to the number of total design positions. Usually the higher the rate is, the more likely an algorithm can produce native-like protein sequences.
We first examined the ability of EvoEF to recapitulate native sequences on a set of 148 monomer scaffolds, where the backbones were fixed and the results are summarized in Table 1. Overall, the native amino acid types were selected for 16.8% of the total design positions, while a much higher percentage, 28.4% of native residues were recapitulated in protein cores. As a control, we found that the native sequence recapitulation rates using random selection were around 5% for the overall protein and the core residues, suggesting that EvoEF was significantly better than random for sequence design. However, for surface residues, the sequence recapitulation rate was only 7.4%, which was quite close to random, indicating that EvoEF could not recover the surface residues effectively. Compared with several previous complete sequence design studies, the ability of EvoEF to recapitulate native sequences was not, in general, as good as some other protein design algorithms such as Rosetta (Kuhlman and Baker, 2000), Medusa (Ding and Dokholyan, 2006) and FoldX (Bazzoli et al., 2011), which achieved overall native sequence recapitulation rates ranging from 24% to 33% on different datasets.
Table 1.
Summary of native sequence recapitulation results from designing 148 monomers using EvoEF and EvoEF2
| Residues | #nat | EvoEF |
EvoEF2 |
||
|---|---|---|---|---|---|
| #id | #id/#nat | #id | #id/#nat | ||
| All | 23 734 | 3985 | 0.168 | 7718 | 0.325 |
| Core | 6497 | 1848 | 0.284 | 3114 | 0.479 |
| Surface | 9424 | 696 | 0.074 | 2102 | 0.222 |
Note: #nat, number of native residues; #id, number of residues with recapitulated identities.
To improve the ability of EvoEF to produce native-like sequences, we extended EvoEF into EvoEF2 by introducing four new energy terms and re-optimizing the weights and reference energies through protein sequence design simulations. The comparison of the results for recapitulation of native residues using EvoEF and EvoEF2 is shown in Table 1. Overall, the native sequence recapitulation rates for EvoEF2 were much higher than those for EvoEF. 32.5% of all designed residues were recapitulated by EvoEF2, while a much higher number, 47.9%, of the native core residues were correctly selected; both ratios were close to those reported in the work for Rosetta’s benchmark on 42 monomers (Saunders and Baker, 2005) using Dunbrack’s backbone-dependent rotamer library without adding subrotamers (33.0% and 47.7% for overall and core residues, respectively). Figure 1 illustrates an example of a well-recovered protein core (PDB ID: 1ZEQ), where 13 out of the 14 core residues were successfully recapitulated, not only in identity but also with close conformations to the crystal residue side-chains. The only incorrectly predicted residue was isoleucine at position 11, which is chemically similar to the native valine anyways but with an extra methylene group. These results indicate that EvoEF2 not only recapitulates the residues at a sequence-level, but also recovers the atomic-level physical interactions, which is key for successful protein design. Moreover, utilizing the extended EvoEF2 energy function, 22.2% of the surface residues were recovered, which is about a 3-fold higher rate than that obtained by the original EvoEF program. The recapitulation statistics for all 20 amino acids in all, core and surface positions for the 148 test proteins are listed in Supplementary Table S1. Overall, the hydrophobic, aliphatic residues, with the exception of methionine and cysteine, were recapitulated at higher rates. Glycine and proline were the two best recovered residues, probably due to their unique side-chain structures and the fact that they are frequently found in special conformations (e.g. turns and kinks) in protein structures. Methionine and cysteine were not favored partly because the well depth of the van der Waals attractive energy is weak for sulfur atoms in the CHARMM19 (Brooks et al., 1983) atom parameters. Many cysteine residues were involved in disulfide bonds in the test proteins, and although an energy term was introduced to explicitly account for disulfide bonding, it could not always recover the native-like disulfide-bond geometries, in part due to the absence of crystal-like cysteine rotamer conformations. Compared with phenylalanine, the lower recapitulation rates for tyrosine and tryptophan were likely due to the penalties incurred by buried hydroxyl and amide groups in the protein core. Comparison of the results for EvoEF and EvoEF2 shows that not only were the total recapitulation rates improved in the new energy function, but the specific ratios for each amino acid type in the designed cores were also closer to those found in the native cores, except those for aspartic acid and serine (Supplementary Table S1), probably because aspartic acid was overdesigned by EvoEF while serine was underdesigned by EvoEF2 in protein core regions. For example, the total number of aspartic acid and serine residues present in the cores of all 148 native monomers was 119 and 278, respectively. But the number of aspartic acid and serine residues present in the designed cores was 885 and 292, respectively, for EvoEF, and 150 and 112, respectively, for EvoEF2. Another important finding is that, whether EvoEF or EvoEF2 was used, the native sequence recovery rate for core residues was much higher than the rate for surface residues, which is consistent with the findings of previous computational studies (Gainza et al., 2012; Kuhlman and Baker, 2000) and may suggest that the protein core is more evolutionarily conserved and its sequence space is more highly constrained than the surface. As a comparison, the native sequence recapitulation results for the design of the 222 training proteins are presented in Supplementary Table S2. The overall recapitulation rates and the amino acid-specific ratios for both the training and test sets were almost identical, suggesting that over-fitting may not be a problem for the EvoEF and EvoEF2 energy weights.
Fig. 1.
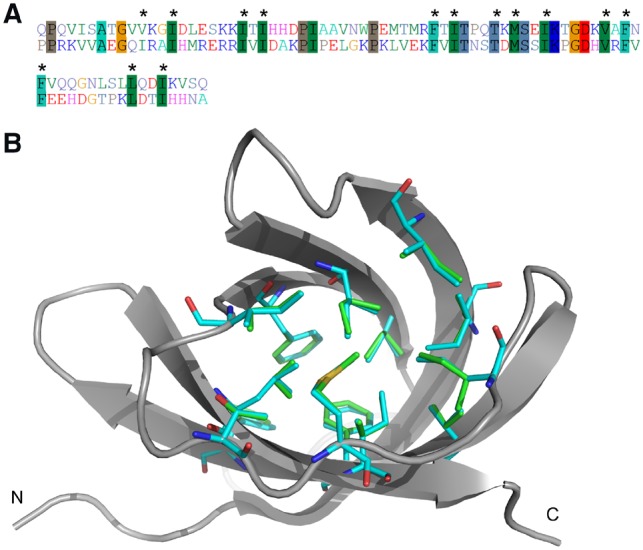
An illustrative example of an Escherichia coli periplasmic protein involved in copper and silver binding (PDB ID: 1ZEQ) redesigned based on the EvoEF2 energy function. (A) Comparison between the native and designed sequences, where the sequence identity was 31.2%. The identical residues are highlighted using darker colors and the core residues are labeled with ‘*’. (B) Comparison of the native and designed core residues. The protein scaffold is shown in cartoon, and the native and design core residues are shown in sticks with different colors
In some studies, only proteins with high-resolution X-ray structures (<2.0 Å) and small sizes were selected to parameterize and test their protein design algorithms. Here, structures with resolutions >2.0 Å and medium sizes (e.g. up to 300 amino acids) were also included in the EvoEF2 benchmark set. We believe that the use of larger and more diverse datasets can make our algorithm more robust and applicable to low-resolution structures or even models. In Supplementary Figure S1, we show the sequence identity between the 370 native and designed monomer proteins as a function of protein structure resolution and length; both the training and test proteins were used for statistical analysis because no over-fitting was observed. It appeared that a weak negative correlation between resolution and sequence identity existed, with a Pearson correlation coefficient (PCC) of –0.24. However, this might be due to the small number of low-resolution structures in the dataset, as in fact there were only 34 structures whose resolutions were >2.0 Å. If we excluded the 34 structures, the PCC for the group with resolution ≤2.0 Å was only –0.081, suggesting that the sequence identity of the designs is likely to be independent of the structure resolution. Additionally, the PCC between sequence identity and protein length for the 370 structures was 0.084, indicating that there does not exist a strong correlation between sequence identity and protein length. Therefore, we conclude that the EvoEF2 energy function may be applicable to a diverse number of structures.
3.2 Importance of the new energy terms
The optimized weights and reference energies are presented in Supplementary Tables S3 and S4. The optimized weights for the new energy terms, , , and were 2.72, 0.59, 0.42 and 0.35 (Supplementary Table S3), respectively, suggesting that the new terms play a role in the sequence design process. To examine to what extent these terms are useful for sequence design, we tested the native sequence recapitulation performance of EvoEF2 by disabling each of these terms, while holding the others constant. Removal of any new term lead to a decrease in the overall native sequence recapitulation rate compared to the complete EvoEF2 energy function, but their contributions were not identical (Supplementary Figure S2). In general, disabling the disulfide bonding, amino acid propensity and Ramachandran terms individually only caused a moderate decrease in performance, but disabling the Dunbrack rotamer probability term alone led to a substantial decrease in the sequence recovery rate. More specifically, inclusion of the disulfide bonding term in EvoEF2 was found to be able to recover only about 2-fold the number of cysteines recapitulated by the energy function with this term excluded. This improvement was not as large as we expected, which is probably due to the strict geometries employed for modeling disulfide bonding interactions and the absence of native-like cysteine rotamers in the non-expanded rotamer library (Shapovalov and Dunbrack, 2011). Furthermore, a plausible reason for the fact that the amino acid propensity and Ramachandran terms had a small effect on the designs was that their roles were likely to be largely and implicitly considered by some other terms, such as the van der Waals packing interactions in a local environment. The Dunbrack rotamer probability term was crucial for treating rotamers with different side-chain conformations differently, and exclusion of this term caused a significant decrease in performance and posed a severe challenge to the other physics-based energy terms. As expected, disabling the four terms simultaneously dramatically weakened the native sequence recapitulation performance and therefore we concluded that the extended terms are important for protein design.
3.3 Foldability assessment of the designed sequences
Although native sequence recapitulation is an important metric for evaluating the performance of protein design algorithms (Alford et al., 2017; Kuhlman and Baker, 2000; Leaver-Fay et al., 2013), high native sequence similarity does not always guarantee the designs are of high quality and foldable. To further examine the design quality, we used the state-of-the-art protein structure prediction suite, I-TASSER (Yang et al., 2015), to test the foldability of the designed sequences and to examine how close the predicted models were to the native scaffold structures. The designed sequences with the lowest EvoEF2 free energies for each of the aforementioned 148 test monomers were modeled by I-TASSER in order to assess their foldability. A test protein was defined as foldable if the designed sequence was predicted to fold into a structure with a TM-score to the native scaffold structure greater than a specified TM-score threshold, where a TM-score > 0.5 indicates that two structures share a similar fold topology (Xu and Zhang, 2010). Alternatively, RMSD was also used to calculate the similarity between two structures (Bazzoli et al., 2011) and, generally, two structures share a similar fold when the RMSD is less than 4 Å. Supplementary Table S5 presents the TM-scores and RMSDs between the I-TASSER models for the designed sequences and their corresponding native scaffold structures for the 148 proteins. We found that all 148 designed proteins were predicted to fold into structures with TM-scores > 0.5 and RMSDs <4 Å to their native counterparts. All of the designs shared a sequence identity between 20% and 50% to their native sequences; 33.7% (50/148) were located in the so-called ‘twilight zone’ (Rost, 1999) with sequence identities ranging from 20% ∼ 30%, while the other 66.3% (98/148) would be more likely to be recognized as sequence homologs to their corresponding naturally occurring sequences.
In Figure 2, the TM-scores and RMSDs are illustrated as a function of sequence identity for the 148 test monomers, where 87.1% (129/148) of the designs had TM-scores > 0.9 to their native structures. Alternatively, 87.8% (130/148) of the designs were predicted to have RMSDs <2 Å to their native structures, which is a reasonable upper bound for regarding a protein design case as successful (Dahiyat and Mayo, 1997; Kuhlman et al., 2003). The results presented here are much better than a previous protein design study performed using FoldX, where 77% of the 52 tested single-domain monomers were recovered at an RMSD threshold of 2 Å (Bazzoli et al., 2011).
Fig. 2.

TM-scores (A) and RMSDs (B) of the predicted I-TASSER models to the native crystal structures as a function of sequence identity between the native sequences and those designed using EvoEF2
Three examples are illustrated in Figure 3 that compare the I-TASSER predicted models to the native scaffolds. The designed sequence based on an outer membrane protein (PDB ID: 2FI9) shared the highest overall sequence identity (47.4%) to the native, and, as expected, the predicted structure showed great similarity to the native structure with a TM-score = 0.989 and RMSD = 0.450 Å. In the second example (PDB ID: 1T0F), the predicted model was the closest to its native scaffold with RMSD = 0.16 Å, but the designed sequence only shared 26.3% identity over all residues to the naturally occurring sequence. As shown in the figure, not only were the well-ordered secondary structures perfectly aligned, but the coils and loops were accurately superimposed as well. The third example (PDB ID: 2IBL) had the worst TM-score (0.684) among all the proteins, and, as shown, it did not possess as much of a well-organized globular structure as the other two examples. This case was hard for EvoEF2, as there was no conserved buried core, and might have also been hard for I-TASSER, because it might not have been able to find good templates for structure modeling. But contrary to our expectation, the modeled structure was in general quite similar to the native, as the long helix was well aligned and the coils were only shifted slightly.
Fig. 3.
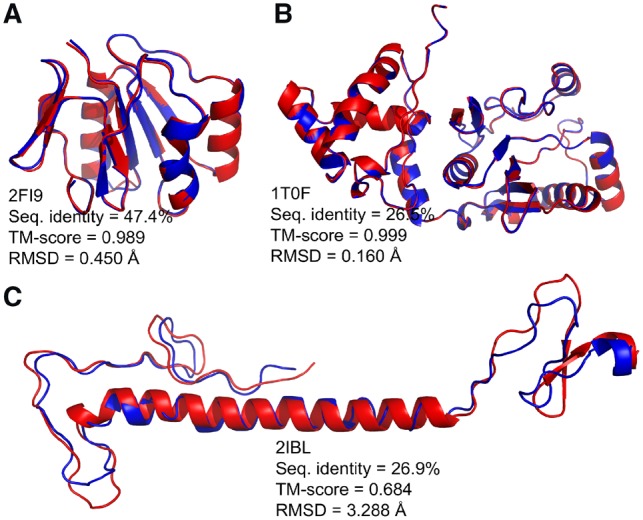
Comparison of the native structures and the I-TASSER models of the designed sequences for three example proteins designed using EvoEF2
3.4 Sequence design of NMR scaffolds
Since EvoEF2 performed very well on X-ray structures, it was also of great interest to examine its sequence design ability on NMR structures, as there are many proteins that only have experimentally-solved NMR structures. To compare the sequence design performance of EvoEF2 on NMR and X-ray scaffolds, 29 monomer proteins collected by Schneider et al. (Schneider et al., 2009) were selected for design, where all 29 proteins had both NMR and X-ray structures available. Here, it is worth mentioning that these structures had sequence identities <30% to the proteins from the aforementioned training and test sets. The information for the 29 proteins is presented in Supplementary Table S6, where each of them had more than 10 NMR models. The free energy of the designs as a function of the sequence identity between the designed and native sequences for all 29 structure pairs is illustrated in Supplementary Figure S3. For NMR structures, the sequence identities were widely distributed, from 5.5% (PDB ID: 1BC4), which was close to random, to as high as 35.3% (PDB ID: 1UF0). On average, the native sequence recovery rates were consistently higher for the X-ray structures (Supplementary Figure S4a), and the native amino acids were recapitulated less frequently when NMR structures were used as the scaffolds. Similar observations were reported for Rosetta by (Kuhlman and Baker, 2000) and (Schneider et al., 2009). Therefore, it seems that X-ray structures are preferred by Rosetta (Kuhlman and Baker, 2000; Schneider et al., 2009) and EvoEF2. Nevertheless, for 6 out of the 29 cases, comparable or even higher recovery rates were achieved for the best NMR models than the corresponding X-ray scaffolds (Supplementary Figure S4b), suggesting that NMR structures are not always bad templates for protein design (Schneider et al., 2009). Consequently, in cases where an X-ray structure is not available, an NMR structure should be tested as a scaffold candidate.
3.5 Recapitulation of native PPI sequences
PPIs play important roles in the biological processes of cells, and non-synonymous single nucleotide polymorphisms, especially those occurring at protein interfaces, may cause various human diseases (Brender and Zhang, 2015; Xiong et al., 2017). Designing novel proteins/peptides targeting PPIs involved in diseases is of great value (Shultis et al., 2019), but progress in this field has not been extensively demonstrated due to difficulty in accurately modeling novel functions and interactions. In previous studies, most protein design algorithms were optimized and tested using monomers, and the transferability of an energy function optimized on monomers to PPI modeling is under debate. For instance, (Sharabi et al., 2011a, b) showed that the original ORBIT algorithm that was optimized for monomer design was not sufficiently good at recovering residues at protein–protein interfaces and the reweighted algorithm optimized using dimer interfaces yielded better results for PPI design. However, (Kortemme et al., 2003) suggested that the Rosetta energy function optimized on monomers was generally applicable to the prediction of specificity for PPIs, as demonstrated by their tests where, for the majority of the positions, the most frequently predicted amino acids were the naturally occurring residues. A limitation of these benchmark studies is that the PPI design was only restricted to the interface residues of one partner, while all other residues were fixed to their native types. Moreover, protein sites with glycine, proline and cysteine residues were excluded from design and selection (Kortemme et al., 2003; Sharabi et al., 2011a, b). Although fixing and excluding residues on the target protein is reasonable and acceptable for PPI engineering/design, it could artificially increase the rate of recapitulating interface residues.
In this work, as a more rigorous test of EvoEF and EvoEF2, we performed complete sequence design of one partner while repacking the interface residues of the other. This is similar to a real PPI design case where one wants to design a novel protein targeting a specific binding partner (Shultis et al., 2019). The rationale for benchmarking EvoEF2 using PPIs was multi-fold. First, the design of PPIs can be regarded as an independent examination of the energy functions in addition to the monomer design tests. Second, we wanted to determine whether EvoEF and EvoEF2 could perform as well at complete PPI sequence design as they did at monomer sequence design. Third, we wanted to know to what extent the energy functions could recognize native-like amino acid sequences in protein interfaces, as the characteristics of protein interfaces is different from those of core and surface regions. Fourth, we wanted to examine whether the design of the core residues would impact the interface design and vice versa.
First of all, the EvoEF2 energy function with energy weights optimized on monomers (denoted as ‘EvoEF2-mon’) was applied unchanged to 88 test protein dimers, where only the first partner of each dimer was designed and, during the design process, the interface residues of the second partner were repacked at the same time. The native sequence recapitulation results are presented in Supplementary Table S7. The performance of EvoEF2 for de novo PPI sequence design was consistently slightly worse for all, core and surface residues than that obtained for monomer design. The rates were 30.5% versus 32.5% (all), 42.0% versus 47.9% (core) and 21.0% versus 22.3% (surface) for the PPI versus monomer design results, respectively (Supplementary Tables S1 and S7). In addition, about 31.2% of the interface residues were recovered, which was better than the surface but worse than the core. A plausible explanation for this is that interface regions have more steric constraints than surface regions but less than core residues, which is consistent with the fact that protein interfaces possess intermediate physicochemical characteristics that are between those of the inner hydrophobic core and the exterior hydrophilic surface. The largest decrease in the recapitulation rate occurred for the core residues, where the decline was about 6%. This decrease could be partly due to the inherent differences between the two test datasets, and could also be due in part to how the statistics for the core and interface residues were obtained. For PPI design, the definition of interface and core may result in overlap between some residues because they were defined following different criteria; therefore, to eliminate overcounting, a residue classified as interfacial was excluded from the core in this study. Another possible reason is that the design inaccuracies for the interface and core regions affected each other. To examine to what extent the core design performance was affected by the interface design performance, as a control, we removed the fixed binding partners and only designed the 88 target partners, essentially treating them as monomers. The native sequence recapitulation results for the 88 artificially divided monomers is presented in Supplementary Table S7. Generally, removal of the fixed binding partner had a negligible impact on the overall recapitulation rate, but resulted in a 9% decrease in the rate of recovering ‘interface’ residues and a 3.8% increase in the recovery rate of the core residues. This finding suggests that the recovery of the core might be affected by the interface for de novo PPI design, because often the interface and core regions are geometrically adjacent to each other.
To further improve the performance of PPI design, we introduced and optimized weights for the atomic-level interactions between residues from different chains by de novo design simulations for another 132 dimers that shared < 30% sequence identity to the 88 test set dimers. A comparison of the native sequence recapitulation results for designing the 88 test set dimers using the original EvoEF and the final optimized EvoEF2 energy function is presented in Supplementary Table S8 and summarized in Table 2. For EvoEF, 15.6%, 23.6%, 6.9% and 18.6% of residues from all, core, surface and interface positions were recovered, respectively, while for EvoEF2, the recapitulation rates improved to 30.9%, 42.4%, 21.4% and 31.3% for all, core, surface and interface residues, respectively. Again, EvoEF2 significantly outperformed EvoEF on de novo sequence design for PPIs. These sequence recapitulation results were similar to those obtained by EvoEF2-mon (Supplementary Tables S7 and S8), suggesting that EvoEF2-mon might be generally applicable to PPI design, although the weight parameters were optimized using monomer design simulations. This is consistent with a previous study that demonstrated that knowledge-based, solvent-mediated intra-molecular potentials are valid to represent inter-molecular interactions that take place at protein–protein interfaces (Keskin et al., 1998). In addition to the test set results, a comparison of the native sequence recapitulation results for the design of the 132 training dimers using EvoEF and EvoEF2 is presented in Supplementary Table S9. The results for designing PPIs from the training and test sets were quite similar, suggesting that the EvoEF2 energy weights are not overfit for PPI design. An example of a designed versus native PPI (PDB ID: 2WPT) is illustrated in Figure 4, where 12 out of the 25 interface residues from chain A were recovered in atomic-level detail and another three residues, Thr26, Asp30 and Asp45, were predicted to be serine, glutamic acid and glutamic acid, respectively, which have similar side-chains and physiochemical properties as the native residues. Unlike the finding that hydrophilic and charged residues were much less frequently seen in protein core regions, in the interface of 2WPT, 12 residues were hydrophilic, where 6 of them were successfully recovered. The design results suggest that the EvoEF2 energy function is accurate and appropriate for PPI as well as monomer design.
Table 2.
Summary of native sequence recapitulation results from designing 88 dimers using EvoEF, EvoEF2-mon and the final optimized EvoEF2 energy function
| Residues | #nat | EvoEF |
EvoEF2-mon |
EvoEF2 |
|||
|---|---|---|---|---|---|---|---|
| #id | #id/#nat | #id | #id/#nat | #id | #id/#nat | ||
| All | 13 738 | 2145 | 0.156 | 4189 | 0.305 | 4240 | 0.309 |
| Core | 3222 | 760 | 0.236 | 1353 | 0.420 | 1366 | 0.424 |
| Surface | 4098 | 283 | 0.069 | 861 | 0.210 | 878 | 0.214 |
| Interface | 2758 | 512 | 0.186 | 861 | 0.312 | 862 | 0.313 |
Note: #nat, number of native residues; #id, number of residues with recapitulated identities.
Fig. 4.
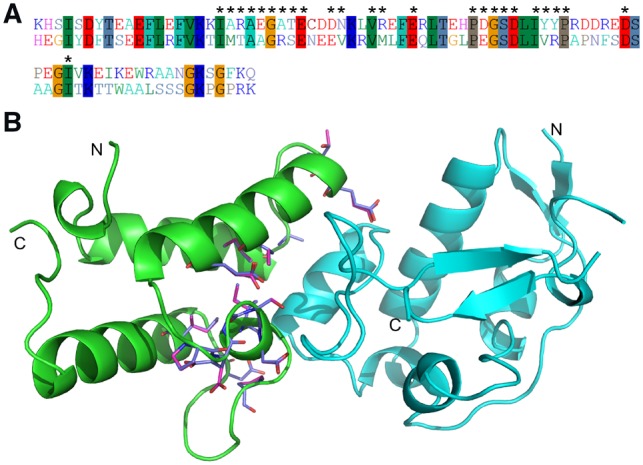
Comparison of a native and designed PPI based on the immunity protein 2 in complex with the colicin E9 endonuclease (PDB ID: 2WPT) designed using the EvoEF2 energy function. (A) The gapless alignment of native and designed sequences with a sequence identity of 41.5%. The interface residues are marked with ‘*’. (B) Comparison of the designed and native interface residues. The protein scaffold is shown in cartoon representation, and the native and designed interface residues on chain A are shown in sticks with different colors
3.6 Estimation of ΔΔGstability and ΔΔGbind
As a final test, we examined the performance of EvoEF and EvoEF2 for estimating protein stability change (ΔΔGstability) and protein–protein binding affinity change (ΔΔGbind) upon mutation. The performance of EvoEF2-mon for ΔΔGbind estimation was tested as well. The results are illustrated in Figure 5. Unsurprisingly, the EvoEF energy function optimized directly from thermodynamic data (Pearce et al., 2019) showed the best performance for this task. Although EvoEF2 was worse than EvoEF for ΔΔGstability estimation with a lower PCC and higher root-mean-square-error (RMSE), it was comparable to EvoEF for ΔΔGbind estimation, with a slightly lower PCC and RMSE. EvoEF-mon showed the worst performance for ΔΔGbind estimation, suggesting that the monomeric weights were not fully optimized for calculating interfacial residue interactions, where the EvoEF2 energy function optimized using dimer design had improved performance for this task. Although the results seemed to indicate that energy functions optimized for protein sequence design might not do well on thermodynamic data prediction (Sharabi et al., 2011a, b), it was of great importance to find the reason behind this observation, as it seems that nature uses a single energy function for different tasks (e.g. protein folding, evolution, mutation, etc.). The van der Waals attractive and repulsive energy components are two important terms to produce proper side-chain packing in the designed models. The Lennard-Jones 12-6 van der Waals potential can easily produce large positive energy values when there are steric clashes, which frequently occurs when building mutant models using a fixed backbone for mutations from smaller amino acids to larger amino acids. Therefore, in EvoEF and EvoEF2, we capped the pairwise repulsive energy such that the maximum value it can takes is five times the van der Waals well depth, in order to tolerate possible steric clashes.
Fig. 5.

Correlation between predicted and experimental values for mutation-induced folding stability and binding affinity changes. (A–C) Folding stability change (ΔΔGstability) upon mutation for monomer proteins estimated by EvoEF (A), EvoEF2-mon (B) and EvoEF2 (C) versus the experimental values for 3989 data points. (D–F) Binding affinity change (ΔΔGbind) upon mutation in the interface of protein–protein complexes predicted by EvoEF (D), EvoEF2-mon (E) and EvoEF2 (F) versus the experimental values for 2204 data points. R and σ stand for PCC and RMSE, respectively. For clarity, the units ‘kcal/mol’ for ΔΔG and σ are not shown
We noticed that a big difference between the EvoEF and EvoEF2 energy weights was that, for the intra-chain residue-residue interactions, the weight given to the van der Waals attractive energy was much larger than that of the repulsive component in EvoEF, while the attractive weight was smaller than the repulsive weight in EvoEF2 (Supplementary Table S3). In fact, this finding makes sense given the tasks we performed to optimize the energy weights using fixed protein backbones. For ΔΔG estimation, the steric clashes had to be tolerated using a down-weighted van der Waals repulsive term, as the majority of the mutations were from smaller amino acids to larger amino acids, while for sequence design, especially native sequence recapitulation, unwanted clashes should be avoided using an up-weighted van der Waals repulsive term. This contradiction suggests that, in the future, introducing protein backbone flexibility in the design process (Huang et al., 2011; Mandell and Kortemme, 2009) and developing a more balanced general energy function is necessary.
4 Discussion and conclusion
The accuracy of an energy function plays a key role in successful protein design. The primary goal for developing EvoEF was to replace FoldX (Guerois et al., 2002) for calculating the atomic-level physical interactions in EvoDesign (Pearce et al., 2019), and EvoEF was optimized following a similar procedure as FoldX but with a particular emphasis on binding interactions. However, the dominant EvoDesign evolutionary potential may cover up the inability of EvoEF to produce native-like sequences by itself. Moreover, we found in this study that the EvoEF optimized on thermodynamic mutation data was not able to produce native-like sequences, in agreement with the argumentation of (Leaver-Fay et al., 2013) that an energy function fully trained to predict the free energy changes upon mutation may not be appropriate for sequence design. A plausible explanation is that optimization on mutational data only focuses on the local environment of a protein structure at a given position, whereas optimization using sequence recovery focuses globally on the frequency and occurrence of amino acids and may also incorporate effects related to the metabolic cost of making amino acids, their effects on solubility and so forth.
Therefore, it may be more reasonable to optimize an energy function for sequence design using native sequence recapitulation. Consequently, we extended EvoEF to EvoEF2 by introducing four new terms which were found to be important for sequence design (Alford et al., 2017), and optimized EvoEF2 by improving its ability to recapitulate native-like sequences. EvoEF2 showed comparable native sequence recapitulation performance as other state-of-the-art protein design programs, such as Medusa (Ding and Dokholyan, 2006) and Rosetta (Alford et al., 2017). Furthermore, we used an independent protein structure prediction algorithm, I-TASSER (Yang et al., 2015), to examine the foldability of the designed sequences and we found that all 148 monomer designs were predicted to fold into structures with TM-scores > 0.5, or alternatively with RMSDs < 4 Å, to the native structures. It is worth mentioning that the EvoEF2 and I-TASSER energy functions are completely different, but both of them can capture the physical relationship between the structure and sequence or vice versa. These results suggest that the design performance using EvoEF2 alone should be sufficiently reliable even if robust evolutionary profiles are not available.
EvoEF2 was primarily optimized and tested on X-ray structures, and based on the test results on 29 X-ray/NMR structure pairs, we found that, in general, X-ray structures are better scaffolds than NMR structures because X-ray structures were able to produce sequences with lower energies and higher sequence identities to the native proteins in our sequence recapitulation tests. However, for six NMR structures, at least one NMR model could yield similar or even better results than the corresponding X-ray templates, suggesting that an NMR structure can be used as an alternative template when an X-ray structure is not available.
Interestingly, the EvoEF2 energy weights optimized on monomers was also applicable to de novo PPI sequence design, without dramatically weakening the performance and specifically optimizing the interface interactions slightly improved the native sequence recapitulation rates. These results suggest that the inter-chain and intra-chain atomic interactions essentially are the same, although the detailed techniques for calculating them might be different to some extent.
Due to its specific parameter optimization using thermodynamic mutation data, EvoEF performed better than EvoEF2 on the task of mutation modeling with a slightly higher PCC for ΔΔGstability prediction, but they were comparable for ΔΔGbind estimation. We found that a big difference between the EvoEF and EvoEF2 energy weights was that, for the monomeric residue-residue interactions, the weight of the van der Waals attractive energy was larger than that of the repulsive component in EvoEF, while the attractive weight was smaller than the repulsive weight in EvoEF2. And in fact, the larger weight of the van der Waals repulsive term resulted in a higher penalty for steric clashes, reducing its tolerance of small-to-large mutations, which was the most common mutation type in the thermodynamic mutation datasets and was the main reason for the decrease in ΔΔGstability and ΔΔGbind prediction performance. Ideally, it is most desirable to develop a single uniform energy function, as is used by nature, for all classes of tasks; but, in reality, such an energy function does not exist and modifications to an energy function that improve its performance for one purpose might degrade its performance at others. Therefore, we conclude that, for thermodynamic data prediction, an energy function specifically optimized for this task might be more appropriate than those for protein design.
To summarize, we quantitatively compared EvoEF and EvoEF2, and demonstrated that EvoEF2 significantly outperformed EvoEF for novel sequence design. The foldability assessment by I-TASSER showed that all 148 designed monomer proteins were predicted to fold into similar structures as the native scaffolds, highlighting the accuracy of EvoEF2. A combination of EvoEF2 and I-TASSER may help accelerate large-scale, automatic protein design and assessment. More importantly, the ability of EvoEF2 to perform novel sequence design will be further tested by biochemical and biophysical experiments in the near future. For instance, using X-ray or NMR to experimentally determine the fold of designed proteins can provide the ultimate design validation. At present, we are working on the design of several functional proteins in our laboratory and plan to use X-ray crystallography to experimentally examine the structures of the designed sequences based on the EvoEF2 force field.
Supplementary Material
Acknowledgements
The work used the Extreme Science and Engineering Discovery Environment (XSEDE) clusters (Towns et al., 2014), which is supported by the National Science Foundation (ACI-1548562).
Funding
The work was supported by the National Institute of General Medical Sciences (GM083107 and GM116960), the National Institute of Allergy and Infectious Diseases (AI134678) and the National Science Foundation (DBI1564756 and IIS1901191).
Conflict of Interest: none declared.
References
- Alford R.F. et al. (2017) The Rosetta all-atom energy function for macromolecular modeling and design. J. Chem. Theory Comput., 13, 3031–3048. [DOI] [PMC free article] [PubMed] [Google Scholar]
- Bazzoli A. et al. (2011) Computational protein design and large-scale assessment by I-TASSER structure assembly simulations. J. Mol. Biol., 407, 764–776. [DOI] [PMC free article] [PubMed] [Google Scholar]
- Brender J.R., Zhang Y. (2015) Predicting the effect of mutations on protein-protein binding interactions through structure-based interface profiles. PLoS Comput. Biol., 11, e1004494.. [DOI] [PMC free article] [PubMed] [Google Scholar]
- Brooks B.R. et al. (1983) CHARMM: a program for macromolecular energy, minimization, and dynamics calculations. J. Comput. Chem., 4, 187–217. [Google Scholar]
- Dahiyat B.I., Mayo S.L. (1997) De novo protein design: fully automated sequence selection. Science, 278, 82–87. [DOI] [PubMed] [Google Scholar]
- Ding F., Dokholyan N.V. (2006) Emergence of protein fold families through rational design. PLoS Comput. Biol., 2, e85.. [DOI] [PMC free article] [PubMed] [Google Scholar]
- Fu L. et al. (2012) CD-HIT: accelerated for clustering the next-generation sequencing data. Bioinformatics, 28, 3150–3152. [DOI] [PMC free article] [PubMed] [Google Scholar]
- Gainza P. et al. (2012) Protein design using continuous rotamers. PLoS Comput. Biol., 8, e1002335.. [DOI] [PMC free article] [PubMed] [Google Scholar]
- Guerois R. et al. (2002) Predicting changes in the stability of proteins and protein complexes: a study of more than 1000 mutations. J. Mol. Biol., 320, 369–387. [DOI] [PubMed] [Google Scholar]
- Huang P.S. et al. (2011) RosettaRemodel: a generalized framework for flexible backbone protein design. PLoS One, 6, e24109.. [DOI] [PMC free article] [PubMed] [Google Scholar]
- Huang X. et al. (2013) Systematic optimization model and algorithm for binding sequence selection in computational enzyme design. Prot. Sci., 22, 929–941. [DOI] [PMC free article] [PubMed] [Google Scholar]
- Keskin O. et al. (1998) Empirical solvent-mediated potentials hold for both intra-molecular and inter-molecular inter-residue interactions. Prot. Sci., 7, 2578–2586. [DOI] [PMC free article] [PubMed] [Google Scholar]
- Kirkpatrick S. et al. (1983) Optimization by simulated annealing. Science, 220, 671–680. [DOI] [PubMed] [Google Scholar]
- Kortemme T. et al. (2003) An orientation-dependent hydrogen bonding potential improves prediction of specificity and structure for proteins and protein–protein complexes. J. Mol. Biol., 326, 1239–1259. [DOI] [PubMed] [Google Scholar]
- Krivov G.G. et al. (2009) Improved prediction of protein side-chain conformations with SCWRL4. Proteins, 77, 778–795. [DOI] [PMC free article] [PubMed] [Google Scholar]
- Kuhlman B., Baker D. (2000) Native protein sequences are close to optimal for their structures. Proc. Natl. Acad. Sci. USA, 97, 10383–10388. [DOI] [PMC free article] [PubMed] [Google Scholar]
- Kuhlman B. et al. (2003) Design of a novel globular protein fold with atomic-level accuracy. Science, 302, 1364–1368. [DOI] [PubMed] [Google Scholar]
- Leaver-Fay A. et al. (2013) Scientific benchmarks for guiding macromolecular energy function improvement. Methods Enzymol., 523, 109–143. [DOI] [PMC free article] [PubMed] [Google Scholar]
- Mandell D.J., Kortemme T. (2009) Backbone flexibility in computational protein design. Curr. Opin. Biotechnol., 20, 420–428. [DOI] [PubMed] [Google Scholar]
- Mitra P. et al. (2013) An evolution-based approach to de novo protein design and case study on Mycobacterium tuberculosis. PLoS Comput. Biol., 9, e1003298.. [DOI] [PMC free article] [PubMed] [Google Scholar]
- Pearce R. et al. (2019) EvoDesign: designing protein-protein binding interactions using evolutionary interface profiles in conjunction with an optimized physical energy function. J. Mol. Biol., 431, 2467–2476. [DOI] [PMC free article] [PubMed] [Google Scholar]
- Rost B. (1999) Twilight zone of protein sequence alignments. Prot. Eng., 12, 85–94. [DOI] [PubMed] [Google Scholar]
- Saunders C.T., Baker D. (2005) Recapitulation of protein family divergence using flexible backbone protein design. J. Mol. Biol., 346, 631–644. [DOI] [PubMed] [Google Scholar]
- Schneider M. et al. (2009) X-ray vs. NMR structures as templates for computational protein design. Proteins, 77, 97–110. [DOI] [PMC free article] [PubMed] [Google Scholar]
- Shapovalov M.V., Dunbrack R.L. Jr (2011) A smoothed backbone-dependent rotamer library for proteins derived from adaptive kernel density estimates and regressions. Structure, 19, 844–858. [DOI] [PMC free article] [PubMed] [Google Scholar]
- Sharabi O. et al. (2011a) Triathlon for energy functions: who is the winner for design of protein-protein interactions? Proteins, 79, 1487–1498. [DOI] [PubMed] [Google Scholar]
- Sharabi O. et al. (2011b) Optimizing energy functions for protein-protein interface design. J. Comput. Chem., 32, 23–32. [DOI] [PubMed] [Google Scholar]
- Shultis D. et al. (2015) Crystal structure of designed PX domain from cytokine-independent survival kinase and implications on evolution-based protein engineering. J. Struct. Biol., 191, 197–206. [DOI] [PMC free article] [PubMed] [Google Scholar]
- Shultis D. et al. (2019) Changing the apoptosis pathway through evolutionary protein design. J. Mol. Biol., 431, 825–841. [DOI] [PMC free article] [PubMed] [Google Scholar]
- Tian Y. et al. (2015) Computational design of enzyme-ligand binding using a combined energy function and deterministic sequence optimization algorithm. J. Mol. Model, 21, 191–204. [DOI] [PubMed] [Google Scholar]
- Towns J. et al. (2014) XSEDE: accelerating scientific discovery. Comput. Sci. Eng., 16, 62–74. [Google Scholar]
- Xiong P. et al. (2017) BindProfX: assessing mutation-induced binding affinity change by protein interface profiles with pseudo-counts. J. Mol. Biol., 429, 426–434. [DOI] [PMC free article] [PubMed] [Google Scholar]
- Xu J., Zhang Y. (2010) How significant is a protein structure similarity with TM-score = 0.5? Bioinformatics, 26, 889–895. [DOI] [PMC free article] [PubMed] [Google Scholar]
- Yang J. et al. (2015) The I-TASSER Suite: protein structure and function prediction. Nat. Methods, 12, 7–8. [DOI] [PMC free article] [PubMed] [Google Scholar]
- Zhanhua C. et al. (2005) Protein subunit interfaces: heterodimers versus homodimers. Bioinformation, 1, 28–39. [DOI] [PMC free article] [PubMed] [Google Scholar]
Associated Data
This section collects any data citations, data availability statements, or supplementary materials included in this article.