Abstract
Graphitic carbon nitride (g-C3N4) is a robust organic semiconductor photocatalyst with proven H2 evolution ability. However, its application in a photoelectrochemical system as a photocathode for H2 production is extremely challenging with the majority of reports representing it as a photoanode. Despite research into constructing g-C3N4 photocathodes in recent years, factors affecting an n-type semiconductor’s properties as a photocathode are still not well-understood. The current work demonstrates an effective strategy to transform an n-type g-C3N4 photoanode material into an efficient photocathode through introducing electron trap states associated with both N-defects and C–OH terminal groups. As compared to the g-C3N4 photoelectrode, this strategy develops 2 orders of magnitude higher conductivity and 3 orders of magnitude longer-lived shallow-trapped charges. Furthermore, the average OCVD lifetime observed for def-g-C3N4 is 5 times longer than that observed for g-C3N4. Thus, clear photocathode behavior has been observed with negative photocurrent densities of around −10 μA/cm2 at 0 V vs RHE. Open circuit photovoltage decay (OCVD), Mott–Schottky (MS) plot, and transient absorption spectroscopy (TAS) provide consistent evidence that long-lived shallow-trapped electrons that exist at about the microsecond time scale after photoexcitation are key to the photocathode behavior observed for defect-rich g-C3N4, thus further demonstrating g-C3N4 can be both a photoanode and a photocathode candidate.
Introduction
The need to replace fossil fuels with renewable sources of energy is widely recognized. Photocatalysis presents an efficient method for generating green and sustainable fuels for the future.1 In particular, hydrogen fuel generation using polymer photocatalysts has drawn intensive attention in the past decade because photocatalysts are abundant, environmentally benign, and have easily tunable band structure. As a benchmark polymer photocatalyst, great success in overall water cleavage and especially hydrogen evolution (up to 20 000 μmol h–1 g–1) has been achieved using a nominal g-C3N4 (in fact, it is CNxHy as many protons are incorporated in the commonly prepared carbon nitrides; it is denoted as g-C3N4 in this work for consistence with all papers published in this field)2 in suspension systems. Such an H2 evolution rate is much higher than those of the majority of inorganic photocatalysts,3 indicating this nominal g-C3N4 would be an excellent candidate as a photocathode.4,5 Further applications on this polymer photocatalyst include the synthesis of a value-added molecule in a suspension system, such as CO2 reduction, N2 reduction, methane conversion, etc.6−9 However, only a few works reported on the single-phase g-C3N4 as a photocathode with a low photocurrent density.10−14 The reason behind this inconsistency between its extremely excellent H2 evolution ability and very poor photocathodic performance is not well studied but is of scientific significance for its application and efficiency improvement in photoelectrochemical water splitting, taking into account its potential to be an excellent photocathode for solar H2 production. To address this challenge, fundamental factors that affect the photocathodic behavior of g-C3N4 have to be understood comprehensively.
The intrinsic property of the g-C3N4 film as an n-type semiconductor limits hydrogen generation at the electrode/electrolyte interface, as n-type semiconductors exhibit upward band bending, which results in accumulation of holes on the surface. This promotes anodic behavior, resulting in many literature reports of photoanodes based on pristine g-C3N4.15−17 To realize its potential to be an efficient photocathode, diverse strategies for preparing g-C3N4-based photocathodes were developed including heteroatom doping,18 biopolymer activation,19 and heterojunction construction,14 while the photocurrent of the prepared photocathode is still very moderate, as compared to a photoanode.20 The function of trap states has been shown to be essential to pristine g-C3N4’s performance in a suspension system, where cyanamide defects have been proven to be catalytically relevant sites,21 long-lived trapped electrons enabled H2 evolution even in the dark condition,22 and shallow-trapped electrons significantly improved the photocatalytic activity.23,24 Trap states in g-C3N4 are commonly a result of structural defects and can be caused by structural nonideality, including C/N vacancies and/or −OH/–NHx terminal groups. Different defects give rise to different types of trap states, which in turn result in different PEC behavior.
To understand the impact of trap states on the photoelectrode characteristics of g-C3N4 in depth and more importantly to discover an efficient strategy for g-C3N4 to be an excellent photocathode, herein we tried to introduce N defects along with C–OH terminal groups to generate trap states in the g-C3N4 framework through ultrasonication. As compared to a reference g-C3N4 film that behaves as a photoanode, defect-introduced g-C3N4 exhibits clear cathodic PEC behavior. Open circuit photovoltage decay (OCVD), Mott–Schottky (MS) plot, and transient absorption spectroscopy (TAS) measurements provide strong and consistent evidence for the existence of a large portion of shallow-trapped electrons that exist over microsecond time scales after photoexcitation of defect-introduced g-C3N4, which are effective for water reduction. To provide further evidence for the necessity of trap states associated with C–OH terminal groups and N defects for cathodic performance, reference g-C3N4 film was protonated using H2O2 treatment and shows a clear transformation from a photoanode to a photocathode. These findings provide a novel strategy for an efficient polymer photocathode for solar-driven H2 fuel synthesis.
Results and Discussion
Defects Characterization
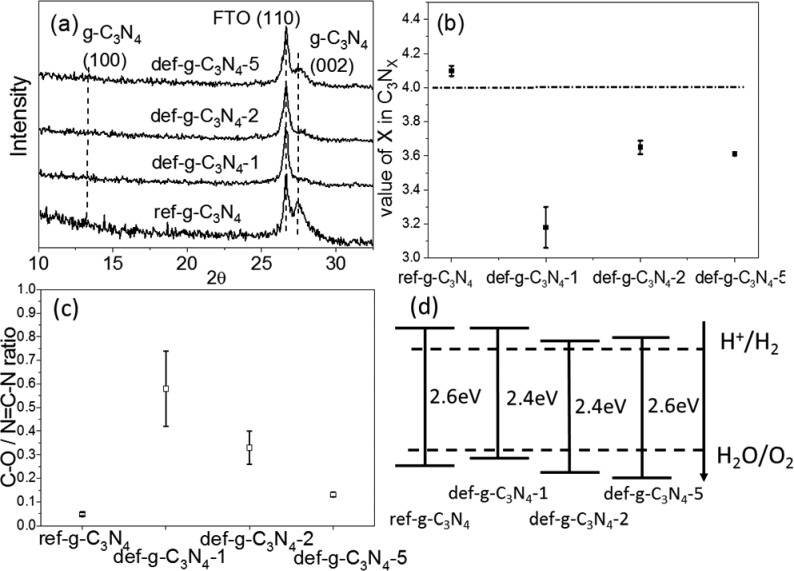
To investigate the functions of trap states in g-C3N4, four different g-C3N4 samples were prepared, consisting of one reference film (ref-g-C3N4) with a low defect density and three defect-introduced films. The defect-introduced films were prepared by sonicating g-C3N4 powder for 1, 2, or 5 h in water, and then they were drop-casted onto FTO glass substrate and labeled as def-g-C3N4-1, def-g-C3N4-2, and def-g-C3N4-5, respectively. The XRD patterns of all four samples are shown in Figure 1a. All samples show a peak at 27.5°, which represents the interlayer arrangement in the g-C3N4 structure, indicating that defects introduced by ultrasonication do not affect the interlayer spacing of g-C3N4. Obviously, sonicating has a significant impact on the crystallinity of g-C3N4 as the peak intensity at 27.5° shows a big variation with sonication duration. The lowest peak intensity of g-C3N4-1 indicates that 1 h of sonication has introduced severe structure disorder, while a longer sonicating duration (2 and 5 h) could partially restore the crystallinity. It is probably due to the reassembly and recrystallization of exfoliated g-C3N4 layers, while unstable structures (with defects) would be eliminated by long-time sonication. The other broad peak at 13.2° is ascribed to the repeating heptazine structure, which is absent in def-g-C3N4-1 and def-g-C3N4-2 samples due to their poor crystallinity.25 The sharp peak at 26.7° is attributed to the (110) plane from the FTO substrate.26
Figure 1.
(a) XRD patterns of ref-g-C3N4, def-g-C3N4-1, def-g-C3N4-2, and def-g-C3N4-5 prepared on FTO substrate, which show an extra peak from the SnO2 (110) plane. (b) Carbon to nitrogen ratio calculated from the XPS survey spectra of all samples, where the straight line indicates the carbon to nitrogen ratio in an ideal g-C3N4. (c) C–O bond to N=C–N bond ratio calculated from XPS C 1s spectra of all samples. (d) Band structure of all samples determined by their UV–vis absorption and XPS valence-band spectra.
To investigate the impact of sonication on the g-C3N4 structure in more detail, the carbon to nitrogen ratio and C–O bond to N=C–N bond ratio on the surface of all samples calculated from XPS spectra (Figure S1) are displayed in Figure 1b and c and summarized in Table S1. The ref-g-C3N4 has an N/C ratio of 4.10(±0.03)/3, close to the stoichiometric ratio of pristine g-C3N4. One hour of sonication results in a decrease of N/C ratio to 3.18(±0.12)/3. The decreased N/C ratio likely indicates that N vacancies were created by sonication. Further sonication (2 and 5 h) increases the N/C ratio to 3.65(±0.04)/3 and 3.61(±0.01)/3. With longer sonication time, the elementary component of g-C3N4 particles becomes more uniform, evident from the reduced error bar calculated by the three repeated experiments in Figure 1b. Consistent with XRD analysis, more N defects result in lower crystallinity of the g-C3N4 structure. The surface area of the def-g-C3N4-1, def-g-C3N4-2, and def-g-C3N4-5 samples was determined by BET measurements (Table S2 and Figure S2) to be 12.9, 13.4, and 18.5 m2/g, respectively, which is a little larger than that of the bulk g-C3N4 (10.9 m2/g).
Figure S1 shows C1s XPS spectra, which elaborate the chemical surroundings of the C element in all four samples. The peak at 288.1 eV corresponds to the binding energy of the C–N bonding, which is dominant in the heptazine structure. The peak centered at 284.8 eV is assigned to adventitious carbon. The faint peak at 286.2 eV corresponds to C–O bonds. In ref-g-C3N4, the ratio of the C–O bond to N=C–N bond is quite low (0.047 ± 0.007). Sonicating the g-C3N4 powder for 1 h significantly increases the C–O/N=C–N ratio to 0.58 ± 0.16. Further sonication (2 and 5 h) decreases the ratio to 0.33 ± 0.07 and 0.13 ± 0.01, respectively. The 1H solid-state NMR spectra of g-C3N4 and defects-introduced def-g-C3N4-5 sample show obvious differences. As shown in Figure S3, the 1H solid-state NMR spectrum of g-C3N4 contains two main peaks at 8.9 and 4.2 ppm, which can be attributed to the chemical shifts of the −NHx ending group and residual water, respectively.27 An additional clear peak located at 4.5 ppm is present in the def-g-C3N4-5 sample and can be ascribed to the formation of C–OH bonds.27 The appearance of C–OH in the def-g-C3N4-5 sample NMR spectrum is in agreement with XPS analysis.
XPS N 1s spectra are displayed in Figure S4, and a percentage breakdown of different bonds has been summarized in Table S3. Ratios of sp2 N to the sum of sp3 N and C–NHx have been calculated to illustrate the completeness of g-C3N4 structure. In an ideal g-C3N4, the ratio should be 3. There are distinct differences among ratios of different samples. The ref-g-C3N4 has the highest bond ratio of 2.9, which is close to the ideal ratio. The higher ratio (up to 3) suggests a lower level of defects and structure disorder. The ratio of the other three samples increases in the order of def-g-C3N4-1 (1.8), def-g-C3N4-2 (2.0), and def-g-C3N4-5 (2.6), which is consistent with the C:N ratio and XRD analysis.
UV–vis spectra illustrating the light absorption of all samples are displayed in Figure S5a. The band gaps of ref-g-C3N4, def-g-C3N4-1, def-g-C3N4-2, and def-g-C3N4-5 are 2.6, 2.4, 2.4, and 2.6 eV, respectively, determined from the Tauc plots in Figure S5b. The creation of N defects and introduction of C–O bonds inevitably changed the band structure of the g-C3N4 samples. From Figure S5c, the linear extrapolations of the XPS valence-band plots intercept the x-axis at 2.0, 1.8, 2.2, and 2.3 eV for ref-g-C3N4, def-g-C3N4-1, def-g-C3N4-2, and def-g-C3N4-5, respectively. Combining this information with the band gap from UV–vis spectra, the relative band structures of all four g-C3N4 samples are depicted in Figure 1d.
Photoelectrochemical Performance Associated with Defects-Induced Electron Trap States
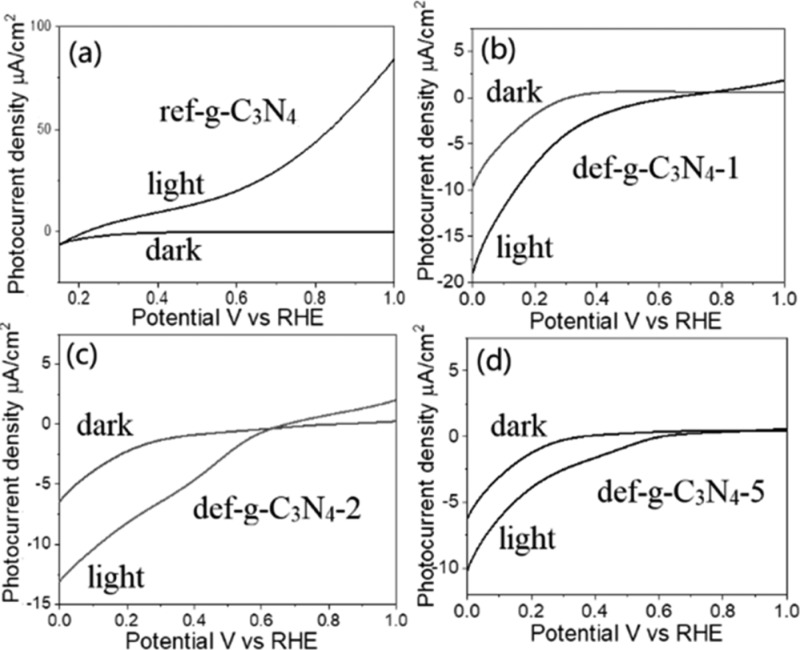
The photoelectrochemical performance of the ref-g-C3N4, def-g-C3N4-1, def-g-C3N4-2, and def-g-C3N4-5 samples was examined in Figure 2, using a three-electrode PEC system. The photoresponse of bare FTO substrate is shown in Figure S6, which is negligible. In Figure 2a, the ref-g-C3N4 sample exhibits a clear photoanodic current with a relatively low onset potential at +0.15 V vs RHE. Such a low potential indicates that the oxidation reaction could easily happen on the electrode/electrolyte interface, which is expected as holes accumulate on the surface of an n-type semiconductor, resulting in typical photoanode performance of ca. 90 μA/cm2 at 1.0 V vs RHE. However, as is characteristic for a photocathode, negative photocurrent is recorded for def-g-C3N4-1, def-g-C3N4-2, and def-g-C3N4-5 as −10, −6, and −4 μA/cm2 at 0 V vs RHE (Figure 2b–d). As compared to the ref-g-C3N4, the def-g-C3N4-1, def-g-C3N4-2, and def-g-C3N4-5 films also experience a large right shift of the onset potential from +0.15 V vs RHE to +0.70, +0.60, and +0.60 V vs RHE, respectively. The shifted onset potential is probably because introducing the trap states could reduce surface hole accumulation, thus allowing electron accumulation on the surface as evidenced below by the open circuit photovoltage analysis, leading to the photoreduction reaction taking place on the surface of the g-C3N4-5 photoelectrode. Together with XPS and NMR analysis discussed above, it is reasonable to speculate that N-defects and −OH terminal groups may play a key role in its photocathode behavior.
Figure 2.
Photocurrent versus potential curves of (a) ref-g-C3N4, (b) def-g-C3N4-1, (c) def-g-C3N4-2, and (d) def-g-C3N4-5 with 150 W xenon lamp illumination in 0.1 M Na2SO4 electrolyte (pH = 6.5).
SEM views of all samples are displayed in Figure S7. The ref-g-C3N4 film (Figure S7a) has a uniform morphology with a thickness of ca. 500 nm, and the def-g-C3N4 film (Figure S7b–d) has a relatively uniform morphology with a thickness approaching 500 nm as well. As such, the morphology and film thickness are not factors that influence the cathodic behavior of the def-g-C3N4 photoelectrode. For photocathodic behavior to be observed, it is speculated that the N-defects and C–OH groups introduced in def-g-C3N4-5 act as surface traps for electrons. After photoexcitation, electrons trapped in these surface states can perform the reduction reaction, leading to the cathodic behavior.
To investigate the contribution of trap states to the photocathodic behavior of g-C3N4, open circuit photovoltage decay (OCVD) was performed on the ref-g-C3N4 and on a typical def-g-C3N4 sample (def-g-C3N4-5), and charge carrier density was studied with Mott–Schottky plots. As shown in Figure 3a, open circuit photovoltage decay (OCVD) plots of both samples show negative photovoltage with illumination, indicating that both films are n-type semiconductors. The generated photovoltage in ref-g-C3N4 is 10 times larger than that in def-g-C3N4. This could be due to the surface trap states below the conduction band in def-g-C3N4, which mediates the band bending, thus reducing the built-in electric field. The photoelectrons then can accumulate at the trap states, resulting in a small photovoltage determined by the potential difference between the trapped electron states and surface hole states. In one word, the defect induction into the def-g-C3N4 photoelectrode mediates its n-type characteristic.
Figure 3.
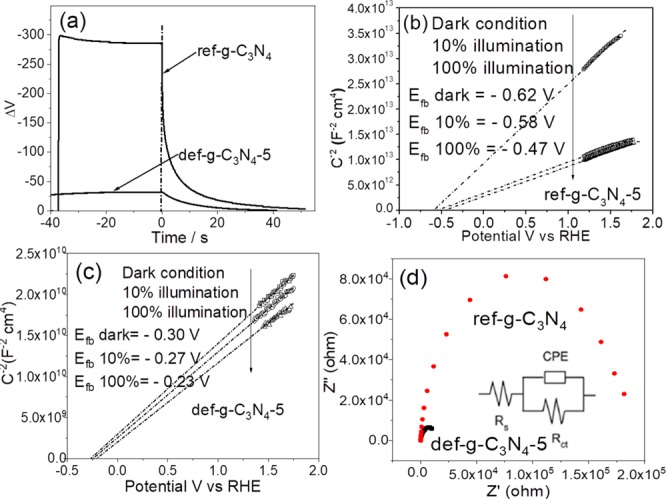
(a) Open circuit photovoltage decay (OCVD) of ref-g-C3N4 and def-g-C3N4-5 electrodes. (b) Mott–Schottky plots of ref-g-C3N4 electrode at 1 kHz with 0–100% illumination. (c) Mott–Schottky plots of def-g-C3N4-5 electrode at 1 kHz with 0–100% illumination (MS plots at different frequencies are shown in Figure S9). (d) Impedance plots of ref-g-C3N4 and def-g-C3N4-5 electrodes at 0.2 V vs RHE in dark condition; the inset is the equivalent circuit of g-C3N4 electrode, where Rs is the system resistance, Rct is the charge-transfer resistance, and CPE is the constant phase element representing the double layer capacitor.
With careful observation of the OCVD, one can see that def-g-C3N4 has much slower photovoltage decay after the illumination cutoff as compared to ref-g-C3N4. The average electron lifetimes of ref-g-C3N4 and def-g-C3N4 were, respectively, determined to be 0.9 and 5.5 s, calculated by fitting the photovoltage decay curves as shown in Figure S8. This could be indicative of a significantly higher concentration of surface trap states in def-g-C3N4 as compared to that in ref-g-C3N4.
To investigate the charge carrier density in ref-g-C3N4 and the typical and most reproducible defect-introduced g-C3N4 sample (g-C3N4-5), Mott–Schottky (MS) plots of these two samples under different illumination intensities were analyzed, respectively, in Figure 3b and c. The charge carrier density is determined from the slope of MS plots to be 1.2 × 10¹⁸ and 1.7 × 1021 cm–3 for ref-g-C3N4 and def-g-C3N4-5, respectively, and the Wsc is determined to be 22 and 0.4 nm for ref-g-C3N4 and def-g-C3N4-5, respectively (analysis process is shown in the Supporting Information and Table S4). Because the particle sizes of both samples shown in the SEM graphs in Figure S7 are much larger than their Wsc, a band bending is presented here.
Clear differences in slope were observed under different illumination conditions for ref-g-C3N4, as shown in Figure 3b. As compared to the dark condition, ref-g-C3N4 illuminated with 10% light intensity shows slopes dramatically reduced to one third of their original value (dark condition). The slope of the MS plot is inversely correlated with the charge carrier density. It could therefore be explained that, with illumination, photogenerated electrons are promoted to the conduction band of ref-g-C3N4, boosting the charge carrier density in the film by a factor of 3. Increasing the incoming light density to 100% does not further improve the carrier density level significantly, probably because of fast charge recombination with stronger light intensity.28 For the def-g-C3N4-5 film, as shown in Figure 3c, the slope of MS plots is 3 orders of magnitude lower than that of the ref-g-C3N4 samples in the dark condition, suggesting that introducing N defects in the g-C3N4 structure could significantly improve its charge carrier density and electron conductivity. In contrast, increasing the illumination intensity for def-g-C3N4-5 only slightly increases its charge carrier density, as shown in Figure 3c. This is consistent with the significantly lower photovoltage developed by def-g-C3N4-5 under illumination as compared to ref-g-C3N4 as the relatively weak illumination does not dramatically increase the surface trapped electrons.
In addition, the extrapolations of MS plots in dark condition incepted the x-axis at −0.59 V vs RHE (the flat-band potential, Efb, was calculated to be −0.62 V vs RHE) for ref-g-C3N4, while for def-g-C3N4, the flat-band potential is −0.30 V vs RHE, which also fits the conduction band edge in Figure 1d. Increasing the light intensity has positively shifted the Efb, which is a characteristic of n-type semiconductor, due to the change in hole density at the interface.29,30 Obviously, ref-g-C3N4 has experienced a larger Efb shift of 0.15 V from −0.62 V (in dark) to −0.47 V (100% illumination) than that of def-g-C3N4-5 (0.07 V) whose Efb shifted from −0.30 V (in dark) to −0.23 V (100% illumination). The surface states in a typical n-type semiconductor should result in a large positive shift of Efb;31,32 the opposite phenomenon (smaller shift) observed here implies that the n-type characteristic of def-g-C3N4-5 is moderated. This indicates that electrons are more easily transferred to the photoelectrode surface for reduction reaction. Impedance plots of the two samples are displayed in Figure 3d and analyzed in Table S5. The def-g-C3N4-5 has a 2 orders of magnitude smaller charge-transfer resistance (5.6 × 10³ Ω cm2) than that of ref-g-C3N4 (1.3 × 10⁵ Ω cm2). The significantly enhanced conductivity is in agreement with the observation in MS analysis.
Shallow Electron Trap States with Extended Lifetime
To further investigate the behavior of photoexcited charges and trap state distribution in the g-C3N4 photoelectrodes, transient absorption spectroscopy (TAS) was performed on ref-g-C3N4 and def-g-C3N4-1, def-g-C3N4-2, and def-g-C3N4-5 samples in Figure 4 with a time resolution of ca. 1 ns. The ref-g-C3N4 sample exhibits a positive TAS signal that monotonously increases toward longer probe wavelengths up to the instrumentation limit of 660 nm, in agreement with literature reporting the TAS signal of bulk g-C3N4 due to strong absorption of the excited photoelectrons.24,33 However, TAS spectra of def-g-C3N4 samples exhibit only negative TA signals in the visible probe region (in Figure 4b–d), which are quite different from those of ref-g-C3N4. Broadly speaking, the obtained TAS signal consists of three components: excited-state absorption (positive), stimulated emission (negative), and ground-state bleach (negative). For def-g-C3N4, the negative signal that dominates its TAS spectrum in the visible region can be attributed to stimulated emission,23,34 as its UV–vis spectrum shows that the ground-state material does not significantly absorb in the probe wavelength region (between 490 and 660 nm) used in TAS (Figure S5). Godin et al. suggested that photoexcited electrons can either be in emissive states close to the CB or be in deep nonemissive states, and water reduction can be driven by electrons trapped in shallow emissive states but not by electrons in nonemissive deep trap states.23 The current observations are consistent with this model, as ref-g-C3N4 exhibits long-lived positive TAS signals over microsecond time scales, commonly reported for photocatalytically less reductive g-C3N4.23,24,35 However, def-g-C3N4 exhibits negative TAS signals attributable to electrons in shallow emissive states with reduction potentials close to that of the conduction band, with lifetimes extending into the microsecond time scale. This is different from the submicrosecond lifetime observed by Godin et al. for electrons in emissive states. It is therefore possible that the N-defects and C–OH groups introduced in def-g-C3N4 help further trapping of electrons in shallow emissive states. There is thermodynamically sufficient driving force for proton reduction by these long-lived shallow-trapped electrons, which allows electron transfer from def-g-C3N4 to adsorbed species, resulting in cathodic behavior. Additionally, it may be observed from Figure 4 that the TA signal for def-g-C3N4 drastically decreases to almost zero within 1 μs after photoexcitation, which is consistent with the previous conjecture that fast recombination (over submicrosecond time scales) is accelerated in this material as compared to in ref-g-C3N4.
Figure 4.
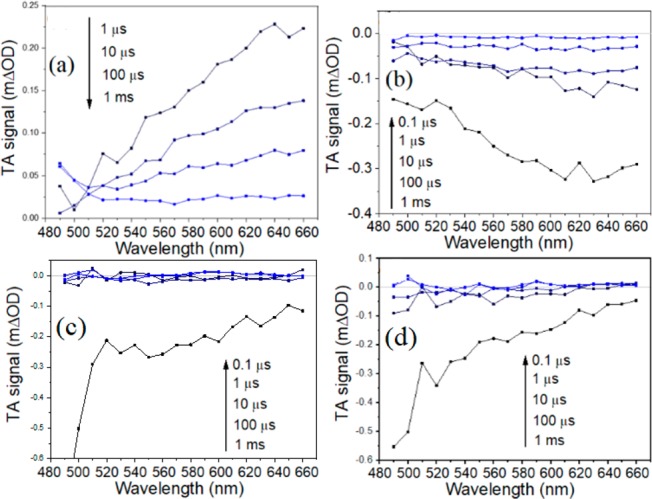
TAS spectra, obtained in N2 atmosphere after 355 nm excitation (200 Hz, 850 μJ/cm2/pulse), of (a) ref-g-C3N4 sample, (b) def-g-C3N4-1 sample, (c) def-g-C3N4-2 sample, and (d) def-g-C3N4-5 sample.
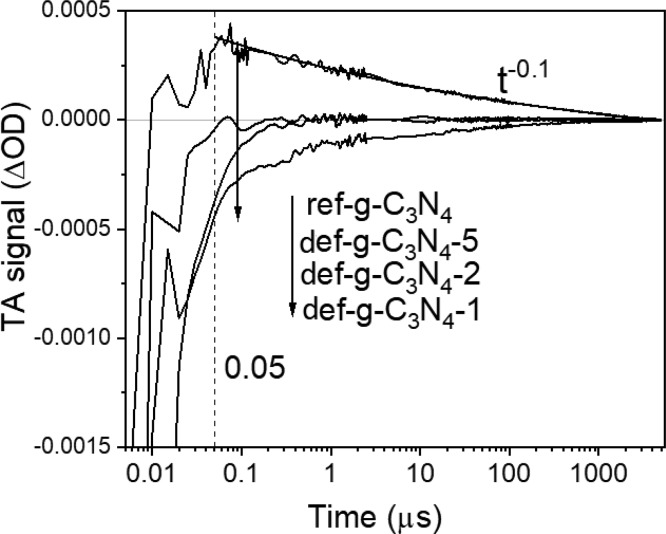
Interestingly, g-C3N4-1 (Figure 2b) exhibits the highest cathodic photocurrent density among def-g-C3N4 samples. This is likely because of the much lower nitrogen to carbon ratio and a consequently higher amount of C–O bond in g-C3N4-1, as evidenced in Figure 1b and c. Similar to def-g-C3N4-2 and def-g-C3N4-5 samples, the TAS spectrum of def-g-C3N4-1 is also negative across the visible probe wavelength region between 490 and 660 nm, as shown in Figure 4b. Following from previous discussions, the negative TAS signal is attributed to stimulated emission associated with electrons in shallow emissive states. However, in Figure 5, the decay of the TAS signal for def-g-C3N4-1 is slower than that for def-g-C3N4-2 and def-g-C3N4-5, which indicates that the lifetime of electrons in shallow emissive states is longer in def-g-C3N4-1 than in the other two samples. This is consistent with the higher photocathode current exhibited by def-g-C3N4-1 and could be due to the greater amount of structural disorder that might facilitate charge separation in def-g-C3N4-1. In addition, the TAS spectrum for def-g-C3N4-1 becomes more positive toward 490 nm, which is opposite to the trend observed for def-g-C3N4-2 and def-g-C3N4-5. As the wavelength-dependence of stimulated emission should approximately follow the form of photoluminescence (with a Stokes shift) because they have the same physical origins,36 its contribution to the TAS spectrum should be similar for def-g-C3N4-1, def-g-C3N4-2, and def-g-C3N4-5 (Figure S10). As such, it is likely that def-g-C3N4-1 has a significant population of trapped electrons that exhibit stronger excited-state absorption toward shorter wavelengths (490 nm). The final TAS spectrum in Figure 4b is a combination of the positive excited-state absorption and stimulated emission. The population of electrons exhibiting excited-state absorption that increases toward shorter wavelengths is absent in def-g-C3N4-2 and def-g-C3N4-5, which could be due to the destruction of the trap states responsible for this excited-state absorption feature after prolonged sonication.
Figure 5.
TAS kinetics of ref-g-C3N4, def-g-C3N4-1, def-g-C3N4-2, and def-g-C3N4-5 samples under N2 atmosphere after 355 nm excitation (200 Hz, 850 μJ/cm2/pulse), monitored with a 660 nm probe (the kinetic data for ref-g-C3N4 50 ns after photoexcitation are fitted by a power-law decay function).
The TA decay kinetics monitored with a 660 nm probe for ref-g-C3N4, def-g-C3N4-1, and def-g-C3N4-5 are directly compared in Figure 5. The def-g-C3N4-2 and def-g-C3N4-5 samples exhibit significantly faster decay as previously discussed. The TAS signal for def-g-C3N4-1 remains negative up to millisecond time scales, whereas the TAS signal for def-g-C3N4-2 and def-g-C3N4-5 decays to zero (within the signal-to-noise) in under 100 μs.
However, the TAS signal for ref-g-C3N4 is mostly positive, attributed to deep-trapped carriers as previously discussed. The decay kinetics 50 ns after photoexcitation of ref-g-C3N4 is well-fitted by a power-law function. Before 50 ns, the kinetic curve strongly deviates from the fitted power-law function due to significant contributions from stimulated emission. However, this negative component becomes negligible within 50 ns after photoexcitation, indicating that the lifetime of electrons in shallow emissive states is <50 ns in ref-g-C3N4, whereas the negative TA signal observed for def-g-C3N4 is still significant up to tens of a microsecond. As such, as compared to ref-g-C3N4, the lifetime of shallow-trapped electrons is extended by 3 orders of magnitude in time in the optimized def-g-C3N4-1 sample.
To conclude that the trapped photoelectrons in the def-g-C3N4 sample studied by TAS have a potential to be able to produce H2, the TAS spectra were compared under N2, water, and AgNO3 solution, as shown in Figure S11. The negative TAS signal has been dramatically reduced in AgNO3 solution, which is evidence for electrons in emissive states readily being scavenged by Ag+. The TAS signal in water is also substantially reduced as compared to N2, which suggests that electrons are capable of being transferred to water/protons.
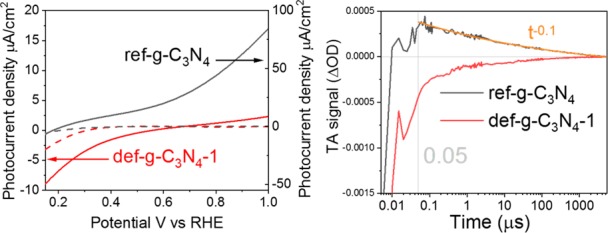
As previously mentioned, significant trap states in the def-g-C3N4 samples have been attributed to N defects and C–OH groups. To further investigate their roles in a g-C3N4 photocathode, the ref-g-C3N4 sample, which has shown good photoanodic performance, was protonated by H2O2 treatment. After being treated with 30% H2O2 at 70 °C for 2 weeks, ref-g-C3N4 clearly shows a photocathodic performance, exhibiting a negative photocurrent with an onset potential at +0.8 V vs RHE (Figure 6a). The average charge lifetime derived from OCVD plots of treated ref-g-C3N4 in Figure 6b has increased from 0.9 to 2.8 s (Figure S12), indicating an increase of surface trap state density after treatment. The C 1s XPS spectra in Figure 6c displays a clear left-shift peak of the C–O bond after H2O2 treatment, which is due to the appearance of the C–OH group.37 In Table 1, the ratio of the C–O bond to the N=C–N bond increases from 0.043 ± 0.007 to 0.066 ± 0.002 after H2O2 protonation, indicating an increase in the amount of C–OH bond as well, with N=C–N bond as a reference. Meanwhile, the carbon to nitrogen ratio has changed from C3N4.10±0.02 to C3N3.96±0.04, which suggests the introduction of N defects in the structure of g-C3N4 after H2O2 treatment. This provides further evidence that the introduction of both N defects and C–OH end groups, not just one of them, generates the trap states, which are responsible for the cathodic behavior of an n-type g-C3N4 semiconductor. In addition, as the amount of N defects and C–OH end groups induced by H2O2 treatment is not as high as that in def-g-C3N4 samples, its photocathodic performance is also weaker as compared to that of other samples.
Figure 6.
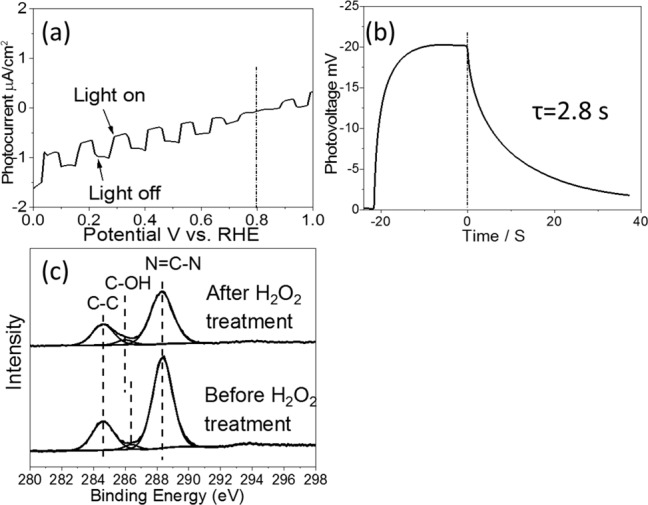
(a) Photocurrent versus potential plot, (b) open circuit photovoltage decay curve, and (c) C1s XPS spectra of ref-g-C3N4 before and after H2O2 treatment.
Table 1. Carbon to Nitrogen Ratio and C–O Bond to N=C–N Bond Ratio in ref-g-C3N4 before and after H2O2 Treatment.
| before H2O2 treatment | after H2O2 treatment | |
|---|---|---|
| CxNy | C3N4.13±0.02 | C3N3.94±0.04 |
| C–O bond/N=C–N bond ratio | 0.043 ± 0.007 | 0.066 ± 0.002 |
Conclusion
It has been demonstrated that by introducing N defects along with C–OH terminal groups in the g-C3N4 structure, this n-type photoanode material (ref-g-C3N4) is modified to behave as a photocathode (def-g-C3N4). The g-C3N4 photoanode shows ca. 90 μA/cm2 at 1.0 V vs RHE, and the optimized def-g-C3N4-1 shows a photocathodic performance with ca. −10 μA/cm2 at 0 V vs RHE. This photocathode performance is rationalized by the presence of shallow electron traps associated with the synergy of N-defects and C–OH terminal groups introduced through ultrasonication in water, as indicated by XPS and NMR. The ultrasonicated sample also develops 2 orders of magnitude higher conductivity and 1000 times longer-lived shallow-trapped charges as compared to the g-C3N4. Furthermore, the average OCVD lifetime observed for def-g-C3N4 is 5 times longer than that of the reference, which can be attributed to residual surface-trapped electrons that gradually recombine with photogenerated holes in the bulk material that slowly diffuse to the surface. In addition, TAS revealed that, as compared to the reference material (ref-g-C3N4), in def-g-C3N4 there is a large portion of photoexcited electrons in shallow emissive states with enough driving force for proton reduction, and the lifetime of these electrons is extended by 3 orders of magnitude in time into the microsecond time scale. As such, OCVD, MS plots, and TAS collectively provide evidence that long-lived electrons in shallow surface trap states associated with N-defects and C–OH terminal groups are key to the photocathodic characteristics of def-g-C3N4. This is further evidenced by a clear transformation of a ref-g-C3N4 photoanode to photocathodic performance after H2O2 treatment. This new understanding demonstrates that g-C3N4 can be both a photoanode and a photocathode candidate and could aid the rational development and improvement of sustainable organic photoelectrochemical systems for water splitting.
Experimental Section
Material Synthesis
g-C3N4 powder was synthesized by calcinating 2 g of dicyandiamide (Alfa Aesar, 99%) at 600 °C for 4 h with a ramping of 5 °C/min in air atmosphere. Ten milligrams of as-prepared g-C3N4 particles were sonicated by an ultrasonic cleaning bath (U500H, Ultrawave Ltd., ultrasonic power 100 W) in 30 mL of distilled water for 1, 2, and 5 h. One milliliter of as-obtained suspension was drop-casted on a 2 cm × 2 cm FTO glass and dried at 70 °C for 1 h. The fabricated films made from 1, 2, and 5 h sonicated g-C3N4 suspension were labeled as def-g-C3N4-1, def-g-C3N4-2, and def-g-C3N4-5, respectively. Reference g-C3N4 film was fabricated by a rapid thermal condensation method as we reported before.15,26
Photoelectrochemical Measurements
The photoelectrochemical properties were investigated in a conventional three-electrode cell using an electrochemical analyzer (IVIUM Technologies). The as-prepared film, a Pt net, and an Ag/AgCl electrode were used as the working, counter, and reference electrodes, respectively. The photocurrent of samples was measured in 0.1 M Na2SO4 aqueous solution under a 150 W xenon lamp (Newport). Samples were illuminated from the SE side (FTO substrate/semiconductor interface). In the open circuit voltage decay (OCVD) measurement, electrodes were placed in dark condition until the voltage became stable. A 150 W xenon lamp (Newport) was illuminated to the electrolyte–electrode (EE) side of the electrode. After the stable photovoltage was observed, the light source was turned off to obtain the photovoltage decay. The electrolyte–electrode (EE) side of each sample was exposed to intense irradiation to generate a photovoltage. The Mott–Schottky curves were measured at a certain DC potential range with an AC amplitude of 5 mV and a frequency of 1000 Hz under 0–100% illumination.
TAS Measurement
A home-built transient absorption spectrometer was used to collect TAS data. The pump source is a Bright Solutions Wedge HF 1064 nm Q-switch YAG laser, the third harmonic (355 nm) of which is used to excite the sample at a repetition rate of 200 Hz. The probe source is a Fianium SC400-PP white-light laser. Because of poor pulse-to-pulse stability of the optical output, the probe beam is split in two using a beam splitter to allow referencing. Light reflected from the beam splitter is used as a reference, and its total path-length (to the detector) is closely matched with the path-length of the transmitted beam. Both the sample and the reference beams are focused onto Si-photodetectors, and variable ND filters are used in front of both detectors to attenuate and match light intensities that are incident on the two detectors. The samples were mounted into a Harrick cell sandwiched between two 2 mm thick UV-grade CaF2 windows (Crystran), with the sample separated from the front window using a 0.2 mm spacer. Prior to each measurement, N2 was flowed through the Harrick cell for >1 h, and all samples were kept under continuous N2 flow throughout the measurement.
Acknowledgments
Q.R. acknowledges support from the UCL Dean’s prize and China CSC scholarship, and T.M. acknowledges funding from the Molecular Modelling and Materials Science CDT (EPSRC) and the Central Laser Facility (STFC). We acknowledge the financial support from the UK EPSRC (EP/N009533/1), the Royal Society-Newton Advanced Fellowship grant (NA170422 and NAF\R1\191163), and the Leverhulme Trust (RPG-2017-122).
Supporting Information Available
The Supporting Information is available free of charge at https://pubs.acs.org/doi/10.1021/jacs.9b10476.
Synthetic procedures for the synthesis of ref-g-C3N4 and def-g-C3N4; 1H and 13C solid-state NMR spectra; open circuit photovoltage decay plots fitting and analysis; and impedance plots analysis (PDF)
Author Contributions
§ Q.R. and T.M. contributed equally to this work.
The authors declare no competing financial interest.
Supplementary Material
References
- Jiang C.; Moniz S. J.; Wang A.; Zhang T.; Tang J. J. C. S. R. Photoelectrochemical devices for solar water splitting-materials and challenges. Chem. Soc. Rev. 2017, 46 (15), 4645–4660. 10.1039/C6CS00306K. [DOI] [PubMed] [Google Scholar]
- Wang Y.; Vogel A.; Sachs M.; Sprick R. S.; Wilbraham L.; Moniz S. J.; Godin R.; Zwijnenburg M. A.; Durrant J. R.; Cooper A. I. Current understanding and challenges of solar-driven hydrogen generation using polymeric photocatalysts. Nature Energy 2019, 4, 1–15. 10.1038/s41560-019-0456-5. [DOI] [Google Scholar]
- Kong D.; Zheng Y.; Kobielusz M.; Wang Y.; Bai Z.; Macyk W.; Wang X.; Tang J. Recent advances in visible light-driven water oxidation and reduction in suspension systems. Mater. Today 2018, 21 (8), 897–924. 10.1016/j.mattod.2018.04.009. [DOI] [Google Scholar]
- Liu J.; Liu Y.; Liu N.; Han Y.; Zhang X.; Huang H.; Lifshitz Y.; Lee S.-T.; Zhong J.; Kang Z. Metal-free efficient photocatalyst for stable visible water splitting via a two-electron pathway. Science 2015, 347 (6225), 970–974. 10.1126/science.aaa3145. [DOI] [PubMed] [Google Scholar]
- Martin D. J.; Qiu K.; Shevlin S. A.; Handoko A. D.; Chen X.; Guo Z.; Tang J. Highly efficient photocatalytic H2 evolution from water using visible light and structure-controlled graphitic carbon nitride. Angew. Chem., Int. Ed. 2014, 53 (35), 9240–9245. 10.1002/anie.201403375. [DOI] [PMC free article] [PubMed] [Google Scholar]
- Zheng Y.; Lin L.; Wang B.; Wang X. Graphitic carbon nitride polymers toward sustainable photoredox catalysis. Angew. Chem., Int. Ed. 2015, 54 (44), 12868–12884. 10.1002/anie.201501788. [DOI] [PubMed] [Google Scholar]
- Lau V. W. H.; Yu V. W. Z.; Ehrat F.; Borari T.; Moudrakovski I.; Simon T.; Dupple V.; Mddina E.; Stolarczyk J. K.; Feldmann J.; Blum V.; Lotsch B. V. Urea-Modified Carbon Nitrides: Enhancing Photocatalytic Hydrogen Evolution by Rational Defect Engineering. Adv. Energy Mater. 2017, 7 (12), 1602251. 10.1002/aenm.201602251. [DOI] [Google Scholar]
- Zhao G.; Pang H.; Liu G.; Li P.; Liu H.; Zhang H.; Shi L.; Ye J. Co-porphyrin/carbon nitride hybrids for improved photocatalytic CO2 reduction under visible light. Appl. Catal., B 2017, 200, 141–149. 10.1016/j.apcatb.2016.06.074. [DOI] [Google Scholar]
- Zhou Y.; Zhang L.; Wang W. Direct functionalization of methane into ethanol over copper modified polymeric carbon nitride via photocatalysis. Nat. Commun. 2019, 10 (1), 506. 10.1038/s41467-019-08454-0. [DOI] [PMC free article] [PubMed] [Google Scholar]
- Guo Y.; Li J.; Yuan Y.; Li L.; Zhang M.; Zhou C.; Lin Z. A Rapid Microwave-Assisted Thermolysis Route to Highly Crystalline Carbon Nitrides for Efficient Hydrogen Generation. Angew. Chem., Int. Ed. 2016, 55 (47), 14693–14697. 10.1002/anie.201608453. [DOI] [PubMed] [Google Scholar]
- Zhang J.; Zhang M.; Lin L.; Wang X. Sol processing of conjugated carbon nitride powders for thin-film fabrication. Angew. Chem., Int. Ed. 2015, 54 (21), 6297–6301. 10.1002/anie.201501001. [DOI] [PubMed] [Google Scholar]
- Wang J.; Zhang C.; Shen Y.; Zhou Z.; Yu J.; Li Y.; Wei W.; Liu S.; Zhang Y. Environment-friendly preparation of porous graphite-phase polymeric carbon nitride using calcium carbonate as templates, and enhanced photoelectrochemical activity. J. Mater. Chem. A 2015, 3 (9), 5126–5131. 10.1039/C4TA06778A. [DOI] [Google Scholar]
- Che W.; Cheng W.; Yao T.; Tang F.; Liu W.; Su H.; Huang Y.; Liu Q.; Liu J.; Hu F. Fast photoelectron transfer in (Cring)-C3N4 plane heterostructural nanosheets for overall water splitting. J. Am. Chem. Soc. 2017, 139 (8), 3021–3026. 10.1021/jacs.6b11878. [DOI] [PubMed] [Google Scholar]
- Han Y. Y.; Lu X. L.; Tang S. F.; Yin X. P.; Wei Z. W.; Lu T. B. Metal-Free 2D/2D Heterojunction of Graphitic Carbon Nitride/Graphdiyne for Improving the Hole Mobility of Graphitic Carbon Nitride. Adv. Energy Mater. 2018, 8 (16), 1702992. 10.1002/aenm.201702992. [DOI] [Google Scholar]
- Ruan Q.; Luo W.; Xie J.; Wang Y.; Liu X.; Bai Z.; Carmalt C. J.; Tang J. A nanojunction polymer photoelectrode for efficient charge transport and separation. Angew. Chem., Int. Ed. 2017, 56 (28), 8221–8225. 10.1002/anie.201703372. [DOI] [PMC free article] [PubMed] [Google Scholar]
- Peng G.; Albero J.; Garcia H.; Shalom M. A Water-Splitting Carbon Nitride Photoelectrochemical Cell with Efficient Charge Separation and Remarkably Low Onset Potential. Angew. Chem. 2018, 130 (48), 16033–16037. 10.1002/ange.201810225. [DOI] [PubMed] [Google Scholar]
- Peng G.; Volokh M.; Tzadikov J.; Sun J.; Shalom M. Carbon Nitride/Reduced Graphene Oxide Film with Enhanced Electron Diffusion Length: An Efficient Photo-Electrochemical Cell for Hydrogen Generation. Adv. Energy Mater. 2018, 8 (23), 1800566. 10.1002/aenm.201800566. [DOI] [Google Scholar]
- Sagara N.; Kamimura S.; Tsubota T.; Ohno T. Photoelectrochemical CO2 reduction by a p-type boron-doped g-C3N4 electrode under visible light. Appl. Catal., B 2016, 192, 193–198. 10.1016/j.apcatb.2016.03.055. [DOI] [Google Scholar]
- Zhang Y.; Schnepp Z.; Cao J.; Ouyang S.; Li Y.; Ye J.; Liu S. Biopolymer-activated graphitic carbon nitride towards a sustainable photocathode material. Sci. Rep. 2013, 3, 2163. 10.1038/srep02163. [DOI] [PMC free article] [PubMed] [Google Scholar]
- Ruan Q.; Luo W.; Xie J.; Wang Y.; Liu X.; Bai Z.; Carmalt C. J.; Tang J. J. A. C. I. E. A nanojunction polymer photoelectrode for efficient charge transport and separation. Angew. Chem., Int. Ed. 2017, 56 (28), 8221–8225. 10.1002/anie.201703372. [DOI] [PMC free article] [PubMed] [Google Scholar]
- Lau V. W.-h.; Moudrakovski I.; Botari T.; Weinberger S.; Mesch M. B.; Duppel V.; Senker J.; Blum V.; Lotsch B. V. Rational design of carbon nitride photocatalysts by identification of cyanamide defects as catalytically relevant sites. Nat. Commun. 2016, 7, 12165. 10.1038/ncomms12165. [DOI] [PMC free article] [PubMed] [Google Scholar]
- Lau V. W. h.; Klose D.; Kasap H.; Podjaski F.; Pignié M. C.; Reisner E.; Jeschke G.; Lotsch B. V. Dark Photocatalysis: Storage of Solar Energy in Carbon Nitride for Time-Delayed Hydrogen Generation. Angew. Chem., Int. Ed. 2017, 56 (2), 510–514. 10.1002/anie.201608553. [DOI] [PMC free article] [PubMed] [Google Scholar]
- Godin R.; Wang Y.; Zwijnenburg M. A.; Tang J.; Durrant J. R. Time-resolved spectroscopic investigation of charge trapping in carbon nitrides photocatalysts for hydrogen generation. J. Am. Chem. Soc. 2017, 139 (14), 5216–5224. 10.1021/jacs.7b01547. [DOI] [PubMed] [Google Scholar]
- Kuriki R.; Matsunaga H.; Nakashima T.; Wada K.; Yamakata A.; Ishitani O.; Maeda K. Nature-inspired, highly durable CO2 reduction system consisting of a binuclear ruthenium (II) complex and an organic semiconductor using visible light. J. Am. Chem. Soc. 2016, 138 (15), 5159–5170. 10.1021/jacs.6b01997. [DOI] [PubMed] [Google Scholar]
- Sun B.-w.; Yu H.-y.; Yang Y.-j.; Li H.-j.; Zhai C.-y.; Qian D.-J.; Chen M. New complete assignment of X-ray powder diffraction patterns in graphitic carbon nitride using discrete Fourier transform and direct experimental evidence. Phys. Chem. Chem. Phys. 2017, 19 (38), 26072–26084. 10.1039/C7CP05242A. [DOI] [PubMed] [Google Scholar]
- Ruan Q.; Bayazit M.; Kiran V.; Xie J.; Tang J. Key Factors affecting Photoelectrochemical Performance of g-C3N4 polymer films. Chem. Commun. 2019, 55 (50), 7191–7194. 10.1039/C9CC03084K. [DOI] [PubMed] [Google Scholar]
- Zhang Q.; Chen P.; Tan C.; Chen T.; Zhuo M.; Xie Z.; Wang F.; Liu H.; Cai Z.; Liu G. A photocatalytic degradation strategy of PPCPs by a heptazine-based CN organic polymer (OCN) under visible light. Environ. Sci.: Nano 2018, 5 (10), 2325–2336. 10.1039/C8EN00608C. [DOI] [Google Scholar]
- Tang J.; Durrant J. R.; Klug D. R. Mechanism of photocatalytic water splitting in TiO2. Reaction of water with photoholes, importance of charge carrier dynamics, and evidence for four-hole chemistry. J. Am. Chem. Soc. 2008, 130 (42), 13885–13891. 10.1021/ja8034637. [DOI] [PubMed] [Google Scholar]
- Van de Krol R.; Grätzel M.. Photoelectrochemical Hydrogen Production; Springer: New York, 2012; Vol. 90. [Google Scholar]
- Allongue P.; Cachet H. Band-Edge Shift and Surface Charges at Illuminated n-GaAs/Aqueous Electrolyte Junctions Surface-State Analysis and Simulation of Their Occupation Rate. J. Electrochem. Soc. 1985, 132 (1), 45–52. 10.1149/1.2113788. [DOI] [Google Scholar]
- Yang Y.; Liu G.; Irvine J. T.; Cheng H. M. Enhanced photocatalytic H2 production in core-shell engineered rutile TiO2. Adv. Mater. 2016, 28 (28), 5850–5856. 10.1002/adma.201600495. [DOI] [PubMed] [Google Scholar]
- Klahr B.; Gimenez S.; Fabregat-Santiago F.; Hamann T.; Bisquert J. Water oxidation at hematite photoelectrodes: the role of surface states. J. Am. Chem. Soc. 2012, 134 (9), 4294–4302. 10.1021/ja210755h. [DOI] [PubMed] [Google Scholar]
- Ye C.; Li J.-X.; Li Z.-J.; Li X.-B.; Fan X.-B.; Zhang L.-P.; Chen B.; Tung C.-H.; Wu L.-Z. Enhanced driving force and charge separation efficiency of protonated g-C3N4 for photocatalytic O2 evolution. ACS Catal. 2015, 5 (11), 6973–6979. 10.1021/acscatal.5b02185. [DOI] [Google Scholar]
- Merschjann C.; Tschierlei S.; Tyborski T.; Kailasam K.; Orthmann S.; Hollmann D.; Schedel-Niedrig T.; Thomas A.; Lochbrunner S. Complementing graphenes: 1D interplanar charge transport in polymeric graphitic carbon nitrides. Adv. Mater. 2015, 27 (48), 7993–7999. 10.1002/adma.201503448. [DOI] [PubMed] [Google Scholar]
- Walsh J. J.; Jiang C.; Tang J.; Cowan A. J. Photochemical CO 2 reduction using structurally controlled gC 3 N 4. Phys. Chem. Chem. Phys. 2016, 18 (36), 24825–24829. 10.1039/C6CP04525A. [DOI] [PubMed] [Google Scholar]
- Merschjann C.; Tschierlei S.; Tyborski T.; Kailasam K.; Orthmann S.; Hollmann D.; Schedel-Niedrig T.; Thomas A.; Lochbrunner S. J. A. M. Complementing graphenes: 1D interplanar charge transport in polymeric graphitic carbon nitrides. Adv. Mater. 2015, 27 (48), 7993–7999. 10.1002/adma.201503448. [DOI] [PubMed] [Google Scholar]
- Xu J.; Li D.; Chen Y.; Tan L.; Kou B.; Wan F.; Jiang W.; Li F. Constructing sheet-on-sheet structured graphitic carbon nitride/reduced graphene oxide/layered MnO2 ternary nanocomposite with outstanding catalytic properties on thermal decomposition of ammonium Perchlorate. Nanomaterials 2017, 7 (12), 450. 10.3390/nano7120450. [DOI] [PMC free article] [PubMed] [Google Scholar]
Associated Data
This section collects any data citations, data availability statements, or supplementary materials included in this article.


