

Abstract
Computational and experimental high-throughput screening are frequently used to discover new leads for drug design. Although novel ligands have been identified by these methods, it has become clear that screening hit lists are plagued by false positives. These nuisance compounds are ultimately found to be developmental dead-ends and are abandoned, often after considerable effort has been invested in them. Much work over the last decade has been devoted to exploring the origins of false-positive screening hits, and ligand promiscuity has emerged as one such cause. Well-known mechanisms of promiscuity include reactive species and privileged substructures. More recently, it has been found that some nonspecific screening hits form aggregates of 30–1000 nm in diameter. It has been proposed that these aggregate particles are responsible for the promiscuous behavior of many false positives and that aggregate-forming compounds may be widespread among screening hits. This chapter will review the known mechanisms of ligand promiscuity with an emphasis on the recently described model of aggregation. Experimental and computational methods for identifying promiscuous compounds will be described, and some outstanding questions in the field will be considered.
2.18.1. Introduction
Virtual and experimental high-throughput screening (HTS) are widely used to identify novel ligands for drug development.1, 2, 3, 4 Despite their successes, these methods are haunted by false positives, compounds that initially appear to have a desired biological activity but on closer evaluation are found to act by spurious mechanisms. Often, these counterfeit screening hits have peculiar behaviors that cannot be reconciled with canonical modes of inhibition. These compounds are ultimately found to be developmental dead-ends and are discarded, typically after a great deal of time and resources has been devoted to them.
The frustration caused by such molecules is compounded by their prevalence; it has been estimated that in any given experimental HTS, the ratio of false positives to true positives is at best 1:1 and more likely 10:1.5 This enrichment of phony inhibitors has led to increased scrutiny of hit lists and an increased interest in developing filters and counterscreens to rapidly recognize and eliminate ‘non-lead-like’ compounds from further consideration.6, 7, 8, 9, 10, 11
Toward this end, work over the last decade has been devoted to understanding the origins of false-positive screening hits. Experimental artifact, such as compound impurity12 or assay interference,7, 13 is a well-known cause. Inhibitor promiscuity due to reactive groups14, 15 or privileged scaffolds16, 17, 18, 19, 20, 21, 22 has also been described. More recently, aggregate formation has emerged as a potential mechanism of promiscuous inhibition.23, 24 This model proposes that some nonspecific inhibitors form aggregates in solution and that the aggregate species is responsible for enzyme inhibition (Figure 1 ). Preliminary studies suggest that aggregate-forming promiscuous compounds may be common among screening libraries and hit lists. This chapter will initially focus on nonspecific enzyme inhibition as caused by aggregate-forming molecules and will review experimental methods for the identification of such compounds. Computational algorithms for the prediction of all types of promiscuous inhibitors will then be discussed and outstanding questions regarding promiscuous inhibitors in drug discovery will be considered.
Figure 1.

Model of promiscuous enzyme inhibition. The promiscuous compounds form aggregates in solution and enzyme molecules (white arrows) adsorb onto the surface of the aggregate particle, resulting in enzyme inhibition. Although initial microscopy images suggest surface adsorption of enzyme molecules, absorption of enzyme into the aggregate interior cannot be excluded. (Reprinted with permission from McGovern, S. L.; Caselli, E.; Grigorieff, N.; Shoichet, B. K. J. Med. Chem.2002, 45, 1712–1722. Copyright (2002) American Chemical Society; from McGovern, S. L.; Helfand, B. T.; Feng, B.; Shoichet, B. K. J. Med. Chem.2003, 46, 4265–4272. Copyright (2003) American Chemical Society.)
2.18.2. Promiscuous Inhibition by Aggregate-Forming Compounds
By the late 1990s, experimental and virtual HTS were commonly used to identify new leads for drug design. Although various screening techniques and algorithms had been developed, it became apparent that the output from these large-scale methods was suboptimal. Hit lists were populated, if not dominated, by nonspecific compounds with peculiar properties, such as steep inhibition curves, flat structure–activity relationships (SARs), and complex time-dependent behavior. Despite the use of filters for reactivity,14 chemical swill,11 and druglikeness,25 problematic molecules continued to appear on screening hit lists. These compounds caused much frustration and were often abandoned after significant effort had been invested in them.
To explore the underlying mechanism responsible for this perplexing behavior, 115 compounds were initially investigated. This included 45 screening hits,23, 24 15 leads used as experimental tools,26 and 55 clinically prescribed drugs.27 Of the 115 compounds studied, 53 were found to inhibit diverse model enzymes, including β-lactamase, chymotrypsin, dihydrofolate reductase, and β-galactosidase. These promiscuous compounds showed time-dependent inhibition that was sensitive to enzyme concentration, the presence of bovine serum albumin (BSA), and ionic strength. Based on these observations, it was hypothesized that the nonspecific compounds formed aggregates in solution, and the aggregate particles caused enzyme inhibition (Figure 1).23 Consistent with this hypothesis, dynamic light scattering (DLS) and transmission electron microscopy revealed that the promiscuous compounds formed particles on the order of 30–1000 nm in diameter; these particles were absent from solutions of nonpromiscuous compounds.23
How did the aggregate particles interact with enzyme molecules to cause inhibition?24 Centrifugation experiments suggested a direct interaction between aggregate-forming inhibitors and enzyme molecules; this interaction was disrupted by the addition of detergent such as Triton X-100.24 Aggregate formation and enzyme inhibition by the promiscuous compounds were also prevented or rapidly reversed by the addition of Triton X-100.24 Additional microscopy studies showed that protein molecules were adsorbed onto the surface of the aggregate particles, although absorption into the aggregate interior could not be excluded. This interaction was also prevented by the addition of detergent such as Triton X-100.24 To account for these observations, it was proposed that some promiscuous compounds form aggregates in solution and enzyme molecules adsorb onto the surface of the aggregate particle, resulting in reversible enzyme inhibition (Figure 1).24
Since the first proposal of this model, a growing number of research groups have identified potential aggregate-based inhibitors among their screening hits (Table 1 ). Their observations, in addition to the initial, small-scale evaluation of the prevalence of aggregators suggest that they occur among screening hits,23, 28, 29, 30, 31 small-molecule reagents used in the lab,26 and, surprisingly, even clinically used drugs.27, 32 A recent study evaluating 1030 random druglike molecules suggests that up to 19% show experimental signatures of aggregate-based promiscuity.33 Because of the potentially widespread occurrence of aggregate formers, there is much interest in the development of rapid experimental methods for the identification of these promiscuous compounds. There has also been a growing interest in the development of computational models to predict compounds likely to act as aggregate formers because such filters could be used to remove suspect molecules from screening libraries or from hit lists. These experimental and computational efforts are considered in turn in the following sections.
Table 1.
Promiscuous compounds from virtual and high-throughput screening
| Structure | Type of screen | IC50 (μM) versus target | Experimental evidence for promiscuity | Reference |
|---|---|---|---|---|
 |
Virtual screen | 5 β-Lactamase | • Decreased inhibition with detergent | 23, 24 |
| • Decreased inhibition with increased enzyme concentration | ||||
| • Inhibition of diverse enzymes | ||||
| • Time-dependent inhibition | ||||
| • Particles observed by DLS | ||||
 a a
|
Virtual screen | 5 PMM/PGMb | • Decreased inhibition with detergent | 28 |
| • Decreased inhibition with increased enzyme concentration | ||||
| • Time-dependent inhibition | ||||
| • Particles observed by DLS | ||||
 |
Virtual screen | 25 Edema factor | • Decreased inhibition with increased enzyme concentration | 29 |
| • Time-dependent inhibition | ||||
 |
Cell-based HTS | NDc EF-CaM | • Inhibition of diverse enzymes | 31 |
| FRET-based HTS | 7.4 Coronavirus proteinase | • Decreased inhibition with BSA | 30 | |
 |
Phase II clinical triald | 1.6 PTP1b | • Decreased inhibition with detergent | 32 |
| • Decreased inhibition with increased enzyme concentration | ||||
| • Time-dependent inhibition |
Disperse Blue.
PMM/PGM, phosphomannomutase/phosphoglucomutase.
Not determined, compound observed to inhibit edema toxin-induced change in cellular morphology.
The compound, ertiprotafib, had been studied in phase II trials prior to evaluation for promiscuity.32
2.18.3. Experimental Identification of Promiscuous Inhibitors
The peculiar experimental signature of aggregate-forming compounds can be used to distinguish them from specific, well-behaved inhibitors,23, 24, 28 and several research groups have used these characteristics to triage their screening hits for potential promiscuity.12, 28, 29, 30, 31, 34, 35, 36, 37, 38, 39, 40, 41, 42 The appropriate experiments range in complexity and intensity from a rapid biochemical assay to a much more laborious microscopy study. Depending on the purposes of the research effort, these experiments can be tailored appropriately. For most early-stage discovery programs, the following experiments are performed to answer the question: Is this hit likely inhibiting the screening target as an aggregate? If the answer is yes, it is unlikely that the hit will be a favorable starting point for lead design and it should be dropped from further consideration immediately, as the pain of throwing out compounds early in the process pales in comparison to the agony of abandoning leads that have been through several nonproductive development cycles. If the answer to the above question is no, then one element of the hit's potential has been reassuringly established. The necessary experiments and examples of their recent application in drug discovery projects are described below; detailed recipes for performing these assays have been described elsewhere.43
2.18.3.1. Biochemical Assays for Promiscuity
Fortunately for screening programs faced with evaluation of tens to thousands of hits, the most informative experiments are among the easiest to perform and are the most amenable to high-throughput methods. Often, the experimental assay that initially identified the screening hit can be easily modified to accomplish many of the initial tests of promiscuity. Additionally, these protocols can be used to assay for other mechanisms of promiscuity, such as chemical reactivity. If the original assay lacks sufficient dynamic range or is otherwise difficult to alter, it may be simpler to use easily purchased model enzyme systems such as chymotrypsin or β-lactamase. Colorimetric, kinetic assays have proven to be especially robust for these purposes.
The particular components of the assay can affect the outcome. For instance, the ionic strength23 and pH44 of the buffer can alter the aggregation and inhibition properties of the compounds; 50 mM potassium phosphate, pH 7.0, has previously been found useful. Increased enzyme concentration23 or the presence of excess protein such as albumin23, 30 can decrease the apparent inhibition by aggregators; a starting enzyme concentration of 1–10 nM is typical. Ideally, solutions of inhibitors and substrate are prepared from fresh buffer or dimethyl sulfoxide (DMSO) stocks and diluted into buffer so that the final DMSO concentration in the assay is as low as possible, preferably less than 5%. Substrate concentrations are typically greater than the K m for the reaction to allow for maximal velocities.
2.18.3.1.1. Detergent sensitivity
In the presence of detergents such as Triton X-100, inhibition by aggregate-forming inhibitors is markedly attenuated. For instance, the inhibition of β-lactamase by a 3 μM solution of tetraiodophenolphthalein (I4PTH), a prototypical aggregator, decreases from 78% in the absence of detergent to 3% in the presence of 0.01% Triton X-100.24 Indeed, Triton X-100 rapidly reverses inhibition of β-lactamase by I4PTH without affecting a specific, well-behaved inhibitor of the enzyme (Figure 2 ).
Figure 2.
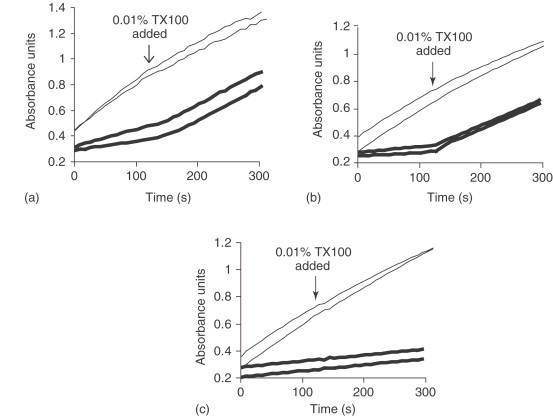
The effect of 0.01% Triton X-100 added during a β-lactamase inhibition assay. (a) Inhibitor is 10 μM I4PTH. (b) Inhibitor is 5 μM rottlerin. (c) Inhibitor is 0.6 μM BZBTH2B, a specific β-lactamase inhibitor.59 In all panels, thick lines (—) denote reactions containing inhibitor and thin lines (—) denote reactions containing DMSO control. TX100, Triton X-100. (Reprinted with permission from McGovern, S. L.; Helfand, B. T.; Feng, B.; Shoichet, B. K. J. Med. Chem.2003, 46, 4265–4272. Copyright (2003) American Chemical Society.)
To date, detergent sensitivity is the easiest way to discriminate between aggregators and nonaggregators.24, 45 Therefore, the most rapid method of identifying aggregate-based inhibitors is to repeat the screening assay with the addition of 0.01% Triton X-100. A typical protocol consists of incubating fresh detergent, inhibitor at the IC50 (concentration of inhibitor that reduces enzyme activity by 50%), and enzyme for 5 min and initiating the reaction with substrate.24, 43, 45 If inhibition is due to aggregation, inhibition should decrease from 50% to less than 40% in the presence of detergent. It may also be useful to consider adding 0.01% Triton X-100 to the baseline assay buffer as a prophylactic measure to prevent aggregate-forming compounds from appearing as inhibitors at all.
The first control for this experiment requires establishing that the addition of Triton X-100 does not significantly affect the reaction rate or any of the other assay components. A negative control experiment will show that a well-behaved inhibitor of the system is not affected by the detergent, and a positive control will show that a known aggregator, such as I4PTH,23 is attenuated by the detergent.
It is worth noting the discussion in this chapter emphasizes the use of Triton X-100, as it has been shown to reverse enzyme inhibition by aggregators (Figure 2).24 Other detergents have been employed as agents to study promiscuity, such as saponin,27, 38 Tween-20,45 and CHAPS.34, 45
Because of its relative simplicity, detergent sensitivity has been used in a growing number of drug discovery projects to triage compounds for promiscuity (Table 1).28, 34, 35, 36, 38, 39 For instance, using a library of 147 compounds derived from the Cdc25A phosphatase inhibitor dysidiolide, Koch and co-workers found selective inhibitors of three enzymes that were structurally similar to Cdc25A. All of the library compounds were assayed against each target enzyme in the presence and absence of 0.001 or 0.01% Triton X-100 to ultimately identify the specific inhibitors.35 Detergents have also been used to study the inhibition of PTP1b by ertiprotafib, a compound that had reached phase II clinical trials (Table 1).32 The IC50 of ertiprotafib against 1 nM PTP1b increased 10-fold with the addition of 0.01% Triton X-100. This observation, in combination with other properties of the compound,32 was consistent with an aggregate-based mechanism of inhibition.
2.18.3.1.2. Sensitivity to enzyme concentration
The key observation leading to the development of the aggregate hypothesis was that the promiscuous inhibitors were sensitive to the concentration of enzyme. For instance, a 10-fold increase in the concentration of β-lactamase from 1 to 10 nM was sufficient to increase the IC50 of 35 aggregate-forming compounds by 3- to over 50-fold, even when the inhibitor was present at micromolar concentrations.23 The ability of nanomolar enzyme to titrate micromolar inhibitor suggested that the active form of the inhibitor might be an aggregate of many individual inhibitor molecules; although the ratio of individual inhibitor molecules to enzyme molecules might be 1000:1 or greater, the ratio of aggregate particles to enzyme molecules would be much lower.
To evaluate screening hits for this property, the concentration of the target enzyme is increased 10-fold and the assay is repeated with the inhibitor at the IC50 obtained at the baseline enzyme concentration. If aggregate formation is involved, inhibition ought to decrease from 50% to less than 40% against the 10-fold greater concentration of enzyme. This assay requires that the ratio of inhibitor to enzyme remains elevated, on the order of 1000:1 or greater, even after the enzyme concentration has been increased. Many assays may not be able to tolerate increases in enzyme concentration due to cost, limited reagent availability, or an increased reaction rate that makes it technically difficult to obtain accurate velocity measurements. In such cases, it may be helpful to decrease the initial assay concentration of the enzyme or to use alternative substrates with slower reaction rates.23
As in the detergent assay described above, a well-behaved inhibitor should not be affected by the increase in enzyme concentration and can serve as a negative control.23 A known aggregator that has been shown to be sensitive to enzyme concentration should be used as a positive control.23, 26, 27
This protocol has also been used by several research groups to evaluate screening hits.13, 28, 36, 37 For example, Disperse Blue against 3.3 μg mL−1 phosphomannomutase/phosphoglucomutase (PMM/PGM) had an IC50 of 5 μM; when the enzyme concentration was increased to 33 μg mL−1, the compound did not show any detectable inhibition up to 10 μM.28 Similarly, the IC50 of ertiprotafib against PTP1b increased from 1.6 to 9 μM as the concentration of the enzyme increased from 10 to 100 nM.32
The inclusion of BSA also decreases the potency of aggregate-based inhibitors through a similar mechanism to increasing the enzyme concentration, except enzyme molecules are displaced from inhibitor particles by inert protein instead of active enzyme.23 Consequently, addition of BSA to screening assays has been used to accomplish the equivalent purpose; for examples, see30, 36 and Table 1.
2.18.3.1.3. Inhibition of diverse model enzymes
One of the earliest warning signs leading to the discovery of aggregators was their ability to inhibit dissimilar targets.23 For example, rottlerin, a widely used kinase inhibitor,46 has an IC50 of 3 μM against PKCδ, 1.2 μM against β-lactamase, 2.5 μM against chymotrypsin, and 0.7 μM against malate dehydrogenase.26 It has since become clear that aggregators can inhibit a variety of enzymes, ranging from β-lactamase (40 kDa monomer) to β-galactosidase (540 kDa tetramer).23
Ideally, for each screening hit under consideration, at least one counterscreen is performed against an enzyme that is unrelated to the target enzyme in terms of structure, function, and ligand recognition. Depending on the level of certainty required, testing against one dissimilar enzyme may be sufficient; testing against two or more provides additional reassurance. Screening across receptors also allows for investigation of other mechanisms of promiscuity, such as chemical reactivity or privileged scaffolds; nonspecific inhibition from any mechanism may be sufficient to drop the compound from further optimization studies.
For secondary screening to be practical, an experimentally robust system with readily available components and a straightforward assay readout should be used. Beta-lactamase, chymoptrypsin, and malate dehydrogenase have been used successfully in the past.26, 27, 29, 31, 45 It may be more convenient to use enzymes already known to the research group; for instance, Fattorusso and colleagues assayed a novel caspase inhibitor discovered in a combination NMR and computational screening project against a metalloprotease that was also under investigation in their laboratory.37
Control experiments for these assays are straightforward. Specific inhibitors of the target enzyme and the enzymes used for counterscreening should not cross-react. For the positive control experiment, a known aggregator should be shown to inhibit each enzyme under study.
In practice, hits are often tested against related enzymes to evaluate for specificity within a protein class or across species.46 For instance, Blanchard and co-workers used HTS of 50 000 compounds to identify novel coronavirus proteinase inhibitors. After a series of filters, the 572 hits yielded five compounds with IC50 values of 0.5–7 μM for the target, and two of those compounds inhibited coronavirus protease but not four other proteases.30 Baldwin and colleagues screened a 220 000 compound library to find novel inhibitors of dihydroorotate dehydrogenase from Plasmodium falciparum; follow-up screens identified a competitive inhibitor with an IC50 of 16 nM against the parasite enzyme and 200 μM against the human isozyme.12 These approaches have been extended by recent technological developments that allow for testing compounds against multiple enzymes in parallel. For instance, proteomics-based methods47, 48 and enzyme microarrays49 have been described. These techniques provide an evaluation of inhibitor specificity against several enzymes simultaneously; future developments along these lines can be expected.
2.18.3.1.4. Time-dependent inhibition
Preincubation of aggregate-based inhibitors with enzyme increases the apparent IC50 of the compounds 2- to over 50-fold.23, 26, 27 Several mechanisms could account for this observation, such as slow on-rates or covalent binding. To explore the origin of time-dependent behavior by aggregators, Tipton's group conducted a thorough analysis of the kinetic behavior of Disperse Blue.28 Their results suggested that slow-binding did not occur when this compound interacted with its target enzyme, PMM/PGM. Instead, they found that the compound behaved as a parabolic, noncompetitive inhibitor, and they proposed that the kinetic signature of time-dependent inhibition with a nonlinear dependence on inhibitor concentration may be a marker for aggregation.28 Future studies to evaluate the generalization of this observation are certainly anticipated. In the meantime, it should be noted that time-dependent inhibition is consistent with several modes of enzyme inhibition and is not singularly sufficient to denote a compound as an aggregator.
In a typical test for time dependence, an IC50 is determined by incubating enzyme with inhibitor for 5 min and initiating the reaction with substrate. The assay is then repeated, except substrate is first mixed with the inhibitor at the IC50 concentration and the reaction is initiated by the addition of enzyme. If inhibition without incubation decreases from 50% to less than 40%, the result is consistent with the time-dependent behavior observed of aggregators. Control experiments include repeating the assay with a specific, nontime-dependent inhibitor of the target enzyme as well as a known aggregator. These protocols are usually performed in conjunction with other assays to evaluate inhibitor behavior (e.g., see32).
2.18.3.1.5. Steep inhibition curves
It has been observed that steep inhibition curves are often associated with undesirable screening hits.50 This experimental property has been used as a filter to triage compounds; for example, in their search for coronavirus inhibitors, Blanchard and co-workers eliminated 54 of 126 compounds because they did not have a sigmoidal semilogarithmic dose–response curve.30 Aggregate-forming inhibitors have also been shown to have a steep inhibition curve relative to classically behaved inhibitors,26 although mechanistic understanding of this experimental observation awaits further study.
2.18.3.2. Light Scattering
The biochemical experiments described above provide phenomenological support for the identification of an aggregate-based inhibitor, but they do not yield direct evidence for the presence of aggregate particles. To obtain such data, a biophysical method such as DLS is necessary. DLS has a growing number of applications in the biological and material sciences, but this discussion will focus on the use of DLS to determine if particles are present in a solution of a promiscuous inhibitor and, if so, what is their size? In conjunction with the assays previously described, DLS completes the series of experiments typically needed to characterize a promiscuous, aggregate-based inhibitor.
DLS is most commonly used to analyze particles with a diameter of 1–1000 nm. In a standard setup, a sample of the solution under study is placed in a chamber and exposed to a laser. Particles in the sample cause the laser light to scatter. A detector at a fixed angle relative to the chamber records the scattered photons over a period of time, usually tens of seconds to minutes. Because particles in the sample undergo Brownian motion, the intensity of the scattered light measured by the detector will fluctuate, typically on the microsecond timescale. These fluctuations reflect the rate of diffusion by the particle in solution, which in turn depends on the hydrodynamic radius of the particle according to the Stokes–Einstein equation. The necessary calculations are performed by software provided with the DLS instrument, and given certain assumptions about particle shape and distribution, the hydrodynamic radius can be used as a measure of particle size. This is only a brief explanation of the method; for more details on the theory and practice of DLS, see descriptions by Santos51 and Wyatt.52
For analysis of a promiscuous inhibitor, the first task is to determine if particles are present. Graphically, this can be determined from the shape of the autocorrelation function obtained during the DLS experiment. For instance, rottlerin is a known promiscuous, aggregate-forming inhibitor,26 and it yields an autocorrelation function with well-defined decay on the microsecond timescale as shown in Figure 3a . The same is true for K-252c, another promiscuous kinase inhibitor (Figure 3b). Surprisingly, suramin, a compound that is known to inhibit multiple targets, produces an autocorrelation function with a poorly defined decay, suggesting that it does not form aggregates in solution (Figure 3c).26
Figure 3.
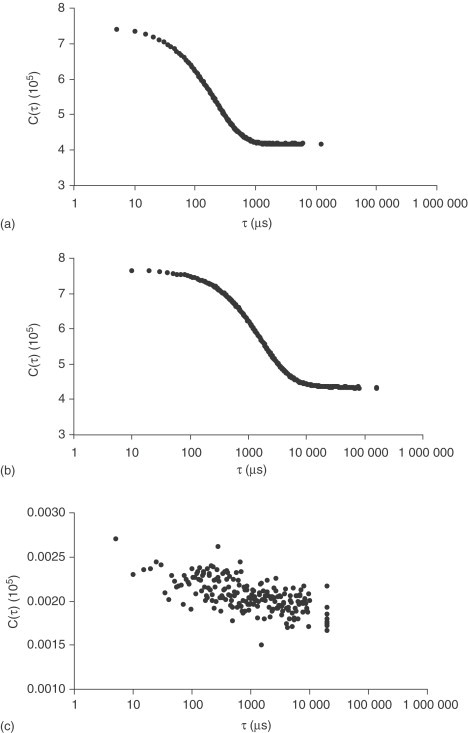
Representative autocorrelation functions from DLS experiments. (a) 15 μM rottlerin, (b) 10 μM K-252c, and (c) 400 μM suramin. (Reproduced with permission from McGovern, S. L.; Shoichet, B. K. J. Med. Chem.2003, 46, 1478–1483. Copyright 2003 American Chemical Society.)
Additionally, it is useful to note the average intensity of the scattered light at the detector during the experiment. This is usually reported as counts per second (cps) or kilocounts per second (kps). The absolute value of the intensity will depend on the particular instrument used, but solutions that are known to be particle free, such as filtered water, should yield average intensities at least an order of magnitude less than that of solutions known to contain particles, such as latex beads or albumin. Therefore, it is worthwhile to conduct both positive and negative control experiments to evaluate the signal-to-noise ratio of the instrument.
If particles are present, the next step is to determine their size. Typically, this is calculated by software that accompanies the instrument. Results between different algorithms, even in the same software package, can vary markedly based on assumptions about particle shape. Again, it is worthwhile to test the system using particles of known size, such as latex bead standards or albumin.
More recent developments in DLS technology allow for coupling of DLS with a high-performance liquid chromatography (HPLC) column to provide rapid eluent analysis. Of particular interest for screening purposes, at least two companies (Wyatt Technology Corporation and Precision Detectors, Inc.) have developed high-throughput DLS, increasing the number of compounds that can be studied by this method.
A growing number of research groups have incorporated DLS into their evaluation of hit or lead compounds. For instance, Klebe's group used DLS to rule out aggregation as a contributor to the inhibition of tRNA-guanine transglycosylase by several hits identified in a FlexX-based screen.40 Similarly, Wang and co-workers used light scattering to rule out aggregation as contributor to the activity of a novel non-nucleoside reverse transcriptase inhibitor (NNRTI).39 The technique has also been used to confirm the presence of particles in solutions of suspected promiscuous inhibitors. Soelaiman and colleagues used DOCK to identify new inhibitors of edema factor, a toxin secreted by Bacillus anthracis. Three active compounds were evaluated by DLS, and one was found to form particles greater than 1000 nm in diameter.29 Tipton's group also used DLS in their analysis of Disperse Blue; at 10 μM, the compound was observed to form particles with a mean radius of 43.4 nm and average scattering intensity of 92.4 kcps.28
DLS has also been used to explore the factors influencing aggregation by small molecules. In a report from Arnold's group, 15 diaryltriazine and diarylpyrimidine NNRTIs were studied by DLS to evaluate the effect of pH and compound concentration on aggregate size.44 All of the compounds were found to form particles in solution. For three compounds studied in detail, aggregate size increased as the pH increased from 1.5 to 6.5. Aggregate size was also found to increase as the inhibitor concentration increased from 0.001 to 10 mM. Intriguingly, compounds with particle radii of 30–110 nm had more favorable absorption than compounds with radii greater than 250 nm, and it was proposed that the systemic adsorption of the drugs depended on the formation of appropriately sized aggregates.44
2.18.3.3. Microscopy
Confocal fluorescence and transmission electron microscopy have been used to visualize small molecule aggregates and to explore the interaction of these particles with protein.23, 24, 44 Low-resolution imaging has been obtained by confocal study of green fluorescent protein (GFP) in the presence of I4PTH aggregates.24 Initial images obtained by this method suggest that the inhibitor aggregates cause GFP to accumulate in clusters; these clusters dissolve upon addition of Triton X-100 (Figure 4 ). Notably, GFP retains its fluorescence signal in the presence of I4PTH, suggesting that the protein is not denatured by the aggregates (Figure 4b). Higher resolution imaging of similar solutions of β-galactosidase and I4PTH obtained by transmission electron microscopy show that the protein adsorbs onto the surface of the inhibitor aggregate (Figure 4e), and with the addition of detergent, this interaction is prevented (Figure 4f). These observations, in combination with biochemical and biophysical studies, suggest that enzyme is adsorbed onto the surface of the aggregate particles and thereby inhibited, although absorption into the aggregate interior cannot be excluded.24 Furthermore, the interaction between aggregate and enzyme can be prevented or reversed by the addition of Triton X-100.24
Figure 4.
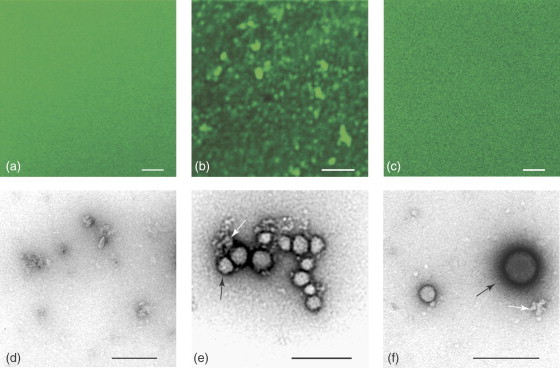
Visualization of I4PTH aggregates and GFP molecules by confocal fluorescence microscopy (a–c) and TEM (d–f). (a) 0.33 mg mL−1 GFP alone. (b) 0.25 mg mL−1 GFP with 500 μM I4PTH. (c) 0.25 mg mL−1 GFP with 500 μM I4PTH and 0.0075% Triton X-100. (d) 0.5 mg mL−1 GFP alone. (e) 0.1 mg mL−1 GFP with 100 μM I4PTH. (f) 0.1 mg mL−1 GFP with 100 μM I4PTH and 0.001% Triton X-100. Representative I4PTH aggregates are marked with black arrows, GFP molecules with white arrows. Bar=5 μm in panels a–c; bar=200 nm in panels d–f. (Reprinted with permission from McGovern, S. L.; Helfand, B. T.; Feng, B.; Shoichet, B. K. J. Med. Chem.2003, 46, 4265–4272. Copyright (2003) American Chemical Society.)
Electron microscopy is an intensive process not typically amenable to screening, although there has been at least one report of a research program using transmission electron microscopy to evaluate a novel drug lead for aggregation.39 The technique was also used to visualize aggregates formed by NNRTIs studied by Arnold's group; although these compounds were not considered promiscuous, aggregate formation was suggested to mediate bioavailability of the drugs.44
2.18.3.4. Additional Confirmation Assays
Beyond the experiments described above, there are several tests one could consider performing to evaluate screening hits for peculiar behavior. Most simply, the original assay could be repeated under exactly the same conditions to evaluate for trivial experimental errors.13 More rigorously, it has been proposed that when the same compound library is screened against the same target in three different assay protocols, the agreement between assays is only 35%.1 Consequently, it may be useful to design an alternative assay protocol for the target and then rescreen the entire library or, less laboriously, only the initial hits with the alternative format.13
Depending on the particular screening protocol used, it may be informative to test the compound set for interference with the assay readout. For instance, Jenkins and colleagues used a fluorescence-based HTS to identify angiogenin inhibitors.13 The initial set of hits was re-plated with activated fluorescent substrate to evaluate the hits for interference with the fluorescent readout; strikingly, 73% of the hits were found to interfere.13
Screening for chemical reactivity may also be productive. The ability of the same screening hit to inhibit diverse receptors, as described above, may be the first sign of reactivity. Time-dependent behavior may also suggest an irreversible reaction. More directly, some authors have found it useful to repeat the screening assay in the presence of dithiothreitol (DTT) to evaluate hits for thiol reactivity.15, 30 Alternatively, mass spectrometry (MS) has been used to evaluate compounds for adduct formation.15
Less glamorously but no less importantly, it is often useful to evaluate the purity of screening hits because the observed activity may be due to a contaminant. A variety of approaches are possible; most simply, a new solution of the compound can be prepared from fresh powder or with powder from a different lot.15 Alternatively, the compound can be repurified and then reassayed.15 For a more rigorous analysis, HPLC or MS can be employed to detect impurities.12
2.18.4. Computational Prediction of Promiscuous Compounds
Given the expense of experimental work and the desire to minimize efforts spent on false positives, there is a considerable interest in the development of computational methods to predict compounds likely to behave promiscuously. Since Lipinski's seminal work showed that 90% of drugs share a common set of easily identified properties,25 there has been much effort devoted to predicting druglike behavior based on chemical structure. The following section will review recent computational approaches for identifying various classes of promiscuous compounds.
2.18.4.1. Frequent Hitters
As defined by the Roche group, ‘frequent hitters’ are compounds that appear as actives in multiple screening projects, across a range of targets.53 These include reactive species, compounds that interfere with the assay, and privileged scaffolds. To predict compounds likely to act as frequent hitters, Roche and colleagues first developed a database of known frequent hitters. These compounds were culled from compounds that had hit in at least eight different HTS assays, compounds from an in-house depository that had been requested by at least six different discovery projects, and additional compounds from various sites within Roche.53 Eleven teams of medicinal chemists voted on the structures to identify molecules that according to their expert opinion and experience were likely to be frequent hitters. To obtain a set of nonfrequent hitters, a diverse set of compounds from the Roche human drug database were selected. The final data set contained 479 frequent hitters and 423 nonfrequent hitters.53
Structural analysis with LeadScope revealed that no single substructure was sufficient to identify a frequent hitter. To extend the analysis, Ghose and Crippen descriptors were calculated for all compounds in the data set and used to define a partial least squares (PLS) multivariate linear regression model. The PLS model correctly predicted 92% of frequent hitters and 88% of nonfrequent hitters. The group then developed a nonlinear model using a neural network, again based on the Ghose and Crippen descriptors. The final model correctly classified 90% of frequent hitters and 91% of nonfrequent hitters.53 As the authors explained, ‘frequent hitter’ is not synonymous with ‘undesired structure;’ for instance, ligands that bind a similar set of receptors will cross-react because of common substructures. Therefore, this model was not intended for elimination of compounds but for prioritization of compounds for purchase, library design, or testing.
A subsequent effort to identify frequent hitters was described by Merkwirth and co-workers.54 Various single and ensemble methods, including k-nearest neighbors classifiers, support vector machines (SVM), and single ridge regression models, were derived for binary classification of compounds. These models were then trained against the same frequent hitters data set described above. The best models had cross-validated correlation coefficients of up to 0.92 and misclassification rates of 4–5%, an improvement from the 10% misclassification rate produced by the neural network approach.54
2.18.4.2. Aggregators
Recent efforts have been directed toward the problem of identifying aggregating promiscuous inhibitors. Seidler and colleagues screened 50 clinically prescribed drugs and found that seven showed aggregate-based inhibition of β-lactamase, chymotrypsin, and malate dehydrogenase.27 These experimental results were used to develop a data set of 111 compounds containing 48 aggregators and 63 nonaggregators. Simple cutoffs based on solubility or ClogP classified 87% or 81% of the 111 compounds correctly, respectively. To obtain a more precise model, a recursive partitioning algorithm based on 260 physicochemical descriptors was developed (Figure 5 ). As shown in Table 2 , the model correctly classified 43 of 48 aggregators (90%) and 61 of 63 nonaggregators (97%).27
Figure 5.
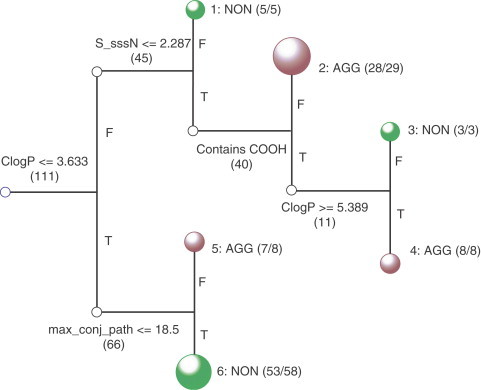
Recursive partitioning analysis of 111 aggregators and nonaggregators. Each branch contains the physicochemical criterion used to split a group of compounds; T indicates compounds that satisfy this criterion, and F indicates compounds that do not. Terminal nodes are green and coded as NON' if they consist predominantly or completely of nonaggregators; terminal nodes are red and coded as ‘AGG’ if they are predominantly or completely aggregators. Nodes with more compounds are identified by larger circles. (Reprinted with permission from Seidler, J.; McGovern, S. L.; Doman, T. N.; Shoichet, B. K. J. Med. Chem.2003, 46, 4477–4486. Copyright (2003) American Chemical Society.)
Table 2.
Classification rates for three different algorithms tested on the same data set of 48 aggregators and 63 nonaggregators
| Algorithm | Aggregators correctly classified (total=48) |
Nonaggregators correctly classified (total=63) |
Reference | ||
|---|---|---|---|---|---|
| No. | % | No. | % | ||
| Recursive partitioning | 43 | 90 | 61 | 97 | 27 |
| Neural network | 30 | 63 | 53 | 84 | 53 |
| Ensemble method (SVM)a | 32 | 67 | 58 | 92 | 53 |
SVM, support vector machines.
The same neural network53 and SVM method54 described in the preceding section were then tested against the 111 compounds in the aggregator test set; the results are described fully in 54 and briefly here (Table 2). The neural net identified 30 of 48 aggregators (63%) and 53 of 63 nonaggregators (84%) with a Matthew's correlation coefficient of 0.48. The SVM method correctly predicted 32 of 48 aggregators (67%) and 58 of 63 nonaggregators (92%) with a Matthew's correlation coefficient of 0.63. In summary, these methods did not discriminate between aggregators and nonaggregators as well as the recursive partitioning model. One obvious cause is that these models were trained against a data set containing frequent hitters acting by a variety of mechanisms, not simply aggregation. Nonetheless, it is remarkable that these algorithms performed as well as they did, given that the molecules on which they were trained were not specifically designated aggregators or nonaggregators. Indeed, it is intriguing to consider that the frequent hitters data set may include (as yet unidentified) aggregators, thereby contributing to the success of these models.
Recently, an additional 1030 compounds have been tested for aggregation33; the results increase the number of publicly reported compounds studied for this property by an order of magnitude. As the database of compounds explicitly found to be aggregators or nonaggregators grows, it is hoped that these data will provide greater insight into the nature of aggregation and enable the development of more precise models.
2.18.4.3. Privileged Substructures
Certain molecular scaffolds encode for recognition of diverse receptors. These privileged substructures are often starting points for the design of ligands with improved specificity for a particular receptor. This section will review two pharmacophore-based studies describing the use of privileged substructures for designing G protein-coupled receptor (GPCR) targeted compound libraries17 and for identifying promiscuous kinase inhibitors.16
Mason and co-workers introduced a method for generating 4-point pharmacophores that could be modified to include a pharmacophore for a particular substructure such as a privileged scaffold.17 Using Chem-X, atom types were automatically generated and assigned to a feature type used to generate the pharmacophore. Atom types or dummy centroid atoms unique to a privileged substructure were designated as a special ‘privileged’ feature type. This feature type was designated as one of the four points used to generate the pharmacophore map for the compound. Because all of the subsequent pharmacophore descriptor sets contained the privileged substructure, molecular similarity and diversity could be compared relative to their shared privileged scaffold. The authors proposed that this could be used as an aid for library design, either to imitate features of known active compounds or to explore ‘missing diversity’ among existing compounds containing the desired scaffold. The latter goal could be accomplished by using molecules containing the privileged substructure as reagents to obtain desired chemically accessible products.17
In addition, the method was shown to identify pharmacophores enriched among a class of ligands sharing similar biological activity. For instance, structural features shared by GPCR ligands were distinguished from those in a set of small molecule enzyme inhibitors and in a set of random compounds.17 The method could also be used to address ligand selectivity by comparing pharmacophore keys across sets of ligands for related enzymes, such as trypsin, thrombin, and factor Xa. More recent work has explored the use of pharmacophores for describing related binding sites, for instance see55.
In a subsequent report, Aronov and Murcko derived a five-point pharmacophore to describe kinase frequent hitters.16 In this work, frequent hitters were defined as compounds with K i values less than 50 nM against two or more of the following diverse kinases: protein kinase A, Src, Cdk2, Erk2, and Gsk3. Selective inhibitors were defined as compounds that had a K i value less than 50 nM against only one of the five kinases and greater than 50 nM against the other four. Both the promiscuous and selective compounds were known to exhibit ATP-competitive kinase inhibition at nanomolar concentrations. In total, the authors compiled a set of 43 frequent hitters and 209 selective inhibitors.16
Ligand-bound structures of four of the promiscuous compounds had been solved in-house; these structures were aligned and used to generate a five-point pharmacophore composed of two hydrogen bond donors, two hydrogen bond acceptors, and one aromatic feature.16 These results were compared against the frequent hitter and selective inhibitor data sets described above; 38 of 43 frequent hitters (88%) but only 10 of 209 selective inhibitors (5%) matched the pharmacophore. Considering only selective inhibitors with a K i value less than 2 nM for one of the kinases (25-fold greater specificity), 0 of 61 compounds (0%) matched the pharmacophore. Therefore, the pharmacophore captured some of the features that distinguished frequent hitters from specific inhibitors.16 By placing the pharmacophore features in the ATP binding site, it was possible to identify interactions between conserved kinase residues and the frequent hitters that contributed to the inhibitors’ promiscuity. The authors proposed that either by addition of features beyond those five associated with promiscuity or subtraction of at least one of the substructures represented by the pharmacophore, it might be possible to engineer ligands with greater specificity for a given kinase.16
2.18.4.4. Reactive Species
Chemically reactive groups are a well-known source of false-positive screening hits.14 Several commercial and in-house filters for identifying and removing reactive species are currently in use.50, 56 Despite the widespread use of filters, reactive compounds remain a significant challenge for discovery efforts. For example, Blanchard and co-workers reported that of 69 HTS hits against coronavirus protease, 64 (93%) were discarded after repeat assays with DTT suggested thiol reactivity.30
To address this persistent problem, Hajduk's group at Abbott has proposed the thiol reactivity index (TRI) for estimating the probability that a given compound will be reactive.15 Their recently developed ALARM NMR method for detecting thiol reactivity found that of 476 lead compounds experimentally shown to be reactive, only 156 (33%) were predicted as such by computational filters. To better define the relevant moieties, structural descriptors were calculated for a series of reactive compounds. The probability of reactivity (P R) for any given structure was then defined as the sum over all structural descriptors of the number of occurrences of each descriptor in that compound weighted by the TRI for that descriptor. If the P R for a compound was greater than 0.3, the compound was predicted to be reactive. The TRI for each descriptor was determined by using nonlinear regression to maximize the agreement between observed and predicted reactivity as described by a scoring function.15
The final set of 75 nonzero TRIs was applied to a data set of 3504 compounds studied by ALARM NMR.15 Using a P R of 0.3, 486 of 509 experimentally reactive compounds (95%) were correctly predicted and 2005 of 2995 experimentally nonreactive compounds (67%) were correctly predicted. As described, the method has a high sensitivity and a low number of false negatives, making it a useful flag for identifying compounds for follow-up experimental reactivity testing.15
2.18.4.5. Experimental Artifact
Interference with the assay readout is another familiar source of screening false positives.7, 14 Few computational approaches for removing actives due to experimental artifact have been developed, but Jenkins and colleagues proposed that virtual screening can be used as a filter for such compounds.13 Their underlying hypothesis was that true positives should be enriched by virtual screening and false positives due to experimental artifact should be de-enriched. To explore this idea, the National Cancer Institute Diversity Set and the ChemBridge DIVERSet were combined to produce a library of 18 111 compounds that was initially docked against angiogenin in a fluorescence-based HTS. To distinguish true hits from false positives, HTS hits were rescreened in a luciferase assay and an HPLC assay. Of 178 initial HTS hits, 12 (6.7%) were confirmed as true hits by the follow-up assays.
The same database of compounds was also tested against angiogenin in two separate virtual screens, one using DockVision for docking and Ludi for scoring, and a second using GOLD for both docking and scoring. The computational methods were then evaluated for their ability to enrich for true hits among the total docked library and also among the HTS hit list. The DockVision/Ludi combination ranked 33% of the true hits in the top 10% of the total database for a 3.3-fold enrichment over random and the GOLD algorithm placed 42% of the true hits in the top 2% to yield a 21-fold enrichment. When only the HTS hits were docked, the highest enrichment was observed by a consensus scoring method that counted compounds ranked in the top 25% by both virtual screening methods. This approach placed four of the true hits among the top 9 (5%) of the 178 HTS hits for an enrichment of 6.6-fold over HTS alone. The authors concluded that virtual screening was best used as a post-HTS filter to prioritize compounds for further testing.
2.18.5. Future Directions
Despite the growing interest in promiscuous compounds, several outstanding questions remain. For instance, what is the prevalence of aggregate-based inhibitors, particularly among small molecules that are most interesting for drug design? Early observations suggest that these compounds may be widespread among druglike compounds23, 33; further work to explore the distribution of aggregators is clearly needed.
Even if aggregators are found to occupy substantial regions of relevant chemical space, what is the significance of this behavior? Is aggregation a feature or a bug? Since clinically used drugs have been found capable of inhibiting enzymes by forming aggregates,27 one could make the argument that aggregation is not a significant problem for drug design. Indeed, recent studies have proposed that aggregation may be a necessary step in the systemic uptake of NNRTIs,44 suggesting that aggregation may even be a desirable property.
Clearly, it is possible for drugs to show aggregation-based inhibition, as a compound that is specific at nanomolar concentrations for a pharmacologic target may also aggregate at micromolar concentrations. Indeed, it is interesting to speculate on possible consequences of aggregation by drugs. But aggregation at micromolar concentrations leading to inhibition of nontarget receptors does not change the fact that the drug also inhibits its target at nanomolar concentrations. This is the important difference between a drug that inhibits off-pathway targets via aggregation and a hit that inhibits its screening target via aggregation. The purpose of screening is to find new leads for inhibitor design. A screening hit that is only active because it inhibits its target receptor via aggregation is likely not a good starting point for further design work and should be abandoned. Furthermore, even though the screening hit shares the same pathology (aggregation) as a real drug, it does not necessarily follow that it may also share the same desired feature (classical inhibition of a target). Conversely, aggregation at micromolar concentrations does not exclude the possibility that the compound may also act as a specific inhibitor of a given target at nanomolar concentrations.
Efforts have been made to explore the mechanism of aggregate-mediated inhibition,24, 28, 45 but these experiments have only raised more questions. What is the nature of the physicochemical interaction between enzyme molecules and aggregate particles? Recent studies of nanoparticle-mediated inhibition of chymotrypsin57, 58 may provide insight. Functionalized amphiphilic nanoparticles have been found to inhibit chymoptrypsin via an electrostatic interaction followed by denaturation; up to 50% of enzyme activity was restored by the addition of surfactant.57 Depending on the particular functional groups exposed on the surface of the nanoparticle, various modes and degrees of inhibition were observed.58 Various biophysical experiments including fluorescence, fluorescence anisotropy, DLS, and circular dichroism were performed to study the conformational changes induced in the enzyme due to nanoparticle binding.57, 58 Similar experiments to explore the nature of aggregate-mediated enzyme inhibition may be worthwhile.
It is also interesting to consider the scope of receptors that are targets for small molecule aggregates. For instance, some enzymes are more susceptible to inhibition by aggregators than other enzymes. Is this due to variations in protein size, shape, surface charge distribution, or other physicochemical property? Additionally, most work to date has been done with soluble enzymes, but aggregators have also been identified in screens using membrane-bound receptors.23 Do aggregating compounds generally inhibit surface receptors? If so, how does inhibition compare to that of soluble enzymes? Can aggregators act as agonists as well as antagonists? These questions are active areas of research, and results from these studies are eagerly anticipated.
A final area of interest concerns the SARs among aggregators. What distinguishes aggregators from nonaggregators? What factors determine the size of the particle formed by each aggregator? Preliminary observations have been made by a few groups. For instance, Frenkel and colleagues analyzed SARs among 15 aggregating NNRTIs and found that compounds containing oxygen atoms tended to form larger particles.44 The authors proposed that oxygen's ability to serve as a hydrogen bond donor could result in different interactions from a similarly placed carbon or nitrogen atom and consequently lead to different aggregation patterns. In a separate study, Seidler and co-workers studied a series of azole antifungals, four of which were aggregate formers and two of which were not.27 Interestingly, the two nonaggregators are prescribed as orally available medications, but the four aggregators are only administered as topical agents. These compounds could be distinguished from each other based on their ClogP values, with the aggregators having a ClogP greater than 5 and the nonaggregators having a value less than 5.27 In addition to physical properties, potential structural descriptors have been suggested by the various computational models described above. Additionally, pharmacophore-based methods may be a useful approach for studying SARs among these compounds. It is hoped that as more small molecules are explicitly studied for aggregation, the structural influences leading to aggregation will be better defined and the mechanism itself will be better understood.
Acknowledgment
This work was supported by the Medical Scientist Training Program at Northwestern University (D. Engman, PI).
Biography

Susan L McGovern received her BSc in biochemistry and mathematics from the University of Notre Dame in 1997. Later that year, she joined the NIH-sponsored Medical Scientist Training Program of Northwestern University in Chicago, IL. In 2003, she earned her PhD in Brian Shoichet's laboratory for her work on molecular docking and aggregate-forming promiscuous inhibitors. In 2005, she finished her MD at Northwestern and moved to the University of Texas/MD Anderson Cancer Center to begin residency training in radiation oncology. Her long-term research goals are to use small molecules as tools for exploring the molecular basis of cancer and to develop pharmacologic agents for use in radiation oncology. Her research has been supported by two NIH training grants, a fellowship from the PhRMA Foundation, and a Presidential Fellowship from Northwestern University.
References
- 1.Lipinski C., Hopkins A. Nature. 2004;432:855–861. doi: 10.1038/nature03193. [DOI] [PubMed] [Google Scholar]
- 2.Shoichet B.K. Nature. 2004;432:862–865. doi: 10.1038/nature03197. [DOI] [PMC free article] [PubMed] [Google Scholar]
- 3.Alvarez J.C. Curr. Opin. Chem. Biol. 2004;8:365–370. doi: 10.1016/j.cbpa.2004.05.001. [DOI] [PubMed] [Google Scholar]
- 4.Erlanson D.A., Braisted A.C., Raphael D.R., Randal M., Stroud R.M., Gordon E.M., Wells J.A. Proc. Natl. Acad. Sci. USA. 2000;97:9367–9372. doi: 10.1073/pnas.97.17.9367. [DOI] [PMC free article] [PubMed] [Google Scholar]
- 5.Diller D.J., Hobbs D.W. J. Med. Chem. 2004;47:6373–6383. doi: 10.1021/jm049902r. [DOI] [PubMed] [Google Scholar]
- 6.Hann M.M., Oprea T.I. Curr. Opin. Chem. Biol. 2004;8:255–263. doi: 10.1016/j.cbpa.2004.04.003. [DOI] [PubMed] [Google Scholar]
- 7.Rishton G.M. Drug Disc. Today. 2003;8:86–96. doi: 10.1016/s1359644602025722. [DOI] [PubMed] [Google Scholar]
- 8.Muegge I., Heald S.L., Brittelli D. J. Med. Chem. 2001;44:1841–1846. doi: 10.1021/jm015507e. [DOI] [PubMed] [Google Scholar]
- 9.Frimurer T.M., Bywater R., Naerum L., Lauritsen L.N., Brunak S. J. Chem. Inf. Comput. Sci. 2000;40:1315–1324. doi: 10.1021/ci0003810. [DOI] [PubMed] [Google Scholar]
- 10.Ajay A., Walters W.P., Murcko M.A. J. Med. Chem. 1998;41:3314–3324. doi: 10.1021/jm970666c. [DOI] [PubMed] [Google Scholar]
- 11.Walters W.P., Stahl M.T., Murcko M.A. Drug Disc. Today. 1998;3:160–178. [Google Scholar]
- 12.Baldwin J., Michnoff C.H., Malmquist N.A., White J., Roth M.G., Rathod P.K., Phillips M.A. J. Biol. Chem. 2005;280:21847–21853. doi: 10.1074/jbc.M501100200. [DOI] [PubMed] [Google Scholar]
- 13.Jenkins J.L., Kao R.Y., Shapiro R. Proteins. 2003;50:81–93. doi: 10.1002/prot.10270. [DOI] [PubMed] [Google Scholar]
- 14.Rishton G.M. Drug Disc. Today. 1997;2:382–384. [Google Scholar]
- 15.Huth J.R., Mendoza R., Olejniczak E.T., Johnson R.W., Cothron D.A., Liu Y., Lerner C.G., Chen J., Hajduk P.J. J. Am. Chem. Soc. 2005;127:217–224. doi: 10.1021/ja0455547. [DOI] [PubMed] [Google Scholar]
- 16.Aronov A.M., Murcko M.A. J. Med. Chem. 2004;47:5616–5619. doi: 10.1021/jm049793g. [DOI] [PubMed] [Google Scholar]
- 17.Mason J.S., Morize I., Menard P.R., Cheney D.L., Hulme C., Labaudiniere R.F. J. Med. Chem. 1999;42:3251–3264. doi: 10.1021/jm9806998. [DOI] [PubMed] [Google Scholar]
- 18.Hajduk P.J., Bures M., Praestgaard J., Fesik S.W. J. Med. Chem. 2000;43:3443–3447. doi: 10.1021/jm000164q. [DOI] [PubMed] [Google Scholar]
- 19.Bemis G.W., Murcko M.A. J. Med. Chem. 1996;39:2887–2893. doi: 10.1021/jm9602928. [DOI] [PubMed] [Google Scholar]
- 20.Klabunde T., Hessler G. ChemBioChem. 2002;3:928–944. doi: 10.1002/1439-7633(20021004)3:10<928::AID-CBIC928>3.0.CO;2-5. [DOI] [PubMed] [Google Scholar]
- 21.Evans B.E., Rittle K.E., Bock M.G., DiPardo R.M., Freidinger R.M., Whitter W.L., Lundell G.F., Veber D.F., Anderson P.S., Chang R.S. J. Med. Chem. 1988;31:2235–2246. doi: 10.1021/jm00120a002. [DOI] [PubMed] [Google Scholar]
- 22.Bondensgaard K., Ankersen M., Thogersen H., Hansen B.S., Wulff B.S., Bywater R.P. J. Med. Chem. 2004;47:888–899. doi: 10.1021/jm0309452. [DOI] [PubMed] [Google Scholar]
- 23.McGovern S.L., Caselli E., Grigorieff N., Shoichet B.K. J. Med. Chem. 2002;45:1712–1722. doi: 10.1021/jm010533y. [DOI] [PubMed] [Google Scholar]
- 24.McGovern S.L., Helfand B.T., Feng B., Shoichet B.K. J. Med. Chem. 2003;46:4265–4272. doi: 10.1021/jm030266r. [DOI] [PubMed] [Google Scholar]
- 25.Lipinski C.A., Lombardo F., Dominy B.W., Feeney P.J. Adv. Drug Deliv. Rev. 1997;23:3–25. doi: 10.1016/s0169-409x(00)00129-0. [DOI] [PubMed] [Google Scholar]
- 26.McGovern S.L., Shoichet B.K. J. Med. Chem. 2003;46:1478–1483. doi: 10.1021/jm020427b. [DOI] [PubMed] [Google Scholar]
- 27.Seidler J., McGovern S.L., Doman T.N., Shoichet B.K. J. Med. Chem. 2003;46:4477–4486. doi: 10.1021/jm030191r. [DOI] [PubMed] [Google Scholar]
- 28.Liu H.Y., Wang Z., Regni C., Zou X., Tipton P.A. Biochemistry. 2004;43:8662–8669. doi: 10.1021/bi0491907. [DOI] [PubMed] [Google Scholar]
- 29.Soelaiman S., Wei B.Q., Bergson P., Lee Y.S., Shen Y., Mrksich M., Shoichet B.K., Tang W.J. J. Biol. Chem. 2003;278:25990–25997. doi: 10.1074/jbc.M301232200. [DOI] [PubMed] [Google Scholar]
- 30.Blanchard J.E., Elowe N.H., Huitema C., Fortin P.D., Cechetto J.D., Eltis L.D., Brown E.D. Chem. Biol. 2004;11:1445–1453. doi: 10.1016/j.chembiol.2004.08.011. [DOI] [PMC free article] [PubMed] [Google Scholar]
- 31.Lee Y.S., Bergson P., He W.S., Mrksich M., Tang W.J. Chem. Biol. 2004;11:1139–1146. doi: 10.1016/j.chembiol.2004.05.020. [DOI] [PubMed] [Google Scholar]
- 32.Erbe D.V., Wang S., Zhang Y.L., Harding K., Kung L., Tam M., Stolz L., Xing Y., Furey S., Qadri A. Mol. Pharmacol. 2005;67:69–77. doi: 10.1124/mol.104.005553. [DOI] [PubMed] [Google Scholar]
- 33.Feng B.Y., Shelat A., Doman T.N., Guy R.K., Shoichet B.K. Nat. Chem. Biol. 2005;1:146–148. doi: 10.1038/nchembio718. [DOI] [PubMed] [Google Scholar]
- 34.Teklu S., Gundersen L.L., Larsen T., Malterud K.E., Rise F. Bioorg. Med. Chem. 2005;13:3127–3139. doi: 10.1016/j.bmc.2005.02.056. [DOI] [PubMed] [Google Scholar]
- 35.Koch M.A., Wittenberg L.O., Basu S., Jeyaraj D.A., Gourzoulidou E., Reinecke K., Odermatt A., Waldmann H. Proc. Natl. Acad. Sci. USA. 2004;101:16721–16726. doi: 10.1073/pnas.0404719101. [DOI] [PMC free article] [PubMed] [Google Scholar]
- 36.Brogan A.P., Verghese J., Widger W.R., Kohn H. J. Inorg. Biochem. 2005;99:841–851. doi: 10.1016/j.jinorgbio.2004.12.019. [DOI] [PubMed] [Google Scholar]
- 37.Fattorusso R., Jung D., Crowell K.J., Forino M., Pellecchia M. J. Med. Chem. 2005;48:1649–1656. doi: 10.1021/jm0493212. [DOI] [PubMed] [Google Scholar]
- 38.Li C., Xu L., Wolan D.W., Wilson I.A., Olson A.J. J. Med. Chem. 2004;47:6681–6690. doi: 10.1021/jm049504o. [DOI] [PubMed] [Google Scholar]
- 39.Wang L.Z., Kenyon G.L., Johnson K.A. J. Biol. Chem. 2004;279:38424–38432. doi: 10.1074/jbc.M406241200. [DOI] [PubMed] [Google Scholar]
- 40.Brenk R., Meyer E.A., Reuter K., Stubbs M.T., Garcia G.A., Diederich F., Klebe G. J. Mol. Biol. 2004;338:55–75. doi: 10.1016/j.jmb.2004.02.019. [DOI] [PubMed] [Google Scholar]
- 41.Lee K.H., Shin B.H., Shin K.J., Kim D.J., Yu J. Biochem. Biophys. Res. Commun. 2005;328:816–823. doi: 10.1016/j.bbrc.2005.01.030. [DOI] [PubMed] [Google Scholar]
- 42.Forino M., Jung D., Easton J.B., Houghton P.J., Pellecchia M. J. Med. Chem. 2005;48:2278–2281. doi: 10.1021/jm048962u. [DOI] [PubMed] [Google Scholar]
- 43.McGovern S.L. Virtual Screening in Drug Discovery. CRC Press; Boca Raton, FL: 2005. Experimental Identification of Promiscuous, Aggregate-Forming Screening Hits; pp. 107–124. [Google Scholar]
- 44.Frenkel Y.V., Clark A.D., Jr., Das K., Wang Y.H., Lewi P.J., Janssen P.A., Arnold E. J. Med. Chem. 2005;48:1974–1983. doi: 10.1021/jm049439i. [DOI] [PubMed] [Google Scholar]
- 45.Ryan A.J., Gray N.M., Lowe P.N., Chung C.W. J. Med. Chem. 2003;46:3448–3451. doi: 10.1021/jm0340896. [DOI] [PubMed] [Google Scholar]
- 46.Davies S.P., Reddy H., Caivano M., Cohen P. Biochem. J. 2000;351:95–105. doi: 10.1042/0264-6021:3510095. [DOI] [PMC free article] [PubMed] [Google Scholar]
- 47.Leung D., Hardouin C., Boger D.L., Cravatt B.F. Nat. Biotechnol. 2003;21:687–691. doi: 10.1038/nbt826. [DOI] [PubMed] [Google Scholar]
- 48.Godl K., Wissing J., Kurtenbach A., Habenberger P., Blencke S., Gutbrod H., Salassidis K., Stein-Gerlach M., Missio A., Cotten M. Proc. Natl. Acad. Sci. USA. 2003;100:15434–15439. doi: 10.1073/pnas.2535024100. [DOI] [PMC free article] [PubMed] [Google Scholar]
- 49.Funeriu D.P., Eppinger J., Denizot L., Miyake M., Miyake J. Nat. Biotechnol. 2005;23:622–627. doi: 10.1038/nbt1090. [DOI] [PubMed] [Google Scholar]
- 50.Walters W.P., Namchuk M. Nat. Rev. Drug Disc. 2003;2:259–266. doi: 10.1038/nrd1063. [DOI] [PubMed] [Google Scholar]
- 51.Santos N.C., Castanho M.A.R.B. Biophys. J. 1996;71:1641–1650. doi: 10.1016/S0006-3495(96)79369-4. [DOI] [PMC free article] [PubMed] [Google Scholar]
- 52.Wyatt P.J. Anal. Chim. Acta. 1993;272:1–40. [Google Scholar]
- 53.Roche O., Schneider P., Zuegge J., Guba W., Kansy M., Alanine A., Bleicher K., Danel F., Gutknecht E.M., Rogers-Evans M. J. Med. Chem. 2002;45:137–142. doi: 10.1021/jm010934d. [DOI] [PubMed] [Google Scholar]
- 54.Merkwirth C., Mauser H., Schulz-Gasch T., Roche O., Stahl M., Lengauer T. J. Chem. Inf. Comput. Sci. 2004;44:1971–1978. doi: 10.1021/ci049850e. [DOI] [PubMed] [Google Scholar]
- 55.Arnold J.R., Burdick K.W., Pegg S.C., Toba S., Lamb M.L., Kuntz I.D. J. Chem. Inf. Comput. Sci. 2004;44:2190–2198. doi: 10.1021/ci049814f. [DOI] [PubMed] [Google Scholar]
- 56.Hann M., Hudson B., Lewell X., Lifely R., Miller L., Ramsden N. J. Chem. Inf. Comput. Sci. 1999;39:897–902. doi: 10.1021/ci990423o. [DOI] [PubMed] [Google Scholar]
- 57.Fischer N.O., Verma A., Goodman C.M., Simard J.M., Rotello V.M. J. Am. Chem. Soc. 2003;125:13387–13391. doi: 10.1021/ja0352505. [DOI] [PubMed] [Google Scholar]
- 58.Hong R., Fischer N.O., Verma A., Goodman C.M., Emrick T., Rotello V.M. J. Am. Chem. Soc. 2004;126:739–743. doi: 10.1021/ja037470o. [DOI] [PubMed] [Google Scholar]
- 59.Weston G.S., Blazquez J., Baquero F., Shoichet B.K. J. Med. Chem. 1998;41:4577–4586. doi: 10.1021/jm980343w. [DOI] [PubMed] [Google Scholar]