

Summary
Genetics is a major determinant of susceptibility to autoimmune disorders. Here we examined whether genome organization provides resilience or susceptibility to sequence variations, and how this would contribute to the molecular etiology autoimmune disease. We generated high-resolution maps of linear and 3D genome organization in thymocytes of NOD mice, a model of type 1 diabetes (T1D), and the diabetes-resistant C57BL/6 mice. Multi-enhancer interactions formed at genomic regions harboring genes with prominent roles in T cell development in both strains. However, diabetes risk-conferring loci coalesced enhancers and promoters in NOD, but not C57BL/6 thymocytes. 3D genome mapping of NODxC57BL/6 F1 thymocytes revealed that genomic misfolding in NOD mice is mediated in cis. Moreover, immune cells infiltrating the pancreas of humans with T1D exhibited increased expression of genes located on misfolded loci in mice. Thus, genetic variation leads to altered 3D chromatin architecture and associated changes in gene expression that may underlie autoimmune pathology.
Graphical Abstract
eTOC blurb
Fasolino, Goldman et al generate high-resolution maps of linear and 3D genome organization in thymocytes of NOD mice, a model of type 1 diabetes, and reveal that diabetes risk-conferring loci coalesced enhancers and promoters of genes associated with T cell identity and function, altering gene expression. Thus, genetic variation leads to altered chromatin architecture that may underlie autoimmune pathology, with implications for human disease.
Introduction
In human cells, two meters of DNA are compacted in the nucleus through assembly with histones and other proteins into nucleosomes, megabase-long three-dimensional (3D) domains, and chromosomes that determine the activity and inheritance of our genomes (Ou et al., 2017). Decoding the genetic information from this extreme compression is orchestrated by specialized proteins capable of binding DNA in a sequence-specific manner. Locally, a number of transcription factors can access their binding sites even if they are occluded by nucleosomes, recruiting chromatin-remodeling enzymes and exposing the underlying DNA (Boller et al., 2016; Iwafuchi-Doi and Zaret, 2016; Johnson et al., 2018; Li et al., 2011). Globally, sequence-specific proteins such as CCCTC-binding factor (CTCF) act as structural regulators of spatial genome organization (Phillips and Corces, 2009). Since genetics is a major determinant of susceptibility to common diseases, in particular autoimmune disorders, understanding the underlying principles through which genome organization provides resilience or susceptibility to sequence variations is key for understanding the molecular etiology of these diseases.
Type 1 diabetes (T1D) is a complex disease caused by a combination of genetic and environmental factors. Autoimmunity in T1D is driven by tissue-specific immunological attack: interactions between T lymphocytes and insulin-producing beta cells lead to loss of beta-cell mass and a dependence on exogenous insulin administration for survival (Wang et al., 2019). Genome-wide association studies have implicated multiple genes and pathways in T1D, uncovering around 60 risk loci (Barrett et al., 2009). The last decade has seen an explosion in studies reporting the preferential enrichment of disease-associated variations within cell type-specific accessible chromatin regions relying on the epigenomic maps derived from tissues of healthy individuals (Roadmap Epigenomics et al., 2015; Stunnenberg et al., 2016). These studies, however, did not systematically examine the relationship between the sequence variation associated with complex diseases and genome-wide chromatin architecture.
We aimed to study the impact of genetic variation associated with T1D on the 3D chromatin topology of T lymphocytes. To control for the impact of environment on disease progression, we exploited a genetic model of T1D, the non-obese-diabetic (NOD) mouse strain, which has provided a wealth of insight into the complex processes involved in autoimmune diseases (Anderson and Bluestone, 2005). Autoimmune diabetes in both humans and NOD mice is characterized by leukocyte infiltration of pancreatic islets, ultimately leading to the destruction of insulin-producing islet beta cells. Genetic analysis of the NOD mice identified 18 megabase pair domains, called “insulin-dependent diabetes” (Idd) regions, controlling diabetes susceptibility in NOD mice (Steward et al., 2013). These loci were often identified using a congenic strategy where replacing specific NOD chromosomal regions with the equivalent diabetes-resistant C57BL/6 or C57BL/10 loci led to a reduction in the diabetic phenotype, indicating the existence of genes or regulatory regions at Idd domains that control both insulitis and diabetes (Lyons et al., 2000; Wicker et al., 1994; Yamanouchi et al., 2010).
Here, through comparison of genomic architecture in thymocytes of C57BL/6 and NOD mice, we identified chromatin misfolding at megabase pair diabetes-susceptibility regions. High-resolution molecular and optical mapping of 3D genome organization in T lymphocytes of diabetes-susceptible and diabetes-resistant mice revealed that although 3D genome organization at T cell identity genes was comparable between the two strains, megabase pair diabetes risk-conferring loci brought together enhancers and promoters only in diabetes-susceptible mice, consistent with aberrant gene expression. The 3D regulatory landscape in diabetes-susceptible mice was mediated in cis by DNA sequences bound by CTCF, which likely nucleate pathogenic changes in 3D chromatin architecture. The megabase pair Idd domain with the most 3D interactions in NOD mice harbored a cluster of genes encoding KRAB-Zinc finger proteins (ZFP). KRAB-ZFPs repress the expression of specific endogenous retroviruses (ERV) where anti-ERV antibody reactivity have been implicated in autoimmunity (Treger et al., 2019). Single-cell transcriptional profiling of the immune cell population in the pancreas of human donors with T1D revealed increased expression of KRAB-ZFPs, suggesting the evolutionary conservation of this pathway and its relevance to disease progression. Given that the functional relevance of these megabase pair intervals in conferring diabetes is established, our study suggests 3D genome reconfiguration as a molecular contributor of autoimmunity.
Results
Active regulatory elements in T lymphocytes of NOD mice are associated with type 1 diabetes
We sought to identify the effect of 5.6 million single-nucleotide polymorphisms (SNPs) and 440,000 insertions or deletions (Indels) between C57BL/6J and NOD/ShiLtJ mice on chromatin accessibility in T cells (subsequently referred to as C57BL/6 and NOD). We reasoned that studying a naive T cell state before any antigen exposure, and long before disease onset, will reflect genetic predisposition and not the consequences of the disease process. Thus, we focused on double-positive CD4+ CD8+ T cells in the thymus of 4-week old male mice. Of note, the median onset of diabetes in male NOD mice is 30 weeks. Hereafter, we will refer to the double-positive (DP) population as “T cells”. Further rationale to study DP T cells in our study is that they represent the immature common source for all T-cell subsets that cause T1D in NOD mice and NOD thymocytes have been shown to exhibit developmental abnormalities (Feng et al., 2011b; Mingueneau et al., 2012; Yui et al., 2013).
We measured chromatin accessibility in the two mouse strains using ATAC-seq (Buenrostro et al., 2013). We incorporated variations derived from the latest de novo assembly of the NOD genome into the mouse reference genome (Lilue et al., 2018). Since it is not possible to compare epigenomic data mapped to different genomes due to Indels, the coordinates of mapped open chromatin fragments in NOD were shifted to C57BL/6 reference coordinates using MMARGE (Link et al., 2018b). 60,015 open chromatin regions were identified in T cells, with 96% of them (58,154) demonstrating similar degree of accessibility between strains (Figure S1A). 1,049 accessible chromatin regions were unique to T cells of C57BL/6 mice (referred to as ‘lost in NOD’) while 812 regulatory regions were unique to T cells of NOD mice (referred to as ‘gained in NOD’) (Figure 1A; Table S1). The strain-specific differences in chromatin accessibility were reproducible across biological replicates (Figure S1B) and co-localized with the strain-specific H3K27ac (Figure S1C). The strain-specific regulatory elements were enriched at noncoding genomic regions (Figure S1D) and displayed a higher degree of sequence variation between the two strains compared to strain-similar regulatory elements (Figure 1B; p-value < 2.2e-16). Analyses of evolutionary conservation among 60 vertebrate species revealed higher average sequence conservation scores at strain-similar regulatory elements compared with strain-specific ones (Figure 1C; lost p-value< 1.404e-05 and gained p-value < 2.2e-16). To quantify the extent of cis- versus trans-regulation, we performed ATAC-seq experiments in T cells of F1 offspring (NOD × C57BL/6). Directly comparing the fold change of allele-specific reads between parents and F1 strains indicated that >71% of the peaks followed the parental pattern and were therefore considered to be cis-regulated (Figure 1D; Table S2). Together, more than one thousand genomic regions with a large number of sequence variation demonstrated differential chromatin accessibility and histone acetylation between the two strains.
Figure 1. Active regulatory elements in T lymphocytes of NOD mice are associated with type 1 diabetes.
(A) Heatmaps display strain-specific chromatin accessibility measured by ATAC-seq in double-positive thymocytes of 4-week old male C57BL/6 and NOD mice. Three technical and two biological replicates were generated for each strain.
(B-C) Cumulative distribution function for number of SNPs between C57BL/6 and NOD per 1000 base-pair (B) and sequence conservation (C) at strain-similar regions in addition to those gained or lost in NOD.
(D) Ratio-ratio plot of ATAC-seq parental log2 fold change in double-positive thymocytes derived from C57BL/6 and NOD mice versus allele-specific log2 fold change in double-positive thymocytes derived from C57BL/6 × NOD F1 mice.
(E) De novo motif analysis of strain-specific ATAC-seq peaks with peaks from the opposite strain as control. Boxes display percent enrichment, log10 p-values for enrichment of the motif, and its rank order in parentheses.
(F) 18 insulin-dependent diabetes (Idd) intervals are distributed across 6 chromosomes.
(G) A higher odds ratio is associated for Idd regions overlapping with regulatory elements that gained chromatin accessibility in NOD mice compared with those elements that lost accessibility in this strain.
(H) Barplot demonstrates the number of strain-specific peaks within each Idd interval.
(I) ATAC-seq and H3K27ac ChIP-seq profiles at Idd1.MHC interval. All bigwig files are tag-per-million normalized.
The enrichment of sequence variation at strain-specific accessible elements suggested the disruption of lineage-determining transcription factor recognition motifs (Link et al., 2018a). To determine which transcription factor binding site disruption most likely caused the loss of chromatin accessibility in each strain, we performed motif analysis in strain-specific open chromatin regions using the opposite strain genomic regions as background. While T-box, RUNX, and TCF3 (E2A) recognition motifs were strongly enriched in differentially accessible chromatin regions in C57BL/6 mice (Figure 1E), we found the enrichment for Sp1, Nkx2.5 and Fox motifs in the open chromatin regions specific to NOD mice, suggesting that transcription factors from these families contribute to the establishment of the strain-specific chromatin accessibility landscape of T cells.
Next, we sought to investigate whether changes in chromatin accessibility were associated with diabetes susceptibility. Genomic loci referred to as Idd regions are major contributors to T1D susceptibility in NOD mice (Figure 1F). We examined whether gain or loss in chromatin accessibility in T cells of NOD mice was associated with any of 18 Idd regions. While 35 regulatory elements within Idd regions became less accessible in NOD mice, 58 genomic regions gained accessibility in this strain, indicating a higher odds ratio for gain in chromatin accessibility is associated with diabetes (Figure 1G–H). An example of gain and loss in chromatin accessibility highlighted the distinct epigenetic landscape at the Idd MHC interval in NOD mice (Figure 1I). In particular, two Idd regions, Idd9.2 and Idd6.AM located on chromosomes 4 and 6, respectively, were significantly more accessible in T cells of NOD than C57BL/6. Together, the comparison of chromatin accessibility of thymic T cells long before disease onset revealed prepatterning of the genome at select diabetes-susceptibility regions.
Gain in chromatin accessibility is linked to increased expression of genes in T lymphocytes of NOD mice at type 1 diabetes loci
We next compared the transcriptional outputs of T cells in the two strains using RNA sequencing (RNA-seq). Differential mRNA expression analysis revealed increased expression of 664 genes and decreased expression of 633 genes in NOD T cells as compared to C57BL/6 (Figures 2A and S2A; Table S3) (log2 Fold-Change>1 and padj<0.05). The promoters of less than 10% of differentially expressed genes were differentially accessible in the cognate strain (Figure S2B). An example included the H2–T3 gene in the MHC Idd locus (Figure 2B). Genes that were increased in expression in NOD thymocytes were more likely to be located in Idd regions than genes whose expression was decreased (Figures 2C and S2C). For example, Zfp979, also called 2610305D13Rik, within Idd9.2 was selectively expressed in NOD mice. The Idd-associated genes with increased expression in NOD clustered near genomic regions that gained chromatin accessibility in these mice (Figure 2D). Gene ontology analysis of differentially expressed genes suggested the ‘regulation of leukocyte mediated cytotoxicity’ and ‘signaling by interleukins’ associated genes to be enriched at genes with increased expression in NOD (Figure 2E, S2D–E).
Figure 2. Increased expression of genes in T lymphocytes of NOD mice are associated with type 1 diabetes.
(A) Volcano plot demonstrates differential expression analysis by DESeq2 using two biological and two technical RNA-seq replicates in double-positive thymocytes in C57BL/6 and NOD mice (log2FoldChange>1 and padj<0.05).
(B) ATAC-seq and RNA-seq profiles at H2–T3 demonstrate the association between gain in accessibility of a promoter with transcription in NOD mice.
(C) A higher odds ratio is associated with Idd regions overlapping with genes with increased expression in NOD mice compared with genes demonstrating decreased expression in this strain. Contingency table was calculated based on counts of differentially expressed genes between strains overlapping Idd regions in comparison with strain-similar genes.
(D) Circos plot demonstrates 18 Idd intervals together with genomic locations of differentially accessible regions and differentially expressed genes in NOD mice in comparison with C57BL/6.
(E) Gene ontology analysis for differentially expressed genes using metascape suggests the ‘regulation of leukocyte mediated cytotoxicity’ associated genes to be enriched at NOD expressed genes.
Genes with prominent roles in T cell development form hyperconnected 3D cliques
Spatial organization of the genome allows distal enhancers to alter the expression of their target genes (Mifsud et al., 2015). This organization is created in part by interactions between distal sites bound by CTCF and the cohesin complex (Ing-Simmons et al., 2015; Phillips-Cremins et al., 2013; Seitan et al., 2013). We next examined the role of long-range interactions of enhancers in controlling strain-specific transcriptional outputs. High-resolution, genome-wide chromatin conformation capture methods, such as PLAC-seq and HiChIP, have enabled protein-centric 3D mapping of chromatin interactions (Fang et al., 2016; Mumbach et al., 2016). Thus, we performed HiChIP for the cohesin subunit Smc1 and systematically mapped the 3D regulatory landscape of T cells.
We first inspected features of spatial genome organization in T cells of C57BL/6 mice (Figure 3), performing Smc1 HiChIP in replicates with ~500 million sequencing reads (Table S4). Only significant loops that were detected in both replicates were retained (14,658 reproducible loops FDR ≤ 0.05) and they were further filtered whether Smc1 ChIP-seq peaks deposited at least at one anchor providing 7,661 significant interactions (Figure S3A). Since our goal was to link active distal enhancers to their target genes, we further filtered Smc1-mediated 3D genome interactions with signals from H3K27ac ChIP-seq at least at one anchor (4,936 significant interactions). We found a large number of enhancer-promoter, promoter-promoter, and enhancer-enhancer interactions at regions harboring key T cell genes, such as CD8a and CD8b1 (Figure 3A). We further quantitated these interactions genome-wide and found that enhancer-promoter interactions accounted for only 25% of the interactions between regulatory elements, whereas the majority of reproducible interactions linked pairs of enhancers (72%) (Figure 3B), which was consistent with frequencies reported in other studies (Petrovic et al., 2019). In addition, 3% of interactions occurred between promoter pairs, which was in line with other reports suggesting the existence of regulatory promoter-promoter interactions (Li et al., 2012). Together, the large proportion of enhancer-enhancer interactions suggested the presence of interacting communities involving a single promoter and multiple enhancers that all are in contact.
Figure 3. Genes with prominent roles in T cell development are enriched at hyperconnected 3D cliques of C57BL/6.
(A) The genome browser view demonstrates H3K27ac, CTCF, and Smc1 ChIP-seq and Smc1 HiChIP 1D and 3D interactions at the Cd8a-Cd8b1 locus. Smc1 HiChIP measurements in two biological replicates were generated and only reproducible interactions were used for further analysis.
(B) The number of enhancer-enhancer (EE), enhancer-promoter (EP), and promoter-promoter (PP) interactions in DP T cells measured by Smc1 HiChIP interactions reproduced in two replicates in C57BL/6 mice. Enhancers were defined by deposition of H3K27ac.
(C) 3D clique total connectivity in C57BL/6 reveals two classes of interacting enhancers and promoters. Cliques are plotted in an ascending order of their total connectivity. Hyperconnected 3D cliques are defined as the ones above the elbow of the total connectivity ranking. Example of hyperconnected 3D cliques are marked and named with their representative genes. Number of interactions in each clique is provided in parenthesis.
(D-E) The genome-browser view and network topology of a hyperconnected 3D clique at the Runx1 gene.
(F) Gene ontology analysis using metascape suggests ‘leukocyte differentiation’, ‘T cell activation’ and ‘lymphocyte differentiation’ are associated with hyperconnected 3D cliques.
(G-H) Cumulative distribution function for number of SNPs between C57BL/6 and NOD per 1000 base-pair (G) and sequence conservation (H) at enhancers within hyperconnected or regular 3D cliques.
To globally model the higher-order structure of multi-enhancer interactions, we followed our previously described approach (Petrovic et al., 2019) and algorithmically searched for groups of densely connected enhancers and promoters with high intra-group and sparse inter-group interactions. Referring to these densely interconnected elements as “3D cliques”, we observed asymmetry in the connectivity distribution with distinct 3D community topology (Figures 3C–E). The asymmetry in the number of Smc1-mediated interactions in 3D is reminiscent of super-enhancer formation, displaying asymmetry in the loading of the H3K27ac modification (Vahedi et al., 2015). Although the majority of 3D cliques (95%) contained less than 4 interactions, 133 cliques containing 1,467 regulatory elements were categorized as “hyperconnected 3D cliques” (Figure 3C). Of note, 33% of super-enhancers in T cells demonstrated spatial interactions, contributing to the formation of hyperconnected 3D cliques in these cells (Figure S3B–C).
The megabase pair genomic region containing Bcl11b was identified as the most hyperconnected 3D clique in T cells, with 55 reproducible interactions (Figure 3C). The genome browser view and 3D community topology for Runx1 demonstrated the hyperconnectivity of the genomic locus of this gene (Figure 3D–E). Other hyperconnected genomic regions included the Ets1, CD8a-CD8b, Bcl6, and Tle3 loci (Figures 3C and S3D–E). The hyperconnected 3D cliques harbored genes enriched with ‘T cell activation’ and ‘lymphocyte differentiation’ ontologies (Figure 3F). Sequence conservation and SNP enrichment were similarly distributed between hyperconnected and regular 3D cliques (Figure 3G–H; p-value = 0.1). Together, charting the spatial genome organization in T cells of C57BL/6 mice revealed multi-enhancer interactions at genes with prominent roles in T cell development.
Genes with prominent roles in T cell identity are hyperconnected in 3D in both strains
We next determined the spatial genome organization in T cells of NOD mice, focusing first on quantitating similarities between the two strains (Figure 4; Tables S4–5). The coordinates of reproducible interactions in NOD mice measured by Smc1 HiChIP were shifted to C57BL/6 reference coordinates. The statistically significant interactions reproduced in two replicates with Smc1 ChIP-seq peaks deposited at least at one anchor were considered for further analysis (Figure S3A; 8,694 significant interactions). Significant loops were further filtered with signals from H3K27ac ChIP-seq at least at one anchor (5,013 significant interactions). Next, we used our graph-theory-based approach to determine genomic regions with spatial clustering properties (Figure S4A–B). The shared hyperconnected 3D cliques between strains occurred at genes with prominent roles in T cell development such as Bcl11b (Figure 4A–F), and Ets1 (Figure 4G–L), suggesting conservation of spatial organization, which is consistent with their comparable expression between the two strains (Figure S4C; Pearson correlation=0.67). Interestingly, the non-coding RNA ThymoD, which plays a prominent role in instructing chromatin folding and compartmentalization during T cell development (Isoda et al., 2017), was highly connected to the Bcl11b locus in both strains (Figure 4A–D).
Figure 4. Comparable epigenetic signature at shared hyperconnected 3D cliques.
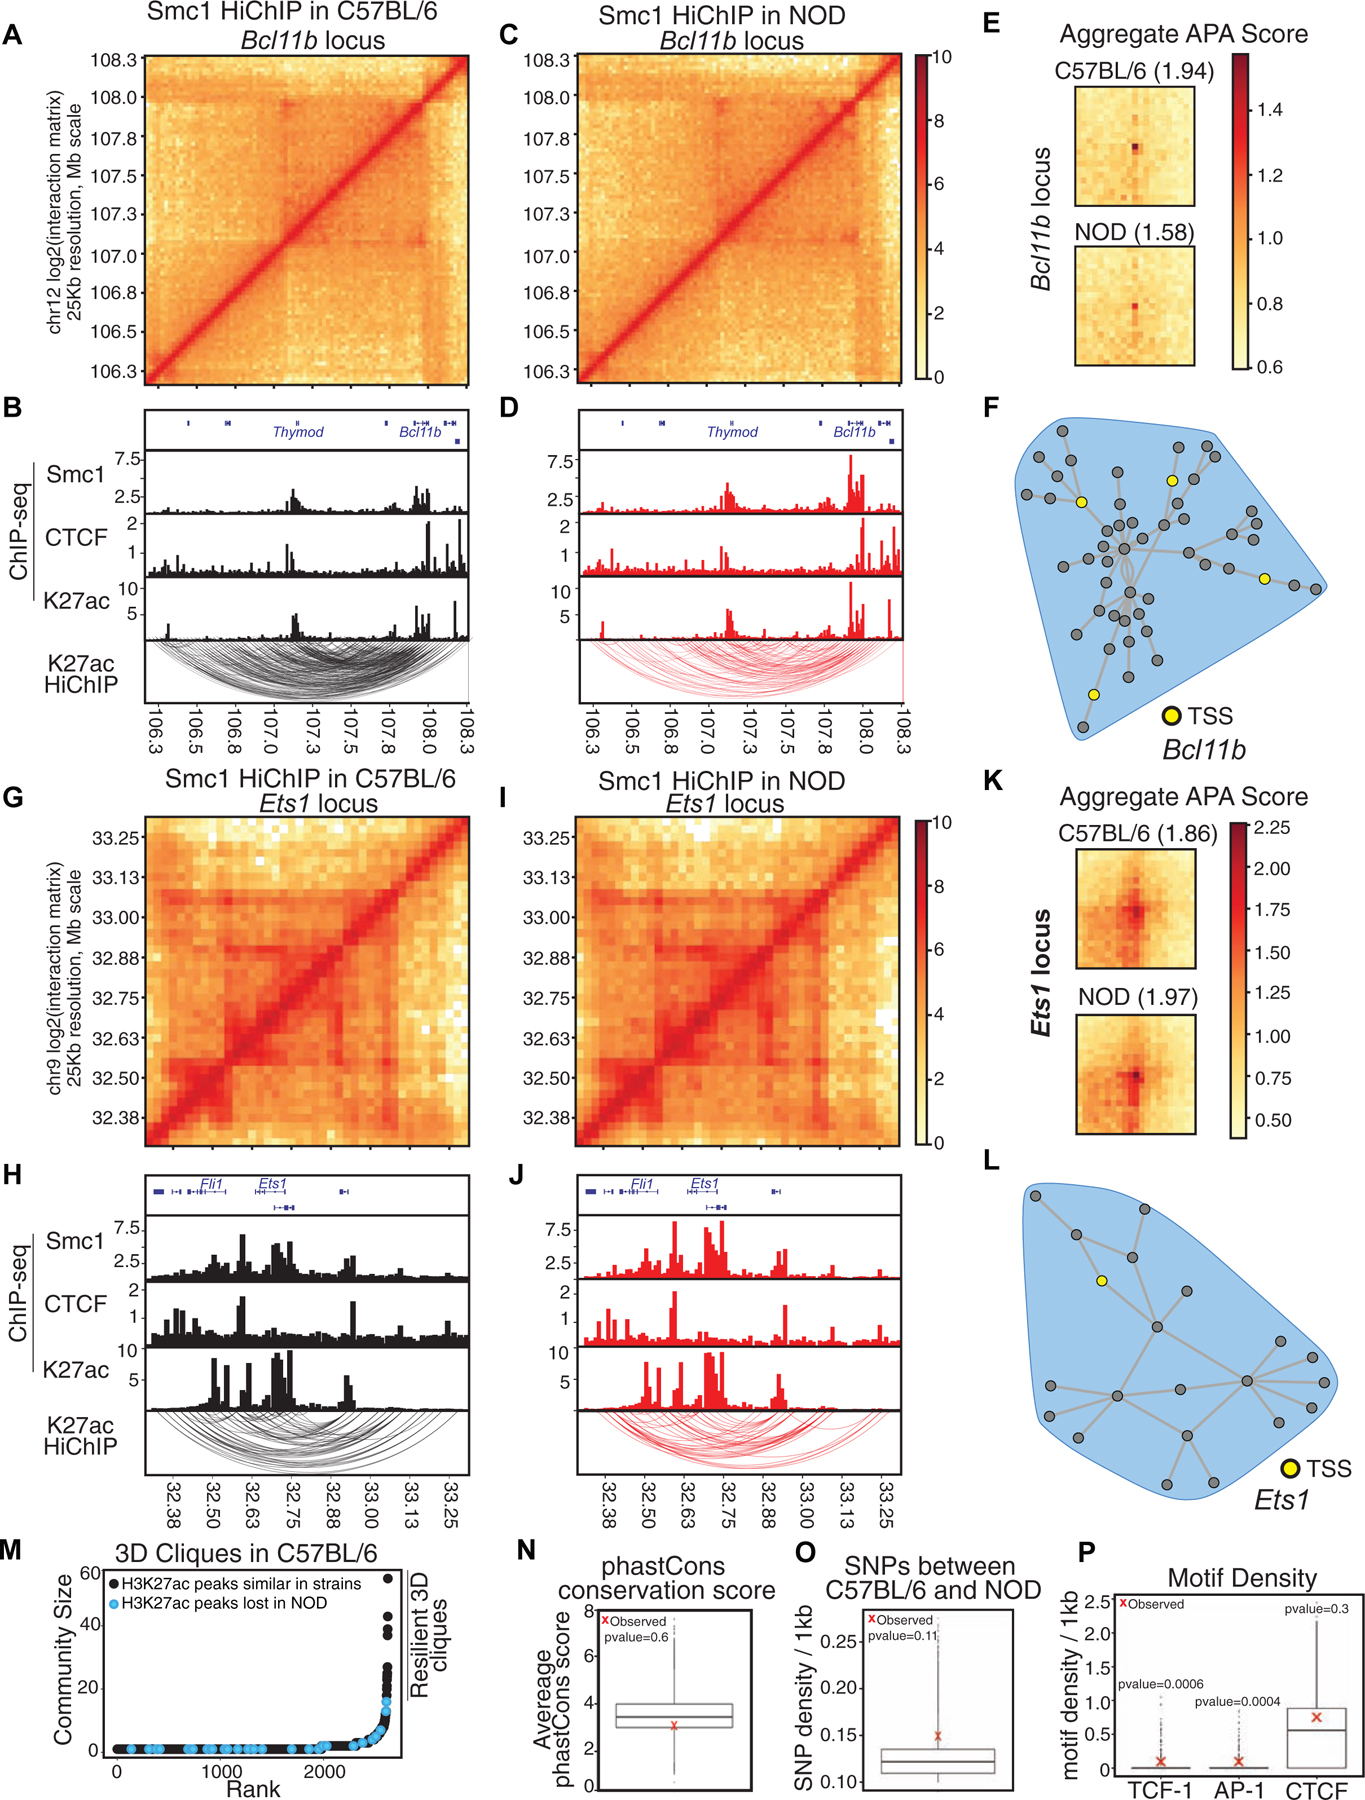
(A-L) Contact matrices based on Smc1 HiChIP for regions harboring T cell development genes Bcl11b (A, C) and Ets1 (G, I). Genome browser views of Smc1, CTCF, H3K27ac ChIP-seq and reproducible significant loops from H3K27ac HiChIP for Bcl11b (B, D) and Ets1 (H, J) in both strains. (E, K) Aggregate peak analysis (APA) was used to measure the strength of the Smc1 HiChIP loops in contact matrices from both strains in Bcl11b (E) and Ets1 regions (K).
(M) Hockey plot demonstrates 3D clique analysis for Smc1 HiChIP in C57BL/6 mice. 3D cliques harboring at least one enhancer with loss of accessibility in NOD mice (i.e. being selectively acetylated (H3K27ac) in C57BL/6) are marked in black. The top hyperconnected 3D cliques harboring only strain-similar enhancers are marked as ‘resilient 3D cliques’.
(N-O) Boxplot represents the average phastCons score (N) and distribution of SNPs per 1kbp (O) at nodes of 100,000 permuted hyperconnected 3D cliques. Red X represents the average SNPs per 1kbp at nodes of 17 resilient hyperconnected 3D cliques.
(P) Boxplot represents the distribution of TCF, AP-1 and CTCF motif density per 1kbp at nodes of 100,000 permuted hyperconnected 3D cliques. Red X represents the average density of TCF, AP-1 and CTCF motif per 1kbp at nodes of resilient hyperconnected 3D cliques.
The contact matrix representations of Smc1 HiChIP (Figures 4 A, C, G, and I) and 3D community topology of hyperconnected 3D cliques (Figures 4F and L) demonstrated hyperconnectivity of these loci. Further measurement of 3D genome interactions between active enhancers by H3K27ac HiChIP corroborated hyperconnectivity of these regulatory elements in two strains (Figures 4B, D, H, and J; Table S4). To quantitatively compare the strength of 3D genome interactions between C57BL/6 and NOD mice at hyperconnected loci, we performed Aggregate Peak Analysis (APA) (Rao et al., 2014). Although the comparison of the APA scores of individual interactions may indicate some 3D differences at two loci (Figures S4D–E), the overall APA scores of interactions between the two strains suggested comparable contact strength at these loci (Figures 4 E and K). Notably, Bcl11b and Ets1 had comparable expression between strains and scanning the linear genome features of shared 3D cliques also indicated no significant difference between the two strains at these two loci (Figure 4 B, D, H, and J). Moreover, the differential loop analysis of all reproducible loops using DESeq2 corroborated no significant difference in contact frequency strength at these two loci between strains (STAR Methods; Table S5). Systematic investigation of the spatial organization of strain-specific enhancers also corroborated that enhancers within the top hyperconnected 3D cliques in C57BL/6 demonstrated similar H3K27ac in both strains (Figure 4M). Hereafter, we referred to the top hyperconnected 3D cliques that contain strain-similar enhancers as “resilient 3D cliques”.
Next, we assessed whether the underlying DNA sequence at resilient 3D cliques was highly conserved, which would explain why the hyperconnected 3D clique signatures were comparable between strains. We quantitated the average number of SNPs and Indels in addition to the evolutionary sequence conservation scores between strains at enhancers of resilient cliques and compared them with randomly permuted 3D cliques. We found comparable conservation scores across 60 vertebrate species between resilient 3D cliques and their random permutations (Figure 4N; p-value=0.6). DNA sequence variations were also uniformly distributed across resilient 3D cliques and their random permutations (Figure 4O; p-value=0.11). Hence, an alternative mechanism may establish epigenomic resiliency at shared hyperconnected 3D cliques accommodating T cell development genes.
We then examined whether lineage-determining transcription factors such as TCF-1, which is essential in creating the chromatin accessibility landscape of T cells in development (Johnson et al., 2018), or AP-1 proteins, which can engage in enhancer hub formation (Phanstiel et al., 2017), can contribute to epigenomic resiliency at 3D cliques harboring T cell identity genes. We found a statistically significant higher density of TCF and AP-1 (p-value=0.0006), but not CTCF binding motifs (p-value=0.3), at resilient 3D cliques in comparison with 100,000 randomly permuted 3D cliques (Figure 4P). Supporting the enrichment of the TCF motif, the density of TCF-1, but not CTCF binding events, were also higher in resilient 3D cliques compared with permuted cliques; although the difference did not reach statistical significance (Figure S4F). Together, our data demonstrated that megabase domains harboring genes with essential roles in T cell development had 1D and 3D epigenomic signatures that were resilient to genetic variation between NOD and C57BL/6 mice.
Diabetes-associated regions form hyperconnected 3D cliques in NOD mice
Next, we inspected unique features of the spatial genome organization in T cells of NOD mice (Figure 5). The 3D communities in this strain also demonstrated asymmetry in the clique connectivity distribution (Figure S4A). More than 40% of differentially expressed genes in NOD mice overlapping Smc1 HiChIP loop anchors fell within 3D communities with regulatory elements demonstrating differential accessibility in NOD compared with C57BL/6 mice (Figure S4G). The hyperconnected 3D cliques in NOD showed similar enrichment of polymorphisms and sequence conservation in comparison with regular cliques (Figure S4H; p-value=0.9 and 0.2, respectively; Kolmogorov-Smirnov test). Genes in hyperconnected 3D cliques of NOD mice were enriched in ‘T cell activation’ and ‘cytokine production’ ontologies (Figure S4I).
Figure 5. Diabetes-associated regions form hyperconnected 3D cliques in NOD mice.
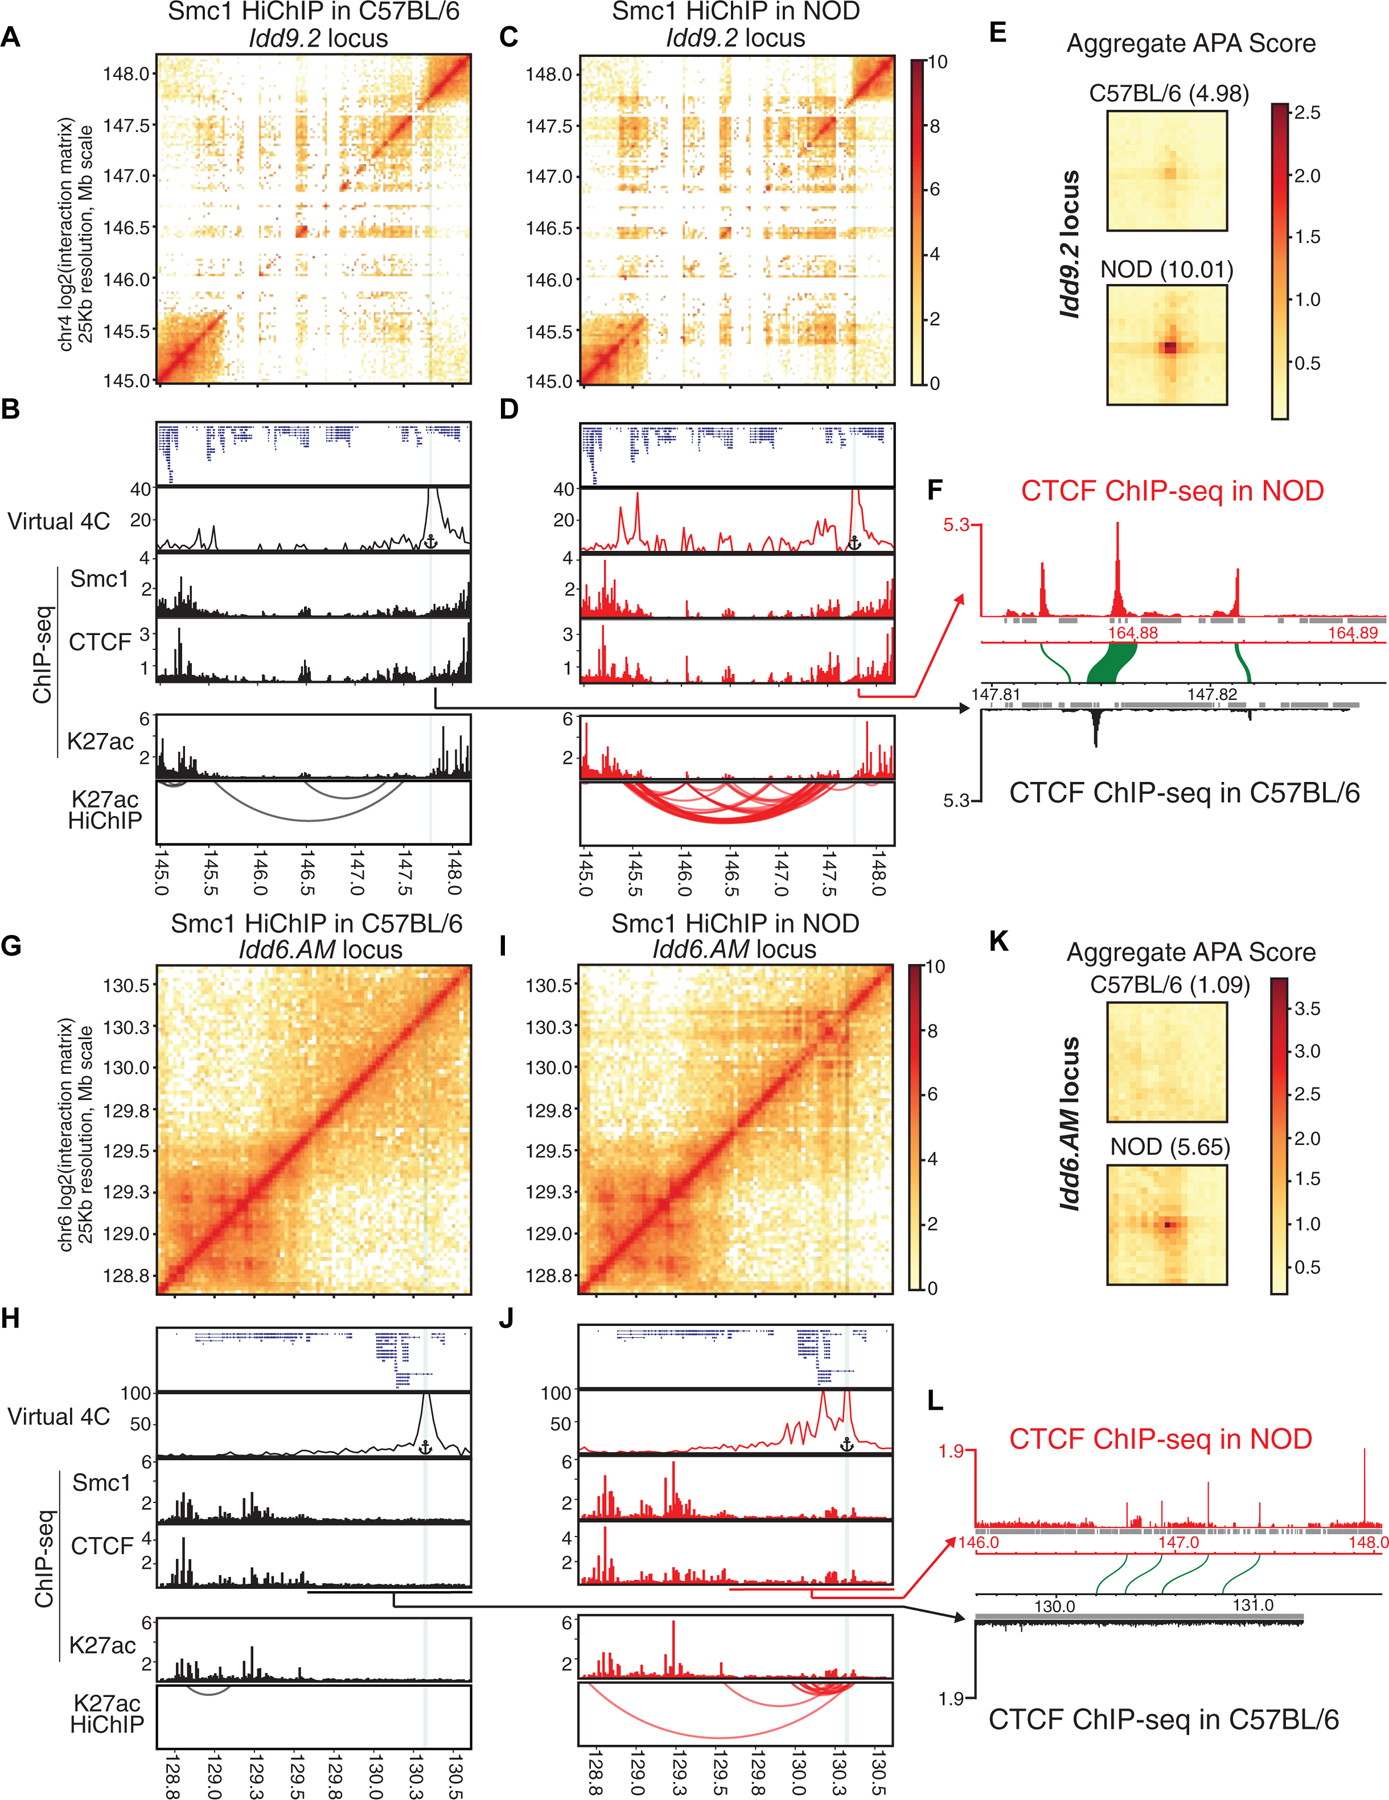
(A-L) Contact matrices based on Smc1 HiChIP in C57BL/6 and NOD strains at the NOD-specific hyperconnected regions harboring Idd9.2 (A, C) and Idd6.AM (G, I). Virtual 4C plot at the highlighted anchor, genome browser views of Smc1, CTCF, H3K27ac ChIP-seq and reproducible significant loops from H3K27ac HiChIP for Idd9.2 (B, D) and Idd6.AM (H, J) in both strains. Virtual 4C plot quantifies the connections of the highlighted anchor to other regions. (E, K) Aggregate peak analysis (APA) was used to measure the strength of the Smc1 HiChIP loops in contact matrices from both strains in Idd9.2 (E) and Idd6.AM regions (K).
(F and L) CTCF binding in NOD de novo assembled genome and the orthologous relationship with C57BL/6 genome in the syntenic regions of Idd9.2 (F) and Idd6.AM (L). At the Idd9.2 locus in the NOD genome (F), we observed a region at the boundary containing three CTCF binding events, of which the sequence of only one binding site is well conserved in C57BL/6 genome (synteny of CTCF binding events are depicted as green arcs). At the Idd6.AM locus (L), there is one unique CTCF binding site in NOD genome that does not have orthologous sequence in the corresponding region in C57BL/6 genome (L). Repetitive regions are depicted in grey.
While T cell identity genes such as Bcl11b and Ets1 were highly connected in both strains, two hyperconnected 3D cliques, scored first and tenth in NOD, were only present in T cells of this strain (Figure S4A; Tables S5–S6). These two NOD-specific hyperconnected 3D cliques overlapped with two disease-associated loci, namely Idd9.2 (Figures 5A–F) and Idd6.AM (Figures 5G–L). The Smc1-mediated 3D interactions depicted in contact matrices and the virtual 4C analysis at one anchor (Figures 5 A, C, G, I, and S4J) demonstrated a clear distinction in 3D genome organization between T cells of C57BL/6 and NOD mice at these domains. Moreover, the genome browser views of H3K27ac-mediated corroborated these results (Figures 5B, D, H, and J). The quantitative comparison of the strength of 3D genome interactions between C57BL/6 and NOD mice at Idd loci further supported the selective designation of these regions as hyperconnected in NOD (Figures 5E and K; Table S5). Interchromosomal interactions were also detected between Idd9.2 and Idd6.AM regions (Table S6). Supporting strain-specific spatial contacts in NOD mice, 15 genes located within these regions exhibited higher mRNA in this strain compared with C57BL/6 mice, including Zfp979, which was selectively expressed in NOD T cells (Figures S4K–M). We were not able to detect significant enrichment of TCF-1 or AP-1 motifs compared with permuted 3D networks (Figure S4N).
The top hyperconnected 3D clique in NOD T cells containing Idd9.2 is located on chromosome 4, which harbors a cluster of genes encoding KRAB-ZFPs (Wolf et al., 2015). Previous studies showed the functional relevance of this megabase pair interval in conferring diabetes in NOD mice: Idd9.2 congenic mice, in which the NOD Idd9.2 chromosomal region is replaced by the Idd9.2 region from T1D-resistant C57BL/10 mice, referred to as B10.Idd9, are significantly protected from T1D development (Berry et al., 2015; Chen et al., 2008; Hamilton-Williams et al., 2010; Lyons et al., 2000). Our analysis of publicly available expression data (Berry et al., 2015) revealed the increased expression of genes within the hyperconnected 3D clique, in particular Zfp979 and Zfp985, in CD4+ T cells of NOD mice compared to the diabetes-resistant B10.Idd9.2 congenic mice even when both strains carried a transgenic TCR derived from a diabetogenic NOD T cell clone (Figure S5A) (Katz et al., 1993). In addition to the diabetic phenotype, a specific T cell defect of NOD mice has also been linked to this Idd region (Yui et al., 2013). An early T cell developmental checkpoint breakthrough in Rag-1-deficient NOD mice indicates major defects in the earliest stages of T cell development in the thymus. Despite the absence of TCR expression in Rag-1-deficient NOD mice, aberrant breakthrough DP thymocytes spontaneously appear in all young adult animals (Yui and Rothenberg, 2004). Hence, our results together with published studies on Idd9.2 suggested the importance of 3D chromatin misfolding of Idd9.2 and the increased expression of KRAB-ZFPs in T cell development and autoimmunity in NOD mice.
The Idd6.AM region, scored as the 10th most hyperconnected domain in NOD mice, contains a gene cluster of Ly49 and human killer cell immunoglobulin-like receptors genes, which are known to be involved in autoimmunity (Rahim and Makrigiannis, 2015). This hyperconnected domain also harbors Cd69, which contains an intronic T1D-associated SNP in humans (Barrett et al., 2009). Thus, mapping the spatial genome organization of T cells in young male NOD mice long before disease onset indicates aberrant chromatin folding and gene transcription at large genomic domains that have been previously implicated in human T1D susceptibility.
NOD-specific sequences are bound by CTCF at the boundary of hyperconnected 3D cliques in NOD mice
We next sought to determine whether the architectural protein CTCF was differentially bound at these Idd regions in C57BL/6 versus NOD, carriying out CTCF ChIP-seq in both strains (Figures 5B, D, F, H, J, L, and S5B–D). When comparing CTCF binding at the two loci that were similarly hyperconnected between the two strains, i.e. the Bcl11b and Ets1 regions, to loci that differed between the two strains, i.e. the Idd9.2 and Idd6.AM regions, an interesting pattern emerged. At loci that were similarly hyperconnected between the two strains, the location and strength of CTCF binding were comparable across the two strains (Figure S5B). However, at the two Idd regions that were hyperconnected in NOD, but not C57BL/6, there were multiple subregions that contained more CTCF binding events in NOD than in C57BL/6 (Figure S5B). The two NOD-specific hyperconnected Idd regions had a greater number of strain-specific CTCF binding events than those regions that were similarly hyperconnected between the two strains (Figure S5C). Notably, a large proportion of these strain-specific CTCF binding sites within the Idd regions overlapped with genetic variations and all contained CTCF motifs (Figures S5 C–D).
Detecting distinct Smc1-mediated loops originating at boundaries of hyperconnected regions in NOD mice (blue arcs in Figure S5B) prompted us to examine if structural variations in T cells of NOD mice contributed to the rewiring of the 3D genome at these loci. Thus far, to be able to compare 1D and 3D genomic measurements in NOD and C57BL/6 mice, we shifted the NOD datasets to the mm10 reference genome. We next focused on CTCF binding events in unshifted NOD data, containing sequences unique to the NOD genome (Figures 5F and L). At the Idd9.2 locus in the NOD genome, we observed a region at the boundary containing three CTCF binding events, of which the sequence of only one binding site was well conserved in C57BL/6 genome (Figure 5F). Similarly at the Idd6.AM locus, there was one unique CTCF binding site in the NOD genome without an orthologous sequence in C57BL/6 genome (Figure 5L). These results suggested a critical role of these CTCF binding sequences as boundary elements in hyperconnected 3D cliques in NOD mice (Figures 5F and L). Together, nucleotide differences including structural variation may contribute to alterations in the cistrome of the architectural protein CTCF within Idd regions, corresponding to differences we observe in cohesin-mediated connectivity within these loci.
Oligopaint FISH corroborates the formation of strain-similar and diabetes-specific hyperconnected 3D cliques
Biochemical methods such as high-throughput chromosome conformation capture (Hi-C) or HiChIP provide genome-wide, unbiased maps of contact frequencies, a proxy for how often any given pair of loci are sufficiently close in space to be captured together (Finn et al., 2019). These genomic assays are performed on millions of cells, generating averaged snapshots of the population with limited information on variability between individual cells. We next sought to establish how hyperconnected 3D cliques detected by HiChIP contact frequencies relate to physical distances between interaction partners across individual cells using the flexible, scalable and high-resolution “Oligopaint” DNA fluorescence in situ hybridization (FISH) technology with confocal imaging in 3D (Beliveau et al., 2015; Beliveau et al., 2012). Further rationale to use imaging to map genome folding was to quantitatively measure the spatial proximity of DNA loci independent of any antibody, independent of a sequencing technology, and at the single-cell resolution. We designed probes spanning 50 kbp regions using oligonucleotide libraries produced by massively parallel synthesis at the anchors of four hyperconnected 3D cliques: two strain-similar regions, Bcl11b and Ets1, and two diabetes-associated regions, Idd9.2 and Idd6.AM. To corroborate the multi-enhancer contacts identified via HiChIP, three interacting regions were chosen per clique ranging from ~100kbp to ~950kbp in linear distance (Figure 6; E1, E2, E3; Table S6).
Figure 6. Oligopaint 3D FISH corroborates the formation of strain-similar and diabetes-specific hyperconnected 3D cliques.
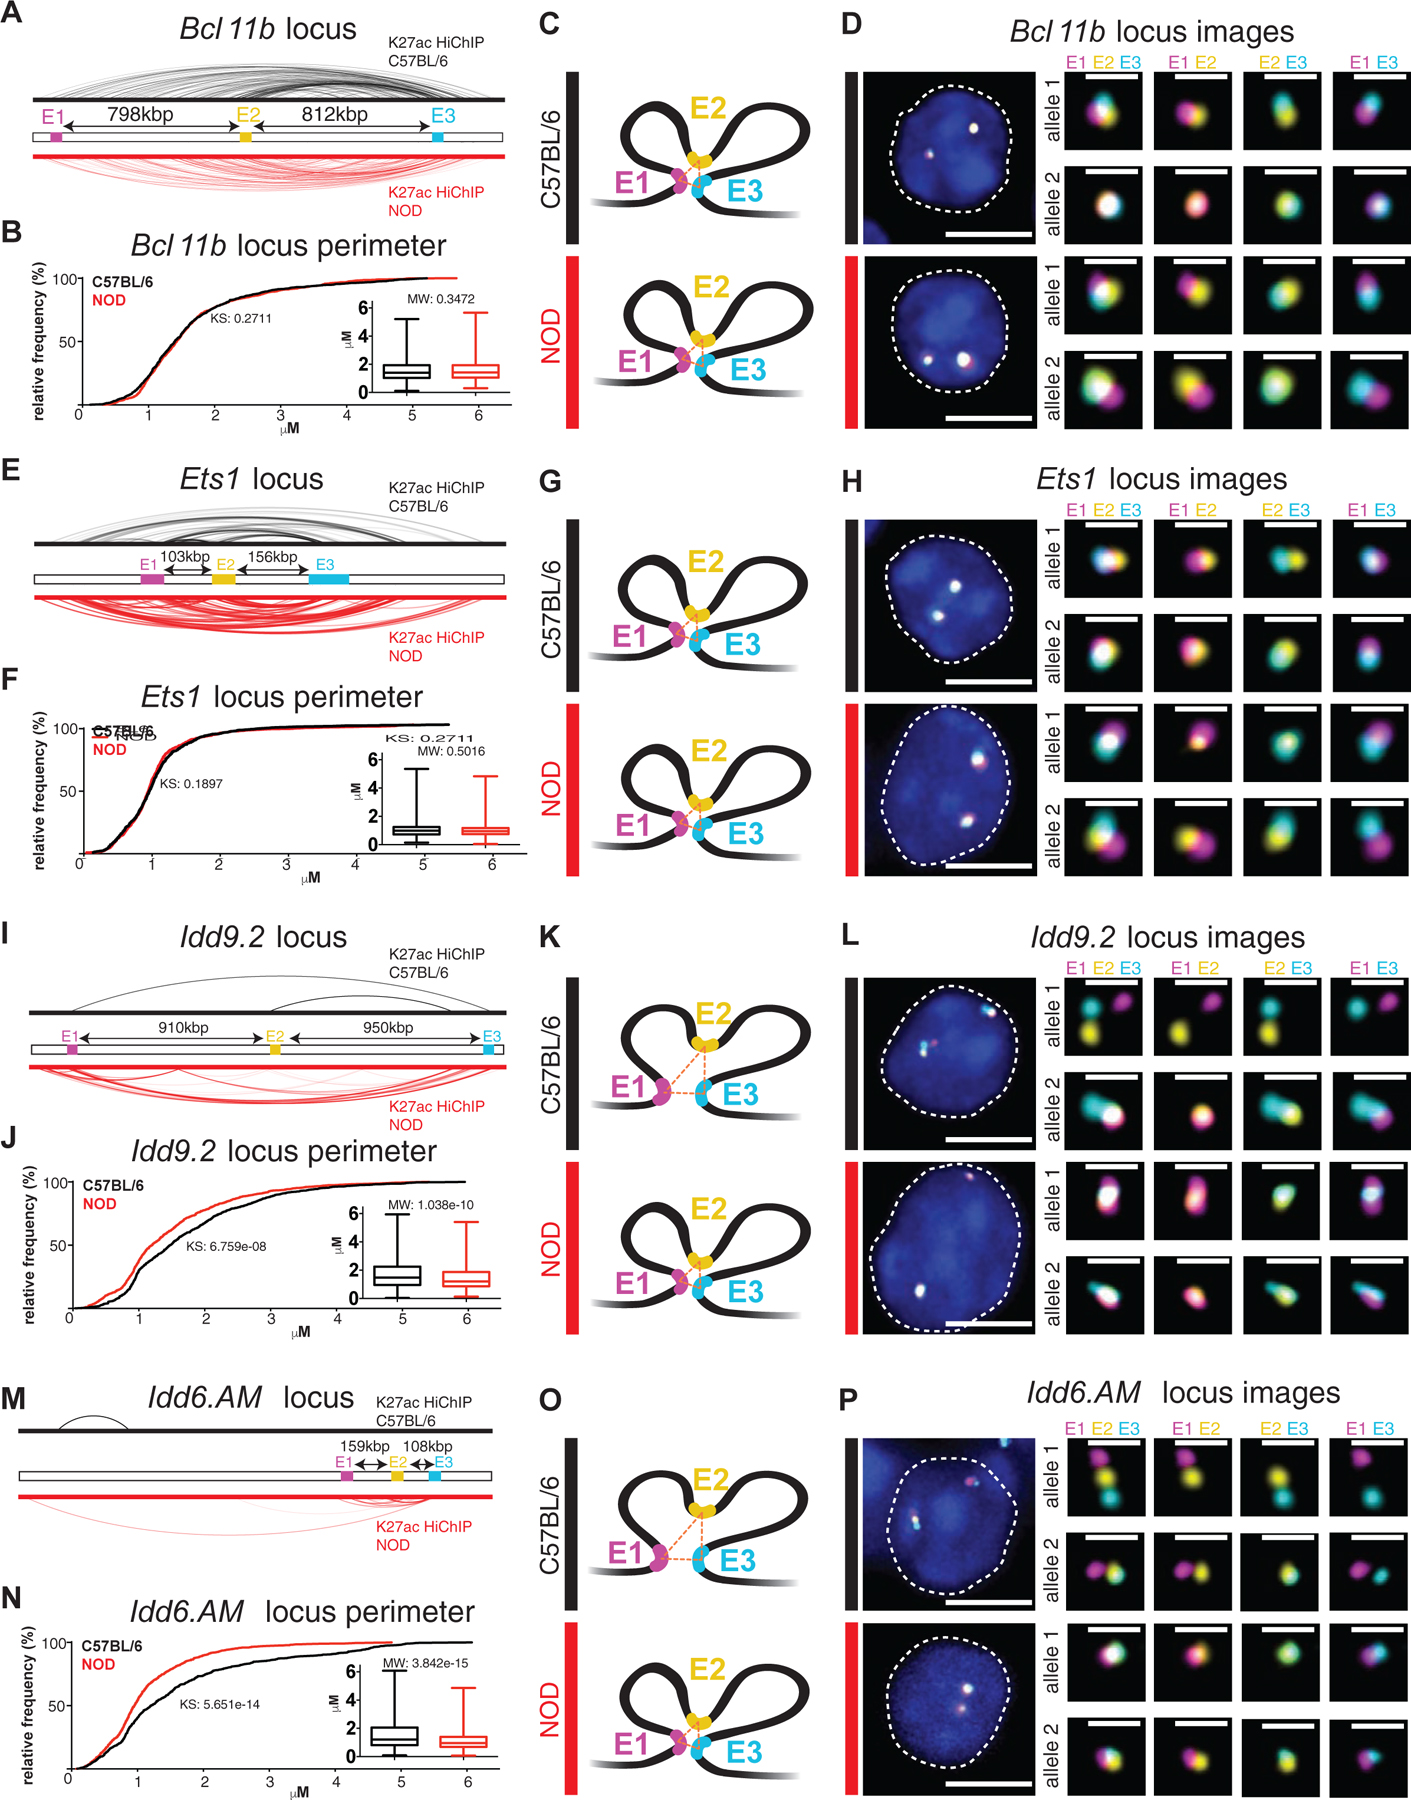
H3K27ac-HiChIP contacts in C57BL/6 (black) and NOD (red) at the Bcl11b locus (A), Ets1 locus (E), Idd9.2 locus (I), and Idd6.AM locus (M) with E1 (Enhancer 1, magenta), E2 (Enhancer 2, yellow), and E3 (Enhancer 3, cyan) representing the 3 independent 50kbp genomic regions for which Oligopaint probes were designed. Arrows indicate the linear distance between probes. The probes in the Bcl11b clique spanned a distal enhancer (E1), the noncoding RNA ThymoD (E2), and the Bcl11b gene (E3). The probes in the Ets1 clique spanned the Fli1 gene (E1), the Ets1 gene (E2), and the noncoding RNA Gm27162 (E3). The probes in the Idd9.2 clique spanned a distal enhancer (E1), the Zfp982 (E2) gene, and the Zfp981 gene proximal to Zfp985 gene (E3). The probes in the Idd6.AM clique spanned the Klra19 (E1), Klra7 (E2), and Klra1 (E3) genes. Cumulative distribution plots and box plots of the spatial perimeter formed by the three probes in ~500 cells (see Materials & Methods for exact numbers) per condition per locus at the Bcl11b locus (B), Ets1 locus (F), Idd9.2 locus (J), and Idd6.AM locus (N) (KS: Kolmogorov-Smirnov test & MW: Mann-Whitney test). Models representing the relative spatial perimeter formed by the three probes in C57BL/6 (black) and NOD (red) based on the cumulative distribution and box plots at the Bcl11b locus (C), Ets1 locus (G), Idd9.2 locus (K), and Idd6.AM locus (O). Representative images of the Oligopaint FISH probes in one cell per strain (C57BL/6: black and NOD: red) with magnification of each allele (DAPI: blue, E1: magenta, E2: yellow, E3: cyan, scale bar in whole cell image: 5 μM, & scale bar in magnification of alleles: 1 μM) at the Bcl11b locus (D), Ets1 locus (H), Idd9.2 locus (L), and Idd6.AM locus (P).
Approximately 500 double-positive CD4+CD8+ T cells per clique were imaged by confocal microscopy from the thymus of 4-week old male mice per mouse strain. We calculated the distance between each pair of loci and the spatial perimeter (Figures 6 C, G, K, and O) or the area formed by three loci. The direct measurement of the 3D distance between loci in individual T cells demonstrated the spatial proximity of interacting partners within the 3D cliques at the Bcl11b and Ets1 loci, which was similar between NOD and C57BL/6 mice (Figures 6 A–H and S6 A–B, E–J). In contrast, at the Idd9.2 and Idd6.AM domains, the enhancers were in significantly closer proximity in T cells of NOD compared with C57BL/6 (Figures 6 I–P and S6 C–D, K–P). Similarities and differences at these four genomic loci were reproduced in a biological replicate (Figure S6 Q–X). Hence, our optical mapping of 3D genome organization independent of a sequencing technology at the single-cell resolution confirmed the formation of “cliques” and simultaneous “triplet” interactions in both strain-specific and strain-similar manners. Together, visualizing the nuclear architecture across individual T cells confirmed chromatin misfolding at previously described disease-associated regions, providing insight into the molecular mechanisms governing T1D.
Cis-effect of sequence variation on hyperconnected 3D clique formation
Our genomics and imaging data suggest that regulatory elements of Idd regions are in close spatial proximity in T cells of diabetes-susceptible mice. Despite the presence of NOD-specific CTCF sequences at the boundary of hyperconnected regions, it remains unclear whether the 3D genome reorganization of Idd regions is mediated by sequence variation in the NOD genome in cis, or if these changes are due to trans-acting factors. To examine which of these two scenarios occurs, we performed Smc1 HiChIP in T cells of F1 offspring (NOD × C57BL/6). We reasoned that if nucleotide differences between C57BL/6 and NOD mice at Idd regions contribute to reorganization of the 3D regulatory landscape in NOD mice, then in F1 mice, the NOD-specific 3D cliques form only on the NOD allele, demonstrating a cis effect. On the other hand, if changes in transcriptional outputs of T cells in NOD mice such as the differential expression of transcription factors are responsible for the 3D genome reorganization, then both C57BL/6 and NOD alleles would form 3D cliques since such proteins are expressed in T cells of F1 mice, implicating a trans mechanism.
To test which one of the two scenarios occurred in T cells of F1 mice, we quantitated the strength of Smc1 contacts at Idd regions and compared them with parental strains following two distinct analytical strategies. We first aligned sequences from F1 HiChIP data to a reference genome masked for SNPs and Indels in the NOD genome, allowing the aligner to map reads from either allele (Figure 7). We reasoned that if the reconfiguration of genome is mediated in trans, i.e. occurring on the C57BL/6 allele as well, the Smc1 contact strength in T cells of F1 mice should be comparable to the Smc1 contact strength in T cells of NOD mice. On the other hand, if the 3D genome reconfiguration was mediated in cis, i.e. only occurring on the NOD allele, the Smc1 contact strength in T cells of F1 mice should be stronger than C57BL/6 but weaker than the NOD parental cells. The visualization of Smc1 contact strength (Figures 7A–B and S7A–B) and APA scores of parental Smc1 interactions (Figures 7C–D) at both Idd9.2 and Idd6.AM regions in three strains clearly showed the 3D interactions of F1 mice to be approximately half of the 3D interactions of NOD mice, indicating the cis effect at Idd regions. In contrast, the APA analysis at the strain-similar Ets1 locus demonstrated comparable Smc1-mediated interactions in the three strains (Figure S7C). In our second approach, we performed allele-specific alignment for the F1 HiChIP by HiC-Pro (Servant et al., 2015) and were able to clearly demonstrate the enrichment of NOD-allele-specific sequences at both Idd regions (Figures S7D–E). Of note, 55% of parental NOD-specific Smc1 binding events demonstrated NOD-allele specific binding in F1 mice including at the Idd loci (Figures S7F and Table S2). Together, the 3D chromatin misfolding at diabetes-associated loci in NOD mice is mediated in cis, likely due to the NOD-specific CTCF binding events.
Figure 7. 3D chromatin misfolding at diabetes-associated loci in NOD mice is mediated in cis and is linked to human T1D.
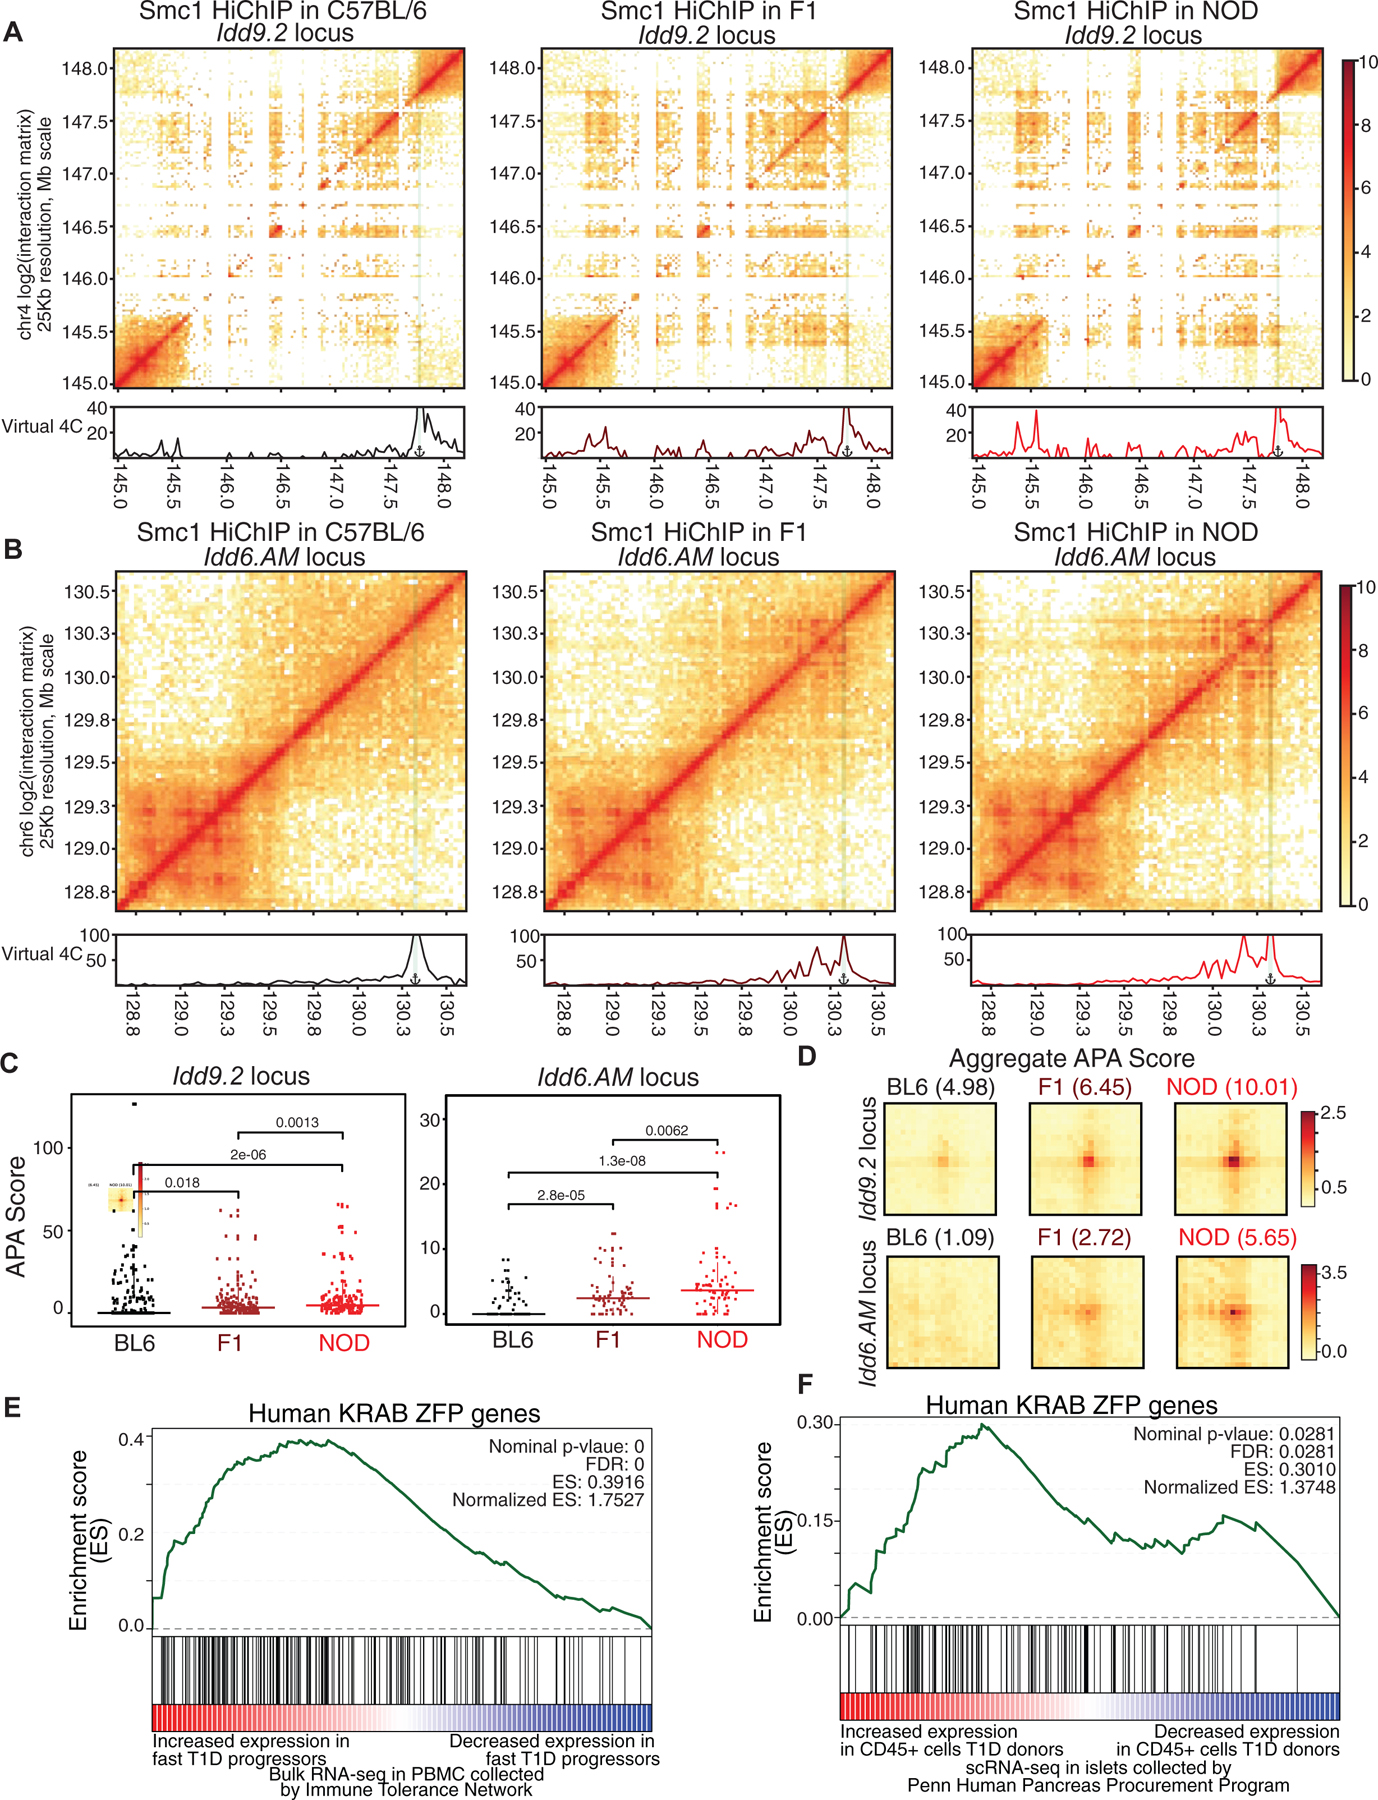
(A, B) Contact matrices based on Smc1 HiChIP for the region harboring Idd9.2 (A) and Idd6.AM (B) in C57BL/6 (left), NOD (right) and F1 offspring (middle). Virtual 4C plot quantifies the connections of the highlighted anchor to other regions.
(C) APA score for each individual Smc1 HiChIP loop was used to quantify the strength in the two NOD-specific hyperconnected regions. Pairwise comparisons were done with Wilcoxon rank sum test.
(D) APA scores for all of the Smc1 HiChIP loops were used to quantify the strength of all loops in C57BL/6, NOD and F1 at the two hyperconnected regions.
The GSEA analysis for KRAB-ZFP gene set in genes with increased expression in fast progressors (E) or in CD45+ cells in islets of T1D deceased donors collected by HPAP (F).
Expression of KRAB-ZFP family genes is increased in human T1D
The functional relevance of the Idd9.2 megabase region on T cell development and autoimmunity in NOD mice has been clearly established (Berry et al., 2015; Chen et al., 2008; Feng et al., 2011a; Hamilton-Williams et al., 2010; Lyons et al., 2000; Yui et al., 2013). This region harbors the cluster of KRAB-ZFP family genes which constitute the most rapidly evolving gene family in vertebrates (Bruno et al., 2019). KRAB-ZFPs bind to specific endogenous retroviruses (ERV) and repress their transcription. Deregulation of ERV transcription has been implicated in autoimmunity (Treger et al., 2019). To address the relevance of increased expression of KRAB-ZFPs in NOD mice to human T1D, we first exploited publicly available bulk RNA-seq data in peripheral blood of 138 T1D subjects collected from clinical trials conducted by the Immune Tolerance Network (ITN) and Type 1 Diabetes TrialNet (TrialNet), investigating transcriptional changes associated with T1D progression in the period immediately following diagnosis (Dufort et al., 2019). This study assessed the rate of T1D progression after diagnosis and generated 471 RNA-seq data sets in these subjects. Subjects were further grouped into fast and slow progressors based on the rate of C-peptide loss (Dufort et al., 2019). We examined the enrichment of KRAB-ZFP genes in humans (Imbeault et al., 2017) with respect to differentially expressed genes in fast progressor T1D subjects compared with slow progressors. Our GSEA analysis demonstrated a significant enrichment of the KRAB-ZFP gene-set in genes with increased expression in fast progressors with the ZFP57 gene being the 8th most selectively expressed gene in fast progressor patients, consistent with a role for KRAB-ZFP proteins in disease progression (Figure 7E).
Considering that bulk RNA-seq in cells from the peripheral blood may not directly reflect the changes in gene expression associated with T1D, we next measured transcriptional signatures of the immune cell population in islets of T1D organ donors at a single-cell resolution. Pancreatic islets were procured by the Human Pancreas Analysis Program (HPAP) and subjected to single-cell RNA sequencing. We focused on the single-cell RNA-seq data of islets from 14 control, autoantibody positive, and T1D deceased donors (Table S7). Following a computational workflow (STAR Method), we identified immune cells (CD45+ (PTPRC) cells) in the pancreas of these donors (Figure S7G). We found that the KRAB-ZFP genes demonstrated increased expression in immune cells in the pancreas of T1D organ donors compared with autoantibody positive control donors using GSEA analysis (Figure 7F). Together, while the KRAB-ZFPs themselves evolve rapidly in vertebrates, the increased expression of this pathway is conserved in the mouse model of T1D and humans.
Discussion
Here, we set out to address the challenge of identifying the 3D genome features that distinguish autoimmune diseases often driven by the large numbers of variants with small effect sizes. We generated high-resolution maps of linear and 3D genome organization of T lymphocytes in diabetes-susceptible NOD and diabetes-resistant C57BL/6 mice long before disease onset to isolate the effect of genetic susceptibility. We detected the formation of multi-enhancer interactions at genomic regions harboring genes with prominent roles in T cell development in both strains. However, diabetes risk-conferring loci coalesced enhancers and promoters in diabetes-susceptible mice, but not controls, forming hyperconnected 3D cliques where these 3D interactions were mediated in cis. Optical mapping of the nuclear organization confirmed the spatial proximity of regulatory elements within the risk-conferring genomic regions independent of a sequencing technology at single-cell resolution. Thus, our study narrows down the pathogenicity of megabase Idd regions to a few CTCF binding sites including some non-conserved regions between the two genomes that may contribute to chromatin misfolding long before disease onset. Despite these findings, our study also raised several critical questions. The detailed molecular mechanism governing the diabetes-specific 3D genome misfolding and the dynamic of such misfolding events remain to be understood. Moreover, it is essential to describe whether the 3D genome is reorganized in human T1D at KRAB-ZFP genes or other loci.
Our understanding of the nuclear architecture has improved dramatically over the past decade, mainly due to parallel developments in microscopy and molecular methods for capturing the spatial genome organization (Beagrie et al., 2017). The latest reports exploiting these methods corroborate the formation of multi-enhancer contacts, variously called cis-regulatory domains (CRDs) (Link et al., 2018a), activation hubs (Phanstiel et al., 2017), interacting triplets (Beagrie et al., 2017), connected gene communities (Boudaoud et al., 2017), or 3D cliques (Petrovic et al., 2019), all contained within topologically associated domains (Dixon et al., 2012). Despite these observations, it remains unclear how multi-enhancer interactions in 3D are associated with any disease. Our study demonstrated how genetic variants associated with an autoimmune disease can modulate multi-enhancer contacts at megabase resolution to influence gene expression.
The expanding catalogue of disease-associated DNA variants enriched at non-coding genomic sequences provided the rationale for many groups to identify target genes due to disrupted long-range enhancer-promoter interactions caused by genetic variations. However, it is still unclear whether the disease-associated DNA variants can lead to large-scale changes on the 3D genome architecture, going beyond disrupting just one enhancer-promoter loop. Moreover, although great progress has been made in the detection of SNPs in complex diseases such as T1D, we know much less about the contribution of structural variations such as insertions and deletions in these disorders. Mapping the spatial genome organization by complementary HiChIP and Oligopaint techniques, we report here evidence that genetic variation can be linked to chromatin misfolding and aberrant gene expression in T cells even before they leave the thymus. The KRAB-ZFP family genes which are located within NOD-specific hyperconnected cliques are more expressed in the immune cell population of the pancreas of human donors with type 1 diabetes, suggesting the evolutionary conservation of this pathway and its relevance to disease progression. Considering that deregulation of this pathway has been recently reported in lupus (Treger et al., 2019), another autoimmune disease, examining whether chromatin misfolding at KRAB-ZFP family genes also occurs in humans can enhance our understanding of the molecular etiology of these diseases.
STAR Methods
LEAD CONTACT AND MATERIALS AVAILABILITY
Further information and requests for resources and reagents should be directed to and will be fulfilled by the Lead Contact, Golnaz Vahedi (vahedi@pennmedicine.upenn.edu). This study did not generate new unique reagents.
EXPERIMENTAL MODEL AND SUBJECT DETAILS
Mice (BL6/NOD/F1)
Female and male breeder C57BL/6J (C57BL/6) and NOD/ShiLtJ (NOD) mice were obtained from Jackson Laboratory. Mice were housed with a 12h/12h light/dark cycle with ad libitum food and water. For F1 generation, female C57BL/6 mice were crossed with male NOD mice. All mice used in this study were 3–5 week old virgin males. All animal work was in accordance with the Institutional Animal Care and Use Committee of the University of Pennsylvania in accordance with NIH guidelines.
Human islets
Pancreatic islets were procured from the HPAP consortium under Human Islet Research Network (https://hirnetwork.org/) with approval from the University of Florida Institutional Review Board (IRB # 201600029) and the United Network for Organ Sharing (UNOS). A legal representative for each donor provided informed consent prior to organ retrieval. For T1D diagnosis, medical charts were reviewed and C-peptide was measured in accordance with the American Diabetes Association guidelines. Organs were recovered and processed as previously described (Campbell-Thompson et al., 2012). Table S7 summarizes donor information.
METHOD DETAILS
Cell sorting
Thymi of mice were dissociated through a 70μM mesh filter (Falcon) in RPMI 1640 (Corning) with 1% FBS (Sigma-Aldrich), and single cell suspensions were stained with 7AAD (Biolegend) for live cell distinction, as well as PE CD4 (RM404) and APC CD8a (53–6.7) for double-positive CD4+ CD8+ T cell isolation. Sorting was performed on FACS Aria II (BD Biosciences), with forward scatter–height by forward scatter–width and side scatter–height by side scatter–width parameters being used to exclude doublets. Purity was verified after sorting.
Magnetic bead cell separation
For CTCF and Smc1 ChIP-seq experiments DP CD4+ and CD8+ cells were obtained with magnetic bead-based cell separation. Thymocytes were isolated by dissociating the thymus through a 70μM filter (Falcon) in RPMI (Corning) with 1% FBS (Sigma-Aldrich, cat#F2442). CD4+CD8+ double-positive cells were selected for using the Anti-Biotin MultiSort Kit (130-091-256, Miltenyi Biotec) with CD8-Biotin (130-118-074, Miltenyi Biotec). DP purity was verified after enrichment at above 95%.
Assay for Transposase-Accessible Chromatin (ATAC)
ATAC-seq was performed as previously described with minor modifications (Buenrostro et al., 2013). Fifty thousand cells were pelleted at 550 × g and washed with 1 mL 1x PBS, followed by treatment with 50 μL lysis buffer (10 mM Tris-HCl [pH 7.4], 10 mM NaCl, 3 mM MgCl2, 0.1% IGEPAL CA-630). Nuclei pellets were resuspended in 50 μL transposition reaction with 2.5 μL Tn5 transposase (FC-121–1030; Illumina). The reaction was incubated in a 37°C water bath for 45 minutes. Tagmented DNA was purified using a MinElute Reaction Cleanup Kit (Qiagen) and amplified with varying cycles, depending on the side reaction results. Libraries were purified using a QIAQuick PCR Purification Kit (Qiagen). Libraries were paired-end sequenced (38bp+38bp) on a NextSeq 550 (Illumina). Libraries were validated for quality and size distribution using a TapeStation 2200 (Agilent). Two biological replicates each with three technical replicates were generated for each strain.
ChIP-seq for H3K27ac and CTCF
ChIP-seq for H3K27ac and CTCF were performed as previously described (Yashiro-Ohtani et al., 2014). Briefly, chromatin samples prepared from fixed cells were immunoprecipitated with antibodies recognizing mouse H3K27ac (Abcam; ab4729), or CTCF (Millipore; 07–729). Antibody-chromatin complexes were captured with protein G–conjugated beads, washed, and eluted. After reversal of cross-linking, RNase and proteinase K treatment were performed and DNA was purified and quantified for library preparation. Input sample was prepared by the same approach without immunoprecipitation. Libraries were then prepared using the NEBNext® Ultra™ II DNA Library Prep Kit (NEB E7645S). Two biological replicates were generated for each strain for H3K27ac and CTCF. Libraries were validated for quality and size distribution using a TapeStation 2200 (Agilent). Libraries were paired-end sequenced (38bp+38bp) on a NextSeq 550 (Illumina).
ChIP-seq for Smc1
ChIP-seq for Smc1 was performed as previously described (Bossen et al., 2015). Cells were fixed for 30 min in RPMI 1640 (Corning) with 1% FBS (Sigma-Aldrich) with 1.5mM ethylene glycol-bis(succinic acid N-hydroxysuccinimideester) (EGS) (Thermo 21565) in DMSO followed by 15 minutes with 1% formaldehyde (Formaldehyde solution 16% Fisher 28906) and quenched for 10 minutes with 0.135M glycine. Cells were washed 2x with PBS and frozen at −80°C. Cross-linked cells were lysed and then sonicated for 10 cycles at 10sec each with 50s between cycles. Triton X-100 was added to a final concentration of 1% to centrifuge cleared lysates. Lysates were incubated overnight with Protein G Dynabeads (ThermoFisher 10003D) conjugated to 10ug of anti-Smc1 Antibody (Bethyl A300–055A). Beads were washed and complexes were eluted for 30 min at 65°C with shaking. After reversal of cross-linking, RNase and proteinase K treatment were performed and DNA was purified and quantified for library preparation and sequenced as above.
RNA-seq
Cells were washed once with 1x PBS before resuspending pellet in 350 μL Buffer RLT Plus (Qiagen) with 1% 2-Mercaptoethanol (Sigma), vortexed briefly, and stored at −80°C. Subsequently, total RNA was isolated using the RNeasy Plus Micro Kit (Qiagen). RNA integrity numbers were determined using a TapeStation 2200 (Agilent), and all samples used for RNA-seq library preparation had RIN numbers greater than 9. Libraries were prepared using the SMARTer® Stranded Total RNA-seq Kit - Pico Input Mammalian kit (Takara). Libraries were validated for quality and size distribution using a TapeStation 2200 (Agilent). Libraries were paired-end sequenced (38bp+38bp) on a NextSeq 550 (Illumina). Two biological replicates with two technical replicates were generated for each strain
HiChIP
HiChIP was performed as described (Mumbach et al., 2016) using antibody against H3K27ac (Abcam; ab4729) or Smc1 (bethyl A300–055A). Briefly, 0.1 or 2.5 × 10⁷ cells were crosslinked with 1% formaldehyde (Thermo Fisher Scientific, cat# 28908) for 10 min and subsequently quenched with 0.125M glycine (Invitrogen, cat# 15527–013). Chromatin was digested using MboI restriction enzyme (NEB, cat# R0147), followed by biotin incorporation with Biotin-14-dATP (Invitrogen, cat# 19524–016) during repair, ligation, and sonication. Sheared chromatin was 4-fold diluted with ChIP dilution buffer (16.7mM Tris pH 7.5, 167mM NaCl, 1.2mM EDTA, 0.01% SDS, 1.1% Triton X-100), pre-cleared, and then incubated with H3K27ac antibody at 4°C overnight. Chromatin-antibody compl exes were captured by Protein-A magnetic beads (Pierce, cat# 88846) and subsequently washed with Low Salt Wash Buffer, High Salt Wash Buffer, LiCl Wash Buffer and eluted. DNA was purified with MinElute PCR Purification Kit (Qiagen, cat# 28004) and quantified using Qubit dsDNA HS Assay Kit (Invitrogen, cat# Q32851). 50–150ng was used for capture with Dynabeads MyOne Streptavidin C-1 (Invitrogen, cat# 65001) and an appropriate amount of Tn5 enzyme (Illumina, cat# FC-121–1030) was added to captured DNA to generate the sequencing library. Libraries were validated for quality and size distribution using a TapeStation 2200 (Agilent). Paired-end sequencing (38 bp+38 bp) was performed on a NextSeq 550. Smc1 HiChIP replicate 2 was sequenced on two flow cells and combined to reach comparable coverage to other samples.
Oligopaint FISH probe generation
The OligoMiner pipeline was used to design oligopaint libraries (Beliveau et al., 2018). 42bp probes were designed to a 50kb region at a density of approximately 5 probes per kilobase for each locus using the GRCm38.87 genome.
Oligopaint FISH hybridization
Thymocytes were isolated by dissociating the thymus through a 70μM filter (Falcon) in RPMI (Corning) with 1% FBS (Sigma-Aldrich, cat#F2442). CD4+CD8+ double-positive cells were selected for using the Anti-Biotin MultiSort Kit (130-091-256, Miltenyi Biotec) with CD8-Biotin (130-118-074, Miltenyi Biotec) and CD4 (L3T4) Microbeads (130-117-043, Miltenyi Biotec) following the manufacturer’s instructions, except the following modifications. For the labeling with CD8-Biotin, 100 million cells were resuspended in 1mL of buffer and incubated with 150μL of CD8-Biotin antibody. Also, 900μL of Buffer and 100μL of Anti-Biotin MultiSort Microbeads were used. For the labeling with CD4 Microbeads, cells eluted from the CD8-Biotin step were resuspended in step 900 μL of buffer and incubated with 150μL of CD4 Microbeads for 15 minutes in the refrigerator. Purity of above 95% CD4+CD8+ was confirmed after selection. Following the Anti-Biotin Multisort Kit, CD4+CD8+ double-positive cells are diluted to 4 million cells per mL, and 73uL of diluted cells were added to polysine microscope slides (Thermo Scientific, cat#P4981–001) using silicone isolators (Electron Microscopy Sciences, cat #70339–05). Cells adhered to the slides for 30 minutes at room temperature. Cells were then quickly washed in PBS, fixed in 4% formaldehyde (Fisher Scientific, cat#PI28908) in PBS for 12 min, and then washed in PBS. Cells were permeabilized in 0.5% Triton in PBS for 15 min and dehydrated with an ethanol row of 70%, 80%, and 95% ethanol for 2 min each. After allowing the slides to dry for 3–5 minutes, cells were washed in 2XSSCT/50% formamide (0.3M NaCl, 0.03M sodium citrate, 0.1% Tween-20) at room temperature for 5 minutes, 2.5 min at 92°C in 2XSSCT/50% formamide, and 20 min at 60°C in 2XSSCT/50% formamide. For primary probe hybridization, slides were air-dried, and cells were immersed in hybridization buffer (10% dextran sulfate, 50% formamide, 4% PVSA, 5.6 mM dNTPs, and 10ug of RNase A) containing 50 pmol of primary Oligopaint probes, covered with a coverslip (Fisher Scientific, cat#12-548-5M), and sealed with no-wrinkle rubber cement (Elmer’s). Cells were denatured for 2.5 min at 92°C on top of a heated block, followed by hybridization at 37°C in a humid ified chamber for ~16 hrs. Coverslips were then carefully removed using a razor blade, and cells were washed for 15 min in 2XSSCT at 60°C, followed by two 10 min washes at room tempera ture in 2XSSCT at 75 rpm. After allowing the slides to air-dry, cells were immersed in secondary hybridization buffer (10% dextran sulfate, 10% formamide, and 4% PVSA) with 2pmol bridges and 10pmol of secondary probes (Alexa-488, Atto-565, and Alexa-647), covered with a coverslip (Fisher Scientific, cat#12-548-5M), and sealed with no-wrinkle rubber cement (Elmer’s). Slides were then incubated in the dark in a humidified chamber for 2 hrs. Coverslips were then carefully removed using a razor blade, and slides were quickly washed in 2XSSCT at room temperature, followed by a 5 min wash in 2XSSCT at 60°C, a 5 min wash in 2XSCCT with DAPI (0.1 μg/mL), and a 5 min wash in 2XSSCT. Slide were quickly dipped in water and allowed to completely dry before coverslipping with Slowfade Gold Antifade Reagent (Invitrogen by Thermo Fisher Scientific, cat#S36936) and sealing with Sally Hansen’s dries instantly top coat.
QUANTIFICATION AND STATISTICAL ANALYSIS
Analysis of genomics data in NOD mice
A custom genome using the latest de novo assembly of NOD (Lilue et al., 2018) was generated using MMARGE as previously described (Link et al., 2018a; Link et al., 2018b). Briefly, the variant positions of the mm10 genome (the mm10 C57BL/6 reference genome was downloaded directly from the UCSC genome browser) were replaced with SNPs and Indels found in the NOD VCF files (version 5) from the Mouse Genomes Project (Lilue et al., 2018). Only SNPs and Indels that were homozygous and pass quality control were used. For C57BL/6, the mm10 reference genome was used. The mus musculus GRCm38.91 gtf file was used when aligning the C57BL/6 RNA-seq reads and the mus musculus GRCm38.91 gtf shifted to NOD coordinate was used when aligning the NOD RNA-seq reads.
SNP/Indels between two strains
MMARGE (Link et al., 2018b) (MARGE.pl mutation_bedfiles -ind c57bl6j, nodshiltj) was used to extract SNPs and Indels (6,043,168) for comparisons between between the two strains. The mm10 C57BL/6 reference genome was downloaded directly from the UCSC genome browser using “rsync-avzPrsync://hgdownload.cse.ucsc.edu/goldenPath/mm10/chromosomes” while the NOD genome was acquired from “ftp://ftp.ensembl.org/pub/release-86/fasta/mus_musculus_nodshiltj/dna/”. GRanges in R was used to count the number of SNPs/Indels per 1000 bp at strain-specific enhancers or hyperconnected versus regular 3D cliques. Cumulative distributions were plotted using ggplot and stat_ecdf(geom = “step”).
Definition of regulatory elements
The following definitions of regulatory elements were used throughout the manuscript. Promoters: Promoters were defined as ± 1 kilobases from the transcription start site (TSS) of each expressed gene. Enhancers: Enhancers were defined as H3K27ac peaks excluding the ones overlapping with promoters. Super-enhancers were detected using H3K27ac ChIP-seq in each strain following what was reported previously (Vahedi et al., 2015). In short, H3K27ac peaks within 12,500bp were merged and then ranked using an R code. The cutoff for super-enhancers was set to the elbow of the curve and a tangent line at the cutoff was shown.
Gene annotation
A total of 1,768,665 Ensembl transcripts in GRCm38.91 assembly were downloaded in gtf format. For each Ensembl gene id (ENSMUSG), the longest transcript (ENST) was used to assign unique transcriptional start site and gene position. After exclusion of genes annotated as rRNA or on chromosome M, 53,458 gene annotations were used in RNA-seq analysis.
ATAC-seq data processing
ATAC-seq libraries were pair-end sequenced by Illumina NextSeq 550. Bowtie2 was used for alignment (bowtie2 -p 20 -X2000 -t). In NOD mice, aligned reads were shifted using MMARGE (Link et al., 2018a; Link et al., 2018b). Reads aligned to the mitochondrial genome or chrY as well as reads mapping to multiple genomic loci were discarded from downstream analyses. Additionally, Picard was used to mark and remove duplicates. Furthermore, for each ATAC-seq library the insert size was calculated by Picard. The insert size distribution of sequenced fragments from both C57BL/6 and NOD chromatin had clear periodicity of approximately 200 bp, suggesting many fragments are protected by integer multiples of nucleosomes. Bigwig files were generated by bedtools genomecov and wigToBigWig normalizing tracks to tags-per-million. For peak calling, macs2 with “macs2 callpeak --nomodel -B --keep-dup all --broad --broad-cutoff 0.1 -q 0.1” was used. Peaks called in three technical replicates in two biological replicates (total 12 for both strains) were merged and bedtools coverage was used to count fragments in each library.
ATAC-seq in F1
ATAC-seq fastq files from 3 technical replicates of two biologic replicates (4 week old F1 (NOD × C57BL/6) male mice) were aligned to both C57BL/6 and NOD reference genomes as described above. NOD aligned sam files were shifted to C57BL/6 coordinates with Marge.pl Shift (Link et al., 2018a; Link et al., 2018b). Allele specific reads (reads spanning mutations) were defined for each alignment with MMARGE’s Marge.pl allele_specific_reads −v -method bowtie -ind nodshiltj. F1 C57BL/6 and NOD allelic read coverage was counted at the union of 62,207 parental ATAC-seq peaks with bedtools coverage. Peaks with no F1 allelic read data (not intersecting mutations) were removed leaving 10,658 parental ATAC peaks with F1 allelic data. DESeq2 was used for differential accessibility analysis between alleles Using log2FoldChange>2 and padj<1e-4 threshold and resulting in 580 parental peaks where F1 accessibility was significantly differential. Log2FC of parental strain ATAC-seq and allelic F1 ATAC-seq was plotted at each peak.
Smc1 ChIP-seq in F1
Smc1-ChIP-seq Fastq files from 2 biologic replicates (4 week old F1 (NOD × C57BL/6) male mice) were analyzed as previously described for the F1 ATAC-seq. F1 C57BL/6 and NOD allelic read coverage was counted at the union of 86,598 parental Smc1 ChIP-seq peaks with bedtools coverage. 29,056 parental peaks remained with allele specific data. Differential binding analysis was carried out as described previously with log2FoldChange>2 and padj<1e-4 resulting in 209 peaks with significantly differential Smc1 binding between the alleles. Log2FC of parental strain Smc1 ChIP-seq and allelic Smc1 ChIP-seq was plotted at each peak.
H3K27ac, Smc1, and CTCF ChIP-seq
H3K27ac and CTCF ChIP-seq libraries were pair-end sequenced by Illumina NextSeq 550. bowtie2 was used for alignment of ChIP-seq data. In NOD mice, aligned reads were shifted used MMARGE. Reads aligned to the mitochondrial genome or chrY as well as reads mapping to multiple genomic loci were discarded from downstream analyses. Bigwig files were generated by bedtools genomecov and wigToBigWig normalizing tracks to tags-per-million. For peak calling, macs2 with “macs2 callpeak -c inputfile --nolambda --nomodel --keep-dup all -p 0.00001” was used. Input sample for each strain was prepared by the same approach without immunoprecipitation and used as input control for peak calling.
RNA-seq data processing
RNA-seq samples were aligned by STAR_2.5.0a_alpha with parameters ‘--readFilesCommand zcat --outFilterMultimapNmax 1 --outSAMtype SAM --alignEndsType Local --outReadsUnmapped Fastx --outFilterMismatchNmax 1 --alignMatesGapMax 400000 --sjdbGTFfile’, with the GTF file being either the mus musculus GRCm38.91 gtf file for C57BL/6 strain or the mus musculus GRCm38.91 gtf shifted to NOD coordinates for the NOD strain. HTSeq v0.6.1 facilitated counting RNA-seq reads on Gencode vM11 gene models with parameters ‘-s yes -t exon -m intersection-nonempty’. DESeq2 was subsequently applied on gene counts to identify genes differentially expressed between two strains.
HiChIP
Significant interaction calling
Raw reads for each HiChIP sample were processed with HiC-Pro (version v2.5.0) (Servant et al., 2015) to obtain putative interactions with default parameters except LIGATION_SITE = GATCGATC and GENOME_FRAGMENT generated for MboI restriction enzyme. Valid pairs (VI), self-circle (SC) and dangling-end (DE) interactions in cis were used as input for significant interaction calling in ‘.bedpe’ format. Mango (version 1.2.0) (Phanstiel et al., 2015) step 4 identified putative significant interaction anchors by MACS peak calling with MACS_qvalue = 0.05 and MACS_shiftsize = 75. Mango step 5 identified significant interactions with default parameters except maxinteractingdist = 2000000 and MHT = found. Two biological repeats for each strain were processed and only significant interactions with PETs >= 2 reproduced in both replicates were used for further analysis. Sequencing depth and library summary generated by HiC-Pro can be found in Table S4. For each library, each significant interaction was normalized to contacts per hundred million, i.e. divided by the number of interactions in the Mango input .bedpe file and multiplied by 1E8. 1D HiChIP signal enrichment and peak calling were generated from the HiC-Pro filtered contacts file. Mango outputs of two biological replicates where two anchors were within 5kbp were called reproducible interactions in each strain.
3D clique analysis
3D clique analysis was performed following the same procedure as reported earlier (Petrovic et al., 2019). In each strain, an undirect graph of regulatory interactions was constructed for reproducible interactions with at least one H3K27ac peak at one anchor. In this graph, each vertex was an enhancer or a promoter and each edge was a significant and reproducible enhancer-enhancer, enhancer-promoter, or promoter-promoter interaction. “3D Cliques” were defined by spectral clustering of the regulatory graph interactions using cluster_louvain function in igraph R package with default parameters. A 3D clique connectivity was defined as the number of edges connecting vertices within the clique. The connectivity of cliques was ranked in ascending order and plotted against the rank. The cutoff for hyperconnected 3D cliques was set to the elbow of the curve and a tangent line at the cutoff was shown. A 3D clique was “strain-specific” if at least one enhancer node in the 3D clique was strain-specific. Strain-similar (and strain-specific) 3D cliques in C57BL/6 and NOD mice were selected and visualized as community topologies with R ‘plot’ function.
Differential loop analysis for HiChIP
Table S5 reports the coordinates and statistics of differential loops. We merged the sets of reproducible loops called by Mango for each strain creating a union of all significant and reproducible loops across our strains/replicates for Smc1 HiChIP datasets. We next counted the number of raw paired-end reads at each significant loop across HiChIP experiments exploiting juicer’s contact matrix 25kbp resolution (Rao et al., 2014) and quantitated similarities and differences between the two strains using DESeq2. The results indicate high level of reproducibility between replicates and strains. Using log2FC=1 and padj=0.05, we found 24 significant loops to be NOD-spec while only 2 loops were C57BL/6 specific. Not surprisingly, the NOD-specific loops contained 3D interactions in Idd9.2 and Idd6. This particular analysis further supports our 3D clique-based analysis suggesting strain similarity at Bcl11b and Ets1 but strain-specificity at Idd regions.
Allele-specific analysis in F1 mice
The ALLELE_SPECIFIC_SNP option in HiC-Pro was selected in the confirguration file, allowing the allele-specific mode of alignment. The vcf file between NOD and C57BL/6 was generated by extract_snps.py as suggested in the HiC-Pro manual. In this pipeline, the sequencing reads are first aligned on a masked reference genome for which all polymorphic sites were first N-masked. Bowtie2 indexes are generated by the user for this N-masked genome. Once algined, HiC-Pro browses all reads spanning a polymorphic site, locates the nucleotide at the appropriate position and assigned the read either to the maternal or paternal allele. Reads with conficting allele assignment or unexpected allele at polymorphic sites are discarded. To create the heatmap for NOD or C57BL/6 specific allele (Figure S7D–E), G1 or G2 bam files which are reads assigning to either parental genome were used.
Conservation score analysis
The phastCons score file mm10.60way.phastCons.bw was downloaded from UCSC genome browser and bigWigAverageOverBed was used to calculate the average phastCons scores at strain-specific, strain-similar or hyperconnected or regular 3D cliques enhancers
Motif analysis
Homer’s findMotifsGenome.pl was used for de novo motif analysis. The strain-specific ATAC-peaks were used with these parameters: “findMotifsGenome.pl -preparsedDir -size 100 -S 10 -p 35”. For performing motif search at HiChIP anchors, we used fimo with 1e-5 as threshold. In Figure 1E, peaks of each strain-specific set was used as the background for the opposite strain using C57BL/6 sequence. Position weight matrices for TCF, AP-1 and CTCF were selected from “JASPAR2018_CORE_vertebrates_non-redundant_pfms_meme.txt.” Motif counts were normalized to the length of each anchor (in bp) multiplied by 1000.
Idd region extraction
Idd regions were downloaded from Vega Genome Browser (http://vega.archive.ensembl.org/info/data/mouse_regions_and_strains.html) (Steward et al., 2013)
Odds ratio analysis for Idd regions
Odds ratio was calculated by creating contingency tables using differentially accessible peaks (or differentially expressed genes) and strain-similar peaks (or genes).
Gene ontology metascape analysis
metaScape (http://metascape.org/gp/index.html#/main/step1; (Zhou et al., 2019)) using ‘Multiple Gene List’ was used for gene ontology analysis throughout this work.
Circos plot for Idd, ATAC, and genes
Circos plots for Figure 2D was generated by http://circos.ca/. We selectively show the Idd regions by specifying chromosome ranges. The features of these regions were shown with the tile tracks.
Permutation analysis for 3D cliques
In permutation tests performed in Figure 4, 100,000 random permutations for the feature of interest (TCF, AP-1, CTCF, SNP, conservation or ChIP-seq density) were generated for the graphs made for reproducible HiChIP loops. More specifically, for each feature (i.e. vertex), rows were shuffled and this was repeated 100,000 times. pvalues were calculated as the number of times the feature of interest was higher at resilient 3D cliques compared with permuted cliques.
Differential gene expression using community
In analysis of Figures S4G, only genes falling at the graph nodes made by reproducible HiChIP interactions were considered. If a gene was differentially expressed and fell in a clique containing at least one differentially accessible enhancer was considered as ‘DE.enhancer.in.community’. ‘DE.promoter’ was considered separately as differentially accessible element overlapped an annotated promoter while genes without these two features were considered ‘no.DE.enhancer.in.community’.
Oligopaint FISH imaging and analysis
Imaging was carried out on a Leica TCS SP8 Multiphoton Confocal using a 40X oil immersion objective with a 1.8 zoom factor, a pixel size of 75.12 nM × 75.12 nM, and z-stack size of 10 μM with a z-step size of 340 nM. Analysis was carried out on the raw images in a semi-automated manner on a cell-by-cell basis as describe in Raj. et al. 2008 (https://bitbucket.org/arjunrajlaboratory/rajlabimagetools/wiki/Home). Briefly, the DAPI signal was used for manual nuclei segmentation. The exact numbers of nuclei analyzed per strain and locus are as follows: 570 nuclei for the Bcl11b locus in C57BL/6, 610 nuclei for the Bcl11b locus in NOD, 625 nuclei for the Ets1 locus in C57BL/6, 472 nuclei for the Ets1 locus in NOD, 556 nuclei for the Idd9.2 locus in C57BL/6, 482 nuclei for the Idd9.2 locus in NOD, 404 nuclei for the Idd6.AM locus in C57BL/6, and 448 nuclei for the Idd6.AM locus in NOD. Spots for each of the 3 channels (Alexa-488, Atto-565, and Alexa-647) were individually detected using a linear filter approximately conforming to a Laplacian convolved with a Gaussian. A plot of the number of spots as a function of the threshold value enabled human-directed thresholding of spots for each of the 3 channels individually. For each spot, the brightest z slice was used as the z coordinate. Centroid positions for each spot in xy were found by fitting a Gaussian. X, Y, and Z coordinates were extracted, and pairwise Euclidean distances between nearest neighbors were calculated. The Kolmogorov-Smirnov test was used to compare differences in the cumulative distributions, and the Mann-Whitney test was used to compare differences in the medians.
For biological replicate two, the numbers of nuclei analyzed per strain and locus are as follows: 352 nuclei for the Bcl11b locus for C57BL/6, 354 nuclei for the Bcl11b locus for NOD, 362 nuclei for the Ets1 locus for C57BL/6, 378 nuclei for the Ets1 locus for NOD, 334 nuclei for the Idd9.2 locus for C57BL/6, 361 nuclei for the Idd9.2 locus for NOD, 320 nuclei for the Idd6.AM locus for C57BL/6, and 310 nuclei for the Idd6.AM locus for NOD. For biological replicate two, the imaging and analysis was carried out exactly as written for biological replicate one, with the following exception; after thresholding, only the two brightest spots per channel in close proximity to another channel were kept for data analysis. This enabled the corroboation of the formation hyperconnected 3D cliques using two different analytical approaches.
Representative Image processing
Imaging was carried out on a Leica Multiphoton Confocal using a 63X oil immersion objective with a 1.15 zoom factor, a pixel size of 74.17 nM × 74.17 nM, and z-stack size of 10 μM with a z-step size of 1 μM. Z-stacks were maximally projected. Each cell, allele, and locus for each strain were individually processed using ImageJ via adjusting the brightness/contrast/minimum/maximum, as well as smoothing.
Microarray data analysis
For the analysis of microarray data from GSE64674, we used the GEO2R (https://www.ncbi.nlm.nih.gov/geo/geo2r/?acc=GSE64674) to generate the R script, which used two R packages (GEOquery and limma). To include the lowly expressed genes in the downstream analysis, we assigned the negative values in the matrix to zero instead of “NaN” in the original R script. The value in the matrix were further normalized with log2(value+1). Then we convert the id in microarray matrix to unified gene symbol according the the NCBI gene information file (ftp://ftp.ncbi.nih.gov/gene/DATA/GENE_INFO/Mammalia/Mus_musculus.gene_info.gz), in order to find the expression information of genes in Idd9 region in the microarray data. With the expression information of 46 genes in Idd9 region, we clustered the expression profile of ‘ex-vivo’ samples in the two strains with pheatmap R package.
Visualization of HiChIP by contact matrix
We first generated hic file for BL6 and NOD from the “rawdata_allValidPairs” in HiC-Pro output files with the hicpro2juicebox.sh script in the pipeline. For generating the NOD hic file, we shifted the coordinates in the file with modified MMARGE pipeline to make it compatible with the file format. Sparse contact matrix of chr4, chr6, chr9, and chr12 were extracted from the hic file with juicer_tools (dump observed VC_SQRT BP 25000) normalized with VC_SQRT at 25 kb resolution. These sparse matrices were converted to matrix format with custom script and were fed to HiCPlotter to draw the heat maps of each region based on the contact matrices (Akdemir and Chin, 2015). The coverage of Smc1, CTCF, and H3K27ac ChIP-seq at the four regions were calculated with bamCoverage at a resolution of 10 kb and normalized with RPKM. We also used HiCPlotter for the visualization of ChIP-seq data. We filtered the reproducible loops called by Mango between the two replicates with FDR < 0.05 and visualized the significant loops by modifying the arc plots in HiCPlotter.
APA score for Smc1-HiChIP loops
We did the APA analysis with apa function in juicer_tools at the resolution of 5 kb and normalized with VC_SQRT. The coordinates of reproducible significant Smc1 HiChIP loops from both strains were also binned by 5 kb resolution and merged to make a unified set of loops. Loops with a linear distance less than 25 kb were filtered out. The APA score was calculated for each single loop in both strains from the “enhancement.txt” file in the output folder, as well as the aggregate score for all the loops normalized with different methods. We compared the score for each loop between the two strains with Wilcoxon test and visualized the distribution with boxplot using ggboxplot package in R. For the visualization of APA score of all the loops, we used the data in “normedAPA.txt” file in the output folder, which contains the normalized aggregated contacts of 21×21 matrix centered at the loop, and plotted with custom python script.
Whole genome alignment of sequence
In order to demonstrate CTCF binding events at boundary regions (Figures 5F–L), we first compared NOD and BL6 genome sequences, used the de novo assembly of the NOD genome from ensembl, and masked the repeats with RepeatMasker. Then we aligned the repeat masked mm10 and NOD genome with lastz in two different ways using mm10 and NOD genome as reference separately. Alignment results from lastz in axt format were chained with axtChain from UCSC, the output of which was further converted to net file with chainNet. The filtered chain information of the target genome was retrieved from the chain file with netChainSubset. These chain files were then converted to axt format with chainToAxt and the coordinates of each hits were retrieved to make a bedpe file of orthologous region between the two strains. We also found the mm10 orthologous genes from NOD gene annotation file, and used this information to help validate the collinear regions between the two strains for those four megabase-long regions we studied.
CTCF binding comparison in NOD and BL6
For the visualization of unique NOD CTCF peaks in Idd9.2 and Idd6.AM regions, we mapped the NOD and BL6 CTCF ChIP-seq data to the corresponding reference genome, and then redid the pairwise lastz alignment between sequence of the two genomes at these two loci including repeats, considering some of the CTCF binding sites overlap with repeats. With the filtered alignment in these two regions as we did for the whole genome alignment, we found the orthologous region of NOD binding site in BL6 genome, only those whose orthologous relationship are consistent with the whole genome alignment were kept. We plotted the repeats, orthologous region and CTCF peaks with custom python.
Interchromosomal interactions
We converted the “rawdata_allValidPairs” file from HiC-Pro pipeline to HiCsummary file format as described by HOMER (Heinz et al., 2010). Then we created a tag directory with makeTagDirectory form HOMER package. Interchromosomal and remote connections to those for region were analyzed with analyzeHiC at resolution of 25 kb. Then we counted the number of interchromosomal connections and those with a linear distance longer than 4 Mb for both strains at the four regions.
scRNA-seq sample collection and analysis
The Single Cell 3’ Reagent Kit v2 from 10xGenomic was used for generating scRNA-seq data. 3,000 cells were targeted for recovery per donor. All libraries were validated for quality and size distribution using a TapeStation 2200 (Agilent) and quantified using Kapa (Illumina). Paired-end sequencing (Read 1: 26 cycles, i7 Index: 8 cyles, i5 index: 0 cycles, and Read 2: 98 cycle) was performed on an Illumina HiSeq 2500. Cellranger (10X; 2.1.0) was used for bcl2fastq conversion and sample aggregation. Seurat 3.0.2 (Butler et al., 2018; Stuart et al., 2019) was used for filtering, UMAP generation, and initial clustering. The “Seurat-Guided Clustering Tutorial” was used as a basis for the analysis (https://satijalab.org/seurat/v3.0/pbmc3k_tutorial.html). Genes were kept that were in 0.01% of cells (3 cells), resulting in 74% of genes remaining for analysis (24,986 / 33,694 genes). Cells with at least 200 genes were kept. nFeature, nCount, percent.mt, nFeature vs nCount, and percent.mt vs nCount plots were generated to ascertain the lenient filtering criteria of 200 > nFeature < 7,500, percent.mt < 30, and nCount <100,000, which led to the filtering out of 66 cells (35,066 cells remaining). Data was then log normalized, and the top 2,000 variable genes were detected using the “vst” selection method. The data was then linearly transformed (“scaled”). PCA was then carried out on the scaled data, using the 2,000 variable genes as input. Based on the Jackstraw-inspired resampling test and an elbow plot of the standard deviations explained by each of the principle components (PCs), 14 PCs with a resolution of 2 was used to cluster the cells, and non-linear dimensionality reduction (UMAP) was used with 14 PCs to visualize the dataset. DoubletFinder (McGinnis et al., 2019) was used to demarcate and remove potential doublets in the data as previously described. The doublets had higher nCount than the singlets identified using this method, and the 807 doublets were removed from further analyses. Following doublet removal, the raw data for the remaining leaving 34,259 cells was log normalized, the top 2,000 variable genes were detected, the data underwent linear transformation, and PCA was carried out, as described above. Both the Jackstraw-inspired resampling test and an elbow plot of standard deviation explained by each PC were used to determine the optimal dimensionality of the data. Based on these two approaches, 11 PCs with a resolution of 1.2 was used to cluster the cells, and UMAP was used with 11 PCs to visualize the 28 clusters detected.
Garnett (Pliner et al., 2019) was used for initial cell classification as previously described. In brief, a cell type marker file with 17 different cell types was compiled using various resources (Baron et al., 2016; Butler et al., 2018; Muraro et al., 2016; Segerstolpe et al., 2016; Wang et al., 2016; Wang et al., 2019), and this marker file was checked for specificity using the “check_markers” function in Garnett by checking the ambiguity score and the relative number of cells for each cell type. A classifier was then trained using the marker file, with “num_unknown” set to 150, and this classifier was then used to classify cells and cell type assignments were extended to nearby cells, “clustering-extended type” (Louvain clustering). Too-Many-Cells was then used to cluster and visualize the 34,259 single cells, as described in Schwartz et al. (https://www.biorxiv.org/content/10.1101/519660v1).
Briefly, the raw data from the 34,259 cells were normalized by total count and gene normalization by median count followed by frequency-inverse document frequency (tf-idf). The “clustering-extended type” cell labels from Garnett, as well as the demarcation of canonical cell markers, were used to identify the 10 broad classes of cell types found within the pancreas: Alpha, Beta, Delta, Gamma, Epsilon, Acinar, Ductal, Mesenchymal/Stellate, Endothelial, and Immune cells. The raw data from different cell types were then subsetted from the comprehensive clustering in order to cluster cells on a cell type basis; reclustered cells were normalized by total count and gene normalization by median count followed by tf-idf. The raw data from the cluster containing immune/stellates/mesenchymal cells were then subsetted from the comprehensive clustering in order to cluster cells on a cell type basis; reclustered cells were normalized by total count and gene normalization by median count. Only cells from autoantibody positive (AAB+) and type 1 diabetic (T1D) donors with a high immune cell signature (ie. high CD45 (PTPRC)) were taken into the differential comparison. All differential genes between T1D and AAB+ immune cells were rank ordered and analyzed for enrichment of KRAB-ZFP genes using GSEAPreranked (GSEA; 4.0.1).
Supplementary Material
Table S1. Genomic coordinates of strain-specific open chromatin regions defined by DESeq2 (related to Figure 1).
Table S2. Analysis of allele-specific ATAC-seq and Smc1 ChIP-seq in F1 hybrid mice (related to Figures 1 and S7F).
Table S3. Ensembl IDs of strain-specific transcribed genes defined by DESeq2 (related to Figure 2).
Table S6. Annotation of 3D cliques in C57BL/6 and NOD using HiChIP and Oligos used for 3D FISH at four genomic regions (related to Figures 3, 4, 5, 6, and 7).
Table S7. List of donors procured by HPAP used for scRNA-seq analysis in islets (related to Figures 7F and S7G).
KEY RESOURCES TABLE
| REAGENT or RESOURCE | SOURCE | IDENTIFIER |
|---|---|---|
| Antibodies | ||
| Anti-mouse CD4 (RM4–4) | BioLegend | Cat# 116005; RRID:AB_313690 |
| Anti-mouse CD8a (53–6.7) | Thermo | Cat# 17-0081-82; RRID:AB_469335 |
| Anti-H3K27ac | Abcam | Cat# ab4729; RRID:AB_2118291 |
| Anti-CTCF | Millipore | Cat# 07–729; RRID:AB_441965 |
| Anti-SMC1 | Bethyl | Cat# A300–055A; RRID:AB_2192467 |
| Normal Rabbit IgG | CST | Cat# #2729; RRID:AB_1031062 |
| Chemicals, Peptides and Recombinant Proteins | ||
| 7AAD | BioLegend | Cat# 420403 |
| 70uM mesh filters | Fisher | Cat# 08-771-2 |
| RPMI 1640 medium | Invitrogen | Cat# 11875085 |
| Fetal Bovine Serum | Sigma- Aldrich | Cat# F2442 |
| Ethylene glycol bis(succinic acid N hydroxysuccinimideester) (EGS) | Thermo | Cat# 21565 |
| DMSO | Fisher | Cat# BP231–1 |
| Formaldehyde solution 16% | Thermo | Cat# PI28908 |
| Glycine | Thermo | Cat# 15527013 |
| cOmplete, Mini, EDTA-free Protease Inhibitor Cocktail | Roche | Cat# 11836170001 |
| MboI | NEB | Cat# R0147 |
| Biotin-14-dATP | Invitrogen | Cat# 19524–016 |
| dCTP | Invitrogen | Cat# 18253–013 |
| dTTP | Invitrogen | Cat# 18255–018 |
| dGTP | Invitrogen | Cat# 18254–011 |
| Tris HCl, pH 7.5,1M | Thermo | Cat# 15567027 |
| NaCl, 5M | Thermo | Cat# AM9759 |
| MgCl2 1M | Thermo | Cat# AM9530G |
| IGEPAL CA-630 | Sigma | Cat# I8896–50ML |
| EDTA | Invitrogen | Cat# 15575–038 |
| Protein A Magnetic beads | Pierce | Cat# 88846 |
| Lithium Chloride, 8M | Sigma-Aldrich | Cat# L7026 |
| Sodium bicarbonate | Sigma-Aldrich | Cat#144-55-8 |
| T4 DNA Ligase | NEB | Cat# M0202L |
| BSA, 50mg/ml | Invitrogen | Cat# AM2616 |
| Tween 20 | BIO-RAD | Cat# 170–6531 |
| DNA Polymerase I, Large (Klenow) Fragment | NEB | Cat# M0210S |
| Qubit dsDNA HS Assay Kit | Invitrogen | Cat# Q32851 |
| Dynabeads MyOne Streptavidin C-1 |
Invitrogen | Cat# 65001 |
| Phusion PCR Master Mix | NEB | Cat# M0531 |
| Nextera XT Index Kit | Illumina | Cat# FC-131–1001 |
| SPRIselect | Beckman Coulter | Cat# B23318 |
| MinElute Reaction Cleanup Kit | Qiagen | Cat# 28204 |
| QIAQuick PCR Purification Kit | Qiagen | Cat# 28104 |
| Phosphate-Buffered Saline, 1X | Thermo | Cat# 10010031 |
| RNase | Thermo | Cat# EN0531 |
| Proteinase K | Thermo | Cat# AM2546 |
| Protein G Dynabeads | Thermo | Cat# 10003D |
| 2-Mercaptoethanol | Sigma | Cat# M6250–10ML |
| Buffer RLT Plus | Qiagen | Cat# 1053393 |
| RNeasy Plus Micro Kit | Qiagen | Cat# 74034 |
| Secondary Oligopaint probe: /5Alex647N/TGATCGACCACGGCCAAGACGGAGAGCGTGTG/ 3AlexF647N/ | https://doi.org/10.1073/pnas.1714530115 | N/A |
| Secondary Oligopaint probe: /5ATTO565N/ACACN/ACCTTGCACGTCGTGGACCTCCTGCGCTA/ 3ATTO565N/ |
https://doi.org/10.1073/pnas.1714530115 | N/A |
| Secondary Oligopaint probe: /5Alex488N/CACAN/ACGCTCTTCCGTTCTATGCGACGTCGGTG/ 3AlexF488N/ |
https://doi.org/10.1073/pnas.1714530115 | N/A |
| CD4 (L3T4) Microbeads | Miltenyi Biotec | 130-117-043 |
| Polysine microscope slides | Thermo Scientific | Cat# P4981–001 |
| Silicone isolators | Electron Microscopy Sciences | Cat# 70339–05 |
| CD8-Biotin | Miltenyi Biotec | Cat# 130-118-074 |
| Ethanol | Decon Laboratories | 2716 |
| Dimethylformamide | Sigma-Aldrich | Cat# D4551 |
| Polyvinylsulfonic acid (PVSA) | Sigma Aldrich | Cat# 278424 |
| coverslips | Fisher Scientific | Cat# 12-548-5M |
| Nowrinkle rubber cement | Elmer’s | N/A |
| Slowfade Gold Antifade Reagent | Invitrogen by Thermo Fisher Scientific | Cat# S36936 |
| Dries instantly top coat | Sally Hansen’s | Cat# 45114 |
| Chromium Single Cell 3’ Library & Gel Bead Kit v2, 4 rxns | 10X genomics | Cat# PN-120267 |
| Chromium Single Cell A Chip A Kit, 16 rxns | 10X genomics | Cat# PN-1000009 |
| Chromium i7 Multiplex Kit, 96 rxns | 10X genomics | Cat# PN-120262 |
| Critical Commercial Assays | ||
| Anti-Biotin MultiSort Ki | Miltenyi Biotec | 130-091-256 |
| Tn5 Transposase | Illumina | Cat# FC-121–1030 |
| SMARTer Stranded Total RNA-Seq Kit – Pico Input Mammalian kit | Takara | Cat# 635006 |
| NEBNext Ultra II DNA Library Prep Kit for Illumina | NEB | Cat# E7645S |
| D1000 ScreenTape | Agilent | Cat# 5067–5582 |
| D1000 Reagents | Agilent | Cat# 5067–5583 |
| High Sensitivity D1000 ScreenTape | Agilent | Cat# 5067–5584 |
| High Sensitivity D1000 Reagents | Agilent | Cat# 5067–5585 |
| Genomic DNA ScreenTape | Agilent | Cat# 5067–5365 |
| Genomic DNA Reagents | Agilent | Cat# 5067–5366 |
| RNA ScreenTape | Agilent | Cat# 5067–5576 |
| RNA ScreenTape Ladder | Agilent | Cat# 5067–5578 |
| RNA ScreenTape Sample Buffer | Agilent | Cat# 5067–5577 |
| Publicly accessible data | ||
| RNA-seq from Idd9.2 congenic mice | Berry et al., 2015 | GSE64674 |
| TCF-1 ChIP-seq | Dose et al., 2014 | GSE46662 |
| RNA-seq from fast and slow progressing T1D subjects | Dufort et al., 2019 | GSE78099 |
| Deposited data | ||
| ChIP-seq, RNA-seq (bulk and single-cell), ATAC-seq and HiChIP | This study | GSE141853 |
| Experimental Models: Organisms/Strains | ||
| Mouse: C57BL/6J | Jackson Laboratory | RRID:IMSR_JAX:000664 |
| Mouse: NOD/ShiLtJ | Jackson Laboratory | IMSR Cat# JAX:001976, RRID:IMSR_JAX:001976 |
| Software, Algorithms and Databases | ||
| FastQC | (Andrews, 2017) | https://www.bioinformatics.babraham.ac.uk/projects; RRID:SCR_014583 |
| Trim Galore | (Krueger, 2017a) | https://www.bioinformatics.babraham.ac.uk/projects; RRID:SCR_011847 |
| UCSC Genome Browser | (Rosenbloom et al., 2015) | https://genome.ucsc.edu; RRID:SCR_005780 |
| GENCODE | (Mudge and Harrow, 2015) | https://www.gencodegenes.org; RRID:SCR_014966 |
| Bowtie2 | (Langmead and Salzberg, 2012) | http://bowtie-bio.sourceforge.net/bowtie2 |
| STAR | (Dobin et al., 2013) | https://github.com/alexdobin/STAR |
| Picard | (BroadInstitute, 2017) | http://broadinstitute.github.io/picard; RRID:SCR_006525 |
| HTSeq | (Anders et al., 2015) | https://pypi.python.org/pypi/HTSeq; RRID:SCR_005514 |
| DESeq2 | (Love et al., 2014) | https://github.com/Bioconductor-mirror/DESeq2; RRID:SCR_015687 |
| R | (Team, 2016) | https://cran.r-project.org; RRID:SCR_001905 |
| MACS2 | (Zhang et al., 2008) | https://github.com/taoliu/MACS |
| MMARGE | (Link et al., 2018) | https://github.com/vlink/marge |
| Homer | (Heinz et al., 2010) | http://homer.ucsd.edu/homer; RRID:SCR_010881 |
| bedtools | (Quinlan and Hall, 2010) |
https://bedtools.readthedocs.io/en/latest/# Bedtools; RRID:SCR_006646 |
| wigToBigWig | http://hgdownload.cse.ucsc.edu/admin/exe/ | |
| GSEA | (Subramanian et al., 2005) | http://software.broadinstitute.org/gsea; RRID:SCR_003199 |
| HiC-Pro | (Servant et al., 2015) |
https://github.com/nservant/HiC-Pro HiC-Pro, RRID:SCR_017643 |
| Mango | (Phanstiel et al., 2015) | https://github.com/dphansti/mango |
| igraph | (Csardi and Nepusz 2006) | https://igraph.org/r/ |
| ggplot2 | (Wickham 2016) | https://ggplot2.tidyverse.org/ |
| Metascape | (Zhou et al., 2019) |
http://metascape.org/gp/index.html#/main/step1 Metascape, RRID:SCR_016620 |
| Circos | (Krzywinski et al. 2009) |
http://circos.ca/ Circos, RRID:SCR_011798 |
| Imaging Analysis Suite | (Raj. et al. 2008) | https://bitbucket.org/arjunrajlaboratory/rajlabimagetools/wiki/Home |
| ImageJ | https://imagej.nih.gov/ij/ | |
| GEOquery | (Davis and Meltzer 2007) | https://bioconductor.org/packages/release/bioc/html/GEOquery.html |
| limma | (Ritchie et al., 2015) |
https://bioconductor.org/packages/release/bioc/html/limma.html LIMMA, RRID:SCR_010943 |
| juicer | (Durand et al., 2016) |
https://github.com/aidenlab/juicer/wiki/Juicer-Tools-Quick-Start Juicer, RRID:SCR_017226 |
| HiCPlotter | (Akdemir and Chin, 2015) | https://github.com/kcakdemir/HiCPlotter |
| RepeatMasker |
http://www.repeatmasker.org/ RepeatMasker, RRID:SCR_012954 |
|
| lastz | (Harris, 2007) | http://www.bx.psu.edu/~rsharris/lastz/ |
| Cellranger | 10X genomics | Version 2.1.0 |
| Seurat | (Butler et al., 2018 and Stuart et al., 2019) |
https://satijalab.org/seurat/vignettes.html Seurat, RRID:SCR_016341 Version 3.0.2 |
| DoubletFinder | (McGinnis et al., 2019) | https://github.com/chris-mcginnis-ucsf/DoubletFinder |
| Garnett | (Pliner et al., 2019) | https://cole-trapnell-lab.github.io/garnett/ |
| Too-Many-Cells | (Schwartz et al., 2019) | https://github.com/GregorySchwartz/too-many-cells |
Highlights.
T cell identity genes are hyperconnected in 3D in C57BL/6 and NOD strains.
Diabetes-associated regions are hyperconnected in 3D only in NOD strain.
The 3D regulatory landscape in NOD mice is mediated in cis.
KRAB-ZFP genes are highly expressed in the pancreas of humans with T1D.
Acknowledgement
The authors thank Dr. Andrea Stout and the Microscopy Core. We are grateful to Maxwell Mumbach for HiChIP protocol. We thank Dr. E. John Wherry for being generous with his lab’s resources. We are grateful to Drs. Ken Zaret, Shelley Berger and Mitch Lazar for discussions. This study is funded by the R01 HL-145754, the Penn Epigenetics pilot award, and the Sloan Foundation grant to G.V., T32 A1055428 to N.G., LLS Fellow Award to J.P, and R01-CA-230800, an Abramson Cancer Center Cooper award, an Abramson Family Cancer Research Institute investigator award, an Institution for Translational Medicine and Therapeutics TAPITMAT award, a Concern Foundation Conquer Cancer Now award, and Susan G. Komen CCR185472448 to R.B.F. Funding for scRNA-seq data was provided by NIH UC4 DK112217 to A. N., K. H. K., and G.V.
Footnotes
Publisher's Disclaimer: This is a PDF file of an unedited manuscript that has been accepted for publication. As a service to our customers we are providing this early version of the manuscript. The manuscript will undergo copyediting, typesetting, and review of the resulting proof before it is published in its final form. Please note that during the production process errors may be discovered which could affect the content, and all legal disclaimers that apply to the journal pertain.
Declaration of Interests
The authors declare no competing interests.
DATA AND SOFTWARE AVAILABILITY
The accession number for the HiChIP, ChIP-seq, RNA-seq and ATAC-seq reported in this study is NCBI GEO: GSE141853
ADDITIONAL RESOURCES
Additional details regarding the human organ donors can be found in https://hpap.pmacs.upenn.edu/.
Supplemental Information
Document S1. Figures S1–S7
References
- Akdemir KC, and Chin L (2015). HiCPlotter integrates genomic data with interaction matrices. Genome Biol 16, 198. [DOI] [PMC free article] [PubMed] [Google Scholar]
- Anderson MS, and Bluestone JA (2005). The NOD mouse: a model of immune dysregulation. Annu Rev Immunol 23, 447–485. [DOI] [PubMed] [Google Scholar]
- Baron M, Veres A, Wolock SL, Faust AL, Gaujoux R, Vetere A, Ryu JH, Wagner BK, Shen-Orr SS, Klein AM, et al. (2016). A Single-Cell Transcriptomic Map of the Human and Mouse Pancreas Reveals Inter- and Intra-cell Population Structure. Cell Syst 3, 346–360 e344. [DOI] [PMC free article] [PubMed] [Google Scholar]
- Barrett JC, Clayton DG, Concannon P, Akolkar B, Cooper JD, Erlich HA, Julier C, Morahan G, Nerup J, Nierras C, et al. (2009). Genome-wide association study and meta-analysis find that over 40 loci affect risk of type 1 diabetes. Nat Genet 41, 703–707. [DOI] [PMC free article] [PubMed] [Google Scholar]
- Beagrie RA, Scialdone A, Schueler M, Kraemer DC, Chotalia M, Xie SQ, Barbieri M, de Santiago I, Lavitas LM, Branco MR, et al. (2017). Complex multi-enhancer contacts captured by genome architecture mapping. Nature 543, 519–524. [DOI] [PMC free article] [PubMed] [Google Scholar]
- Beliveau BJ, Boettiger AN, Avendano MS, Jungmann R, McCole RB, Joyce EF, Kim-Kiselak C, Bantignies F, Fonseka CY, Erceg J, et al. (2015). Single-molecule super-resolution imaging of chromosomes and in situ haplotype visualization using Oligopaint FISH probes. Nat Commun 6, 7147. [DOI] [PMC free article] [PubMed] [Google Scholar]
- Beliveau BJ, Joyce EF, Apostolopoulos N, Yilmaz F, Fonseka CY, McCole RB, Chang Y, Li JB, Senaratne TN, Williams BR, et al. (2012). Versatile design and synthesis platform for visualizing genomes with Oligopaint FISH probes. Proc Natl Acad Sci U S A 109, 21301–21306. [DOI] [PMC free article] [PubMed] [Google Scholar]
- Beliveau BJ, Kishi JY, Nir G, Sasaki HM, Saka SK, Nguyen SC, Wu CT, and Yin P (2018). OligoMiner provides a rapid, flexible environment for the design of genome-scale oligonucleotide in situ hybridization probes. Proc Natl Acad Sci U S A 115, E2183–E2192. [DOI] [PMC free article] [PubMed] [Google Scholar]
- Berry GJ, Frielle C, Luu T, Salzberg AC, Rainbow DB, Wicker LS, and Waldner H (2015). Genome-wide transcriptional analyses of islet-specific CD4+ T cells identify Idd9 genes controlling diabetogenic T cell function. J Immunol 194, 2654–2663. [DOI] [PMC free article] [PubMed] [Google Scholar]
- Boller S, Ramamoorthy S, Akbas D, Nechanitzky R, Burger L, Murr R, Schubeler D, and Grosschedl R (2016). Pioneering Activity of the C-Terminal Domain of EBF1 Shapes the Chromatin Landscape for B Cell Programming. Immunity 44, 527–541. [DOI] [PubMed] [Google Scholar]
- Bossen C, Murre CS, Chang AN, Mansson R, Rodewald HR, and Murre C (2015). The chromatin remodeler Brg1 activates enhancer repertoires to establish B cell identity and modulate cell growth. Nat Immunol 16, 775–784. [DOI] [PMC free article] [PubMed] [Google Scholar]
- Boudaoud I, Fournier E, Baguette A, Vallee M, Lamaze FC, Droit A, and Bilodeau S (2017). Connected Gene Communities Underlie Transcriptional Changes in Cornelia de Lange Syndrome. Genetics 207, 139–151. [DOI] [PMC free article] [PubMed] [Google Scholar]
- Bruno M, Mahgoub M, and Macfarlan TS (2019). The Arms Race Between KRAB-Zinc Finger Proteins and Endogenous Retroelements and Its Impact on Mammals. Annu Rev Genet. [DOI] [PubMed] [Google Scholar]
- Buenrostro JD, Giresi PG, Zaba LC, Chang HY, and Greenleaf WJ (2013). Transposition of native chromatin for fast and sensitive epigenomic profiling of open chromatin, DNA-binding proteins and nucleosome position. Nat Methods 10, 1213–1218. [DOI] [PMC free article] [PubMed] [Google Scholar]
- Butler A, Hoffman P, Smibert P, Papalexi E, and Satija R (2018). Integrating single-cell transcriptomic data across different conditions, technologies, and species. Nat Biotechnol 36, 411–420. [DOI] [PMC free article] [PubMed] [Google Scholar]
- Campbell-Thompson M, Wasserfall C, Kaddis J, Albanese-O’Neill A, Staeva T, Nierras C, Moraski J, Rowe P, Gianani R, Eisenbarth G, et al. (2012). Network for Pancreatic Organ Donors with Diabetes (nPOD): developing a tissue biobank for type 1 diabetes. Diabetes Metab Res Rev 28, 608–617. [DOI] [PMC free article] [PubMed] [Google Scholar]
- Chen YG, Scheuplein F, Osborne MA, Tsaih SW, Chapman HD, and Serreze DV (2008). Idd9/11 genetic locus regulates diabetogenic activity of CD4 T-cells in nonobese diabetic (NOD) mice. Diabetes 57, 3273–3280. [DOI] [PMC free article] [PubMed] [Google Scholar]
- Dixon JR, Selvaraj S, Yue F, Kim A, Li Y, Shen Y, Hu M, Liu JS, and Ren B (2012). Topological domains in mammalian genomes identified by analysis of chromatin interactions. Nature 485, 376–380. [DOI] [PMC free article] [PubMed] [Google Scholar]
- Dufort MJ, Greenbaum CJ, Speake C, and Linsley PS (2019). Cell type-specific immune phenotypes predict loss of insulin secretion in new-onset type 1 diabetes. JCI Insight 4. [DOI] [PMC free article] [PubMed] [Google Scholar]
- Fang R, Yu M, Li G, Chee S, Liu T, Schmitt AD, and Ren B (2016). Mapping of long-range chromatin interactions by proximity ligation-assisted ChIP-seq. Cell Res 26, 1345–1348. [DOI] [PMC free article] [PubMed] [Google Scholar]
- Feng N, Vegh P, Rothenberg EV, and Yui MA (2011a). Lineage divergence at the first TCR-dependent checkpoint: preferential gammadelta and impaired alphabeta T cell development in nonobese diabetic mice. J Immunol 186, 826–837. [DOI] [PMC free article] [PubMed] [Google Scholar]
- Feng T, Cao AT, Weaver CT, Elson CO, and Cong Y (2011b). Interleukin-12 converts Foxp3+ regulatory T cells to interferon-gamma-producing Foxp3+ T cells that inhibit colitis. Gastroenterology 140, 2031–2043. [DOI] [PMC free article] [PubMed] [Google Scholar]
- Finn EH, Pegoraro G, Brandao HB, Valton AL, Oomen ME, Dekker J, Mirny L, and Misteli T (2019). Extensive Heterogeneity and Intrinsic Variation in Spatial Genome Organization. Cell 176, 1502–1515 e1510. [DOI] [PMC free article] [PubMed] [Google Scholar]
- Hamilton-Williams EE, Wong SB, Martinez X, Rainbow DB, Hunter KM, Wicker LS, and Sherman LA (2010). Idd9.2 and Idd9.3 protective alleles function in CD4+ T-cells and nonlymphoid cells to prevent expansion of pathogenic islet-specific CD8+ T-cells. Diabetes 59, 1478–1486. [DOI] [PMC free article] [PubMed] [Google Scholar]
- Heinz S, Benner C, Spann N, Bertolino E, Lin YC, Laslo P, Cheng JX, Murre C, Singh H, and Glass CK (2010). Simple combinations of lineage-determining transcription factors prime cis-regulatory elements required for macrophage and B cell identities. Mol Cell 38, 576–589. [DOI] [PMC free article] [PubMed] [Google Scholar]
- Imbeault M, Helleboid PY, and Trono D (2017). KRAB zinc-finger proteins contribute to the evolution of gene regulatory networks. Nature 543, 550–554. [DOI] [PubMed] [Google Scholar]
- Ing-Simmons E, Seitan VC, Faure AJ, Flicek P, Carroll T, Dekker J, Fisher AG, Lenhard B, and Merkenschlager M (2015). Spatial enhancer clustering and regulation of enhancer-proximal genes by cohesin. Genome Res 25, 504–513. [DOI] [PMC free article] [PubMed] [Google Scholar]
- Isoda T, Moore AJ, He Z, Chandra V, Aida M, Denholtz M, Piet van Hamburg J, Fisch KM, Chang AN, Fahl SP, et al. (2017). Non-coding Transcription Instructs Chromatin Folding and Compartmentalization to Dictate Enhancer-Promoter Communication and T Cell Fate. Cell 171, 103–119 e118. [DOI] [PMC free article] [PubMed] [Google Scholar]
- Iwafuchi-Doi M, and Zaret KS (2016). Cell fate control by pioneer transcription factors. Development 143, 1833–1837. [DOI] [PMC free article] [PubMed] [Google Scholar]
- Johnson JL, Georgakilas G, Petrovic J, Kurachi M, Cai S, Harly C, Pear WS, Bhandoola A, Wherry EJ, and Vahedi G (2018). Lineage-Determining Transcription Factor TCF-1 Initiates the Epigenetic Identity of T Cells. Immunity 48, 243–257 e210. [DOI] [PMC free article] [PubMed] [Google Scholar]
- Katz JD, Wang B, Haskins K, Benoist C, and Mathis D (1993). Following a diabetogenic T cell from genesis through pathogenesis. Cell 74, 1089–1100. [DOI] [PubMed] [Google Scholar]
- Li G, Ruan X, Auerbach RK, Sandhu KS, Zheng M, Wang P, Poh HM, Goh Y, Lim J, Zhang J, et al. (2012). Extensive promoter-centered chromatin interactions provide a topological basis for transcription regulation. Cell 148, 84–98. [DOI] [PMC free article] [PubMed] [Google Scholar]
- Li Z, Schug J, Tuteja G, White P, and Kaestner KH (2011). The nucleosome map of the mammalian liver. Nat Struct Mol Biol 18, 742–746. [DOI] [PMC free article] [PubMed] [Google Scholar]
- Lilue J, Doran AG, Fiddes IT, Abrudan M, Armstrong J, Bennett R, Chow W, Collins J, Collins S, Czechanski A, et al. (2018). Sixteen diverse laboratory mouse reference genomes define strain-specific haplotypes and novel functional loci. Nat Genet 50, 1574–1583. [DOI] [PMC free article] [PubMed] [Google Scholar]
- Link VM, Duttke SH, Chun HB, Holtman IR, Westin E, Hoeksema MA, Abe Y, Skola D, Romanoski CE, Tao J, et al. (2018a). Analysis of Genetically Diverse Macrophages Reveals Local and Domain-wide Mechanisms that Control Transcription Factor Binding and Function. Cell 173, 1796–1809 e1717. [DOI] [PMC free article] [PubMed] [Google Scholar]
- Link VM, Romanoski CE, Metzler D, and Glass CK (2018b). MMARGE: Motif Mutation Analysis for Regulatory Genomic Elements. Nucleic Acids Res 46, 7006–7021. [DOI] [PMC free article] [PubMed] [Google Scholar]
- Lyons PA, Hancock WW, Denny P, Lord CJ, Hill NJ, Armitage N, Siegmund T, Todd JA, Phillips MS, Hess JF, et al. (2000). The NOD Idd9 genetic interval influences the pathogenicity of insulitis and contains molecular variants of Cd30, Tnfr2, and Cd137. Immunity 13, 107–115. [DOI] [PubMed] [Google Scholar]
- McGinnis CS, Murrow LM, and Gartner ZJ (2019). DoubletFinder: Doublet Detection in Single-Cell RNA Sequencing Data Using Artificial Nearest Neighbors. Cell Syst 8, 329–337 e324. [DOI] [PMC free article] [PubMed] [Google Scholar]
- Mifsud B, Tavares-Cadete F, Young AN, Sugar R, Schoenfelder S, Ferreira L, Wingett SW, Andrews S, Grey W, Ewels PA, et al. (2015). Mapping long-range promoter contacts in human cells with high-resolution capture Hi-C. Nat Genet 47, 598–606. [DOI] [PubMed] [Google Scholar]
- Mingueneau M, Jiang W, Feuerer M, Mathis D, and Benoist C (2012). Thymic negative selection is functional in NOD mice. J Exp Med 209, 623–637. [DOI] [PMC free article] [PubMed] [Google Scholar]
- Mumbach MR, Rubin AJ, Flynn RA, Dai C, Khavari PA, Greenleaf WJ, and Chang HY (2016). HiChIP: efficient and sensitive analysis of protein-directed genome architecture. Nat Methods 13, 919–922. [DOI] [PMC free article] [PubMed] [Google Scholar]
- Muraro MJ, Dharmadhikari G, Grun D, Groen N, Dielen T, Jansen E, van Gurp L, Engelse MA, Carlotti F, de Koning EJ, et al. (2016). A Single-Cell Transcriptome Atlas of the Human Pancreas. Cell Syst 3, 385–394 e383. [DOI] [PMC free article] [PubMed] [Google Scholar]
- Ou HD, Phan S, Deerinck TJ, Thor A, Ellisman MH, and O’Shea CC (2017). ChromEMT: Visualizing 3D chromatin structure and compaction in interphase and mitotic cells. Science 357. [DOI] [PMC free article] [PubMed] [Google Scholar]
- Petrovic J, Zhou Y, Fasolino M, Goldman N, Schwartz GW, Mumbach MR, Nguyen SC, Rome KS, Sela Y, Zapataro Z, et al. (2019). Oncogenic Notch Promotes Long-Range Regulatory Interactions within Hyperconnected 3D Cliques. Mol Cell 73, 1174–1190 e1112. [DOI] [PMC free article] [PubMed] [Google Scholar]
- Phanstiel DH, Boyle AP, Heidari N, and Snyder MP (2015). Mango: a bias-correcting ChIA-PET analysis pipeline. Bioinformatics 31, 3092–3098. [DOI] [PMC free article] [PubMed] [Google Scholar]
- Phanstiel DH, Van Bortle K, Spacek D, Hess GT, Shamim MS, Machol I, Love MI, Aiden EL, Bassik MC, and Snyder MP (2017). Static and Dynamic DNA Loops form AP-1-Bound Activation Hubs during Macrophage Development. Mol Cell 67, 1037–1048 e1036. [DOI] [PMC free article] [PubMed] [Google Scholar]
- Phillips JE, and Corces VG (2009). CTCF: master weaver of the genome. Cell 137, 1194–1211. [DOI] [PMC free article] [PubMed] [Google Scholar]
- Phillips-Cremins JE, Sauria ME, Sanyal A, Gerasimova TI, Lajoie BR, Bell JS, Ong CT, Hookway TA, Guo C, Sun Y, et al. (2013). Architectural protein subclasses shape 3D organization of genomes during lineage commitment. Cell 153, 1281–1295. [DOI] [PMC free article] [PubMed] [Google Scholar]
- Pliner HA, Shendure J, and Trapnell C (2019). Supervised classification enables rapid annotation of cell atlases. Nat Methods 16, 983–986. [DOI] [PMC free article] [PubMed] [Google Scholar]
- Rahim MM, and Makrigiannis AP (2015). Ly49 receptors: evolution, genetic diversity, and impact on immunity. Immunol Rev 267, 137–147. [DOI] [PubMed] [Google Scholar]
- Rao SS, Huntley MH, Durand NC, Stamenova EK, Bochkov ID, Robinson JT, Sanborn AL, Machol I, Omer AD, Lander ES, et al. (2014). A 3D map of the human genome at kilobase resolution reveals principles of chromatin looping. Cell 159, 1665–1680. [DOI] [PMC free article] [PubMed] [Google Scholar]
- Roadmap Epigenomics C, Kundaje A, Meuleman W, Ernst J, Bilenky M, Yen A, Heravi-Moussavi A, Kheradpour P, Zhang Z, Wang J, et al. (2015). Integrative analysis of 111 reference human epigenomes. Nature 518, 317–330. [DOI] [PMC free article] [PubMed] [Google Scholar]
- Segerstolpe A, Palasantza A, Eliasson P, Andersson EM, Andreasson AC, Sun X, Picelli S, Sabirsh A, Clausen M, Bjursell MK, et al. (2016). Single-Cell Transcriptome Profiling of Human Pancreatic Islets in Health and Type 2 Diabetes. Cell Metab 24, 593–607. [DOI] [PMC free article] [PubMed] [Google Scholar]
- Seitan VC, Faure AJ, Zhan Y, McCord RP, Lajoie BR, Ing-Simmons E, Lenhard B, Giorgetti L, Heard E, Fisher AG, et al. (2013). Cohesin-based chromatin interactions enable regulated gene expression within preexisting architectural compartments. Genome Res 23, 2066–2077. [DOI] [PMC free article] [PubMed] [Google Scholar]
- Servant N, Varoquaux N, Lajoie BR, Viara E, Chen CJ, Vert JP, Heard E, Dekker J, and Barillot E (2015). HiC-Pro: an optimized and flexible pipeline for Hi-C data processing. Genome Biol 16, 259. [DOI] [PMC free article] [PubMed] [Google Scholar]
- Steward CA, Gonzalez JM, Trevanion S, Sheppard D, Kerry G, Gilbert JG, Wicker LS, Rogers J, and Harrow JL (2013). The non-obese diabetic mouse sequence, annotation and variation resource: an aid for investigating type 1 diabetes. Database (Oxford) 2013, bat032. [DOI] [PMC free article] [PubMed] [Google Scholar]
- Stuart T, Butler A, Hoffman P, Hafemeister C, Papalexi E, Mauck WM 3rd, Hao Y, Stoeckius M, Smibert P, and Satija R (2019). Comprehensive Integration of Single-Cell Data. Cell 177, 1888–1902 e1821. [DOI] [PMC free article] [PubMed] [Google Scholar]
- Stunnenberg HG, International Human Epigenome C, and Hirst M (2016). The International Human Epigenome Consortium: A Blueprint for Scientific Collaboration and Discovery. Cell 167, 1897. [DOI] [PubMed] [Google Scholar]
- Treger RS, Pope SD, Kong Y, Tokuyama M, Taura M, and Iwasaki A (2019). The Lupus Susceptibility Locus Sgp3 Encodes the Suppressor of Endogenous Retrovirus Expression SNERV. Immunity 50, 334–347 e339. [DOI] [PMC free article] [PubMed] [Google Scholar]
- Vahedi G, Kanno Y, Furumoto Y, Jiang K, Parker SC, Erdos MR, Davis SR, Roychoudhuri R, Restifo NP, Gadina M, et al. (2015). Super-enhancers delineate disease-associated regulatory nodes in T cells. Nature 520, 558–562. [DOI] [PMC free article] [PubMed] [Google Scholar]
- Wang YJ, Schug J, Won KJ, Liu C, Naji A, Avrahami D, Golson ML, and Kaestner KH (2016). Single-Cell Transcriptomics of the Human Endocrine Pancreas. Diabetes 65, 3028–3038. [DOI] [PMC free article] [PubMed] [Google Scholar]
- Wang YJ, Traum D, Schug J, Gao L, Liu C, Consortium H, Atkinson MA, Powers AC, Feldman MD, Naji A, et al. (2019). Multiplexed In Situ Imaging Mass Cytometry Analysis of the Human Endocrine Pancreas and Immune System in Type 1 Diabetes. Cell Metab 29, 769–783 e764. [DOI] [PMC free article] [PubMed] [Google Scholar]
- Wicker LS, Todd JA, Prins JB, Podolin PL, Renjilian RJ, and Peterson LB (1994). Resistance alleles at two non-major histocompatibility complex-linked insulin-dependent diabetes loci on chromosome 3, Idd3 and Idd10, protect nonobese diabetic mice from diabetes. J Exp Med 180, 1705–1713. [DOI] [PMC free article] [PubMed] [Google Scholar]
- Wolf G, Greenberg D, and Macfarlan TS (2015). Spotting the enemy within: Targeted silencing of foreign DNA in mammalian genomes by the Kruppel-associated box zinc finger protein family. Mob DNA 6, 17. [DOI] [PMC free article] [PubMed] [Google Scholar]
- Yamanouchi J, Puertas MC, Verdaguer J, Lyons PA, Rainbow DB, Chamberlain G, Hunter KM, Peterson LB, Wicker LS, and Santamaria P (2010). Idd9.1 locus controls the suppressive activity of FoxP3+CD4+CD25+ regulatory T-cells. Diabetes 59, 272–281. [DOI] [PMC free article] [PubMed] [Google Scholar]
- Yui MA, Feng N, Zhang JA, Liaw CY, Rothenberg EV, and Longmate JA (2013). Loss of T cell progenitor checkpoint control underlies leukemia initiation in Rag1-deficient nonobese diabetic mice. J Immunol 190, 3276–3288. [DOI] [PMC free article] [PubMed] [Google Scholar]
- Yui MA, and Rothenberg EV (2004). Deranged early T cell development in immunodeficient strains of nonobese diabetic mice. J Immunol 173, 5381–5391. [DOI] [PubMed] [Google Scholar]
- Zhou Y, Zhou B, Pache L, Chang M, Khodabakhshi AH, Tanaseichuk O, Benner C, and Chanda SK (2019). Metascape provides a biologist-oriented resource for the analysis of systems-level datasets. Nat Commun 10, 1523. [DOI] [PMC free article] [PubMed] [Google Scholar]
Associated Data
This section collects any data citations, data availability statements, or supplementary materials included in this article.
Supplementary Materials
Table S1. Genomic coordinates of strain-specific open chromatin regions defined by DESeq2 (related to Figure 1).
Table S2. Analysis of allele-specific ATAC-seq and Smc1 ChIP-seq in F1 hybrid mice (related to Figures 1 and S7F).
Table S3. Ensembl IDs of strain-specific transcribed genes defined by DESeq2 (related to Figure 2).
Table S6. Annotation of 3D cliques in C57BL/6 and NOD using HiChIP and Oligos used for 3D FISH at four genomic regions (related to Figures 3, 4, 5, 6, and 7).
Table S7. List of donors procured by HPAP used for scRNA-seq analysis in islets (related to Figures 7F and S7G).