Abstract
Background
Current guidelines lack recommendations for the use of immunotherapy and immune-related biomarkers for hepatocellular carcinoma (HCC). We aim to provide reliable evidence of the association of survival with HCC immunotherapy and to demonstrate that genomic mutation signature could be an effective biomarker to predict immunotherapy efficacy of HCC patients.
Methods
We conducted a meta-analysis of 17 randomized trials with 2055 patients and an individual patient-level analysis of 31 patients. Trial data were identified in PubMed, EMBASE and Cochrane Central library, and individual patient data were obtained from the cBioPortal database. Overall survival (OS) and progression-free survival (PFS) were assessed with the hazard ratio (HR) and 95% CI. This study is registered with PROSPERO, number CRD42018083991.
Results
The meta-analysis showed that compared to conventional therapy, immunotherapy resulted in prolonged OS (HR =0.65, P<0.0001, high quality) and PFS (HR =0.81, P<0.0001, high quality); the benefits were observed for cellular immunotherapy, tumor vaccine, and cytokine immunotherapy. Findings were robust to subgroup and trial sequential analyses. In the individual patient-level analysis of patients treated with immune checkpoint inhibitor, mutations in TERT, CTNNB1, BRD4, or MLL, and co-mutations in TP53 and TERT or BRD4 were associated with significantly worse survival. These oncogenes were used to develop a novel integrated mutation risk score, which exhibited better utility in predicting survival than the tumor mutation burden (TMB). Patients with low- versus high- mutation risk score had longer OS (HR =0.18, P=0.02) and PFS (HR =0.33, P=0.018). A nomogram comprising the mutation risk score and essential clinical factors further improved the predictive accuracy (AUC =0.840 for both 1- and 2-year OS).
Conclusions
Immunotherapy showed longer OS and PFS than conventional therapy among HCC patients, especially patients with a low mutation risk score. The nomogram based on genomic and clinical characteristics is effective in predicting survival of HCC patients undergoing immune checkpoint inhibitor.
Keywords: Hepatocellular carcinoma (HCC), immunotherapy, efficacy, genomic mutation
Introduction
Immune checkpoint inhibitor targeting programmed death 1 (PD-1), programmed cell death-ligand 1 (PD-L1) and cytotoxic T-lymphocyte-associated antigen 4 (CTLA-4) has achieved encouraging clinical results in many malignancies, such as non-small-cell lung cancer (NSCLC) (1), and this approach is being widely tested in patients with hepatocellular carcinoma (HCC) (2-4). Immunotherapy for HCC could also be accomplished by administering cytokines, tumor vaccines, and cellular immunotherapies. However, previous randomized trials have produced inconsistent results (5,6), and current guidelines (7-10) lack clear recommendations for the administration of these immunotherapies as treatment options for HCC.
Moreover, the development of personalized immunotherapy for HCC has been hampered by the lack of reliable biomarkers. The clinical implications of current biomarkers, such as the tumor mutation burden (TMB) and PD-L1 expression in patients with HCC were controversial. Findings from both the CheckMate 040 (11) and KEYNOTE-224 trials (12) did not support the use of PD-L1 expression as a biomarker for selecting HCC patients for immune checkpoint inhibitor, highlighting the need to develop novel predictive biomarkers to identify HCC candidates who might respond to immunotherapy.
To the best of our knowledge, herein we reported the most comprehensive study to date examining the association of survival with immunotherapy in HCC and the first study to reveal the predictive value of genomic mutation signature for HCC immunotherapy by performing a high-quality meta-analysis of randomized trials and an individual patient-level analysis.
Methods
Study design and patients
This study consisted of a meta-analysis and an individual-patient level analysis, designed according to the PRISMA statement (13), Cochrane Collaboration recommendations (14), and TRIPOD guidelines (15), and was registered with PROSPERO, number CRD42018083991.
For the meta-analysis, we searched PubMed, EMBASE, Cochrane Central library, ClinicalTrials.gov and manually checked references from conference proceedings of the American Society of Clinical Oncology (ASCO), European Society for Medical Oncology, and American Association for Cancer Research published through June 2019. The main keywords and MeSH terms used for the search were HCC, immunotherapy, cellular immunotherapy, tumor vaccine, immune checkpoint inhibitor, cytokine immunotherapy, interferon therapy, and randomized controlled trial (RCT). Searches were limited to human studies, with the language restricted to English. This search also reviewed the references of relevant articles before final selection.
Trials meeting the following criteria were eligible: (I) RCTs, (II) trials examining patients staged I–III [AJCC 8th edition staging system (7)] or A–C [BCLC staging system (8)] HCC, (III) trials comparing immunotherapy with conventional therapy, and (IV) trials with available OS or PFS outcomes. Exclusion criteria were (I) trials without immunotherapeutic drug treatment; (II) trials analysing participants with extrahepatic metastasis, including lymph node metastasis and distant metastasis; (III) retrospective or prospective observational cohort studies; and (IV) abstracts from meeting proceedings that lacked available data, (V) trials with less than 30 participants that possibly had strong bias caused by a small patient sample size (14). When the tumor stage was not directly reported, we inferred staging according to the data on tumor size, tumor number or vascular invasion and metastasis statuses using criteria from the AJCC 8th edition or BCLC staging system. We also modified the tumor stage in accordance with the AJCC 8th edition if staging was reported based on previous staging systems. Two independent investigators (Q-YO and A-LL) evaluated trials for eligibility, and discrepancies were resolved by discussion between the investigators.
Three investigators (Q-YO, Y-FY, and A-LL) independently extracted the data from trials, and discrepancies were reconciled after discussion. The extracted data included the trial name or lead author; publication year; study design; gender, age, and number of participants; type of hepatitis virus infection; tumor stage; regimens administered to the two groups; the immunotherapy drug administered; outcomes including overall survival (OS) and progression-free survival (PFS). Cochrane Collaboration’s tool was used to assess the risk of bias in the included randomized trials.
The prospective next-generation sequencing data used for the individual patient-level analysis were obtained from Memorial Sloan Kettering Cancer Center cohort (MSK cohort: http://cbioportal.org/study?id=hcc_mskimpact_2018) (16). Patients with HCC who were treated with immune checkpoint inhibitor were eligible. Ethics approval and patient consent were not required because our data were retrieved from public database.
Statistical analysis
For the meta-analysis, time-to-event data and dichotomous data outcomes were calculated by pooling the hazard ratios (HRs) or relative risks (RRs) with their 95% confidence intervals (CIs), which were directly collected from each trial or calculated using the method provided by Parmar et al. (17). All data were pooled using the random-effects model and weighted for the number of patients included in each trial. Statistical heterogeneity between trials was evaluated using the I2 statistic, with values greater than 50% indicating substantial heterogeneity. The Grading of Recommendations, Assessment, Development, and Evaluation method was used to examine the level of evidence for outcomes of interest (18).
We used TSA Beta software (version 0.9) to perform a trial sequential analysis (TSA) that enables the calculation of the required information size (i.e., number of participants), monitors boundaries to decide whether a trial could be terminated early, and indicates whether a P value is sufficient to indicate a reliable effect for the benefit, harm, or futility before the required information size is reached (19). Type I errors of 5% and type II errors of 20% (power =80%) were set, and heterogeneity was adjusted based on model variance.
We estimated differences in the treatment effect size between OS and PFS by calculating the pooled ratio of HRs (rHR = HRPFS/HROS) and 95% CIs. Then, we assessed surrogate end point usage of PFS for OS through applying a linear regression model to OS and PFS with the regression equation HROS = α + β × HRPFS, which was weighted by the sample size of each randomized comparison. The coefficient of determination (R2) was used to evaluate the strength of the correlation.
For the individual patient-level analysis, OS and PFS were estimated using the Kaplan-Meier method and the treatment effects were assessed with the log-rank test. HRs and 95% CIs were estimated using the Cox regression model. Categorical variables were compared with χ2 tests. We subjected patients carrying mutated genes and their corresponding survival outcomes to the multivariate Cox regression analysis to generate the mutation risk score. TMB and the mutation risk score were categorized into high-value and low-value groups with the optimal cutoff values defined by the R package ggsurvimier. We used the rms package of R to generate a nomogram. The significant clinical risk factors were determined by performing a univariate Cox analysis. We generated receiver operating characteristic (ROC) curves to evaluate the predictive and prognostic accuracy of the signature and calculated the area under the curves to assess its sensitivity and specificity. We used the R package ComplexHeatmap to establish an oncoprint plot and visualize the frequencies of altered genes. To evaluate the correlation between OS and PFS at the individual-patient level, the Spearman ρ correlation coefficient was used. For all analyses, P values less than 0.05 were considered statistically significant. All statistical analyses were performed using R version 3.4.4 (R Foundation for Statistical Computing, Vienna, Austria).
Results
Trial and patient characteristics
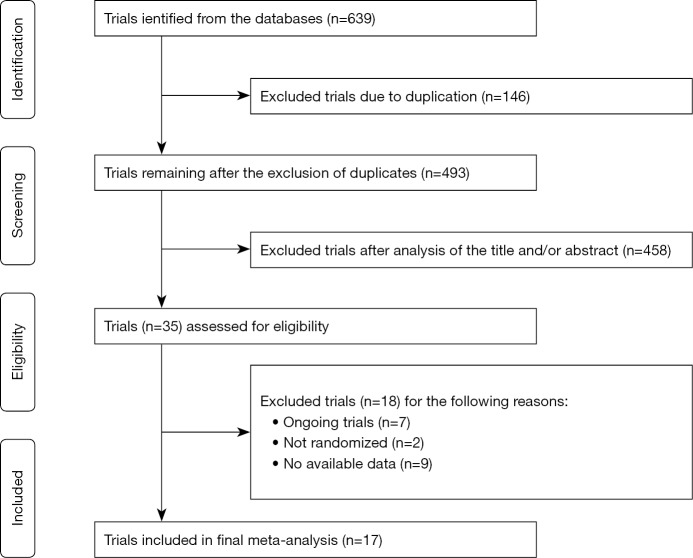
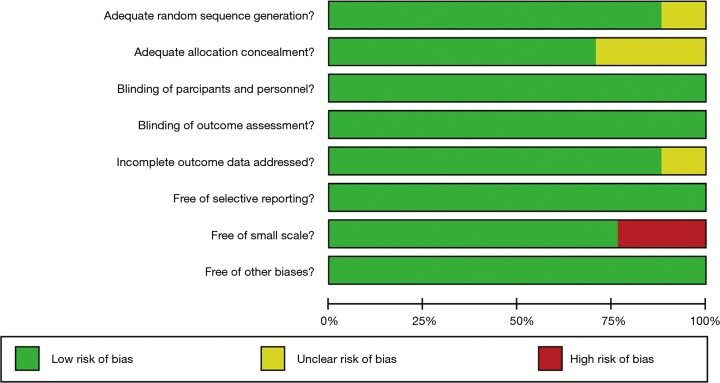
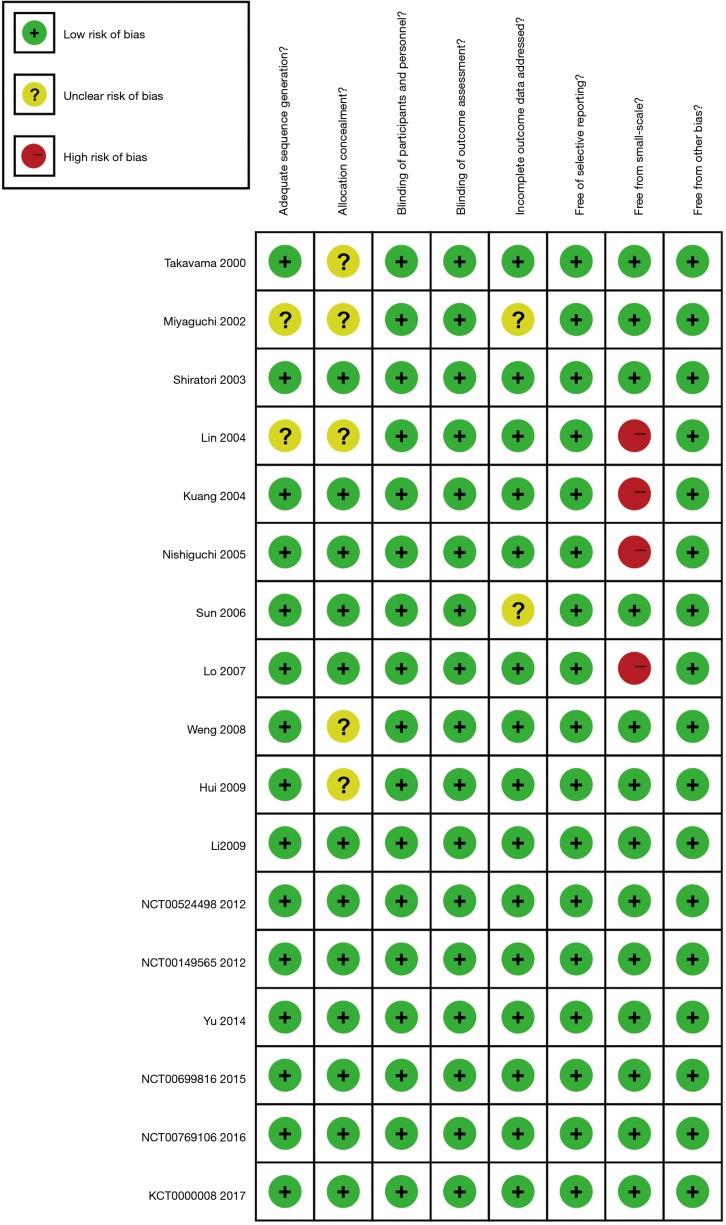
Seventeen RCTs (5,6,20-34) meeting the inclusion criteria were ultimately subjected to the meta-analysis (Figure S1). A preliminary abstract of this study was published in the 2018 annual ASCO meeting (35). These trials enrolled 2,055 participants with HCC, including 1,062 who received immunotherapy and 993 who received conventional therapy. Six, nine, and two trials examined cellular immunotherapy, cytokine immunotherapy, and tumor vaccines, respectively. All immune checkpoint inhibitor trials failed to meet the eligibility criteria due to non-randomized setting or limited data access to conference proceedings. The detailed trial and patient characteristics are presented in Table S1. Most trials rated as low in the assessment of the risk of bias for each item (Figures S2,S3).
Figure S1.
PRISMA flow diagram of the meta-analysis.
Table S1. Characteristics of the included trials.
| Study (year) | Study design | Mean/median age, years, (range) | No. of participants (Im:control) | Hepatitis virus (%) | TNM stagea | BCLC stage | Regimen of the Im group | Regimen of the control group | Infusion of Im drug, times | Duration of Im drug, months | Dose per infusion of Im drugb |
|---|---|---|---|---|---|---|---|---|---|---|---|
| Takayama et al. (24) (2000) | RCT | NR | 150 (76:74) | B (19.3%), C (66.0%) | I/II/IIIA/IIIB | A/B/C | Hr + ALT | Hr + Obs | 5 | 5.6 | 1.5×10¹⁰ |
| Weng et al. (33) (2008) | RCT | Median, Im: 55.4 (47.2–63.6), control: 56.4 (45.8–67) | 85 (45:40) | NR | I/II/IIIA | A/B/C | TACE + RFA + CIKT | TACE + RFA + Obs | 8 or 10 | <10 | 1.0×10¹⁰–1.5×10¹⁰ |
| Hui et al. (34) (2009) | RCT | NR | 127 (84:43) | B (75.6%) | I/II | A/B/C | Hr + CIKT | Hr + Obs | A: 3, B: 6 | A: 1.4, B: 2.8 | 1.0×10¹⁰–2.0×10¹⁰ |
| Yu et al. (20) (2014)c | RCT, phase II | NA | 82 (41:41) | B (NA) | I/II/IIIA | A/B/C | A: Hr + CIKT, B: TACE + CIKT | A: Hr + Obs, B: TACE + Obs | 72 | 36 | 5.1×10⁹ |
| NCT00699816 (5) (2015) | RCT, phase III | Mean, Im: 43 (29.0–60.0), control: 45 (31.0–67.0) | 226 (114:112) | B (82.3%), C (8.4%), coinfection (1.8%) | I/II | A/B/C | A: Hr + CIKT, B: RFA + CIKT, C: PEI + CIKT | A: Hr + Obs, B: RFA + Obs, C: PEI + Obs | 16 | 14 | 6.4×10⁹ |
| NCT00769106 (6) (2016) | RCT, phase III | Median, Im: 43 (38.0–56.0), control: 52 (43.0–60.0) | 200 (100:100) | B (85.5%) | I/II/IIIA | A/B/C | Hr + CIKT | Hr + Obs | 4 | 3 | 1.0×10¹⁰–1.5×10¹⁰ |
| Miyaguchi et al. (23) (2002) | RCT | Mean, Im: 66.2 (58.8–73.6), control: 65.0 (57.9–72.1) | 46 (22:24) | C (100%) | I/II | A/B | TACE + PEI + IFN-α | TACE + PEI | 52 | 4 | 3 |
| Shiratori et al. (26) (2003) | RCT | Median, Im: 61 (37.0–70.0), control: 63 (51.0–69.0) | 74 (49:25) | C (100%) | I/II | A/B/C | PEI + IFN-α | PEI + Obs | 144 | 11.2 | 6 |
| Lin et al. (30) (2004) | RCT | Median, Im: 61.5 (26.0–70.0), control: 59 (49.0–72.0) | 30 (20:10) | B (53.3%), C (46.7%) | I/II | A/B/C | A: PAIM + IFN-α, B: TACE + PAI + IFN-α | A: PAIM + placebo, B: TACE + PAI + placebo | Mean: 224, A: 309, B: 120 | 24 | 3 |
| Nishiguchi et al. (27) (2005) | RCT | Mean, Im: 61.9 (56.1–67.7), control: 60.0 (55.2–64.8) | 30 (15:15) | C (100%) | I | A | Hr + IFN-α | Hr + Obs | 232 | 24.3 | 6 |
| Sun et al. (25) (2006) | RCT | Median, 50 (20.0–77.0) | 236 (118:118) | B (100%) | I/II/IIIA | A/B/C | Hr + IFN-α | Hr + Obs | 232 | 18 | 5 |
| Lo et al. (29) (2007)c | RCT | NA | 41 (20:21) | B (≥95%) | I/II | A/B/C | Hr + IFN-α | Hr + Obs | 48 | 3.7 | 10 |
| Li et al. (31) (2009) | RCT | Median, 48 (20.0–73.0) | 216 (108:108) | B (100%) | I/II/IIIA | A/B/C | TACE + IFN-α | TACE | 135 | 11.2 | 3 |
| NCT00524498 (28) (2012) | RCT, phase II | Mean, Im: 64.0 (55.1–72.9), control: 65.5 (55.4–75.6) | 61 (30:31) | B (27.9%), C (47.5), alcoholic (14.8%) | IIIB | C | FAIT | FAIC | 12–48 | 1–3.7 | 5 |
| NCT00149565 (22) (2012) | RCT, phase III | Median, Im: 50 (48.0–54.0), control: 49 (46.0–51.0) | 268 (133:135) | B (80.2%), C (19.8%) | I/II/IIIA | A/B/C | Hr + IFN-α | Hr + Obs | 164 | 12.4 | 5 |
| Kuang et al. (21) (2004) | RCT, phase II | Mean, Im: 48 (39.0–57.0), control: 47 (34.0–60.0) | 39 (18:21) | B (89.7%), C (2.6%) | I/II/IIIA | A/B/C | Hr + AFTV | Hr + Obs | 3 | 1.4 | 40 µLd |
| KCT0000008 (32) (2017) | RCT, phase II | Mean, Im: 57.1 (47.6–66.6), control: 58.1 (47.3–68.9) | 144 (69:75) | B (72.2%), C (11.1%), coinfection (1.4%) | I/II/III | A/B/C | DCVT | Obs | 6 | 3.3 | 3×10⁷ |
a, the tumor-node-metastasis staging of the tumors was determined according to the most recent American Joint Committee on Cancer staging system (8th edition); b, the unit of the dose for the cellular immunotherapy group and KCT0000008 was the cell count, and the unit for the cytokine immunotherapy group was million international units (MIU); c, patients with stage IV HCC were excluded from this study; d, the treatment dose included 40 µL of packed autologous formalin-fixed HCC fragments. AFTV, autologous formalin-fixed tumor vaccine; ALT, autologous lymphocyte therapy; BCLC, Barcelona Clinic Liver Cancer; CIKT, cytokine-induced killer therapy; DCVT, dendritic cell vaccine therapy; FAIC, 5-fluorouracil arterial infusion + cisplatin; FAIT, 5-fluorouracil arterial infusion + interferon therapy; Hr, hepatic resection; Im, immunotherapy; IFN-α, interferon-α therapy; NA, not applicable; NR, not reported; Obs, observation; PAI, percutaneous acetic acid injection; PAIM, percutaneous acetic acid injection monotherapy; PEI, percutaneous ethanol injection; RCT, randomized controlled trial; RFA, radiofrequency ablation; TACE, transcatheter arterial chemoembolization; TAE, transcatheter arterial embolization; TNM, tumor-node-metastasis; TVT, tumor vaccine therapy; OS, overall survival; and PFS, progression-free survival.
Figure S2.
Risk of bias graph.
Figure S3.
Risk of bias summary.
Next, we performed an individual patient-level analysis using the MSK cohort (16) with 31 patients with advanced HCC. Most patients had BCLC stage C [22 (71%)] and Child Pugh stage A [25 (81%)] HCC. The immune checkpoint inhibitors used included anti-PD-1/PD-L1 monotherapy [25 (81%)], anti-CTLA-4 monotherapy [1 (3%)], and combination immunotherapy combining PD-1/PD-L1 inhibitor with therapy targeting checkpoints such as CTLA-4 and LAG-3 [5 (16%)].
Association of OS and PFS with immunotherapy
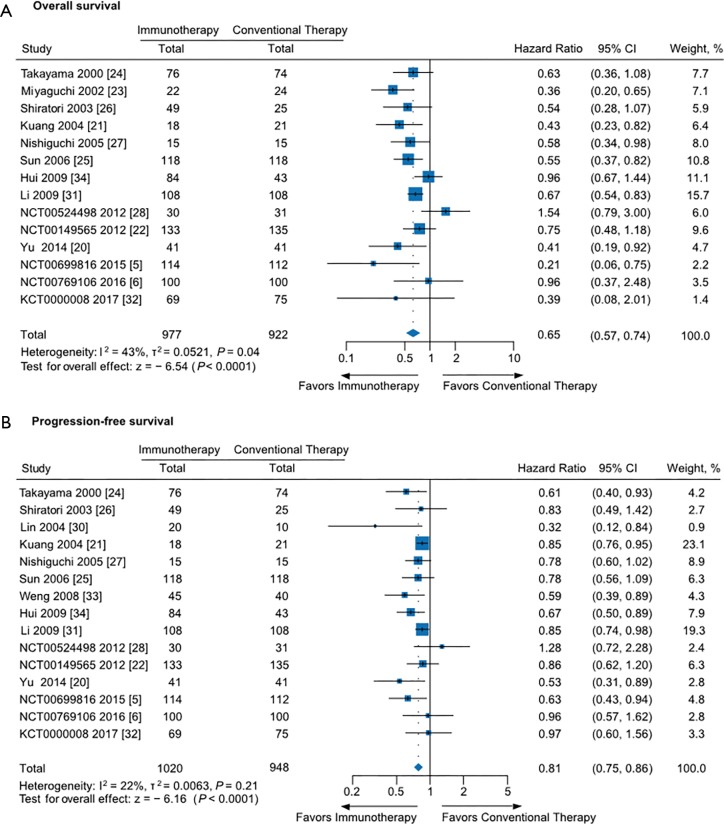
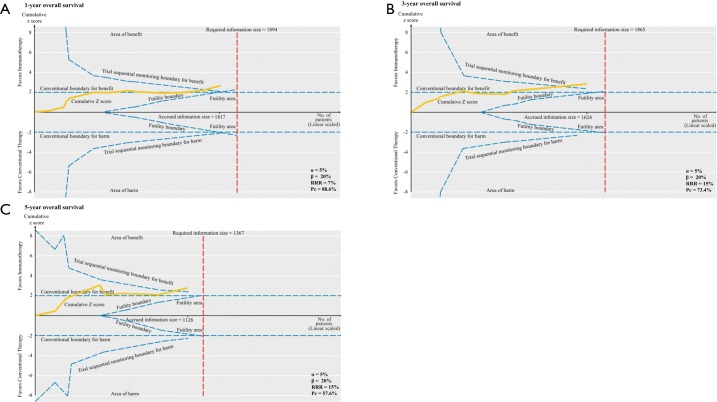
The pooled analyses of OS and PFS provided high-quality evidence showing significant associations of immunotherapy with a 35% reduction in the risk of death (HR =0.65; 95% CI: 0.57 to 0.74; P<0.0001) and a 19% reduction in the risk of progression (HR =0.81; 95% CI: 0.75 to 0.86; P<0.0001) compared to conventional therapy (Figure 1 and Table S2). Additionally, moderate- to high- quality evidence supports the use of immunotherapy in terms of 1-year OS (RR =1.04; 95% CI: 1.01 to 1.07; P=0.004), 3-year OS (RR =1.11; 95% CI: 1.03 to 1.20; P=0.01), or 5-year OS (RR =1.17; 95% CI: 1.06 to 1.28; P=0.001) (Figure S4 and Table S2). Moreover, the TSA of 1-, 3-, and 5-year OS suggested that further trials were unnecessary and unlikely to change the outcomes (Figure S5).
Figure 1.
Pooled hazard ratios for overall survival (A) and progression-free survival (B) of patients undergoing immunotherapy versus conventional therapy. CI, confidence interval.
Table S2. Summary of the estimates and GRADE evidence in the analyses of clinical outcomes.
| Quality assessment | No of patients | Effect | Quality (importance) | ||||||||
|---|---|---|---|---|---|---|---|---|---|---|---|
| No. | Design | Risk of bias | Inconsistency | Indirectness | Imprecision | Publication bias | Immunotherapy | Conventional therapy | Relative (95% CI) | Absolute | |
| Overall survival | |||||||||||
| 14 | Randomized trials | No serious risk of bias | No serious inconsistency | No serious indirectness | No serious imprecision | None detected | Not applicable | HR 0.65 (0.57 to 0.74) | Not applicable | ⊕⊕⊕⊕High (critical) | |
| Progression-free survival | |||||||||||
| 15 | Randomized trials | No serious risk of bias | No serious inconsistency | No serious indirectness | No serious imprecision | None detected | Not applicable | HR 0.81 (0.75 to 0.86) | Not applicable | ⊕⊕⊕⊕High (critical) | |
| 1-year overall survival | |||||||||||
| 14 | Randomized trials, samples: 1,858, events: 1,682 | No serious risk of bias | No serious inconsistency | No serious indirectness | No serious imprecision | None detected | 883/956 (92.4%) | 799/902 (88.6%) | RR 1.04 (1.01 to 1.07) | 27 more per 1,000 (from 0 more to 53 more) | ⊕⊕⊕⊕High (critical) |
| Moderate 90.4% | 27 more per 1,000 (from 0 more to 54 more) | ||||||||||
| 3-year overall survival | |||||||||||
| 12 | Randomized trials, samples: 1,624, events: 1,272 | No serious risk of bias | Seriousa | No serious indirectness | No serious imprecision | None detected | 697/841 (82.9%) | 575/783 (73.4%) | RR 1.11 (1.03 to 1.20) | 81 more per 1,000 (from 22 more to 147 more) | ⊕⊕⊕O Moderate (critical) |
| Moderate 78% | 86 more per 1,000 (from 23 more to 156 more) | ||||||||||
| 5-year overall survival | |||||||||||
| 8 | Randomized trials, samples: 1,126, events: 693 | No serious risk of bias | No serious inconsistency | No serious indirectness | No serious imprecision | None detected | 387/595 (65%) | 306/531 (57.6%) | RR 1.17 (1.06 to 1.28) | 81 more per 1,000 (from 12 more to 150 more) | ⊕⊕⊕⊕High (critical) |
| Moderate 52% | 73 more per 1,000 (from 10 more to 135 more) | ||||||||||
GRADE Working Group grades of evidence: ⊕⊕⊕⊕ High quality: further research is very unlikely to change our confidence in the estimate of the effect; ⊕⊕⊕O Moderate quality: further research is likely to have an important impact on our confidence in the estimate of the effect and may change the estimate; ⊕⊕OO Low quality: further research is very likely to have an important impact on our confidence in the estimate of the effect and is likely to change the estimate; ⊕OOO Very low quality: we are very uncertain about the estimate. a, downgraded (−1) for inconsistency: heterogeneity greater than 50% was observed in this subgroup. RR, risk ratio; HR, hazard ratio; and CI, confidence interval.
Figure S4.
Pooled analysis of overall survival rate of immunotherapy versus conventional therapy. Pooled analysis of 1-year overall survival rate (A), 3-year overall survival rate (B), and 5-year overall survival rate (C). CI, confidence interval.
Figure S5.
Trial sequential analyses of trials comparing immunotherapy with conventional therapy. Trial sequential analyses for 1-year overall survival rate (A), 3-year overall survival rate (B), and 5-year overall survival rate (C). The solid yellow cumulative Z curves indicate the cumulative Z score obtained from the inverse variance model Z statistic when a new trial is added. The solid yellow cumulative Z curves cross the dashed blue trial sequential alpha for monitoring boundaries. The horizontal dotted blue lines illustrate the traditional level of statistical significance (P=0.05). Pc = event proportion in the conventional therapy group. RRR, relative risk reduction.
Cellular immunotherapy was associated with significantly longer OS (HR =0.64; 95% CI: 0.41 to 0.99; P=0.049) and PFS (HR =0.65; 95% CI: 0.55 to 0.76; P<0.0001). The OS benefit was particularly evident in trials applying the high infusion-long-term-low dose method (HR =0.34; 95% CI: 0.17 to 0.66; P=0.002), but not for trials applying the low infusion-short-term-high dose method (HR =0.85; 95% CI: 0.63 to 1.14; P=0.28); the difference between subgroups was significant (P for the interaction =0.01) (Table S3).
Table S3. Subgroup analyses for progression-free and overall survival in the meta-analysis.
| Subgroup | Overall survival | Progression-free survival | |||||||||||
|---|---|---|---|---|---|---|---|---|---|---|---|---|---|
| No. of trials | HR | 95% CI | I2 | Pa | Pb | No. of trials | HR | 95% CI | I2 | Pa | Pb | ||
| Type of immunotherapy | 14 | 0.65 | 0.57 to 0.74 | 43% | <0.0001 | 0.26 | 15 | 0.81 | 0.75 to 0.86 | 22% | <0.0001 | 0.02 | |
| Cellular immunotherapy | 5 | 0.64 | 0.41 to 0.99 | 52% | 0.049 | 6 | 0.65 | 0.55 to 0.76 | 0% | <0.0001 | |||
| Drug administrationc | 0.01 | 0.51 | |||||||||||
| High infusion-long term-lowd dose | 2 | 0.34 | 0.17 to 0.66 | 0% | 0.002 | 2 | 0.59 | 0.43 to 0.81 | 0% | 0.001 | |||
| Low infusion-short term-high dose | 3 | 0.85 | 0.63 to 1.14 | 0% | 0.28 | 4 | 0.67 | 0.55 to 0.81 | 0% | <0.0001 | |||
| Cytokine immunotherapy | 7 | 0.65 | 0.56 to 0.75 | 50% | <0.0001 | 7 | 0.83 | 0.75 to 0.93 | 6% | 0.0007 | |||
| Drug administrationd | 0.32 | 0.24 | |||||||||||
| High infusion-long term | 2 | 0.56 | 0.41 to 0.77 | 0% | 0.0004 | 3 | 0.75 | 0.61 to 0.92 | 35% | 0.006 | |||
| Low infusion-short term | 5 | 0.68 | 0.48 to 0.96 | 63% | 0.03 | 4 | 0.87 | 0.77 to 0.98 | 0% | 0.02 | |||
| Stage | 0.009 | 0.14 | |||||||||||
| I/II/IIIA | 6 | 0.62 | 0.53 to 0.72 | 1% | <0.0001 | 6 | 0.82 | 0.74 to 0.91 | 0% | 0.0003 | |||
| IIIB | 1 | 1.54 | 0.79 to 3.00 | – | 0.2 | 1 | 1.28 | 0.72 to 2.28 | – | 0.4 | |||
| Hepatitis | 0.16 | 0.66 | |||||||||||
| B | 2 | 0.64 | 0.53 to 0.77 | 0% | <0.0001 | 2 | 0.84 | 0.74 to 0.96 | 0% | 0.008 | |||
| C | 3 | 0.49 | 0.35 to 0.68 | 0% | <0.0001 | 2 | 0.79 | 0.62 to 1.00 | 0% | 0.051 | |||
| Mean/median age | 0.12 | 0.39 | |||||||||||
| ≥60 years | 3 | 0.49 | 0.35 to 0.68 | 0% | <0.0001 | 3 | 0.75 | 0.60 to 0.95 | 37% | 0.01 | |||
| <60 years | 3 | 0.66 | 0.55 to 0.78 | 0% | <0.0001 | 3 | 0.84 | 0.75 to 0.95 | 0% | 0.005 | |||
| Tumor vaccine | 2 | 0.42 | 0.23 to 0.77 | 0% | 0.005 | 2 | 0.86 | 0.77 to 0.95 | 0% | 0.005 | |||
| Combined regimene | 12 | 0.63 | 0.55 to 0.72 | 31% | <0.0001 | 0.30 | 19 | 0.80 | 0.75 to 0.86 | 32% | <0.0001 | 0.90 | |
| Hepatic resection | 8 | 0.68 | 0.56 to 0.81 | 5% | <0.0001 | 10 | 0.80 | 0.74 to 0.87 | 0% | <0.0001 | |||
| Locoregional therapyf | 4 | 0.48 | 0.31 to 0.73 | 60% | 0.0005 | 9 | 0.71 | 0.52 to 0.96 | 60% | 0.03 | |||
a, P value for the test of the overall effect; b, P value for differences between subgroups; c, the cutoff points for infusions, the duration, and dose were 15 times, 10 months, and 1.0×1,010 cells, respectively; d, the cutoff points for infusions and the duration were 200 times and 20 months, respectively; e, if possible, a trial was divided into 2 or 3 subtrials based on the combined regimen administered to this subgroup; f, locoregional therapy included ablation, transcatheter arterial chemoembolization (TACE), and their combination. HR, hazard ratio; and CI, 95% confidence interval.
Cytokine immunotherapy resulted in longer OS (HR =0.65; 95% CI: 0.56 to 0.75; P<0.0001) and PFS (HR =0.83; 95% CI: 0.75 to 0.93; P=0.0007), particularly for patients with stage I–IIIA HCC (OS: HR =0.62; 95% CI: 0.53 to 0.72; P<0.0001; PFS: HR =0.82; 95% CI: 0.74 to 0.91; P=0.0003), but not for patients with stage IIIB HCC (OS: HR =1.54; 95% CI: 0.79 to 3.00; P=0.2; PFS: HR =1.28; 95% CI: 0.72 to 2.28; P=0.4) (Table S3). Longer survival was also noted in patients treated with a tumor vaccine (OS: HR =0.42; 95% CI: 0.23 to 0.77; P=0.005; PFS: HR =0.86; 95% CI: 0.77 to 0.95; P=0.005) (Table S3).
The subgroup analysis of combined modality showed that locoregional therapy (OS: HR =0.48; 95% CI: 0.31 to 0.73; P=0.0005; PFS: HR =0.71; 95% CI: 0.52 to 0.96; P=0.03) and hepatic resection (OS: HR =0.68; 95% CI: 0.56 to 0.81; P<0.0001; PFS: HR =0.80; 95% CI: 0.74 to 0.87; P<0.0001) exhibited similar treatment effects (P for the interaction =0.30 and 0.90 for OS and PFS, respectively) (Table S3).
Association of oncogenic driver alterations with immunotherapy
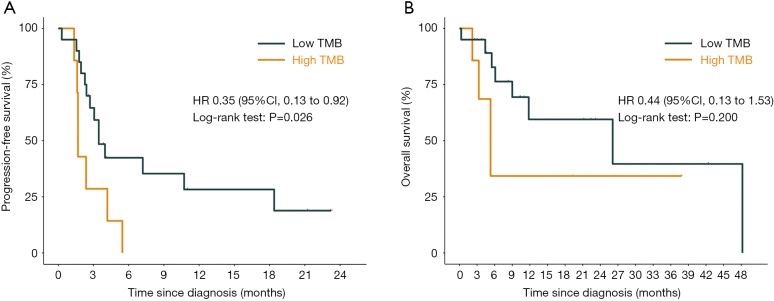
Within the MSK cohort, we next sought to evaluate the ability of the TMB to predict the efficacy of immune checkpoint inhibitor in patients with HCC. Using 5 as the cutoff value, patients with a low TMB had a significantly better PFS (HR =0.35; 95% CI: 0.13 to 0.92; P=0.026) than patients with a high TMB, but this benefit did not translate into increased OS (HR =0.44; 95% CI: 0.13 to 1.53; P=0.20) (Figure S6). The ability of TMB to predict 1-, 2-, and 3-year PFS was shown to have an AUC of 0.761, 0.671, and 0.671, respectively; however, TMB did not maintain the predictive ability when assessing OS (AUC =0.480, 0.480, and 0.564 for 1-, 2-, and 3-year OS, respectively; Table S4).
Figure S6.
Survival analysis stratified by tumor mutation burden. (A) Progression-free survival analysis and (B) overall survival analysis. HHR, hazard ratio; CI, confidence interval.
Table S4. Summary of receiver operating characteristic curve analyses.
| Predictor | Overall survival | Progression-free survival | |||||
|---|---|---|---|---|---|---|---|
| 1-year AUC | 2-year AUC | 3-year AUC | 1-year AUC | 2-year AUC | 3-year AUC | ||
| Tumor mutation burden | 0.480 | 0.480 | 0.564 | 0.761 | 0.671 | 0.671 | |
| Mutation risk score | 0.783 | 0.783 | 0.586 | 0.743 | 0.625 | 0.625 | |
| Nomogram | 0.840 | 0.840 | 0.614 | 0.879 | 0.780 | 0.780 | |
AUC, the area under the curve.
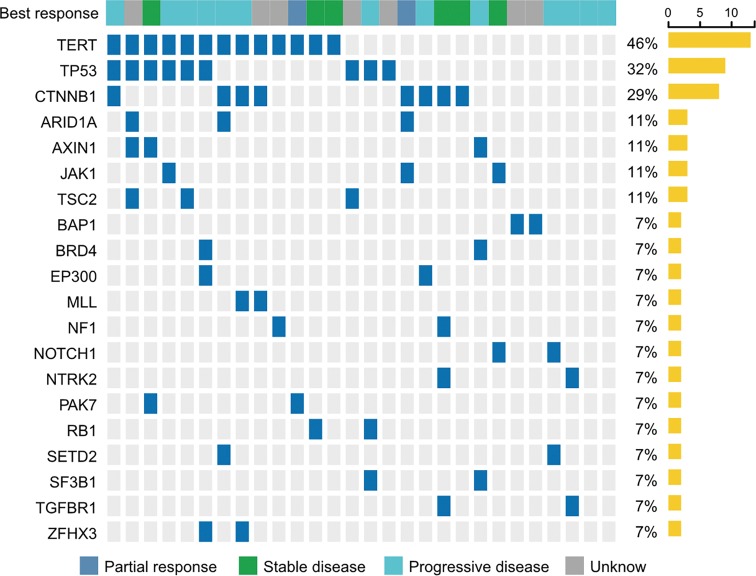
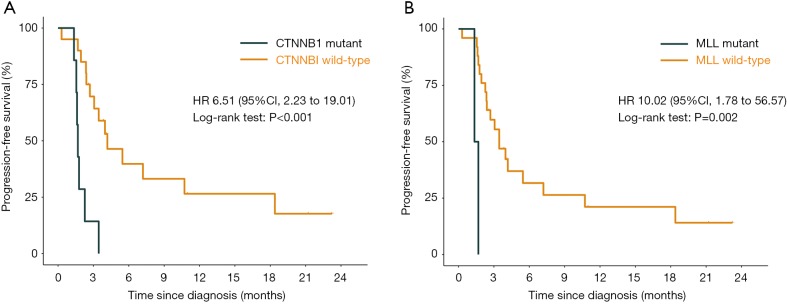
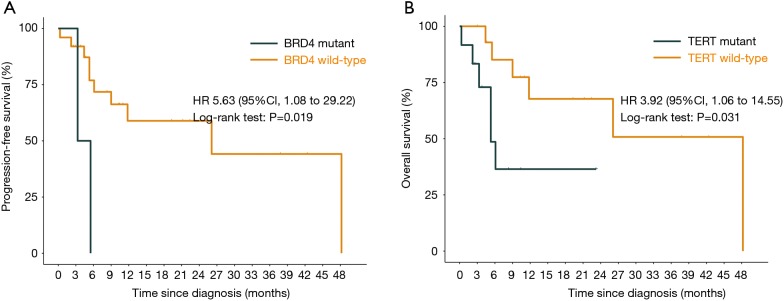
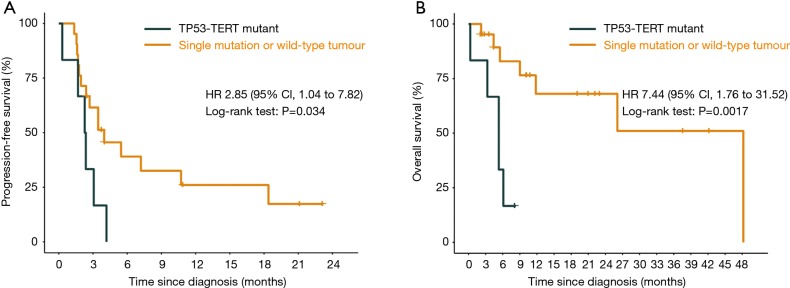
An oncoprint that depicted the landscape of the oncogenic driver mutations across the cohort is shown in Figure 2. Among 20 genes whose mutation rate was no less than 7%, TERT (46%), CTNNB1 (29%), BRD4 (7%), and MLL (7%) were frequently mutated and associated with shorter survival (TERT: HR =3.92, P=0.031 for OS; CTNNB1: HR =6.51, P<0.001 for PFS; BRD4: HR =5.63, P=0.019 for OS; MLL: HR =10.02, P=0.002 for PFS; Figures S7,S8). Mutations in TP53 [10 (32%)] were common but could not affect survival (P=0.230 and 0.860 for OS and PFS, respectively) (Table S5). We continued to investigate whether co-occurring gene mutations exhibited a synergistic interaction with TP53 mutations on survival. Significantly shorter survival was identified in patients carrying concurrent TP53 and TERT mutations (OS: HR =7.44; 95% CI: 1.76 to 31.52; P=0.0017; PFS: HR =2.85; 95% CI: 1.04 to 7.82; P=0.034; Figure 3) or concurrent TP53 and BRD4 mutations (OS: HR =11.93; 95% CI: 1.08 to 131.90; P=0.010; Table S5) compared with patients carrying a single gene mutation or wild-type tumors. Additional results for mutated genes are summarized in Table S5.
Figure 2.
Landscape of oncogenic driver mutations in patients treated by immune checkpoint inhibitor.
Figure S7.
Progression-free survival analysis in the MSK cohort stratified by gene mutation status. (A) Progression-free survival analysis on immune checkpoint inhibitor for patients with CTNNB1 mutation versus CTNNB1 wild-type tumors. (B) The same analysis as (A), but patients with MLL mutations were compared MLL wild-type tumors. HR, hazard ratio; CI, confidence interval.
Figure S8.
Overall survival analysis in the MSK cohort stratified by gene mutation status. (A) Overall survival analysis on immune checkpoint inhibitor for patients with BRD4 mutation versus BRD4 wild-type tumors. (B) The same analysis as in (A), but patients with a TERT mutation were compared with patients with TERT wild-type tumors. HR, hazard ratio; CI, confidence interval.
Table S5. Association of oncogenic driver alterations with survival of patients treated with immune checkpoint inhibitor.
| Gene | Overall survival | Progression-free survival | |||
|---|---|---|---|---|---|
| HR (95% CI) | P value | HR (95% CI) | P value | ||
| Single gene mutant vs. wild-type | |||||
| TERT | 3.92 (1.06 to 14.55) | 0.031 | 1.46 (0.60 to 3.52) | 0.400 | |
| TP53 | 2.15 (0.62 to 7.51) | 0.230 | 0.92 (0.37 to 2.29) | 0.860 | |
| CTNNB1 | 1.89 (0.55 to 6.50) | 0.300 | 6.51 (2.23 to 19.01) | <0.001 | |
| ARID1A | 1.38 (0.17 to 11.09) | 0.780 | 2.18 (0.49 to 9.71) | 0.330 | |
| AXIN1 | 2.31 (0.46 to 11.55) | 0.300 | 2.95 (0.80 to 10.86) | 0.091 | |
| JAK1 | 0.71 (0.09 to 5.63) | 0.730 | 0.88 (0.26 to 3.01) | 0.830 | |
| TSC2 | 2.56 (0.54 to 12.10) | 0.230 | 0.93 (0.21 to 4.11) | 0.910 | |
| BAP1 | – | – | 0.69 (0.16 to 3.00) | 0.620 | |
| BRD4 | 5.63 (1.08 to 29.04) | 0.019 | 2.91 (0.61 to 13.76) | 0.150 | |
| EP300 | 3.94 (0.81 to 19.04) | 0.063 | 3.12 (0.66 to 14.80) | 0.130 | |
| MLL | – | – | 10.02 (1.78 to 56.57) | 0.002 | |
| NF1 | – | – | 0.45 (0.06 to 3.47) | 0.430 | |
| NOTCH1 | – | – | 0.62 (0.08 to 4.74) | 0.650 | |
| NTRK2 | 0.51 (0.06 to 4.37) | 0.540 | 3.09 (0.67 to 14.17) | 0.120 | |
| PAK7 | – | – | 1.33 (0.30 to 5.86) | 0.700 | |
| RB1 | – | – | 0.57 (0.08 to 4.28) | 0.580 | |
| SF3B1 | 1.06 (0.13 to 8.39) | 0.950 | 1.36 (0.31 to 5.94) | 0.670 | |
| TGFBR1 | 0.51 (0.06 to 4.37) | 0.540 | 3.09 (0.67 to 14.17) | 0.120 | |
| ZFHX3 | 7.25 (0.65 to 81.21) | 0.060 | 3.48 (0.73 to 16.47) | 0.100 | |
| Co-occurring gene mutations vs. single gene mutant or wild-type | |||||
| TP53-TERT | 7.44 (1.76 to 31.52) | 0.002 | 2.85 (1.04 to 7.82) | 0.034 | |
| TP53-CTNNB1 | 2.62 (0.32 to 21.42) | 0.340 | 2.72 (0.34 to 21.75) | 0.320 | |
| TP53-BRD4 | 11.93 (1.08 to 131.90) | 0.010 | 2.35 (0.30 to 18.58) | 0.400 | |
| Clinical risk factors | |||||
| HCV (yes vs. no) | 4.45 (1.03 to 19.29) | 0.032 | 1.90 (0.61 to 5.87) | 0.25 | |
| HBV (yes vs. no) | 0.27 (0.03 to 2.13) | 0.18 | 0.57 (0.20 to 1.59) | 0.28 | |
| Stage of HCC at systemic (C vs. B) | 0.66 (0.19 to 2.30) | 0.50 | 0.36 (0.14 to 0.93) | 0.028 | |
HR, hazard ratio; CI, confidence interval; vs., versus; HCV, hepatitis C virus; HBV, hepatitis B virus.
Figure 3.
Progression-free survival analysis (A) and overall survival analysis (B) stratified by TP53 and TERT co-mutation status. HR, hazard ratio; CI, confidence interval.
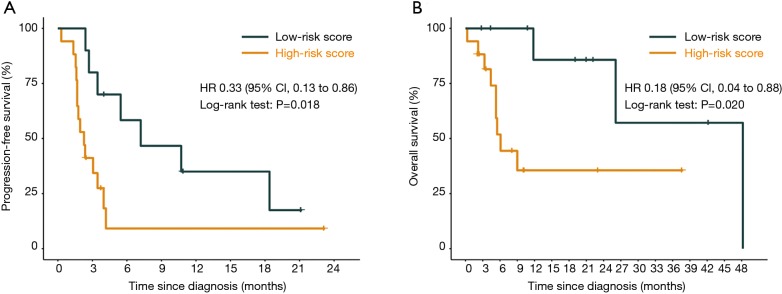
Having shown that the mutation status of TP53, TERT, CTNNB1, BRD4, and MLL might have essential clinical implications for immunotherapy, we further utilized these genes to construct a mutation risk score, which was weighted using a multivariate Cox regression analysis and calculated as follows: risk score = TP53 × 0.0233 + TERT × 0.3014 + CTNNB1 × 2.0907 + BRD4 × 1.9596 + MLL × 1.0637. Based on the optimal cutoff value (0.3), patients with low risk scores compared with patients with high risk scores exhibited significantly longer PFS (HR =0.33; 95% CI: 0.13 to 0.86; P=0.018) and OS (HR =0.18; 95% CI: 0.04 to 0.88; P=0.020) (Figure 4). The ROC analyses confirmed the effectiveness of the risk score in superior to TMB in predicting 1-, 2-, and 3-year OS (AUC =0.783, 0.783, and 0.586, respectively) and PFS (AUC =0.743, 0.625, and 0.625, respectively) (Table S4).
Figure 4.
Progression-free survival analysis (A) and overall survival analysis (B) stratified by mutation risk score. HR, hazard ratio; CI, confidence interval.
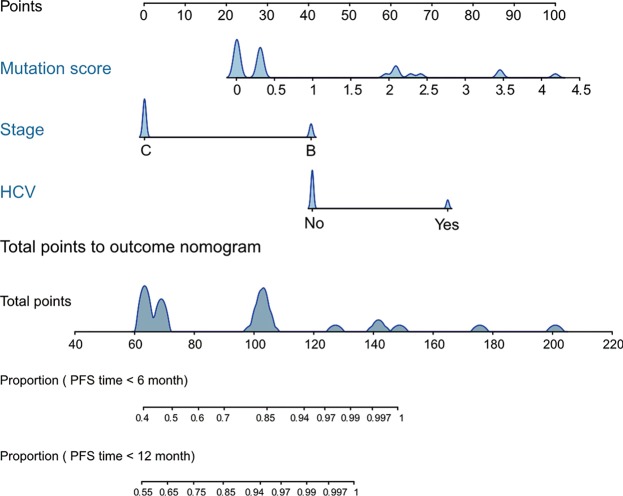
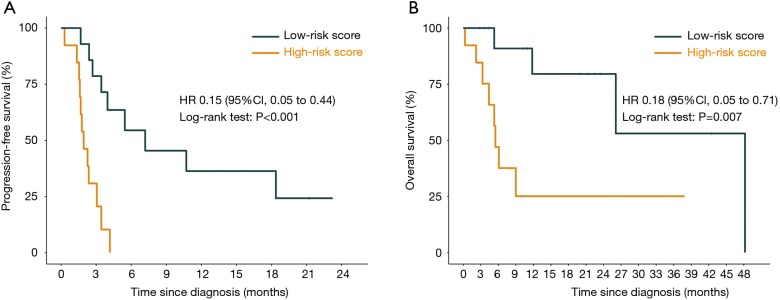
Furthermore, we constructed a nomogram comprising the mutation risk score and other clinical risk factors to predict individuals’ survival (Figure 5). Factors that significantly associated with survival included hepatitis C virus infection (HR =4.45; 95% CI: 1.03 to 19.29; P=0.032 for OS) and the stage of HCC at systemic (HR =0.36; 95% CI: 0.14 to 0.93; P=0.028 for PFS) (Table S5), which were considered as predictors of the nomogram. Using 0.24 as the cutoff, a significant difference was identified between patients classified as high risk and low risk regarding PFS (HR =0.15; 95% CI: 0.05 to 0.44; P<0.001) and OS (HR =0.18; 95% CI: 0.05 to 0.71; P=0.007) (Figure S9). The calibration plot for 2-year OS was predicted well (C-index 0.777; Figure S10). The 1-, 2-, and 3-year OS (AUC =0.840, 0.840, and 0.614) and PFS (AUC =0.879, 0.780, and 0.780) were more accurately predicted by the nomogram than the mutation risk score alone (Table S4).
Figure 5.
Nomogram to predict the survival of patients with hepatocellular carcinoma undergoing immunotherapy. HCV, hepatitis C virus; PFS, progression-free survival.
Figure S9.
Survival analysis based on risk stratification using the nomogram. (A) Progression-free survival; (B) overall survival. HR, hazard ratio; CI, confidence interval.
Figure S10.
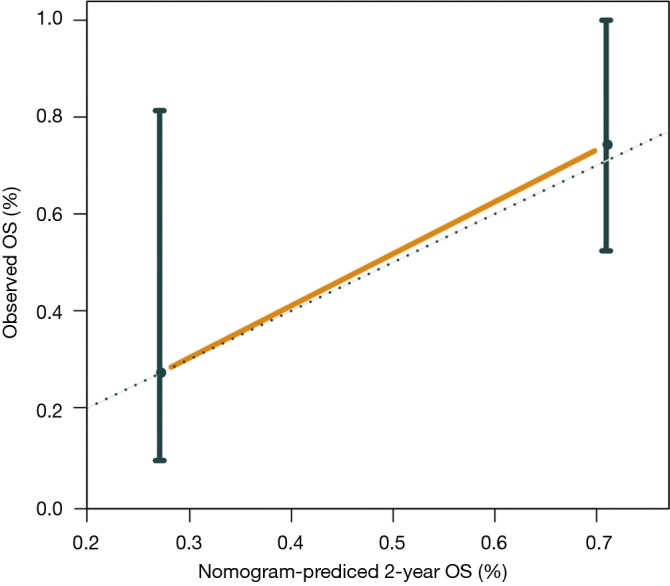
Calibration curve for the nomogram to predict overall survival of immunotherapy-treated patients. OS, overall survival.
Association of PFS with OS in patients receiving immunotherapy
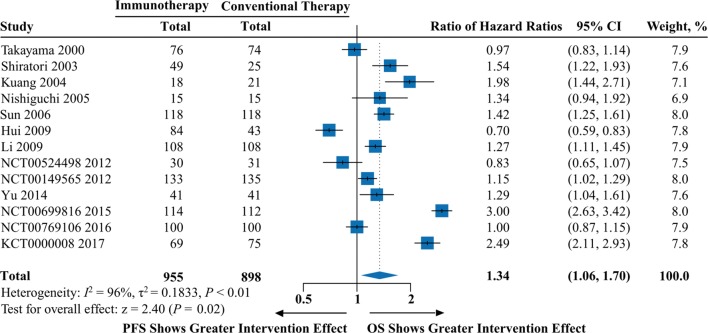
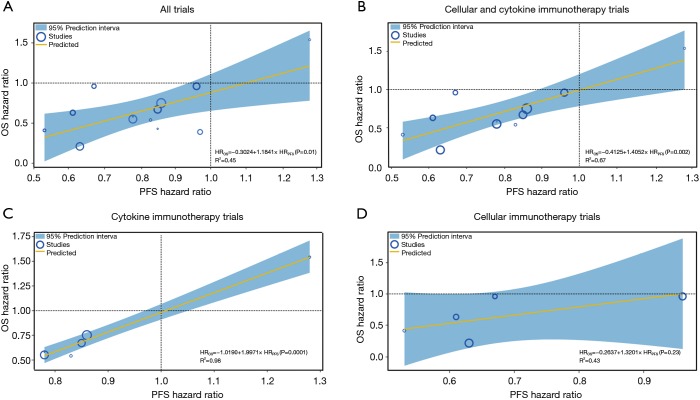
We examined the differences in treatment effect sizes and the correlation between OS and PFS. Treatment effect sizes were 34% lower, on average, for PFS than for OS (rHR =1.34; 95% CI: 1.06 to 1.70; P=0.02; Figure S11), and a modest correlation was observed (R2=0.45; Figure S12A). We then performed a sensitivity analysis after excluding trials using tumour vaccine and observed an improvement in correlation degree (R2=0.67; Figure S12B). When stratified by immunotherapy type, cytokine immunotherapy showed significant difference (rHR =1.24; 95% CI: 1.08 to 1.43; P=0.003; Table S6) and a strong correlation (R2=0.98; Figure S12C) between OS and PFS. However, no significant difference or correlation was observed for cellular immunotherapy (Table S6 and Figure S12D). The rHR for the tumor vaccine was 2.37 (95% CI: 2.05 to 2.74; P<0.0001) (Table S6). In the individual patient-level analysis, a moderate correlation between OS and PFS was identified for the immune checkpoint inhibitor (ρ=0.62; Figure S13). More results are presented in Table S6 and Figure S12.
Figure S11.
Pooled analysis of the ratio of hazard ratios between overall survival and progression-free survival. CI, confidence interval.
Table S6. Subgroup analyses for the ratio of hazard ratios between overall survival and progression-free survival.
| Subgroup | No. of trials | rHRs | 95% CI | I2 | Pa | Pb |
|---|---|---|---|---|---|---|
| Overall | 13 | 1.34 | 1.06 to 1.70 | 96% | 0.02 | |
| Type of immunotherapy | 13 | <0.0001 | ||||
| Cellular immunotherapy | 5 | 1.21 | 0.71 to 2.09 | 98% | 0.48 | |
| Cytokine immunotherapy | 6 | 1.24 | 1.08 to 1.43 | 74% | 0.003 | 0.001 |
| Stage I-IIIA | 5 | 1.31 | 1.18 to 1.46 | 51% | <0.0001 | |
| Stage IIIB | 1 | 0.83 | 0.65 to 1.07 | NA | 0.15 | |
| Tumor vaccine | 2 | 2.37 | 2.05 to 2.74 | 38% | <0.0001 |
a, P value for the test of the overall effect; b, P value for differences between subgroups. HR, hazard ratio; NA, not applicable; and CI, confidence interval.
Figure S13.
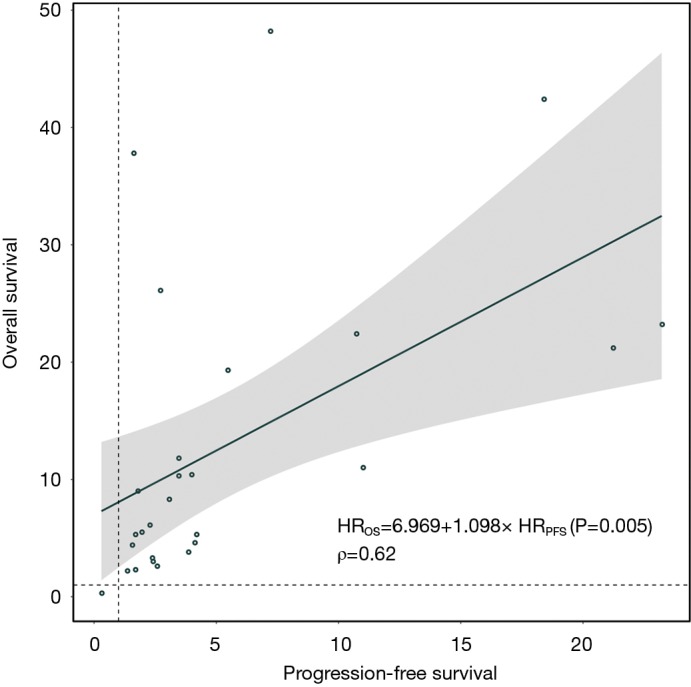
Weighted linear correlation between overall survival and progression-free survival in the MSK cohort. HR, hazard ratio; OS, overall survival; PFS, progression-free survival.
Figure S12.
Weighted linear correlation between overall survival and progression-free survival in meta-analysis. The correlation was described in all trials (A), cellular and cytokine immunotherapy trials (B), cytokine immunotherapy trials (C), and cellular immunotherapy trials (D). HR, hazard ratio; OS, overall survival; PFS, progression-free survival.
Discussion
Based on a meta-analysis of 17 trials with 2,055 patients and an individual patient-level analysis of 31 patients, we comprehensively evaluated the association of survival and genomic mutation signature with immunotherapy in HCC patients. The meta-analysis coupled with TSA provided firm and sufficient evidence for the increased efficacy of immunotherapy compared with conventional therapy in terms of OS and PFS, and these benefits were specifically evident for cellular immunotherapy, cytokine immunotherapy, and tumor vaccines. Moreover, we generated a reliable predictive mutation risk signature for immunotherapy in HCC that is based on the mutation status of a group of essential oncogenic drivers (TP53, TERT, CTNNB1, BRD4, and MLL), and further strengthened it by developing a clinically applicable nomogram.
The strategy combining cytokines, tumor vaccine or cellular immunotherapy with locoregional therapy, including tumor ablation, transcatheter arterial chemoembolization (TACE) and their combination, increased the survival of patients with HCC in our study; however, little is known about the benefit of this strategy when it is applied to immune checkpoint inhibitors or how the TACE type and cycle, and the combination pattern should be deployed to provide the favourable efficacy and safety profile. The feasibility of TACE combined with nivolumab in patients with intermediate stage HCC is being evaluated in two ongoing trials; the phase II IMMUTACE study (NCT03572582) (2) used a single-arm setting with a recruitment of 49 patients, and another early phase I study (NCT03143270) (3) aims to compare the safety of this combination in sequential, intermitted, and maintenance approaches. The evidence for the clinical usefulness of tumor ablation or TACE combined with immunotherapy for the treatment of HCC remains very preliminary and requires further study.
According to recent randomized phase III KEYNOTE-240 trial (36), pembrolizumab tended to increase the survival of patients with advanced HCC with or without extrahepatic spread, but the difference did not reach significance based on a prespecified threshold. It is also possible that pembrolizumab might provide a marked benefit with a longer follow-up. Moreover, immunosuppression is driven by multiple immuno-oncological factors with distinct mechanisms in the tumor microenvironment; thus, immunotherapy plus chemotherapy or targeted therapy, and currently investigated dual immunotherapies that target multiple components of the immune system might increase the anti-tumor efficacy (1,37). In the phase III CheckMate-227 study of NSCLC (38), nivolumab plus ipilimumab significantly increased PFS compared with chemotherapy, and this combination even outperformed nivolumab monotherapy in terms of median PFS. When nivolumab plus ipilimumab were used as a perioperative treatment for patients with resectable HCC in a phase II trial (4), an encouraging pathologic complete response rate of 29% was recorded and the adverse events were well managed, supporting the usefulness of dual immunotherapy in treating HCC. As to metastatic HCC, sorafenib remains to be the standard preferred therapy. Ongoing trials (NCT02576509, NCT02562755) (39,40) are investigating immunotherapy or immunotherapy combined with sorafenib versus sorafenib alone and these results were eagerly expected to refine the first-line treatment option for HCC.
Since checkpoint blockade alone tends to show inadequate antiviral activity (11), the concurrent administration of an antiviral agent might provide additional benefits for HCC patients presenting with a hepatitis virus infection. Therefore, we postulated that hepatitis B virus (HBV)-infected patients may be potential candidates for additional entecavir therapy, while hepatitis C virus (HCV)-infected patients may derive benefit from additional cytokine immunotherapy that exerts both immunostimulatory and antiviral effects, such as interferon-α therapy.
We considered the possibility that the use of immunotherapy as a maintenance strategy may increase the therapeutic effects. A phase II study of 174 NSCLC patients revealed that patients managed with ≥14 cytokine-induced killer (CIK) cell infusions exhibited significantly longer median PFS and median OS than patients managed with <14 infusions (41). Our study of HCC collaborated with this finding, showed that CIK immunotherapy with a high infusion-long-term-low dose strategy resulted in evidently prolonged OS, but not for a low infusion-short-term-high dose strategy. Thus, the lack of immunotherapy efficacy conferred by a low infusion and short-term treatment might not be offset by the administration of a high dose of CIK cells. Promising results for the maintenance strategy have also been reported in trials using an immune checkpoint inhibitor and tumor vaccine (1,42).
In a recent phase III randomized PACIFIC trial (42) of 476 stage III patients with NSCLC, the use of durvalumab as a maintenance therapy was associated with significantly longer survival, with no difference in immune-related side effects compared to the placebo. Additionally, as shown in our previous meta-analysis (1), OS and PFS are significantly prolonged in patients with advanced NSCLC treated with tumor vaccines as a maintenance therapy. Overall, we suggest that future HCC immunotherapy trials of maintenance strategies should carefully consider the appropriate infusion, duration, dosage and cycle to improve the treatment effect while minimizing the incidence of side effects.
In the present study, a lower TMB and a lower mutation risk score resulted in better clinical outcomes among patients with HCC, in contrast to majority of tumor types such as NSCLC, in which a higher mutation burden was associated with longer survival and increased response (1). These findings implicated that genomic mutation might play a distinct role in the HCC microenvironment. We unravelled several oncogenes whose mutation status significantly linked to immunotherapy efficacy, some of which have been found to be involved in the regulation of tumor immune microenvironment such as TP53 (43), TERT (44), and BRD4 (45). These genes might provide potential therapeutic targets to enhance the immunotherapeutic treatment effect. Concurrent targeting TERT and PD-1 or CTLA-4 has been shown to provide synergistic anti-tumor effects (44). More studies are needed to in-deep characterize how these mutated genes interact with immune system to influence immunotherapy-treated patient survival.
Moreover, the nomogram that added clinical factors to the mutation risk signature further displayed improved predictive accuracy. This effectiveness was also supported in our previous study (46), which combined TP53, DNMT3A and KEAP1 mutations with sex, race, tumor histology, Eastern Cooperative Oncology Group performance status, and PD-L1 expression to construct a clinicopathological-genomic nomogram of atezolizumab in patients with NSCLC that achieved better performance than PD-L1 expression and blood-based TMB. Additionally, our recent investigation (1) of NSCLC suggested that PD-L1 expression, the TMB, and CD8+ tumor-infiltrating lymphocytes could jointly predict immunotherapeutic benefits. Taken together, using multiomics rather than considering one aspect might more comprehensively evaluate the efficacy of immunotherapy to aid in the development of personalized immunotherapy for patients with HCC.
Earlier endpoints, including PFS and the ORR, are commonly used for efficacy evaluation instead of final clinical outcomes, such as OS, in immunotherapy trials (5,31,32), but their surrogate values remain controversial. In our study, treatment effect sizes were significantly greater for OS than for PFS, and only a low to moderate association was observed between PFS and OS, suggesting an important difference between PFS and OS. These findings collaborated with previous pan-cancer studies (47,48), which found low to moderate correlations between PFS or ORR and OS in trials investigating immune checkpoint inhibitors. Therefore, PFS and ORR are not appropriate surrogate endpoints for OS, and an interpretation of immunotherapy efficacy based solely on PFS is not appropriate. Designs that detect the early effects of cytotoxic agents using RECIST or WHO criteria might not provide a complete assessment of immunotherapeutic efficacy. We recommend that future immunotherapy trials should consider both OS and PFS when interpreting efficacy and should use immune-related criteria that might accurately capture the unique patterns of the immune response (49).
One main limitation of our study is the heterogeneity in some analyses, for instance the analysis of OS (I2=60%) and PFS (I2=60%) in the locoregional group. The heterogeneity might be attributed to diverse patient characteristics such as fibrosis stage, and might also be due to difference in the administration of immunotherapy regimens, for instance the type, cycle, and dose of locoregional therapy, but we could not quantitatively address these heterogeneities due to the lack of analytical variables. Another limitation is our inability to perform external or internal validation for the prediction model due to limited individual patient data. Studies with a larger sample size are required to confirm the clinical usefulness of our prediction model, and to consider integrating more tumor microenvironment-based variables, such as PD-L1 expression, immune cells, and methylation signatures to enhance the predictive accuracy, when designing biomarkers for immunotherapy in HCC.
Conclusions
Immunotherapy resulted in prolonged OS and PFS in patients with HCC. Moreover, we provided a novel mutation risk score for immunotherapy in HCC that achieved better predictive ability than TMB; patients with a low mutation risk score exhibited prolonged survival compared with patients with a high mutation risk score. A nomogram based on the genomic mutation signature further increased the accuracy in directing personalized immunotherapy for HCC. Additionally, treatment effect sizes were greater for OS than for PFS, suggesting that both OS and PFS should be evaluated to determine the effectiveness of immunotherapies in future clinical trials of HCC.
Acknowledgments
Funding: This study was supported by National Natural Science Foundation of China (grant numbers 81873899, 81671704, 81572596, 81972471, U1601223); Guangzhou Science and Technology Program (grant number 201803010035); National Science and Technology Major Project (2020ZX09201021); Guangdong Science and Technology Department (2017B030314026); National Students’ Innovation and Entrepreneurship training program (grant number 201910571001); Special Funds for the Cultivation of Guangdong College Students’ Scientific and Technological Innovation (grant number pdjh2019a0212); and Guangdong Medical University College Students’ Innovation Experiment Project (grant number ZZZF001).
Ethical Statement: The authors are accountable for all aspects of the work in ensuring that questions related to the accuracy or integrity of any part of the work are appropriately investigated and resolved.
Footnotes
Conflicts of Interest: The authors have no conflicts of interest to declare.
References
- 1.Yu Y, Zeng D, Ou Q, et al. Association of survival and immune-related biomarkers with immunotherapy in patients with non-small cell lung cancer: a meta-analysis and individual patient-level analysis. JAMA Netw Open 2019;2:e196879. 10.1001/jamanetworkopen.2019.6879 [DOI] [PMC free article] [PubMed] [Google Scholar]
- 2.ClinicalTrialgov. Transarterial Chemoembolization in Combination With Nivolumab Performed for Intermediate Stage Hepatocellular Carcinoma (IMMUTACE) Available online: https://clinicaltrialsgov/ct2/show/NCT03572582 (accessed on 31 June 2019).
- 3.Harding JJ, Erinjeri JP, Tan BR, et al. A multicenter pilot study of nivolumab (NIVO) with drug eluting bead transarterial chemoembolization (deb-TACE) in patients (pts) with liver limited hepatocellular carcinoma (HCC). J Clin Oncol 2018;36:TPS4146. 10.1200/JCO.2018.36.15_suppl.TPS4146 [DOI] [Google Scholar]
- 4.Kaseb A, Vence L, Blando J, et al. Randomized, open-label, perioperative phase II study evaluating nivolumab alone versus nivolumab plus ipilimumab in patients with resectable HCC. Ann Oncol 2019;30 Suppl 4:iv112. 10.1093/annonc/mdz156.008 [DOI] [Google Scholar]
- 5.Lee JH, Lee JH, Lim YS, et al. Adjuvant immunotherapy with autologous cytokine-induced killer cells for hepatocellular carcinoma. Gastroenterology 2015;148:1383-1391.e6. 10.1053/j.gastro.2015.02.055 [DOI] [PubMed] [Google Scholar]
- 6.Xu L, Wang J, Kim Y, et al. A randomized controlled trial on patients with or without adjuvant autologous cytokine-induced killer cells after curative resection for hepatocellular carcinoma. Oncoimmunology 2015;5:e1083671. 10.1080/2162402X.2015.1083671 [DOI] [PMC free article] [PubMed] [Google Scholar]
- 7.NCCN Clinical Practice Guidelines in Oncology Hepatobiliary Cancers Version 2 2019 Available online: https://wwwnccnorg/professionals/physician_gls/defaultaspx (accessed on 31 June 2019).
- 8.Marrero JA, Kulik LM, Sirlin CB, et al. Diagnosis, staging, and management of hepatocellular carcinoma: 2018 practice guidance by the American association for the study of liver diseases. Hepatology 2018;68:723-50. 10.1002/hep.29913 [DOI] [PubMed] [Google Scholar]
- 9.European Association for the Study of the Liver EASL clinical practice guidelines: management of hepatocellular carcinoma. J Hepatol 2018;69:182-236. 10.1016/j.jhep.2018.03.019 [DOI] [PubMed] [Google Scholar]
- 10.American Association for the study of liver diseases practice guideline. Hepatology 2018, 67. [Google Scholar]
- 11.El-Khoueiry AB, Sangro B, Yau T, et al. Nivolumab in patients with advanced hepatocellular carcinoma (CheckMate 040): an open-label, non-comparative, phase 1/2 dose escalation and expansion trial. Lancet 2017;389:2492-502. 10.1016/S0140-6736(17)31046-2 [DOI] [PMC free article] [PubMed] [Google Scholar]
- 12.Zhu AX, Finn RS, Edeline J, et al. Pembrolizumab in patients with advanced hepatocellular carcinoma previously treated with sorafenib (KEYNOTE-224): a non-randomized, open-label phase 2 trial. Lancet Oncol 2018;19:940-52. 10.1016/S1470-2045(18)30351-6 [DOI] [PubMed] [Google Scholar]
- 13.Liberati A, Altman DG, Tetzlaff J, et al. The PRISMA statement for reporting systematic reviews and meta-analyses of studies that evaluate healthcare interventions: explanation and elaboration. BMJ 2009;339:b2700. 10.1136/bmj.b2700 [DOI] [PMC free article] [PubMed] [Google Scholar]
- 14.Higgins JPT, Green S. Cochrane Handbook for Systematic Reviews of Interventions Wiley: Chichester, UK, 2011. [Google Scholar]
- 15.Collins GS, Reitsma JB, Altman DG, et al. Transparent reporting of a multivariable prediction model for individual prognosis or diagnosis (TRIPOD): the TRIPOD atatement. Ann Intern Med 2015;162:55-63. 10.7326/M14-0697 [DOI] [PubMed] [Google Scholar]
- 16.Harding JJ, Nandakumar S, Armenia J, et al. Prospective genotyping of hepatocellular carcinoma: clinical implications of next generation sequencing for matching patients to targeted and immune therapies. Clin Cancer Res 2018;25:clincanres22932018. [DOI] [PMC free article] [PubMed]
- 17.Parmar MKB, Torri V, Stewart L. Extracting summary statistics to perform meta-analyses of the published literature for survival endpoints. Stat Med 1998;17:2815-34. [DOI] [PubMed] [Google Scholar]
- 18.Guyatt GH, Oxman AD, Vist GE, et al. GRADE: an emerging consensus on rating quality of evidence and strength of recommendations. BMJ 2008;336:924-6. 10.1136/bmj.39489.470347.AD [DOI] [PMC free article] [PubMed] [Google Scholar]
- 19.Wetterslev J, Thorlund K, Brok J, et al. Trial sequential analysis may establish when firm evidence is reached in cumulative meta-analysis. J Clin Epidemiol 2008;61:64-75. 10.1016/j.jclinepi.2007.03.013 [DOI] [PubMed] [Google Scholar]
- 20.Yu X, Zhao H, Liu L, et al. A randomized phase II study of autologous cytokine-induced killer cells in treatment of hepatocelluar carcinoma. J Clin Immunol 2014;34:194-203. 10.1007/s10875-013-9976-0 [DOI] [PubMed] [Google Scholar]
- 21.Kuang M, Peng B, Lu M, et al. Phase II randomized trial of autologous formalin-fixed tumor vaccine for postsurgical recurrence of hepatocellular carcinoma. Clin Cancer Res 2004;10:1574-9. 10.1158/1078-0432.CCR-03-0071 [DOI] [PubMed] [Google Scholar]
- 22.Chen LT, Chen M, Li L, et al. Long-term results of a randomized, observation-controlled, phase III trial of adjuvant interferon Alfa-2b in hepatocellular carcinoma after curative resection. Ann Surg 2012;255:8-17. 10.1097/SLA.0b013e3182363ff9 [DOI] [PubMed] [Google Scholar]
- 23.Miyaguchi S, Watanabe T, Takahashi H, et al. Interferon therapy for hepatocellular carcinoma patients with low HCV-RNA levels. Hepatogastroenterology 2002;49:724-9. [PubMed] [Google Scholar]
- 24.Takayama T, Sekine T, Makuuchi M, et al. Adoptive immunotherapy to lower postsurgical recurrence rates of hepatocellular carcinoma: a randomised trial. Lancet 2000;356:802-7. 10.1016/S0140-6736(00)02654-4 [DOI] [PubMed] [Google Scholar]
- 25.Sun HC, Tang Z, Wang L, et al. Postoperative interferon α treatment postponed recurrence and improved overall survival in patients after curative resection of HBV-related hepatocellular carcinoma: a randomized clinical trial. J Cancer Res Clin Oncol 2006;132:458-65. 10.1007/s00432-006-0091-y [DOI] [PMC free article] [PubMed] [Google Scholar]
- 26.Shiratori Y, Shiina S, Teratani T, et al. Interferon therapy after tumor ablation improves prognosis in patients with hepatocellular carcinoma associated with hepatitis C virus. Ann Intern Med 2003;138:299-306. 10.7326/0003-4819-138-4-200302180-00008 [DOI] [PubMed] [Google Scholar]
- 27.Nishiguchi S, Tamori A, Kubo S. Effect of long-term postoperative interferon therapy on intrahepatic recurrence and survival rate after resection of hepatitis C virus-related hepatocellular carcinoma. Intervirology 2005;48:71-5. 10.1159/000082098 [DOI] [PubMed] [Google Scholar]
- 28.Monden M, Sakon M, Sakata Y, et al. 5-fluorouracil arterial infusion+interferon therapy for highly advanced hepatocellular carcinoma: a multicenter, randomized, phase II study. Hepatol Res 2012;42:150-65. 10.1111/j.1872-034X.2011.00905.x [DOI] [PubMed] [Google Scholar]
- 29.Lo CM, Liu CL, Chan SC, et al. A randomized, controlled trial of postoperative adjuvant interferon therapy after resection of hepatocellular carcinoma. Ann Surg 2007;245:831-42. 10.1097/01.sla.0000245829.00977.45 [DOI] [PMC free article] [PubMed] [Google Scholar]
- 30.Lin SM, Lin CJ, Hsu CW, et al. Prospective randomized controlled study of interferon-alpha in preventing hepatocellular carcinoma recurrence after medical ablation therapy for primary tumors. Cancer 2004;100:376-82. 10.1002/cncr.20004 [DOI] [PubMed] [Google Scholar]
- 31.Li M, Lu C, Cheng J, et al. Combination therapy with transarterial chemoembolization and interferon-α compared with transarterial chemoembolization alone for hepatitis B virus related unresectable hepatocellular carcinoma. J Gastroenterol Hepatol 2009;24:1437-44. 10.1111/j.1440-1746.2009.05863.x [DOI] [PubMed] [Google Scholar]
- 32.Lee JH, Tak WY, Lee Y, et al. Adjuvant immunotherapy with autologous dendritic cells for hepatocellular carcinoma, randomized phase II study. Oncoimmunology 2017;6:e1328335. 10.1080/2162402X.2017.1328335 [DOI] [PMC free article] [PubMed] [Google Scholar]
- 33.Weng DS, Zhou J, Zhou Q, et al. Minimally invasive treatment combined with cytokine-induced killer cells therapy lower the short-term recurrence rates of hepatocellular carcinomas. J Immunother 2008;31:63-71. 10.1097/CJI.0b013e31815a121b [DOI] [PubMed] [Google Scholar]
- 34.Hui D, Qiang L, Jian W, et al. A randomized, controlled trial of postoperative adjuvant cytokine-induced killer cells immunotherapy after radical resection of hepatocellular carcinoma. Dig Liver Dis 2009;41:36-41. 10.1016/j.dld.2008.04.007 [DOI] [PubMed] [Google Scholar]
- 35.Ou Q, Yu Y, Li A, et al. The efficacy of adjuvant interferon, tumor vaccines and cellular immunotherapies in hepatocellular carcinoma. J Clin Oncol 2018;36:e16125. 10.1200/JCO.2018.36.15_suppl.e16125 [DOI] [Google Scholar]
- 36.Finn RS, Ryoo BY, Merle P, et al. Results of KEYNOTE-240: phase 3 study of pembrolizumab (Pembro) vs. best supportive care (BSC) for second line therapy in advanced hepatocellular carcinoma (HCC). J Clin Oncol 2019;37:4004. 10.1200/JCO.2019.37.15_suppl.4004 [DOI] [Google Scholar]
- 37.Galluzzi L, Zitvogel L, Kroemer G. Immunological mechanisms underneath the efficacy of cancer therapy. Cancer Immunol Res 2016;4:895-902. 10.1158/2326-6066.CIR-16-0197 [DOI] [PubMed] [Google Scholar]
- 38.Hellmann MD, Ciuleanu TE, Pluzanski A, et al. Nivolumab plus ipilimumab in lung cancer with a high tumor mutational burden. N Engl J Med 2018;378:2093-104. 10.1056/NEJMoa1801946 [DOI] [PMC free article] [PubMed] [Google Scholar]
- 39.ClinicalTrialgov. An Investigational Immuno-therapy Study of Nivolumab Compared to Sorafenib as a First Treatment in Patients With Advanced Hepatocellular Carcinoma. Available online: https://clinicaltrials.gov/ct2/show/NCT02576509 (accessed on 11 December 2019).
- 40.ClinicalTrialgov. Hepatocellular Carcinoma Study Comparing Vaccinia Virus Based Immunotherapy Plus Sorafenib vs. Sorafenib Alone (PHOCUS). Available online: https://clinicaltrials.gov/ct2/show/ NCT02562755 (accessed on 11 December 2019).
- 41.Li R, Wang C, Liu L, et al. Autologous cytokine-induced killer cell immunotherapy in lung cancer: a phase II clinical study. Cancer Immunol Immunother 2012;61:2125-33. 10.1007/s00262-012-1260-2 [DOI] [PMC free article] [PubMed] [Google Scholar]
- 42.Antonia SJ, Villegas A, Daniel D, et al. Overall survival with durvalumab after chemoradiotherapy in stage III NSCLC. N Engl J Med 2018;379:2342-50. 10.1056/NEJMoa1809697 [DOI] [PubMed] [Google Scholar]
- 43.Dong ZY, Zhong W, Zhang X, et al. Potential predictive value of TP53 and KRAS mutation status for response to PD-1 blockade immunotherapy in lung adenocarcinoma. Clin Cancer Res 2017;23:3012-24. 10.1158/1078-0432.CCR-16-2554 [DOI] [PubMed] [Google Scholar]
- 44.Duperret EK, Wise MC, Trautz A, et al. Synergy of Immune Checkpoint Blockade with a Novel Synthetic Consensus DNA Vaccine Targeting TERT. Mol Ther 2018;26:435-45. 10.1016/j.ymthe.2017.11.010 [DOI] [PMC free article] [PubMed] [Google Scholar]
- 45.Bao Y, Wu X, Chen J, et al. Brd4 modulates the innate immune response through Mnk2-eIF4E pathway-dependent translational control of IκBα. Proc Natl Acad Sci U S A 2017;114:E3993-4001. 10.1073/pnas.1700109114 [DOI] [PMC free article] [PubMed] [Google Scholar]
- 46.Yu Y, Chen Y, Li A, et al. Efficacy and a novel clinicopathologic-genomic nomogram of atezolizumab in advanced non-small cell lung cancer (POPLAR and OAK): a combined analysis of two multicenter, randomized, phase II/III trials. J Clin Oncol 2019;37:2573. 10.1200/JCO.2019.37.15_suppl.2573 [DOI] [Google Scholar]
- 47.Tan A, Porcher R, Crequit P, et al. Differences in treatment effect size between overall survival and progression-free survival in immunotherapy trials: a meta-epidemiologic study of trials with results posted at clinicaltrialsgov. J Clin Oncol 2017;35:1686-94. 10.1200/JCO.2016.71.2109 [DOI] [PubMed] [Google Scholar]
- 48.Ritchie G, Gasper H, Man J, et al. Defining the most appropriate primary end point in phase 2 trials of immune checkpoint inhibitors for advanced solid cancers: a systematic review and meta-analysis. JAMA Oncol 2018;4:522-8. 10.1001/jamaoncol.2017.5236 [DOI] [PMC free article] [PubMed] [Google Scholar]
- 49.Lynch TJ, Bondarenko I, Luft A, et al. Ipilimumab in combination with paclitaxel and carboplatin as first-line treatment in stage IIIB/IV non-small-cell lung cancer: results from a randomized, double-blind, multicenter phase II study. J Clin Oncol 2012;30:2046-54. 10.1200/JCO.2011.38.4032 [DOI] [PubMed] [Google Scholar]


