

Aβ pathology may induce changes in soluble tau release and phosphorylation, which is later followed by tau aggregation.
Abstract
The links between β-amyloid (Aβ) and tau in Alzheimer’s disease are unclear. Cognitively unimpaired persons with signs of Aβ pathology had increased cerebrospinal fluid (CSF) phosphorylated tau (P-tau181 and P-tau217) and total-tau (T-tau), which increased over time, despite no detection of insoluble tau aggregates [normal Tau positron emission tomography (PET)]. CSF P-tau and T-tau started to increase before the threshold for Amyloid PET positivity, while Tau PET started to increase after Amyloid PET positivity. Effects of Amyloid PET on Tau PET were mediated by CSF P-tau, and high CSF P-tau predicted increased Tau PET rates. Individuals with MAPT mutations and signs of tau deposition (but without Aβ pathology) had normal CSF P-tau levels. In 5xFAD mice, CSF tau increased when Aβ aggregation started. These results show that Aβ pathology may induce changes in soluble tau release and phosphorylation, which is followed by tau aggregation several years later in humans.
INTRODUCTION
Alzheimer’s disease (AD) is characterized by the presence of β-amyloid (Aβ) plaques and tau tangles. Accumulation of Aβ fibrils is thought to be an initiating factor in AD and necessary for the formation of tau aggregates (1). Tau is a microtubule-stabilizing axonal protein that can be phosphorylated, which reduces its binding affinity for tubulin multimers. This may be important during physiological synaptic and axonal pruning and plasticity processes (2). In AD, tau becomes truncated and hyperphosphorylated (3), which can increase the risk for tau to aggregate into the paired helical filaments (PHF) that are found in neurofibrillary tangles (NFT) and neuropil treads in the brains of patients with AD (1). Cell and animal experiments have verified that Aβ may induce pathologically relevant alterations in neuronal tau, including increased phosphorylation and release of tau (4, 5). For example, transgenic animal experiments have shown that Aβ aggregates are associated with increased levels of soluble tau and increased tau phosphorylation (5, 6). These changes in tau metabolism may occur before substantial formation of PHF, but only limited data exist from humans on the temporal relationships between development of Aβ plaques and altered release, phosphorylation, and aggregation of tau. A more detailed understanding of the pathways leading from Aβ pathology to tau pathology will increase the possibility of developing effective treatments and will also improve staging of early phases of AD, both of which will facilitate clinical trials directed against AD before dementia. These types of studies need to be performed in humans along the AD continuum, using technologies to track the pathophysiological mechanisms related to Aβ, tau, and neurodegeneration in AD.
Tau can be studied in vivo in humans, both with measurements of soluble tau in cerebrospinal fluid (CSF), including total tau (T-tau) and phosphorylated tau (P-tau), and tau positron emission tomography (PET) using, e.g., the tracer 18F-flortaucipir (7). Several different CSF P-tau isoforms exists, including P-tau181 and P-tau217, which may be altered very early as markers of disturbed tau metabolism (8, 9). Neuropathological studies have shown that Tau PET correlates strongly to NFT and neuropil threads in the brain (10), but correlations between in vivo CSF tau biomarkers and tau aggregates in postmortem tissue are weaker (11). Studies comparing CSF tau biomarkers with Tau PET have found that they are only moderately correlated, with the strongest correlations in symptomatic stages of AD, and no or weak correlations in cognitively unimpaired (CU) individuals (12–16). Cognitive measures (15, 16) and atrophy (15) are more strongly related to Tau PET than to CSF tau biomarkers. These previous studies suggest that CSF tau biomarkers and Tau PET reflect different aspects of tau pathology and may become abnormal at different stages of the disease. We therefore tested the hypothesis that phosphorylation of tau (CSF P-tau181 and P-tau217) and release of tau [CSF T-tau, which can be increased independently of tau phosphorylation; (17)] are increased in early stages of AD, in response to Aβ pathology (Amyloid PET), before significant accumulation of aggregates of insoluble PHF-tau (as seen with Tau PET). We also tested the hypothesis that changes in soluble tau mediated the relationship between Aβ fibrils and development of tau aggregates. We studied a carefully phenotyped cohort, ranging from Aβ− CU individuals to Aβ+ CU (preclinical AD) and Aβ+ patients with mild cognitive deficits or AD dementia. We used both cross-sectional and longitudinal biomarker data. We compared findings in humans with findings from Aβ pathology and CSF tau in a transgenic AD mouse model.
Changes in soluble tau, especially increased CSF P-tau217, were detected very early in response to Aβ pathology, but aggregation of PHF (as measured by Tau PET) occurred several years later. The increased CSF P-tau levels (and P-tau/T-tau ratios) were strong statistical mediators of the relationship between Aβ and tau aggregation. In a transgenic mouse model, the development of Aβ pathology was linked to increased levels of CSF tau, despite that this model does not develop tau aggregates. Together, these findings from humans with sporadic AD and transgenic AD mice demonstrate that Aβ pathology is associated with significant changes in metabolism of soluble tau, which is followed by tau aggregation several years later in humans. This extends the amyloid cascade hypothesis of AD and indicates that there may be a window of opportunity for treatment against tau in people with Aβ pathology before significant tau aggregation has started. It also extends biomarker-based classification of AD (18), since some individuals may be classified as “Aβ positive, CSF P-tau positive, and Tau PET negative.”
RESULTS
CSF tau proteins and Tau PET retention are elevated in different stages of AD
First, we set out to investigate whether release of tau (CSF T-tau) and phosphorylation of tau (CSF P-tau181 and P-tau217) are changed at earlier disease stages of AD than accumulation of PHF-tau (Tau PET). The cohort consisted of 131 participants, including 18 Aβ− CU, 40 Aβ+ CU, 38 Aβ+ nondemented individuals with mild cognitive deficits [Clinical Dementia Rating (CDR), 0.5; (19)], and 35 Aβ+ demented patients with AD (CDR, 1 to 3). Demographics are summarized in Table 1 (see also Supplementary Text). Figure 1 (A to E) shows CSF P-tau181, P-tau217, T-tau, and regional Tau PET data by Aβ status and level of cognitive impairment. Aβ+ CU had higher CSF P-tau181, P-tau217, and T-tau than Aβ− CU (P ≤ 0.0001), but did not differ on any of the Tau PET measures. Aβ+ individuals with mild cognitive deficits had higher levels of all CSF and PET tau measures, compared with both Aβ− CU (CSF, P < 0.0001; PET, P ≤ 0.0032) and Aβ+ CU (P < 0.0001). Aβ+ AD dementia had higher levels of all tau measures compared with all other groups (CSF, P ≤ 0.035; Tau PET, P ≤ 0.0013), except that there was no difference for CSF T-tau between Aβ+ with milder cognitive deficits or dementia.
Table 1. Demographics.
Continuous data are mean (SD). The lower part shows percentage with positive tau markers, using a priori cut points, with 95% CIs from a bootstrap procedure. Frequency of positivity was compared by Fisher’s exact tests. Statistical comparisons for biomarkers across groups are shown in Fig. 1. CDR, Clinical Dementia Rating scale; M, male; F, female.
| Aβ− CU | Aβ+ CU |
Aβ+ mild cognitive deficits |
Aβ+ AD dementia |
|
| N | 18 | 40 | 38 | 35 |
| Age, years | 73.9 (4.7) | 75.0 (7.4) | 71.8 (7.2) | 72.0 (7.0) |
| Sex, M:F | 11:7 | 16:24 | 24:14 | 20:15 |
| APOE ε4, −/+ (%+) | 15/3 (17%) | 19/21 (53%) | 7/31 (82%) | 12/20 (63%) |
| Education, years | 12.8 (3.8) | 11.9 (4.0) | 12.2 (3.5) | 12.2 (3.7) |
| MMSE, points of | 29.1 (1.1) | 29.1 (1.1) | 25.6 (3.1) | 20.5 (5.3) |
| CDR | 0 | 0 | 0.5 | 1–3 |
| CSF P-tau217, ng/liter | 70.9 (32.6) | 223.3 (135.3) | 634.1 (404.3) | 883.7 (530.8) |
| CSF P-tau181, ng/liter | 82.6 (26.7) | 177.3 (80.3) | 341.9 (152.1) | 429.5 (208.6) |
| CSF T-tau, ng/liter | 267.5 (62.1) | 403.6 (114.7) | 550.4 (156.7) | 587.7 (208.5) |
| Tau PET ITC, SUVR | 1.19 (0.07) | 1.20 (0.07) | 1.79 (0.60) | 2.21 (0.49) |
| Tau PET Braak V–VI, SUVR | 1.03 (0.05) | 1.02 (0.05) | 1.27 (0.31) | 1.48 (0.34) |
| Tau biomarker positivity, % (95% CI) | ||||
| CSF P-tau217 (>119.5 ng/liter) | 5.6 (0–18.8)*†‡ | 70.0 (56.1–84.1)†‡ | 100 (100–100) | 97.1 (90–100) |
| CSF P-tau181 (>152.6 ng/liter) | 5.6 (0–18.8)*†‡ | 55.0 (39.5–70.3)†‡ | 89.5 (78.4–97.7) | 97.1 (90–100) |
| CSF T-tau (>464.7 ng/liter) | 0 (0–0)*†‡ | 22.5 (10.5–35.3)†‡ | 71.1 (55.6–85.1) | 74.3 (60–88.9) |
| Tau PET ITC (>1.31 SUVR) | 0 (0–0)†‡ | 2.5 (0–8.3)†‡ | 76.3 (60.9–89.7)‡ | 100 (100–100) |
| Tau PET Braak V–VI (>1.28 SUVR) | 0 (0–0)†‡ | 0 (0–0)†‡ | 31.6 (17.2–45.9)‡ | 65.7 (48.8–80) |
*P < 0.05 versus Aβ+ CU.
†P < 0.05 versus Aβ+ with mild cognitive deficits.
‡P < 0.05 versus Aβ+ AD dementia.
Fig. 1. CSF P-tau and Tau PET biomarkers by Aβ and level of cognitive impairment.
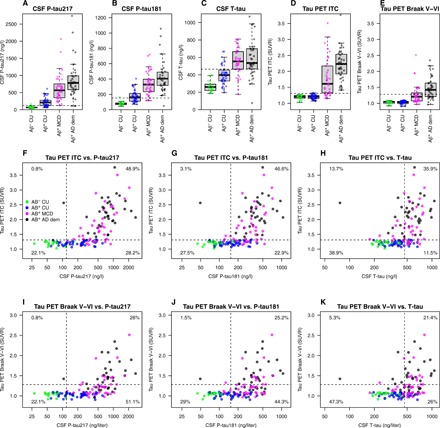
(A to E) Tau biomarkers are shown by groups (Aβ− CU, Aβ+ CU, Aβ + MCD, and Aβ+ AD dementia). Tau PET uptake was sampled in inferior temporal cortex (ITC) and from regions involved in Braak stage V–VI. Aβ+ CU had higher CSF P-tau181, P-tau217, and T-tau than Aβ− CU (P ≤ 0.0001) but did not differ on the Tau PET measures (P = 0.57 to 0.71). Aβ+ individuals with MCD had higher levels of all CSF and PET tau measures, compared with both Aβ− CU (CSF, P < 0.0001; PET, P ≤ 0.0032) and Aβ+ CU (CSF, P < 0.0001; PET, P < 0.0001). Aβ+ AD dementia had higher levels of all tau measures compared with all other groups (CSF, P ≤ 0.035; Tau PET, P ≤ 0.0013), except that there was no difference for CSF T-tau between Aβ+ with MCD or dementia (P = 0.37). The dashed lines indicate a priori cut points for tau biomarker positivity, defined in independent populations of CU (at mean plus two SDs) (36). (F to K) Concordance between CSF and PET tau measures. The percentages indicate proportions in each quadrant. Tau PET scans were done a median of 0.69 year (IQR, 0.23 to 1.05) after lumbar puncture. CDR, Clinical Dementia Rating (where 0.5 equals MCD without dementia, and ≥1 increasing stages of dementia); CU, cognitively unimpaired (CDR, 0); MCD, mild cognitive deficits (CDR, 0.5); dem, dementia (CDR, 1 to 3).
Biomarker positivity was calculated using a priori defined cut points (Table 1). All Aβ− CU were negative on all tau biomarkers, except one individual who was positive for CSF P-tau181 and P-tau217. A large group of Aβ+ CU were positive for CSF tau biomarkers (ranging from 22% for CSF T-tau to 70% for CSF P-tau217; Table 1), but only one Aβ+ CU was positive for Tau PET [in inferior temporal cortex (ITC)]. In symptomatic disease stages, positivity was common for all tau biomarkers (71 to 100% for all, except Tau PET Braak V–VI, which had 32 to 66% positivity in symptomatic disease stages). For CSF tau biomarkers, the percentages of positive individuals did not differ markedly between Aβ+ with milder cognitive deficits and dementia, but for Tau PET, the proportion of positivity increased from milder cognitive deficits to dementia. These results demonstrate that CSF tau protein levels and phosphorylation are increased already in Aβ+ CU (in up to 70% of individuals for CSF P-tau217), a stage of the disease when insoluble PHF-tau deposition is rarely detected on Tau PET.
CSF P-tau positivity without Tau PET positivity is common in early stages of AD
Next, we studied the concordance between normal and abnormal CSF P-tau and Tau PET. A finding that the prevalence of CSF P-tau positivity in Tau PET–negative individuals is much more common than Tau PET positivity in CSF P-tau–negative individuals would strongly indicate that CSF P-tau changes before Tau PET. Figure 1 (F to K) shows CSF P-tau and T-tau concordance with Tau PET in the combined sample. Most individuals were either concordant negative (range, 22.1 to 29.0%) or positive (range, 25.2 to 48.9%) for CSF P-tau and Tau PET measures, but isolated CSF P-tau positivity was also seen in several cases (28.2 to 51.1%). Isolated Tau PET positivity was very rare (0.8 to 3.1%).
The discordant CSF-positive individuals were mainly Aβ+ CU or had mild cognitive deficits, indicating that CSF P-tau181 and CSF P-tau217 become positive before Tau PET in Aβ+ individuals in the early disease stages. There was only one outlier: a patient with AD dementia who had high Tau PET levels but markedly low CSF T-tau and P-tau levels (an early-onset female patient with AD, age 62 at the time of testing, Aβ+ using the CSF Aβ42/Aβ40 ratio; note that the CSF P-tau/T-tau ratios in this individual were clearly elevated; see below). For CSF T-tau versus Tau PET, isolated CSF positivity (12.2 to 26.0%) and isolated Tau PET positivity (13.7% for all regions) were more similar, indicating that phosphorylation of tau might be a more specific early phenomenon than increased overall tau release.
Longitudinal CSF tau levels increase in preclinical AD before Tau PET becomes positive
If release and phosphorylation of tau are altered long before PHF-tau deposits are detected, we would expect to see changes in soluble tau emerging in the preclinical disease stage before Tau PET signals start to increase. A subset of CU (13 Aβ− and 33 Aβ+) had an additional lumbar puncture at an earlier time point {median of 3.8 years [interquartile range (IQR), 3.0 to 5.1] before Tau PET}. We tested whether CSF biomarkers changed longitudinally during this time (Fig. 2). Rates of increase for CSF P-tau181, P-tau217, and T-tau were higher in Aβ+ CU [median (IQR) yearly increase: 7.06 (3.09 to 14.29) ng/liter and year, 13.42 (4.94 to 22.12) ng/liter and year, and 10.65 (1.96 to 22.78) ng/liter and year for CSF P-tau181, P-tau217, and T-tau, respectively] compared with Aβ− CU individuals [0.33 (−0.35 to 1.62) ng/liter and year, 1.34 (−0.055 to 1.94) ng/liter and year, and 2.54 (−0.28 to 4.45) ng/liter and year) (see Fig. 3 for statistical comparison, adjusted for covariates). All but one had a negative Tau PET at follow up. The only exception was one Aβ+ individual with a positive Tau PET in ITC, and removing this individual did not change the results significantly. These results support that CSF tau biomarkers increase over time in response to Aβ+ before significant PHF-tau accumulation is detected by Tau PET.
Fig. 2. Longitudinal changes in CSF tau biomarkers.
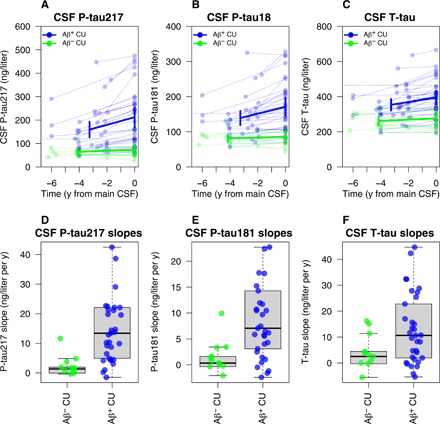
Longitudinal CSF P-tau217 (A and D), P-tau181 (B and E), and T-tau (C and F) in CU individuals with an additional early sample, preceding the main CSF sample. Slope differences were tested in linear regression models, adjusted for age, sex, and time span between the two lumbar punctures. CSF P-tau217, CSF P-tau181, and CSF T-tau increased significantly more in Aβ+ CU than in Aβ− CU individuals (P-tau217, difference: β = 13.8 ng/liter and year, P = 0.0054; P-tau181, difference: β = 8.7 ng/liter and year, P = 0.010; T-tau, difference: β = 9.55 ng/liter and year, P = 0.031).
Fig. 3. Levels of CSF tau and Tau PET by continuous Amyloid PET load.
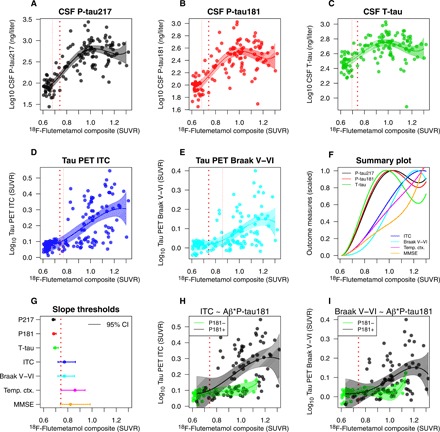
(A to E) CSF tau (A to C) and Tau PET (D and E) measures in relation to global cortical 18F-flutemetamol. The solid lines are fits from spline models of tau biomarkers on 18F-flutemetamol. The thick dotted line shows an a priori 18F-flutemetamol threshold (0.743 SUVR). The thin dotted lines indicate the 18F-flutemetamol level where tau biomarkers are significantly increased from baseline (where the biomarker increases at least two standard errors of the mean from the baseline). (F) A summary of all models, with all biomarkers on a common scale ranging from 0 (baseline levels) to 1 (the mean levels in the top 10 percentiles). For reference, the summary plot also includes corresponding models for temporal cortical thickness and global cognition (MMSE; with reversed values so that higher values always mean more pathological levels). Overall, the CSF biomarkers have steeper slopes (reaching their maximum values before Tau PET, atrophy, and cognition). (G) Summary of the thresholds for when significant changes are seen, including 95% confidence intervals (from a bootstrap procedure). The CSF biomarkers all increase early (before the a priori threshold for 18F-flutemetamol), while Tau PET, cortical atrophy, and cognitive decline start when 18F-flutemetamol is positive. (H and I) Spline models for Tau PET fit separately in individuals with negative and positive CSF P-tau181 (excluding one clear outlier with high Tau PET despite very low CSF tau), showing that the associations between 18F-flutemetamol and Tau PET were only present in individuals with positive CSF P-tau levels. All biomarkers were log10 transformed to facilitate the fit of the spline models.
CSF P-tau is often positive even several years before a negative Tau PET scan
Next, we wanted to study whether CSF tau markers were increased to pathological levels in Aβ+ individuals, even in those who did not have any evidence of tau aggregation several years later. In the Tau PET–negative CU (13 Aβ− and 32 Aβ+), we therefore calculated the proportion of individuals who were positive for CSF tau markers in the early CSF sample (median of 3.8 years before the negative Tau PET). All Aβ− CU were negative on CSF P-tau217, P-tau181, and T-tau in the early sample (0% positive). Among the Aβ+ CU, 18 (56.3%) were positive for CSF P-tau217, 8 (25.0%) for CSF P-tau181, and 3 (9.4%) for CSF T-tau in the early sample. These results show that CSF P-tau markers (especially P-tau217) not only start to increase but also, in many cases, reach clearly abnormal levels several years before PHF-tau deposition can be detected by Tau PET. This opens the possibility to detect and treat altered tau metabolism in early stages of AD before significant tau deposition.
CSF tau starts to increase in early stages of Aβ accumulation, but Tau PET increases when Aβ accumulation is already manifest
Aβ accumulates continuously throughout AD (20). The overall Amyloid PET uptake is therefore related to disease stage, as Aβ pathology increases throughout the brain (21). If Aβ first affects soluble tau metabolism and tau aggregation follows later, there may be differential associations between soluble tau biomarkers, Tau PET, and continuous Amyloid PET levels. Specifically, one may expect increases in soluble tau and Tau PET at different levels of Amyloid PET. We therefore tested nonlinear spline models to identify thresholds for when CSF P-tau, T-tau, and Tau PET biomarkers increased with respect to continuous 18F-flutemetamol (Amyloid) PET (representing Aβ fibrillar plaque load; Fig. 3). A cut point for established 18F-flutemetamol positivity is 0.743 standardized uptake value ratio (SUVR) [when using the target region of interest (ROI) and reference region described in Materials and Methods]. CSF P-tau217, P-tau181, and T-tau started to increase already at 18F-flutemetamol 0.679 SUVR [95% confidence interval (CI), 0.671 to 0.695], 0.684 SUVR (95% CI, 0.675 to 0.703), and 0.695 SUVR (95% CI, 0.682 to 0.721), respectively (Fig. 3, A to C). Note that these were the points of the first significant increase in CSF tau levels, which continued to increase with the 18F-flutemetamol levels (and reaching clearly pathological levels, such as average levels in AD dementia, at much greater 18F-flutemetamol uptake). Tau PET measures increased at 18F-flutemetamol 0.772 (ITC) or 0.859 SUVR (Braak V–VI; Fig. 3, D and E). We summarize all the different tau biomarkers on common scales in Fig. 3 (F and G). These results show that changes in soluble tau metabolism start early in the disease process, when Aβ accumulation has not yet reached suprathreshold levels. In contrast, accumulation of insoluble PHF-tau increased later in the disease process, when widespread Aβ pathology was already present. Furthermore, the increase in Tau PET as a function of 18F-flutemetamol was only seen in individuals with high CSF P-tau levels, but not in individuals with low CSF P-tau (Fig. 3, H and I).
CSF tau statistically mediates the association between Amyloid PET and Tau PET
Following the findings that increased Tau PET appeared to require changes in both Amyloid PET and P-tau, we tested whether the effects of Amyloid PET (representing Aβ fibrillar plaques) on Tau PET (representing PHF-tau) were statistically mediated via increased levels of soluble tau. We found that P-tau217 and P-tau181 significantly mediated the effect of Amyloid PET on Tau PET with 82 and 68% mediation, respectively (Fig. 4). In models that used both Amyloid PET and P-tau217 or P-tau181 as predictors, the effect of Amyloid PET on Tau PET showed a full mediation, as the effect of Amyloid PET on Tau PET was reduced from highly significant (P < 0.001) to nonsignificant (P = 0.12 to 0.25). When using T-tau instead, the mediation was more modest (41% mediation), and Amyloid PET retained an independent association with Tau PET. These results suggest that Amyloid PET increase may be linked to Tau PET through the process of increased tau phosphorylation and (to a smaller degree) increased overall tau release.
Fig. 4. CSF tau biomarkers as statistical mediators of the relationship between Amyloid PET and Tau PET.
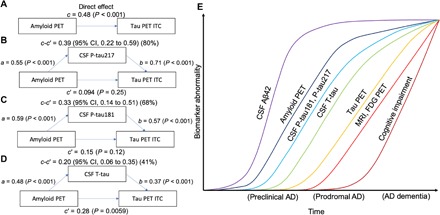
(A to D) Mediation analysis of the relationship between Amyloid PET, CSF tau biomarkers, and Tau PET in ITC. Amyloid PET is the global cortical 18F-flutemetamol uptake [the direct effect (c) on Tau PET is shown in (A)]. Analyses are shown with CSF P-tau217 (B), CSF P-tau181 (C), and CSF T-tau (D) as mediators. The mediated effect is designated c-c′. The remaining effect of Amyloid PET on Tau PET after adjusting for the mediator is designated c′. The direct effect of Amyloid PET on the mediator is a, and the direct effect of the mediator on Tau PET is b. CSF P-tau217 and P-tau181 mediated a large part of the relationship between Amyloid PET and Tau PET. CSF T-tau was also significant, but to a smaller degree. These analyses included individuals who were CU or who had mild cognitive deficits, to focus the analyses on the effects of Aβ on tau in early stages of AD. To facilitate model comparisons, all models use continuous standardized (z scores) data for biomarkers. (E) A model synthesizing the findings in this study, together with previous literature (37), indicating an approximative ordering of how different measures change during the disease course. The results in this study suggest that changes in CSF P-tau181 and P-tau217 may start shortly after Amyloid PET. In parallel, or shortly thereafter, CSF T-tau may increase. Both CSF P-tau and T-tau markers start to change before significant uptake is detected by Tau PET. Approximate overall disease stages (preclinical, prodromal, and dementia) are indicated on the x axis. We acknowledge that there may be large interindividual differences in the timing of different events (especially changes in cognition) due to individual reserve and vulnerability factors that may modulate the relationships between different disease hallmarks. FDG, fluorodeoxyglucose.
CSF tau is not increased in MAPT mutation carriers, even with tau pathology
If CSF tau measures (especially P-tau) are increased in response to Aβ fibrillar plaques rather than directly reflecting tau pathology in the brain, carriers of disease-causing MAPT (the gene encoding for tau) mutations, who develop tau pathology in the absence of Aβ pathology, would be expected to have normal CSF tau levels. We confirmed this hypothesis in a set of 12 MAPT mutation carriers (eight with cognitive impairment and four CU controls), where all 12 had normal levels of CSF P-tau, and 10 of 12 had normal levels of CSF T-tau (fig. S1).
Tau PET, but not CSF tau, predicts cognitive impairment
To test whether tau biomarkers were associated with changes in cognition, we used longitudinal mini mental state examination (MMSE) data, acquired from up to 2 years before the biomarker tests and up to 4 years after the biomarker test. We tested these associations separately in the Aβ+ CU, Aβ+ with mild cognitive deficits, and Aβ+ AD dementia patients (data were too sparse for modeling in Aβ− CU). There were no associations with longitudinal MMSE in Aβ+ CU. In Aβ+ individuals with symptoms, higher levels of Tau PET, but not CSF tau, were associated with a more rapid decline in MMSE over time (fig. S2). This is well in line with previous findings that tau accumulation (measured by Tau PET) is closely associated with cognitive decline (22). In contrast, CSF tau levels increase in the presence of Aβ, but do not directly reflect an injury process leading to cognitive decline.
CSF tau predicts future Tau PET accumulation in cognitively impaired people
If changes in release and phosphorylation of tau facilitate the formation of PHF-tau, then the levels of P-tau and T-tau should predict increases in the Tau PET signal over time. A subset of individuals had an additional Tau PET scan (13 Aβ− CU, 18 Aβ+ CU, 9 Aβ+ with mild cognitive deficits, and 13 Aβ+ AD dementia) at a later time point [median of 1.9 years (IQR 1.7 to 2.0) after the first scan]. In these, we tested whether CSF tau measures predicted a subsequent increase in Tau PET. Within Aβ+ individuals with cognitive deficits (analyzing mild deficits and dementia together), higher P-tau181, P-tau217, and T-tau were associated with more rapid increase in Tau PET in most regions (fig. S3, A to C and E to G). In contrast, baseline Tau PET was not associated with longitudinal increase in Tau PET in the same individuals (fig. S3, D and H). These results indicate that changed metabolism of soluble tau facilitates subsequent formation of tau aggregation, and support previous findings that the spread of tau aggregates largely happens during the symptomatic phase of the disease (22). For comparison, we also tested baseline CSF tau measures as predictors of future CSF tau in individuals with two lumbar punctures (see above for details) and found that high baseline CSF P-tau and T-tau predicted further increase in the CSF tau measures in most groups (the only exceptions were P-tau217 in Aβ− CU and T-tau in Aβ+ symptomatic individuals; fig. S3, I to K).
CSF P-tau/T-tau ratios are increased early and continue to increase as tau accumulates
Phosphorylation of tau at amino acids 217 or 181 positions was a more reliable marker of early tau changes than increased release of tau in general, considering that P-tau217 and P-tau181 were increased to a higher degree than T-tau in Aβ+ CU, and mediated the effects of Amyloid PET on Tau PET to a higher degree than T-tau. To explore this further, we also tested P-tau217/T-tau and P-tau181/T-tau ratios. These ratios were also changed in Aβ+ CU and were often positive in individuals with negative Tau PET (but the opposite, a positive Tau PET with a negative CSF P-tau/T-tau ratio, was only seen in one individual, for P-tau181/T-tau; fig. S4). The ratios also increased over time in Aβ+ CU, and spline models indicated that they started to increase before Amyloid PET became positive (fig. S5). The ratios strongly mediated the effects of Amyloid PET on Tau PET (full mediation effects; fig. S6). Together, these results show that the P-tau217/T-tau and P-tau181/T-tau ratios increase before Tau PET and may link Aβ pathology to deposition of PHF-tau.
CSF levels of truncated tau
To test whether the alterations in soluble tau metabolism also involved a differential truncation of tau, we measured a C-terminally truncated variant of tau, ending at amino acid 368 (called Tau368), which is enriched in NFT (23), using a recently described single-molecule array assay (24). The results are shown in fig. S7. In sum, CSF Tau368 levels were slightly increased in Aβ+ individuals with mild cognitive deficits or AD dementia, but Tau368 levels were not significantly increased in Aβ+ CU compared with Aβ− CU, and there were no clear correlations between Tau368 and Tau PET uptake (fig. S7, A to C). When testing ratios of CSF Tau368 to P-tau217 (fig. S7, D to F) or CSF Tau368 to T-tau (fig. S7, G to I), the differences between diagnostic groups became more pronounced and were similar to results when using CSF P-tau217 or T-tau as individual markers or when using the CSF P-tau217/T-tau ratio. These results suggest that truncation of tau (at least for formation and release of Tau368 into the CSF) is a less marked phenomenon compared with increased phosphorylation (indicated by elevated levels of CSF P-tau217) and release of tau (indicated by elevated levels of CSF T-tau), both as a response to early Aβ pathology (due to the lack of pronounced increase in CSF Tau368 in Aβ+ CU) and in relation to deposition of PHF-tau (due to the lack of correlation between CSF Tau368 with Tau PET).
CSF tau increases when Aβ pathology accumulates in 5xFAD mice
To corroborate the findings from humans, we studied changes in CSF tau in a transgenic mice model of AD (5xFAD). These mice start to show infrequent Aβ-containing fibrillary plaques in the cortex at 2 months of age, and the plaques become more frequent with time as demonstrated before (25) and verified by us (Fig. 5 and table S1). This transgenic model does not develop any NFTs or other tau aggregates like neuropil threads, and the loss of pre- and postsynaptic markers is observed around 9 months of age (25). In this model, we observed clear increases in CSF tau already at 4 months of age (Fig. 5A). This indicates that CSF tau increases in response to Aβ pathology, even if no tau aggregates are formed. The abnormal metabolism of soluble tau in the presence of Aβ pathology is therefore not ubiquitously on the path to PHF formation.
Fig. 5. CSF T-tau in 5xFAD mice.
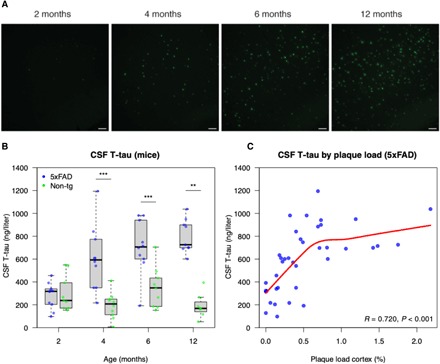
CSF T-tau concentrations were measured in 5xFAD mice and age-matched nontransgenic littermates at 2 (5xFAD, n = 10; nontransgenic, n = 9), 4 (5xFAD, n = 10; nontransgenic, n = 10), 6 (5xFAD, n = 10; nontransgenic, n = 9), and 12 (5xFAD, n = 9; nontransgenic, n = 7) months of age. (A) Thioflavin S staining of 5xFAD mice cerebral cortex at different ages. Scale bars, 100 μm. (B) CSF T-tau concentrations in 5xFAD mice were significantly higher than those in nontransgenic littermates at 4, 6, and 12 months of age (Mann-Whitney U test; **P < 0.05 and ***P < 0.001). (C) CSF T-tau concentrations correlated significantly positive with amyloid plaque load in cortex when assessed over all age groups in 5xFAD mice [the statistic is Spearman’s Rho; the red line is a local regression fit using LOESS (locally estimated scatterplot smoothing)]. See table S1 for details.
DISCUSSION
This study presents converging results from human individuals in asymptomatic and symptomatic stages of AD, and from an AD mouse model (5xFAD) that increased release and phosphorylation of tau occur in response to fibrillar Aβ deposition, and that these alterations in tau metabolism link the accumulation of Aβ plaques to deposition of PHF-tau as seen by Tau PET in humans, but with a delay of several years after the first changes in soluble tau. These findings are in line with previous findings from cell and animal experiments (4), and from studies in humans with Stable Isotope Labeling Kinetics (8), that release and phosphorylation of tau proteins are affected by Aβ pathology. To our knowledge, this is the first study to demonstrate directly in humans that early Aβ pathology is associated with marked changes in levels and phosphorylation of tau, before deposition of PHF-tau is detected with Tau PET imaging, and that changes in soluble tau mediate the effects of Aβ pathology on downstream deposition of tau aggregates. These findings strengthen the amyloid cascade hypothesis and demonstrate in humans with sporadic (non–autosomal dominant) forms of AD that metabolism of soluble tau is altered in the presence of Aβ, and that this foreshadows significant tau deposition by several years. This suggests that Aβ pathology leads to increased neuronal phosphorylation and release of tau, which seems necessary for the formation of tau deposits. The finding that increased CSF P-tau/T-tau ratios were seen in relation to early Aβ changes suggests that hyperphosphorylation of tau (including at residues 181 and 217), and not only increased release of tau, may be a particularly early event that is occurring together with the first Aβ deposition. This opens the possibility to interfere against specific alterations of tau metabolism during preclinical phases of the disease, before detrimental tau aggregation has occurred. In contrast, we found only weaker relationships between early Aβ changes and increases in CSF levels of a C-terminally truncated form of tau (Tau368).
The first key finding was that CSF P-tau217 and P-tau181 were increased already in preclinical AD (Aβ+ CU), even when using CSF samples taken several years before a negative Tau PET scan. This suggests that increases in CSF T-tau and P-tau (and P-tau/T-tau ratios) reflect very early processes in AD that occur when Aβ pathology is present, but which precede widespread aggregates of PHF-tau by several years. When modeling tau biomarkers as a function of continuous fibrillar Aβ burden (using 18F-flutemetamol PET), increases in CSF P-tau and T-tau even started before a conventional threshold for Amyloid PET positivity. Note that this refers to the point when the very first changes in the CSF tau biomarker levels can be detected, shown in Fig. 3, and those levels are lower than the average CSF tau levels in the Aβ+ CU/mild cognitive deficits/AD dementia, shown in Fig. 1. Note also that Amyloid PET also increases continuously and likely has been increasing for several years already until reaching the positivity threshold. In contrast to CSF tau, Tau PET increases occurred well into the phase of Amyloid PET positivity and only in individuals who also had increased CSF P-tau levels. In humans, CSF P-tau217 and P-tau181 mediated up to 80% of the effect of fibrillar Aβ on Tau PET. Furthermore, baseline CSF tau (but not baseline Tau PET) predicted future increases in Tau PET in people with cognitive impairment. We found similar findings for different CSF tau assays, but P-tau217 may change earlier than P-tau181 and T-tau. For example, in a sample with CSF biomarkers taken a mean of 3.8 years before a negative Tau PET scan, 56% of Aβ+ CU had positive P-tau217 levels, compared with 25% for P-tau181 and 9% for T-tau. In relation to this, a recent mass spectrometry–based study found increased degree of phosphorylation at position 217 compared with position 181 in CSF from patients with AD (9). Together, these results support a model where Aβ pathology induces a change in brain metabolism of tau, including increased release and phosphorylation of tau at amino acid residues 217 and 181, where phosphorylation at position 217 may be a more pronounced early change, which later leads to accumulation of tau aggregates. Some of the findings from humans could be translated back to 5xFAD mice, where CSF T-tau levels (we did not measure CSF P-tau since, to our knowledge, there is no assay available to measure P-tau in the CSF of mice) started to increase slightly after extracellular Aβ plaques start to accumulate, and then continued to increase as the Aβ pathology progressed, despite a lack of formation of PHF-tau in these mice (25). Furthermore, humans with MAPT mutations (with or without cognitive impairment), who were Aβ−, did not have increased levels of CSF P-tau (and only rarely of CSF T-tau), although they often had tau pathology as shown by Tau PET or on autopsy. Together, the findings from human and mice show that Aβ pathology induces very early changes in soluble tau metabolism. Changes in CSF T-tau and P-tau appear to be more closely related to the development of Aβ pathology than to development of tau aggregation. This is also in line with our findings that Tau PET, but not CSF tau, predicted longitudinal cognitive decline (since aggregated tau is believed to be more closely associated with detrimental neurodegeneration than what Aβ is).
Our findings are in agreement with previous results from many different experimental systems using both cell and animal models (4), which have shown that aggregated Aβ peptides may induce tau hyperphosphorylation both in vitro and in vivo (6, 26), stabilize tau aggregates (27), and promote the propagation of new tau aggregates (28). The first tau deposits that are initiated by Aβ may occur in dystrophic neurites surrounding the Aβ plaques, with the formation of widespread tangle pathology coming later (29), potentially spreading through functionally connected neurons. This agrees with our results that Aβ pathology first induces subtle changes in tau metabolism (detectable as changes in soluble tau, especially P-tau217 and P-tau181), many years before widespread aggregates of tau are detectable with Tau PET imaging.
It is still unclear exactly how Aβ exerts its effects on tau. Several possibilities exist, including that Aβ may induce tau alterations through specific binding to receptors (or nonspecific binding to lipid membranes) (4). Another possibility is that Aβ is linked to tau indirectly through changes in microglial or astrocytic activity, which in turn induces tau pathology (30). In line with this hypothesis, there is biomarker evidence of stronger correlations between the glial activation biomarker YKL-40 and soluble tau in people with Aβ pathology, compared with people without Aβ pathology (31). Another possibility is that Aβ aggregates can cross-seed with tau proteins to propagate tau aggregation (32). Once tau is hyperphosphorylated, it may be more likely to form PHF and NFT, although this view has also been challenged (33). Last, one recent study focusing on a rare APOE variant (the so-called Christchurch mutation) suggested that binding of proteins to heparan sulfate proteoglycans may mediate the relationship between Aβ pathology and tau aggregation (34).
Our finding in humans that changes in soluble tau occur early in AD as a function of Aβ deposition, prior to widespread aggregates of insoluble tau, has implications for the use of CSF tau and Tau PET biomarkers for AD diagnosis. A recently presented framework for AD research (the “ATN” framework) has suggested that Tau PET and CSF P-tau can be used to define tau pathology (“T”), while CSF T-tau can be used to define neurodegeneration (“N”) in AD (18). Our current results, together with previous findings (14), suggest that the sensitivity and specificity of Tau PET and CSF P-tau to identify abnormalities in tau metabolism differ. Specifically, not only CSF P-tau217 but also P-tau181 may be increased very early (in preclinical stages) and then reach a plateau [and in very late stages, perhaps even a decrease, as has also been suggested by findings from autosomal dominant AD (35)]. In contrast, Tau PET may continue to increase throughout the disease course, which gives it a very high diagnostic accuracy during the later stage of the disease (36). A model of biomarker trajectories in AD (37) may therefore be updated (Fig. 4E). The fact that CSF tau biomarkers may change early, before Tau PET and potentially before neocortical PHF-tau aggregation, may have implications, for example, for clinical trials, aimed at individuals with the first changes in tau metabolism (e.g., individuals with increased CSF P-tau but without changes in Tau PET). Our findings also support the notion of “state markers,” reflecting the presence of a pathophysiological processes, and “stage markers,” which give a measure of, e.g., degree of atrophy or accumulated amount of aggregated proteins (38). In this scenario, changes in CSF P-tau217 and P-tau181 would indicate “disease state,” i.e., the presence of a pathological process associated with AD from very early on in the disease, while the continuous increase in Tau PET [and the strong correlations between Tau PET and atrophy and cognitive decline; (39)] would make Tau PET a marker of “disease stage” throughout the symptomatic phases of AD. Our findings also suggest that disease-modifying interventions against tau, especially with modulators of tau phosphorylating kinases, may be tested in early stages of the disease. It may be possible to identify clinical trial participants with altered soluble tau biomarkers but without widespread tau accumulation on Tau PET. These individuals may have changes in tau metabolism but still lack significant tau deposition. This may be the point where the disease cascade may be blocked to minimize development of neurodegeneration and symptoms.
We included four different CSF tau biomarkers, T-tau, P-tau181, P-tau217, and Tau368. Although changes in T-tau were also seen early, P-tau (especially P-tau217) more strongly mediated the effect of Amyloid PET on Tau PET and was more clearly altered in the earliest stages of the disease (in Aβ+ CU several years before a negative Tau PET scan). Phosphorylation of soluble tau therefore seems to be a more reliable early marker of early tau changes than increased release of tau in general. Our findings from P-tau217/T-tau and P-tau181/T-tau ratios further support this, since these ratios were also altered very early in response to Aβ deposition. Our results therefore support that Aβ aggregation leads to both increased tau release (as shown in both the human individuals and the mouse model data) and phosphorylation, but it is primarily the altered tau hyperphosphorylation that is associated with the deposition of tau aggregates in humans. This is also well in line with previous observations that T-tau levels may be increased also in other conditions with brain injury without tau aggregation (17). In contrast, levels of Tau368 were less altered in AD (including in Aβ+ CU), suggesting that at least this truncation variant is less changed in early stages of Aβ deposition.
Limitations of the study include the lack of neuropathology to verify the correlations between the different tau measures and neuropathological changes in the brain. However, this is a common problem for all human studies on changes in the preclinical or early clinical stages of AD. Another limitation was that the longitudinal part of the study was relatively small and differed between CSF and Tau PET measures. Last, one possible caveat is that the sensitivity may differ for the different techniques. ELISA (enzyme-linked immunosorbent assay) assays are very sensitive such that levels can even be measured in healthy controls, but future studies are needed to compare the levels of P-tau in CSF with the levels in the interstitial fluid or brain tissue of humans. In contrast, PET is typically less sensitive, but comparisons of in vivo Tau PET versus neuropathology data have shown good correlations between Tau PET signal and tau neuropathology quantifications, although we note that individuals in those studies had substantial tau accumulation (10). We also found very similar results when using Tau PET in entorhinal cortex, potentially a very early site for tau accumulation (Supplementary text and fig. S8).
To conclude, the CSF levels of tau proteins, especially P-tau217 and P-tau181, are increased in response to Aβ deposition in humans in early stages of AD. The change in soluble tau metabolism (including hyperphosphorylation) is a link between the accumulation of Aβ and the widespread deposition of insoluble tau aggregates detectable by Tau PET imaging, with the latter following several years after detection of the first changes in soluble tau. Further research on the effects of Aβ pathology on phosphorylation and release of tau may facilitate disease-modifying therapies directed against tau pathology in AD. Clinical trials evaluating tau-modifying therapies, e.g., modulators of tau phosphorylating kinases, may be most likely to succeed in individuals with Aβ pathology as well as increased CSF P-tau217 and P-tau181 levels, but yet only limited spread of insoluble tau-aggregates according to Tau PET.
MATERIALS AND METHODS
Participants
The study population included 131 participants from the Tau PET substudy from the prospective and longitudinal Swedish BioFINDER study (www.biofinder.se), who all underwent Tau PET imaging with 18F-flortaucipir and lumbar puncture for analysis of CSF biomarkers. Individuals without and with cognitive impairment due to AD were included, as described in detail previously (36). For patients with cognitive impairment, biomarker signs of Aβ pathology was an inclusion criterion (using the CSF Aβ42/Aβ40 ratio; see below). All participants were staged using the CDR global score and grouped by Aβ status and CDR into Aβ− CU (CDR, 0), Aβ+ CU (CDR, 0), Aβ+ with mild cognitive deficits (CDR, 0.5), and Aβ+ AD dementia (CDR, 1 to 3, mild to marked dementia) (19). For a subanalysis, we also included 12 individuals with MAPT mutations, including two patients from the Swedish BioFINDER study and six patients and four CU mutation carriers from the University of California, San Francisco, Memory and Aging Center (with a variety of MAPT mutations, including individuals with P243L, R317W, V337M, R406W, and other mutations). All participants gave written informed consent to participate in the study. The study was approved by the regional ethical committee.
CSF biomarkers
CSF samples were derived from lumbar puncture and analyzed for CSF Aβ42, Aβ40, and T-tau using fully automated ELISAs (EUROIMMUN AG, Luebeck, Germany), as described previously (40), and P-tau181 and P-tau217 using novel assays developed by Eli Lilly and Company (Supplementary Text). CSF samples were also analyzed for a C-terminally truncated form of tau (Tau368) using a recently described single-molecule array method (24). CSF samples in the MAPT mutation carriers were analyzed with recently developed fully automated assays for CSF Aβ42, Aβ40, P-tau181, and T-tau on the Roche Elecsys platform, as described recently (41). The CSF Aβ42/Aβ40 ratio (using EUROIMMUN data) was used to define Aβ status, with a previously defined cut point (<0.1) to define positivity (42). A schematic of tau assay antibody epitopes is shown in fig. S9. A subset of participants also had an additional lumbar puncture before Tau PET, preceding the main sample, and results from those CSF samples were used for analysis of longitudinal CSF tau biomarkers.
18F-Flutemetamol PET imaging
Details about the 18F-flutemetamol PET (Amyloid PET) imaging has been described before (43). In this study, Amyloid PET was available in 121 participants. We used the Amyloid PET signal in a global cortical composite region. A cut point for this global uptake was defined in a cohort of 428 BioFINDER participants using mixture modeling analysis as described elsewhere (SUVR 0.743; Mattsson, Leuzy et al., in press, Neurology).
18F-flortaucipir PET imaging
Details about the 18F-flortaucipir PET (Tau PET) imaging have been described before (15). In short, 18F-flortaucipir was synthesized at Skåne University Hospital, Lund. PET scans were performed on a GE Discovery 690 PET scanner (General Electric Medical Systems). Non–partial volume–corrected data were used for the main analyses. 18F-flortaucipir standardized uptake value (SUV) images were constructed on the basis of mean uptake over 80 to 100 min postinjection normalized to uptake in an inferior cerebellar gray matter reference region in each participant’s magnetic resonance imaging (MRI) native space. Analyses were done using a priori defined ROIs. We used three regional measures: the signal from the entorhinal cortex, ITC, and the signal from a composite regions, corresponding to previously suggested tau stages V and VI (44), called Braak stage V–VI in this paper. Note that each individual had data sampled in each of the regions (e.g., even people with very little tau had data sampled from the Braak stage V–VI region). The composite signals were calculated as the sum of the volume-adjusted regional uptake. Tau PET in entorhinal cortex was also analyzed after partial volume correction, performed using the geometric transfer matrix (GTM) method (45), in which spillover due to imaging resolution limitations between predefined ROIs is estimated and reversed. To this end, we used the ROIs from the FreeSurfer anatomical segmentation. Longitudinal Tau PET images (2-year follow-up scans) were available in a subset of individuals.
Cut points
We defined cut points for tau biomarkers based on the mean levels plus two SDs of the respective biomarker in independent cohorts of Aβ− CU. For the Tau PET measures, we used a population described previously in (36), where the cut points were 1.390 SUVR (entorhinal cortex), 1.310 SUVR (ITC), and 1.280 SUVR (Braak V–VI). For the CSF measures, we used an independent population of 133 Aβ− CU in the BioFINDER study (43), who had been analyzed with the same CSF assays. The cut points were 152.6 ng/liter for CSF P-tau181, 119.5 ng/liter for CSF P-tau217, and 464.7 ng/liter for CSF T-tau.
Magnetic resonance imaging
MRI methods have been described previously (46). In short, T1-weighted imaging was performed on a 3-T MR scanner (Siemens TIM Trio 3T, Siemens Medical Solutions, Erlangen, Germany). Cortical reconstruction and volumetric segmentation of images were performed with the FreeSurfer image analysis pipeline v5.3 (http://surfer.nmr.mgh.harvard.edu/). A temporal cortical thickness measure (average cortical thickness in entorhinal cortex, fusiform cortex, ITC, and middle temporal cortex) was used in relation to 18F-flutemetamol, for comparison with CSF tau biomarkers and Tau PET.
Animals
Two- to 12-month-old heterozygous 5xFAD transgenic mice, originally obtained from the Jackson laboratory, were used. These mice overexpress human APP(695) with the K670N/M671L (Swedish), 1716 V (Florida), and V7171 (London) mutations together with human PS1 harboring the M146L and L286V mutations under the control of the mouse Thy1 promotor element. Age-matched nontransgenic littermates were included as controls. Animals were housed in groups of two to six mice per cage under a 12-hour light:12-hour dark cycle with free access to food and water. A total of 74 mice were used. The animal experimental procedures were carried out in accordance with the Swedish animal research regulations and were approved by the committee of animal research at Lund University.
CSF collection from mice
CSF was collected from cisterna magna in accordance with a method previously described (47). All sample were collected between 9:00 a.m. and 1:00 p.m. Mice were anesthetized with isoflurane and placed on a stereotaxic frame. An incision of the skin inferior to the occiput was made, and the underlying neck muscles were separated to expose the dura mater of the cisterna magna using a dissecting microscope. CSF was collected by penetration of the dura mater using a glass capillary with a tapered tip. Samples were immediately transferred to protein LoBind tubes (Eppendorf), snap frozen on dry ice, and stored at −80°C until further analysis.
Analysis of mice CSF
Mouse CSF T-tau levels were measured using the Simoa Mouse Tau Discovery Kit (Quanterix) on the Simoa HD-1 Analyzer (Quanterix) according to instructions provided by the manufacturer.
Thioflavin S staining and quantification of amyloid plaque load in mice
Mice were transcardially perfused with ice-cold 0.1 M phosphate buffer (PB). The left cerebral hemisphere was removed and fixed in 4% paraformaldehyde in PB for 48 hours at 4°C and then immersed in 30% sucrose solution for 48 hours at 4°C. Sagittal free-floating sections (30 μm thick) were prepared, stained with 0.01% Thioflavin S in 50% ethanol for 10 min, and mounted on glass slides. Images of cortex from three sections per mouse were captured using an Olympus IX70 fluorescence microscope equipped with a Hamamatsu ORCA-Flash4.0 LT+ digital CMOS camera. Quantification of the area (%) covered by Thioflavin S–positive amyloid plaques was performed using the Fiji software by applying an automated threshold that was maintained for all images analyzed (table S1).
Statistics
Statistical analysis was done using R version 3.5.3 with the packages mediation and splines2. Associations between tau biomarkers and sex, education, and age in the whole cohort were tested with Spearman’s correlation test and Mann-Whitney U test. Differences in tau biomarkers between groups were tested in linear regression models adjusted for age and sex. The proportion of participants above predefined cut points were calculated (95% CI by a bootstrap procedure, n = 1000 iterations). Group-wise comparison of longitudinal rates of CSF tau biomarkers were tested using linear regression, adjusted for age and sex. Associations between tau biomarkers and continuous Amyloid PET were tested with nonlinear polynomial spline models (using I-spline basis) to detect Amyloid PET thresholds for when tau biomarkers were increased. Mediation analyses were conducted with a bootstrap method for the mediated effect. Effects of CSF tau and Tau PET biomarkers on longitudinal Tau PET were tested in linear regression models. All regression models were adjusted for age, sex, and (when appropriate) the time-lag between lumbar puncture and Tau PET scan.
Nonparametric statistical methods were used for analysis of data from animal experiments. Differences in CSF T-tau concentrations between 5xFAD mice and age-matched nontransgenic littermates were tested using the Mann-Whitney U test. The Jonckheere-Terpstra trend test was performed to test whether amyloid plaque load in cortex was increased with age in 5xFAD mice. Post hoc analysis for group comparisons between the youngest group and all other groups was performed using the Mann-Whitney U test, and corrected for multiple comparisons using the Bonferroni method. Correlations between CSF T-tau concentration and amyloid plaque load in cortex was analyze using Spearman’s rank-ordered correlation coefficient.
Supplementary Material
Acknowledgments
Funding: Work at our laboratory at Lund University was supported by the Wallenberg Center for Molecular Medicine, The Knut and Alice Wallenberg Foundation, The Medical Faculty at Lund University, Region Skåne, the European Research Council, the Swedish Research Council, the Marianne and Marcus Wallenberg Foundation, the Strategic Research Area MultiPark (Multidisciplinary Research in Parkinson’s disease) at Lund University, the Swedish Alzheimer Foundation, the Swedish Brain Foundation, the Torsten Söderberg Foundation, the Parkinson foundation of Sweden, The Parkinson Research Foundation, the Swedish Medical Association, the Konung Gustaf V:s och Drottning Victorias Frimurarestiftelse, the Bundy Academy, the Skåne University Hospital Foundation, and the Swedish federal government under the ALF agreement. Doses of 18F-flutemetamol injection were sponsored by GE Healthcare. The precursor of 18F-flortaucipir was provided by AVID Radiopharmaceuticals. Work at University of California San Francisco was funded by the National Institute of Aging (NIA P30 AG062422 and NIA P01 AG019724), the Tau Consortium, and the National Institutes of Health (U19AG063911, U54NS092089, and U01AG045390). Author contributions: N.M-.C. and O.H. conceived the study and designed the experiments. E.A. performed animal experiments. R.S., R.O., and O.S. performed neuroimaging experiments. S.J., X.C., and J.L.D. carried out biochemical experiments. E.S., O.H., and S.P. participated in recruitment and assessment of participants. H.J.R. and G.R. contributed samples from MAPT mutation carriers. N.M-.C. performed data analysis, with input from P.I. N.M-.C. and O.H. interpreted data. N.M-.C. wrote the manuscript with input from all authors. O.H. directed the work. Competing interests: S.P., E.S., P.I., S.J., R.O., E.A., and O.S. report no disclosures. N.M-.C. has been a consultant for ADNI. H.Z. has served at scientific advisory boards for Roche Diagnostics, Wave, Samumed, and CogRx, has given lectures in symposia sponsored by Biogen and Alzecure, and is a cofounder of Brain Biomarker Solutions in Gothenburg AB, a GU Ventures–based platform company at the University of Gothenburg. K.B. has served as a consultant or at advisory boards for Alector, Biogen, CogRx, Lilly, MagQu, Novartis, and Roche Diagnostics, and is a cofounder of Brain Biomarker Solutions in Gothenburg AB, a GU Ventures–based platform company at the University of Gothenburg, all unrelated to the work presented in this paper. RS has served as a (nonpaid) consultant for Roche. G.R. receives research support from Avid Radiopharmaceuticals, Eli Lilly, GE Healthcare, and Life Molecular Imaging. He has received honoraria as a consultant for Axon Neurosciences, Eisai, and Merck, and speaking honoraria from GE Healthcare. G.R. serves as Associate Editor for JAMA Neurology. H.J.R. consults for Wave pharmaceuticals and Ionis pharmaceuticals. X.C. and J.L.D. are employees of Eli Lilly and Company. O.H. has acquired research support (for the institution) from Roche, GE Healthcare, Biogen, AVID Radiopharmaceuticals, and Euroimmun. In the past 2 years, O.H. has received consultancy/speaker fees (paid to the institution) from Biogen and Roche. The authors declare no other competing interests. Data and materials availability: Anonymized data will be shared by request from a qualified academic investigator for the sole purpose of replicating procedures and results presented in the article and as long as data transfer is in agreement with EU legislation on the general data protection regulation and decisions by the Ethical Review Board of Sweden and Region SkÃ¥ne, which should be regulated in a data use agreement. The reagents used in the P-tau assays not available commercially can be provided by Dr. Dage pending scientific review and a completed material transfer agreement. Requests for the materials should be submitted to Jeffrey.dage@Lilly.com.
SUPPLEMENTARY MATERIALS
Supplementary material for this article is available at http://advances.sciencemag.org/cgi/content/full/6/16/eaaz2387/DC1
REFERENCES AND NOTES
- 1.Goedert M., Tau filaments in neurodegenerative diseases. FEBS Lett. 592, 2383–2391 (2018). [DOI] [PubMed] [Google Scholar]
- 2.Kimura T., Sharma G., Ishiguro K., Hisanaga S.-i., Phospho-tau bar code: Analysis of phosphoisotypes of tau and its application to tauopathy. Front. Neurosci. 12, 44 (2018). [DOI] [PMC free article] [PubMed] [Google Scholar]
- 3.Cicognola C., Brinkmalm G., Wahlgren J., Portelius E., Gobom J., Cullen N. C., Hansson O., Parnetti L., Constantinescu R., Wildsmith K., Chen H.-H., Beach T. G., Lashley T., Zetterberg H., Blennow K., Höglund K., Novel tau fragments in cerebrospinal fluid: Relation to tangle pathology and cognitive decline in Alzheimer’s disease. Acta Neuropathol. 137, 279–296 (2019). [DOI] [PMC free article] [PubMed] [Google Scholar]
- 4.Stancu I.-C., Vasconcelos B., Terwel D., Dewachter I., Models of β-amyloid induced Tau-pathology: The long and “folded” road to understand the mechanism. Mol. Neurodegener. 9, 51 (2014). [DOI] [PMC free article] [PubMed] [Google Scholar]
- 5.Maia L. F., Kaeser S. A., Reichwald J., Hruscha M., Martus P., Staufenbiel M., Jucker M., Changes in amyloid-β and Tau in the cerebrospinal fluid of transgenic mice overexpressing amyloid precursor protein. Sci. Transl. Med. 5, 194re2 (2013). [DOI] [PubMed] [Google Scholar]
- 6.Jin M., Shepardson N., Yang T., Chen G., Walsh D., Selkoe D. J., Soluble amyloid β-protein dimers isolated from Alzheimer cortex directly induce Tau hyperphosphorylation and neuritic degeneration. Proc. Natl. Acad. Sci. U.S.A. 108, 5819–5824 (2011). [DOI] [PMC free article] [PubMed] [Google Scholar]
- 7.Schöll M., Maass A., Mattsson N., Ashton N. J., Blennow K., Zetterberg H., Jagust W., Biomarkers for tau pathology. Mol. Cell. Neurosci. 97, 18–33 (2018). [DOI] [PMC free article] [PubMed] [Google Scholar]
- 8.Sato C., Barthélemy N. R., Mawuenyega K. G., Patterson B. W., Gordon B. A., Jockel-Balsarotti J., Sullivan M., Crisp M. J., Kasten T., Kirmess K. M., Kanaan N. M., Yarasheski K. E., Baker-Nigh A., Benzinger T. L. S., Miller T. M., Karch C. M., Bateman R. J., Tau kinetics in neurons and the human central nervous system. Neuron 97, 1284–1298.e7 (2018). [DOI] [PMC free article] [PubMed] [Google Scholar]
- 9.Barthélemy N. R., Mallipeddi N., Moiseyev P., Sato C., Bateman R. J., Tau phosphorylation rates measured by mass spectrometry differ in the intracellular brain vs. extracellular cerebrospinal fluid compartments and are differentially affected by alzheimer’s disease. Front. Aging Neurosci. 11, 121 (2019). [DOI] [PMC free article] [PubMed] [Google Scholar]
- 10.Smith R., Wibom M., Pawlik D., Englund E., Hansson O., Correlation of in vivo [18F]Flortaucipir with postmortem alzheimer disease tau pathology. JAMA Neurol. 76, 310–317 (2018). [DOI] [PMC free article] [PubMed] [Google Scholar]
- 11.Buerger K., Ewers M., Pirttila T., Zinkowski R., Alafuzoff I., Teipel S. J., DeBernardis J., Kerkman D., McCulloch C., Soininen H., Hampel H., CSF phosphorylated tau protein correlates with neocortical neurofibrillary pathology in Alzheimer’s disease. Brain 129, 3035–3041 (2006). [DOI] [PubMed] [Google Scholar]
- 12.Brier M. R., Gordon B., Friedrichsen K., McCarthy J., Stern A., Christensen J., Owen C., Aldea P., Su Y., Hassenstab J., Cairns N. J., Holtzman D. M., Fagan A. M., Morris J. C., Benzinger T. L. S., Ances B. M., Tau and Aβ imaging, CSF measures, and cognition in Alzheimer’s disease. Sci. Transl. Med. 8, 338ra66 (2016). [DOI] [PMC free article] [PubMed] [Google Scholar]
- 13.Chhatwal J. P., Schultz A. P., Marshall G. A., Boot B., Gomez-Isla T., Dumurgier J., LaPoint M., Scherzer C., Roe A. D., Hyman B. T., Sperling R. A., Johnson K. A., Temporal T807 binding correlates with CSF tau and phospho-tau in normal elderly. Neurology 87, 920–926 (2016). [DOI] [PMC free article] [PubMed] [Google Scholar]
- 14.Gordon B. A., Friedrichsen K., Brier M., Blazey T., Su Y., Christensen J., Aldea P., McConathy J., Holtzman D. M., Cairns N. J., Morris J. C., Fagan A. M., Ances B. M., Benzinger T. L. S., The relationship between cerebrospinal fluid markers of Alzheimer pathology and positron emission tomography tau imaging. Brain 139, 2249–2260 (2016). [DOI] [PMC free article] [PubMed] [Google Scholar]
- 15.Mattsson N., Schöll M., Strandberg O., Smith R., Palmqvist S., Insel P. S., Hägerström D., Ohlsson T., Zetterberg H., Jögi J., Blennow K., Hansson O., 18F-AV-1451 and CSF T-tau and P-tau as biomarkers in Alzheimer’s disease. EMBO Mol. Med. 9, 1212–1223 (2017). [DOI] [PMC free article] [PubMed] [Google Scholar]
- 16.La Joie R., Bejanin A., Fagan A. M., Ayakta N., Baker S. L., Bourakova V., Boxer A. L., Cha J., Karydas A., Jerome G., Maass A., Mensing A., Miller Z. A., O’Neil J. P., Pham J., Rosen H. J., Tsai R., Visani A. V., Miller B. L., Jagust W. J., Rabinovici G. D., Associations between [18F]AV1451 tau PET and CSF measures of tau pathology in a clinical sample. Neurology 90, e282–e290 (2018). [DOI] [PMC free article] [PubMed] [Google Scholar]
- 17.Hesse C., Rosengren L., Vanmechelen E., Vanderstichele H., Jensen C., Davidsson P., Blennow K., Cerebrospinal fluid markers for Alzheimer’s disease evaluated after acute ischemic stroke. J. Alzheimers Dis. 2, 199–206 (2000). [DOI] [PubMed] [Google Scholar]
- 18.Jack C. R. Jr., Bennett D. A., Blennow K., Carrillo M. C., Dunn B., Haeberlein S. B., Holtzman D. M., Jagust W., Jessen F., Karlawish J., Liu E., Molinuevo J. L., Montine T., Phelps C., Rankin K. P., Rowe C. C., Scheltens P., Siemers E., Snyder H. M., Sperling R., Contributors, NIA-AA Research Framework: Toward a biological definition of Alzheimer’s disease. Alzheimers Dement. 14, 535–562 (2018). [DOI] [PMC free article] [PubMed] [Google Scholar]
- 19.Morris J. C., The Clinical Dementia Rating (CDR): Current version and scoring rules. Neurology 43, 2412–2414 (1993). [DOI] [PubMed] [Google Scholar]
- 20.Villemagne V. L., Burnham S., Bourgeat P., Brown B., Ellis K. A., Salvado O., Szoeke C., Macaulay S. L., Martins R., Maruff P., Ames D., Rowe C. C., Masters C. L.; Australian Imaging Biomarkers and Lifestyle (AIBL) Research Group , Amyloid β deposition, neurodegeneration, and cognitive decline in sporadic Alzheimer’s disease: A prospective cohort study. Lancet Neurol. 12, 357–367 (2013). [DOI] [PubMed] [Google Scholar]
- 21.Villeneuve S., Rabinovici G. D., Cohn-Sheehy B. I., Madison C., Ayakta N., Ghosh P. M., La Joie R., Arthur-Bentil S. K., Vogel J. W., Marks S. M., Lehmann M., Rosen H. J., Reed B., Olichney J., Boxer A. L., Miller B. L., Borys E., Jin L.-W., Huang E. J., Grinberg L. T., DeCarli C., Seeley W. W., Jagust W., Existing Pittsburgh Compound-B positron emission tomography thresholds are too high: Statistical and pathological evaluation. Brain 138, 2020–2033 (2015). [DOI] [PMC free article] [PubMed] [Google Scholar]
- 22.Schöll M., Lockhart S. N., Schonhaut D. R., O’Neil J. P., Janabi M., Ossenkoppele R., Baker S. L., Vogel J. W., Faria J., Schwimmer H. D., Rabinovici G. D., Jagust W. J., PET Imaging of tau deposition in the aging Human brain. Neuron 89, 971–982 (2016). [DOI] [PMC free article] [PubMed] [Google Scholar]
- 23.Zhang Z., Song M., Liu X., Kang S. S., Kwon I. S., Duong D. M., Seyfried N. T., Hu W. T., Liu Z., Wang J. Z., Cheng L., Sun Y. E., Yu S. P., Levey A. I., Ye K., Cleavage of tau by asparagine endopeptidase mediates the neurofibrillary pathology in Alzheimer’s disease. Nat. Med. 20, 1254–1262 (2014). [DOI] [PMC free article] [PubMed] [Google Scholar]
- 24.Blennow K., Chen C., Cicognola C., Wildsmith K. R., Manser P., Bohorquez S., Zhang Z., Xie B., Peng J., Hansson O., Kvartsberg H., Portelius E., Zetterberg H., Lashley T., Brinkmalm G., Kerchner G., Weimer R., Ye K., Höglund K., Cerebrospinal fluid tau fragment correlates with tau PET: A candidate biomarker for tangle pathology. Brain 143, 650–660 (2020). [DOI] [PMC free article] [PubMed] [Google Scholar]
- 25.Oakley H., Cole S. L., Logan S., Maus E., Shao P., Craft J., Guillozet-Bongaarts A., Ohno M., Disterhoft J., Van Eldik L., Berry R., Vassar R., Intraneuronal beta-amyloid aggregates, neurodegeneration, and neuron loss in transgenic mice with five familial Alzheimer’s disease mutations: potential factors in amyloid plaque formation. J. Neurosci. 26, 10129–10140 (2006). [DOI] [PMC free article] [PubMed] [Google Scholar]
- 26.Zheng W.-H., Bastianetto S., Mennicken F., Ma W., Kar S., Amyloid beta peptide induces tau phosphorylation and loss of cholinergic neurons in rat primary septal cultures. Neuroscience 115, 201–211 (2002). [DOI] [PubMed] [Google Scholar]
- 27.DeVos S. L., Corjuc B. T., Commins C., Dujardin S., Bannon R. N., Corjuc D., Moore B. D., Bennett R. E., Jorfi M., Gonzales J. A., Dooley P. M., Roe A. D., Pitstick R., Irimia D., Frosch M. P., Carlson G. A., Hyman B. T., Tau reduction in the presence of amyloid-β prevents tau pathology and neuronal death in vivo. Brain 141, 2194–2212 (2018). [DOI] [PMC free article] [PubMed] [Google Scholar]
- 28.Bennett R. E., DeVos S. L., Dujardin S., Corjuc B., Gor R., Gonzalez J., Roe A. D., Frosch M. P., Pitstick R., Carlson G. A., Hyman B. T., Enhanced tau aggregation in the presence of amyloid β. Am. J. Pathol. 187, 1601–1612 (2017). [DOI] [PMC free article] [PubMed] [Google Scholar]
- 29.He Z., Guo J. L., McBride J. D., Narasimhan S., Kim H., Changolkar L., Zhang B., Gathagan R. J., Yue C., Dengler C., Stieber A., Nitla M., Coulter D. A., Abel T., Brunden K. R., Trojanowski J. Q., Lee V. M.-Y., Amyloid-β plaques enhance Alzheimer’s brain tau-seeded pathologies by facilitating neuritic plaque tau aggregation. Nat. Med. 24, 29–38 (2018). [DOI] [PMC free article] [PubMed] [Google Scholar]
- 30.Bhaskar K., Konerth M., Kokiko-Cochran O. N., Cardona A., Ransohoff R. M., Lamb B. T., Regulation of tau pathology by the microglial fractalkine receptor. Neuron 68, 19–31 (2010). [DOI] [PMC free article] [PubMed] [Google Scholar]
- 31.Janelidze S., Mattsson N., Stomrud E., Lindberg O., Palmqvist S., Zetterberg H., Blennow K., Hansson O., CSF biomarkers of neuroinflammation and cerebrovascular dysfunction in early Alzheimer disease. Neurology 91, e867–e877 (2018). [DOI] [PMC free article] [PubMed] [Google Scholar]
- 32.Vasconcelos B., Stancu I.-C., Buist A., Bird M., Wang P., Vanoosthuyse A., Van Kolen K., Verheyen A., Kienlen-Campard P., Octave J.-N., Baatsen P., Moechars D., Dewachter I., Heterotypic seeding of Tau fibrillization by pre-aggregated Abeta provides potent seeds for prion-like seeding and propagation of Tau-pathology in vivo. Acta Neuropathol. 131, 549–569 (2016). [DOI] [PMC free article] [PubMed] [Google Scholar]
- 33.Wischik C. M., Harrington C. R., Storey J. M. D., Tau-aggregation inhibitor therapy for Alzheimer’s disease. Biochem. Pharmacol. 88, 529–539 (2014). [DOI] [PubMed] [Google Scholar]
- 34.Arboleda-Velasquez J. F., Lopera F., O’Hare M., Delgado-Tirado S., Marino C., Chmielewska N., Saez-Torres K. L., Amarnani D., Schultz A. P., Sperling R. A., Leyton-Cifuentes D., Chen K., Baena A., Aguillon D., Rios-Romenets S., Giraldo M., Guzmán-Vélez E., Norton D. J., Pardilla-Delgado E., Artola A., Sanchez J. S., Acosta-Uribe J., Lalli M., Kosik K. S., Huentelman M. J., Zetterberg H., Blennow K., Reiman R. A., Luo J., Chen Y., Thiyyagura P., Su Y., Jun G. R., Naymik M., Gai X., Bootwalla M., Ji J., Shen L., Miller J. B., Kim L. A., Tariot P. N., Johnson K. A., Reiman E. M., Quiroz Y. T., Resistance to autosomal dominant Alzheimer’s disease in an APOE3 Christchurch homozygote: a case report. Nat. Med. 25, 1680–1683 (2019). [DOI] [PMC free article] [PubMed] [Google Scholar]
- 35.McDade E., Wang G., Gordon B. A., Hassenstab J., Benzinger T. L. S., Buckles V., Fagan A. M., Holtzman D. M., Cairns N. J., Goate A. M., Marcus D. S., Morris J. C., Paumier K., Xiong C., Allegri R., Berman S. B., Klunk W., Noble J., Ringman J., Ghetti B., Farlow M., Sperling R. A., Chhatwal J., Salloway S., Graff-Radford N. R., Schofield P. R., Masters C., Rossor M. N., Fox N. C., Levin J., Jucker M., Bateman R. J.; Dominantly inherited alzheimer network , Longitudinal cognitive and biomarker changes in dominantly inherited alzheimer disease. Neurology 91, e1295–e1306 (2018). [DOI] [PMC free article] [PubMed] [Google Scholar]
- 36.Ossenkoppele R., Rabinovici G. D., Smith R., Cho H., Schöll M., Strandberg O., Palmqvist S., Mattsson N., Janelidze S., Santillo A., Ohlsson T., Jögi J., Tsai R., La Joie R., Kramer J., Boxer A. L., Gorno-Tempini M. L., Miller B. L., Choi J. Y., Ryu Y. H., Lyoo C. H., Hansson O., Discriminative accuracy of [18F]flortaucipir positron emission tomography for alzheimer disease vs other neurodegenerative disorders. JAMA 320, 1151–1162 (2018). [DOI] [PMC free article] [PubMed] [Google Scholar]
- 37.Jack C. R. Jr., Knopman D. S., Jagust W. J., Petersen R. C., Weiner M. W., Aisen P. S., Shaw L. M., Vemuri P., Wiste H. J., Weigand S. D., Lesnick T. G., Pankratz V. S., Donohue M. C., Trojanowski J. Q., Tracking pathophysiological processes in Alzheimer’s disease: An updated hypothetical model of dynamic biomarkers. Lancet Neurol. 12, 207–216 (2013). [DOI] [PMC free article] [PubMed] [Google Scholar]
- 38.Blennow K., Hampel H., CSF markers for incipient Alzheimer’s disease. Lancet Neurol. 2, 605–613 (2003). [DOI] [PubMed] [Google Scholar]
- 39.Mattsson N., Insel P. S., Donohue M., Jögi J., Ossenkoppele R., Olsson T., Schöll M., Smith R., Hansson O., Predicting diagnosis and cognition with 18F-AV-1451 tau PET and structural MRI in Alzheimer’s disease. Alzheimers Dement. 15, 570–580 (2019). [DOI] [PubMed] [Google Scholar]
- 40.Janelidze S., Hertze J., Zetterberg H., Landqvist Waldö M., Santillo A., Blennow K., Hansson O., Cerebrospinal fluid neurogranin and YKL-40 as biomarkers of Alzheimer’s disease. Ann. Clin. Transl. Neurol. 3, 12–20 (2016). [DOI] [PMC free article] [PubMed] [Google Scholar]
- 41.Hansson O., Seibyl J., Stomrud E., Zetterberg H., Trojanowski J. Q., Bittner T., Lifke V., Corradini V., Eichenlaub U., Batrla R., Buck K., Zink K., Rabe C., Blennow K., Shaw L. M.; Swedish BioFINDER study group; Alzheimer’s Disease Neuroimaging Initiative , CSF biomarkers of Alzheimer’s disease concord with amyloid-β PET and predict clinical progression: A study of fully automated immunoassays in BioFINDER and ADNI cohorts. Alzheimers Dement. 14, 1470–1481 (2018). [DOI] [PMC free article] [PubMed] [Google Scholar]
- 42.Janelidze S., Zetterberg H., Mattsson N., Palmqvist S., Vanderstichele H., Lindberg O., van Westen D., Stomrud E., Minthon L., Blennow K.; Swedish BioFINDER study group, Hansson O., CSF Aβ42/Aβ40 and Aβ42/Aβ38 ratios: Better diagnostic markers of Alzheimer disease. Ann. Clin. Transl. Neurol. 3, 154–165 (2016). [DOI] [PMC free article] [PubMed] [Google Scholar]
- 43.Mattsson N., Insel P. S., Palmqvist S., Stomrud E., van Westen D., Minthon L., Zetterberg H., Blennow K., Hansson O., Increased amyloidogenic APP processing in APOE ɛ4-negative individuals with cerebral β-amyloidosis. Nat. Commun. 7, 10918 (2016). [DOI] [PMC free article] [PubMed] [Google Scholar]
- 44.Cho H., Choi J. Y., Hwang M. S., Kim Y. J., Lee H. M., Lee H. S., Lee J. H., Ryu Y. H., Lee M. S., Lyoo C. H., In vivo cortical spreading pattern of tau and amyloid in the Alzheimer disease spectrum. Ann. Neurol. 80, 247–258 (2016). [DOI] [PubMed] [Google Scholar]
- 45.Rousset O. G., Ma Y., Evans A. C., Correction for partial volume effects in PET: Principle and validation. J. Nucl. Med. 39, 904–911 (1998). [PubMed] [Google Scholar]
- 46.Mattsson N., Smith R., Strandberg O., Palmqvist S., Schöll M., Insel P. S., Hägerström D., Ohlsson T., Zetterberg H., Blennow K., Jögi J., Hansson O., Comparing 18F-AV-1451 with CSF t-tau and p-tau for diagnosis of Alzheimer disease. Neurology 90, e388–e395 (2018). [DOI] [PMC free article] [PubMed] [Google Scholar]
- 47.Liu L., Duff K., A technique for serial collection of cerebrospinal fluid from the cisterna magna in mouse. J. Vis. Exp. 2008, 960 (2008). [DOI] [PMC free article] [PubMed] [Google Scholar]
Associated Data
This section collects any data citations, data availability statements, or supplementary materials included in this article.
Supplementary Materials
Supplementary material for this article is available at http://advances.sciencemag.org/cgi/content/full/6/16/eaaz2387/DC1