Abstract
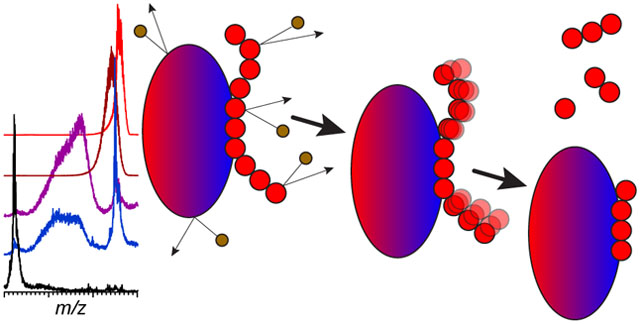
Identifying structural elements within heparin (as well as other glycosaminoglycan) chains that enable their interaction with a specific client protein remains a challenging task due to the high degree of both intra- and inter-chain heterogeneity exhibited by this polysaccharide. The new experimental approach explored in this work is based on the assumption that the heparin chain segments bound to the protein surface will be less prone to collision-induced dissociation (CID) in the gas phase compared to the chain regions that are not involved in binding. Facile removal of the unbound chain segments from the protein/heparin complex should allow the length and the number of sulfate groups within the protein-binding segment of the heparin chain to be determined by measuring the mass of the truncated heparin chain that remains bound to the protein. Conformational integrity of the heparin-binding interface on the protein surface in the course of CID is ensured by monitoring the evolution of collisional cross-section (CCS) of the protein/heparin complexes as a function of collisional energy. A dramatic increase in CCS signals the occurrence of large-scale conformational changes within the protein and identifies the energy threshold, beyond which relevant information on the protein-binding segments of heparin chains is unlikely to be obtained. Testing this approach using a 1:1 complex formed by a recombinant form of an acidic fibroblast growth factor (FGF-1) and a synthetic pentasaccharide GlcNS,6S-GlcA-GlcNS,3S,6S-IdoA2S-GlcNS,6S-Me as a model system indicated that a tri-saccharide fragment is the minimal-length FGF-binding segment. Extension of this approach to a decameric heparin chain (dp10) allowed meaningful binding data to be obtained for a 1:1 protein/dp10 complex, while the ions representing the higher stoichiometry complex (2:1) underwent dissociation via asymmetric charge partitioning without generating truncated heparin chains that remain bound to the protein.
Graphical Abstract
Introduction
Heparin is a highly sulfated linear polysaccharide (structure 1 in Scheme 1) that belongs to the glycosaminoglycan (GAG) family, and is arguably one of the most versatile biopolymers, capable of interacting with an astonishing number of proteins.1 While it is best known for its ability to control the blood coagulation cascade (the only area where it is used as a drug2–4), heparin’s well-documented affinity towards a range of other clinically relevant proteins implies a much broader spectrum of potential use in medicine.5–9 For example, heparin and heparin-like GAGs bind growth factors (GFs), proteins that trigger cell proliferation and differentiation via association with their receptors (GF receptors, GFRs) on the cell surface.10 In fact, the GF/GFR dependent signaling is facilitated by the involvement of heparan sulfates, a heparin-like GAG molecules that are ubiquitous in the extracellular matrix.11 This has stimulated significant interest in using heparin and related GAGs to build smart delivery systems for applications in regenerative medicine and tissue engineering.12 However, rational and effective use of heparin in medicinal nanomaterials requires that the mechanism of its interaction with the relevant proteins be understood at the molecular level, a task that cannot be accomplished without identifying elements in heparin chains that allow them to recognize and associate with a specific client protein. In particular, the so-called sulfation code13–15 (distribution of O- and N-substituted sulfate groups across the polysaccharide chain) appears to be an important determinant of the heparin/protein interactions.
Scheme 1.
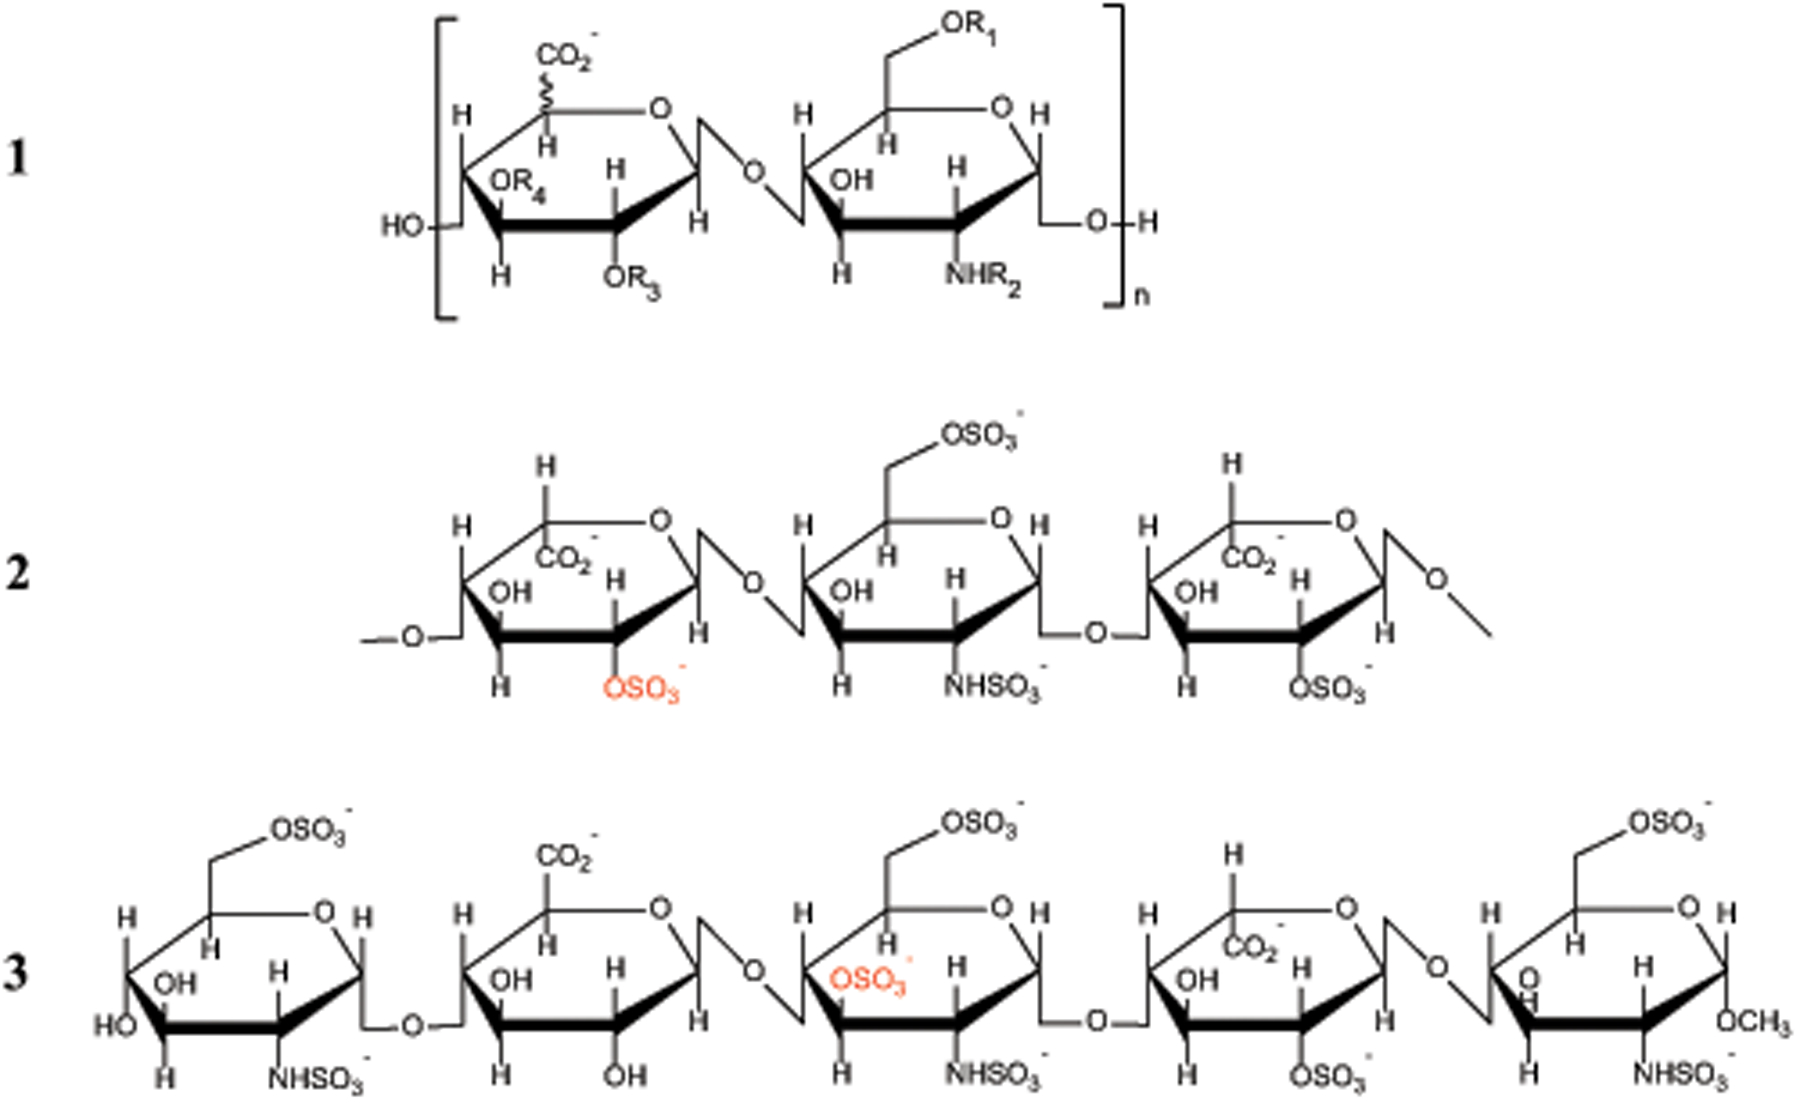
Chemical structures of the repeat units of heparin (1); the FGF-1 binding trisaccharide of heparin (2) and the synthetic antithrombotic fondaparinux (3). The typical substitution patterns in 1 are as follows: R1, R3 = H or SO3‾; R2 = H, C(O)CH3 or SO3‾; and R4 = H (common) or SO3‾ (rare).
A common approach to identifying the protein recognition elements within heparin chains seeks to select high affinity binders from libraries of short oligosaccharides produced by either enzymatic or chemical degradation (depolymerization) of intact heparin. The affinity analysis is usually preceded by fractionation of the polysaccharide chains by size to produce fixed-length oligomers. Fractionation of such relatively short fixed-length oligoheparins with respect to their affinity towards a specific protein (which is typically used as an immobilized bait in the affinity column) yields subsets of oligosaccharides with substantially reduced heterogeneity. Structural analysis of these high-affinity fractions allows critical features of heparin enabling its association with the target protein to be identified.16 This strategy had led to several successes, most notably in identifying the heparin segment with a high affinity to antithrombin,17 eventually leading to design and introduction to medical practice of a short (pentasaccharide) synthetic analog with high anti-thrombotic activity.18 Similar approaches were used to identify binders to various GFs, and especially fibroblast GFs (FGFs), where the oligosaccharide libraries were constructed using heparin depolymerization followed by enzymatic treatment to diversify the sulfation patterns of oligoheparins.19–21
An orthogonal approach to mapping FGF-binding segments within heparin (or its next-of-kin heparan sulfate) chains introduced by Linhardt and co-workers took advantage of the protective effect of the GAG-bound FGF when the former was enzymatically degraded (lysed).22, 23 The top-down “sizing” of the heparin fragments that were spared complete degradation down to the disaccharide level due to the protective effect of the bound protein revealed tetramers as the shortest survivors,22 while surviving octa- and deca-saccharides exhibited notably higher FGF affinity.23 When measured as a function of the oligoheparin length, FGF-1 affinity does appear to increase monotonically (dp4 << dp6 << dp8 < dp10 < dp12 ≈ dp14 ≈ dp16 ≈ dp18) for oligosaccharide sets derived from either heparin or heparan sulfate.24 At the same time, the presence of a specific trisaccharide motif IdoUA(2-OSO3)→GlcNSO3(6-OSO3)→IdoUA(2-OSO3) (structure 2 in Scheme 1) appears to be a requirement for high-affinity binding,21 explaining identification of tetramers as minimal-length FGF-1 binders.22 Identification of the unique trisaccharide sequence also inspired development of another, more refined approach to identifying short high-affinity protein recognition elements that used tools of synthetic chemistry to design a small tetrasaccharide library using the trisaccharide motif as a template.25
The initial applications of the top-down approach to detection and characterization of FGF-binding elements relied on relatively imprecise methods of polysaccharide identification, and could only provide information on the chain lengths for oligoheparins protected from enzymatic degradation. A recent reincarnation of this technique employed size exclusion chromatography with on-line detection by mass spectrometry (SEC/MS26) as a means of identification of heparin fragments that are protected from the lysis by the client protein (Niu, et al., submitted). The precision and accuracy offered by MS allow both the chain length and the level of sulfation/acetylation to be determined for each heparin oligomer. Thus, characterization of protein-binding elements within heparin chains is carried out in the gas phase, while the preceding step (removal of heparin segments outside of the protein-binding element) takes place in solution. In this work we explore the feasibility of an alternative top-down scheme, where both steps (fragmentation of the heparin chain outside of the protein-binding segment and characterization of the latter) take place in the gas phase. This new approach is based on the assumption that the glycosidic linkages connecting saccharide units outside of the protein-bound segment will fragment very readily upon collisional activation of the protein-heparin complex due to the labile nature of the glycosidic bonds.27 In addition, sulfate shedding28 is expected to occur for those groups that reside within the protein-bound segment, but are not directly involved in the binding (i.e., do not form salt bridges with the basic side chain groups on the protein surface).
If feasible, “outsourcing” GAG degradation to the gas phase may offer a significant advantage of either partial or complete elimination of the enzymatic fragmentation step in solution. In addition to streamlining the analytical protocol, this would also eliminate the issues related to heparanase specificity,29, 30 which inevitably introduces a bias into the oligoheparin lysis.31 Furthermore, lability of both unprotected sulfate groups and glycosidic bonds in the gas phase should allow one to use collisional activation as a universal substitute for both heparanases (chain depolymerization) and sulfatases32 (de-sulfation). At the same time, several potential pitfalls must be addressed, most important of which is a possibility for the protein to lose its near-native structure in the gas phase as a result of collisional activation (the so-called “collision-induced unfolding” or CIU33). Occurrence of extensive CIU in the gas phase is likely to compromise the higher-order protein structure at or near the heparin-binding interface with concomitant alteration of the protein/GAG association and (possibly) complete dissociation of the complex. Amster and co-workers have recently shown that oligoheparin binding to FGF-1 increases the CIU threshold;34 however, it remains to be seen if this increase is sufficient to achieve effective cleavage of unbound segments of the heparin chain without causing catastrophic loss of the protein structure.
In this work we use complexes formed by FGF-1 and relatively short heparin oligosaccharides as model systems to assess the suitability of collisional activation as a means of identifying the protein-binding segments within the GAG chains. We demonstrate that collisional activation is very effective in removing sulfate groups that are not involved in protein binding (sulfate shedding), and that extensive cleavage if unprotected glycosidic bonds can be achieved prior to the onset of catastrophic CIU in 1:1 protein/GAG complexes. However, collisional activation of complexes with higher stoichiometry (FGF-1 dimer assembled on a single oligoheparin chain) leads to the complex dissociation proceeding via asymmetric charge partitioning and preventing reliable mapping of the protein-bound segments within the GAG chains.
Experimental
Materials.
The synthetic heparin-mimetic pentasaccharide (fondaparinux) was a generous gift from Prof. Robert Linhardt (Rensselaer Polytechnic Institute, Troy, NY). Heparin decamer produced by enzymatic depolymerization of intact heparin (dp10) was purchased from Iduron (Cheshire, UK). The PEG-stabilized recombinant form of acidic fibroblast growth factor (FGF-1) that was used in the majority of experimental work (exceptions are noted below) was a generous gift of Prof. Robert Linhardt (Rensselaer Polytechnic Institute, Troy, NY). Following the failure to remove the low molecular weight PEG-based stabilizers from the protein solution via ultrafiltration using the lowest available cutoff filters, a chromatography-based procedure was developed to prepare samples of FGF/heparin oligomer complexes for native MS analysis. Heparin decamer (dp10) was added to the original protein solution (containing PBS and glycerol) in 10-fold molar excess. The mixture was immediately run through a size exclusion column using 100 mM ammonium acetate at pH 7 as the mobile phase. All unbound FGF and bound FGF/heparin dp10 species were eluted in a single fraction. Pooling several such fractions from multiple LC runs was followed by ultrafiltration with a 5 kDa cutoff filters (Millipore, Burlington, MA) to increase the protein concentration. It is noteworthy that absent heparin oligomer, FGF alone failed to pass through the SEC column, most likely due to strong electrostatic interactions with the silica-based beads, while the addition of dp10 prior to injection prevented the protein loss. The FGF/pentasaccharide complex was prepared by adding fondaparinux to the SEC-purified FGF/dp10 mixtures at at least 10-fold molar excess. A PEG-free form of FGF-1 (GenScript, Piscataway, NJ) was used for generating CIU fingerprints of apoFGF and FGF/pentasaccharide complex. All other chemicals and solvents used in this work were of analytical grade or higher.
Methods.
Mass spectra of FGF/heparin oligomer solutions (5 μM in 100 mM ammonium acetate, pH 7) were acquired with a Synapt G2Si (Waters, Milford, MA) hybrid quadrupole/time-of-flight mass spectrometer equipped with a travelling wave ion mobility analyzer and a nanospray ion source. Capillary voltage was set to 1.2 V, and the sampling cone voltage was maintained at 20 V. The source temperature was set to 30 °C for all measurements. Gas-phase dissociation of the FGF/heparin oligomer complexes was carried out by selecting the ions of interest in the quadrupole region followed by their collisional activation (using argon as the target gas) prior to ion introduction to the mobility analyzer. The magnitude of collisional activation was controlled by increasing the collisional voltage stepwise from 0 V to a maximum of 120 V with 10 V increments. Each spectrum was acquired for 2 to 5 minutes to ensure adequate signal-to-noise ratio. The acquired data were used to construct the CIU fingerprint graphs34 for each precursor ion and to monitor the mass loss within the protein-GAG complexes as a function of collisional energy and the CCS value of the surviving precursor ion. The CCS values were calculated based on the measured drift times (determined at the apex of each peak in the ion-mobility spectra). Conversion of the drift time to CCS values was carried out using a calibration curve constructed with a series of proteins (cytochrome c, β-lactoglobulin, bovine serum albumin and alcohol dehydrogenase) in their native states; the calibration procedure closely followed the commonly accepted protocol.35 Both charge states and masses of the protein ions were considered in order to eliminate the effect of electric field on the drift times before plotting them against corresponding CCS values
Results and Discussion
Sulfate shedding from the protein/short oligoheparin complex in the gas phase.
Evaluation of the effectiveness of sulfate group shedding was carried out using a 1:1 complex formed by FGF-1 and a synthetic pentasaccharide fondaparinux. The latter incorporates a trisaccharide element GlcA→GlcNS,3S,6S→IdoA2S, which bears significant resemblance to the specific trisaccharide motif IdoUA(2-OSO3)→GlcNSO3(6-OSO3)→IdoUA(2-OSO3) required by high-affinity binding to FGF-121 (compare structures 2 and 3 in Scheme 1). Therefore, one should expect a loss of up to five sulfate groups from the FGF-bound pentasaccharide in the gas phase should the protein/oligoheparin binding interface largely preserved in the gas phase (two sulfate groups from each of the terminal sugars and the 3-O sulfate from the GlcNS,3S,6S unit of fondaparinux). On the other hand, fission of the glycisidic bonds is expected to be relatively inefficient, as the FGF/oligoheparin contacts typically extend beyond the core (high-affinity) trisaccharide unit, involving a total of 4–5 saccharides (with 5–6 monosaccharide units being ordered in the crystal structure of the complex36).
Consistent with the previous studies,34, 37 native ESI MS of FGF-1 reveals monomeric state of this protein, while addition of the pentasaccharide to the solution gives rise to abundant 1:1 protein/heparin oligomer complex (Figure 1). The collisional cross section (CCS) value measured for the lowest charge state of the protein (+7) is 17.5 nm2. The protein/pentasaccharide complex at charge state +7 is represented in the mobility spectrum with a single peak at a drift time of ca. 6.46 msec, from which its CCS can be calculated as 18.0 nm2. This value is close to that of heparin-free FGF, suggesting that the entire pentasaccharide backbone is bound tightly to the protein surface, and no significant conformational changes occur within the protein as a result of this association.
Figure 1.
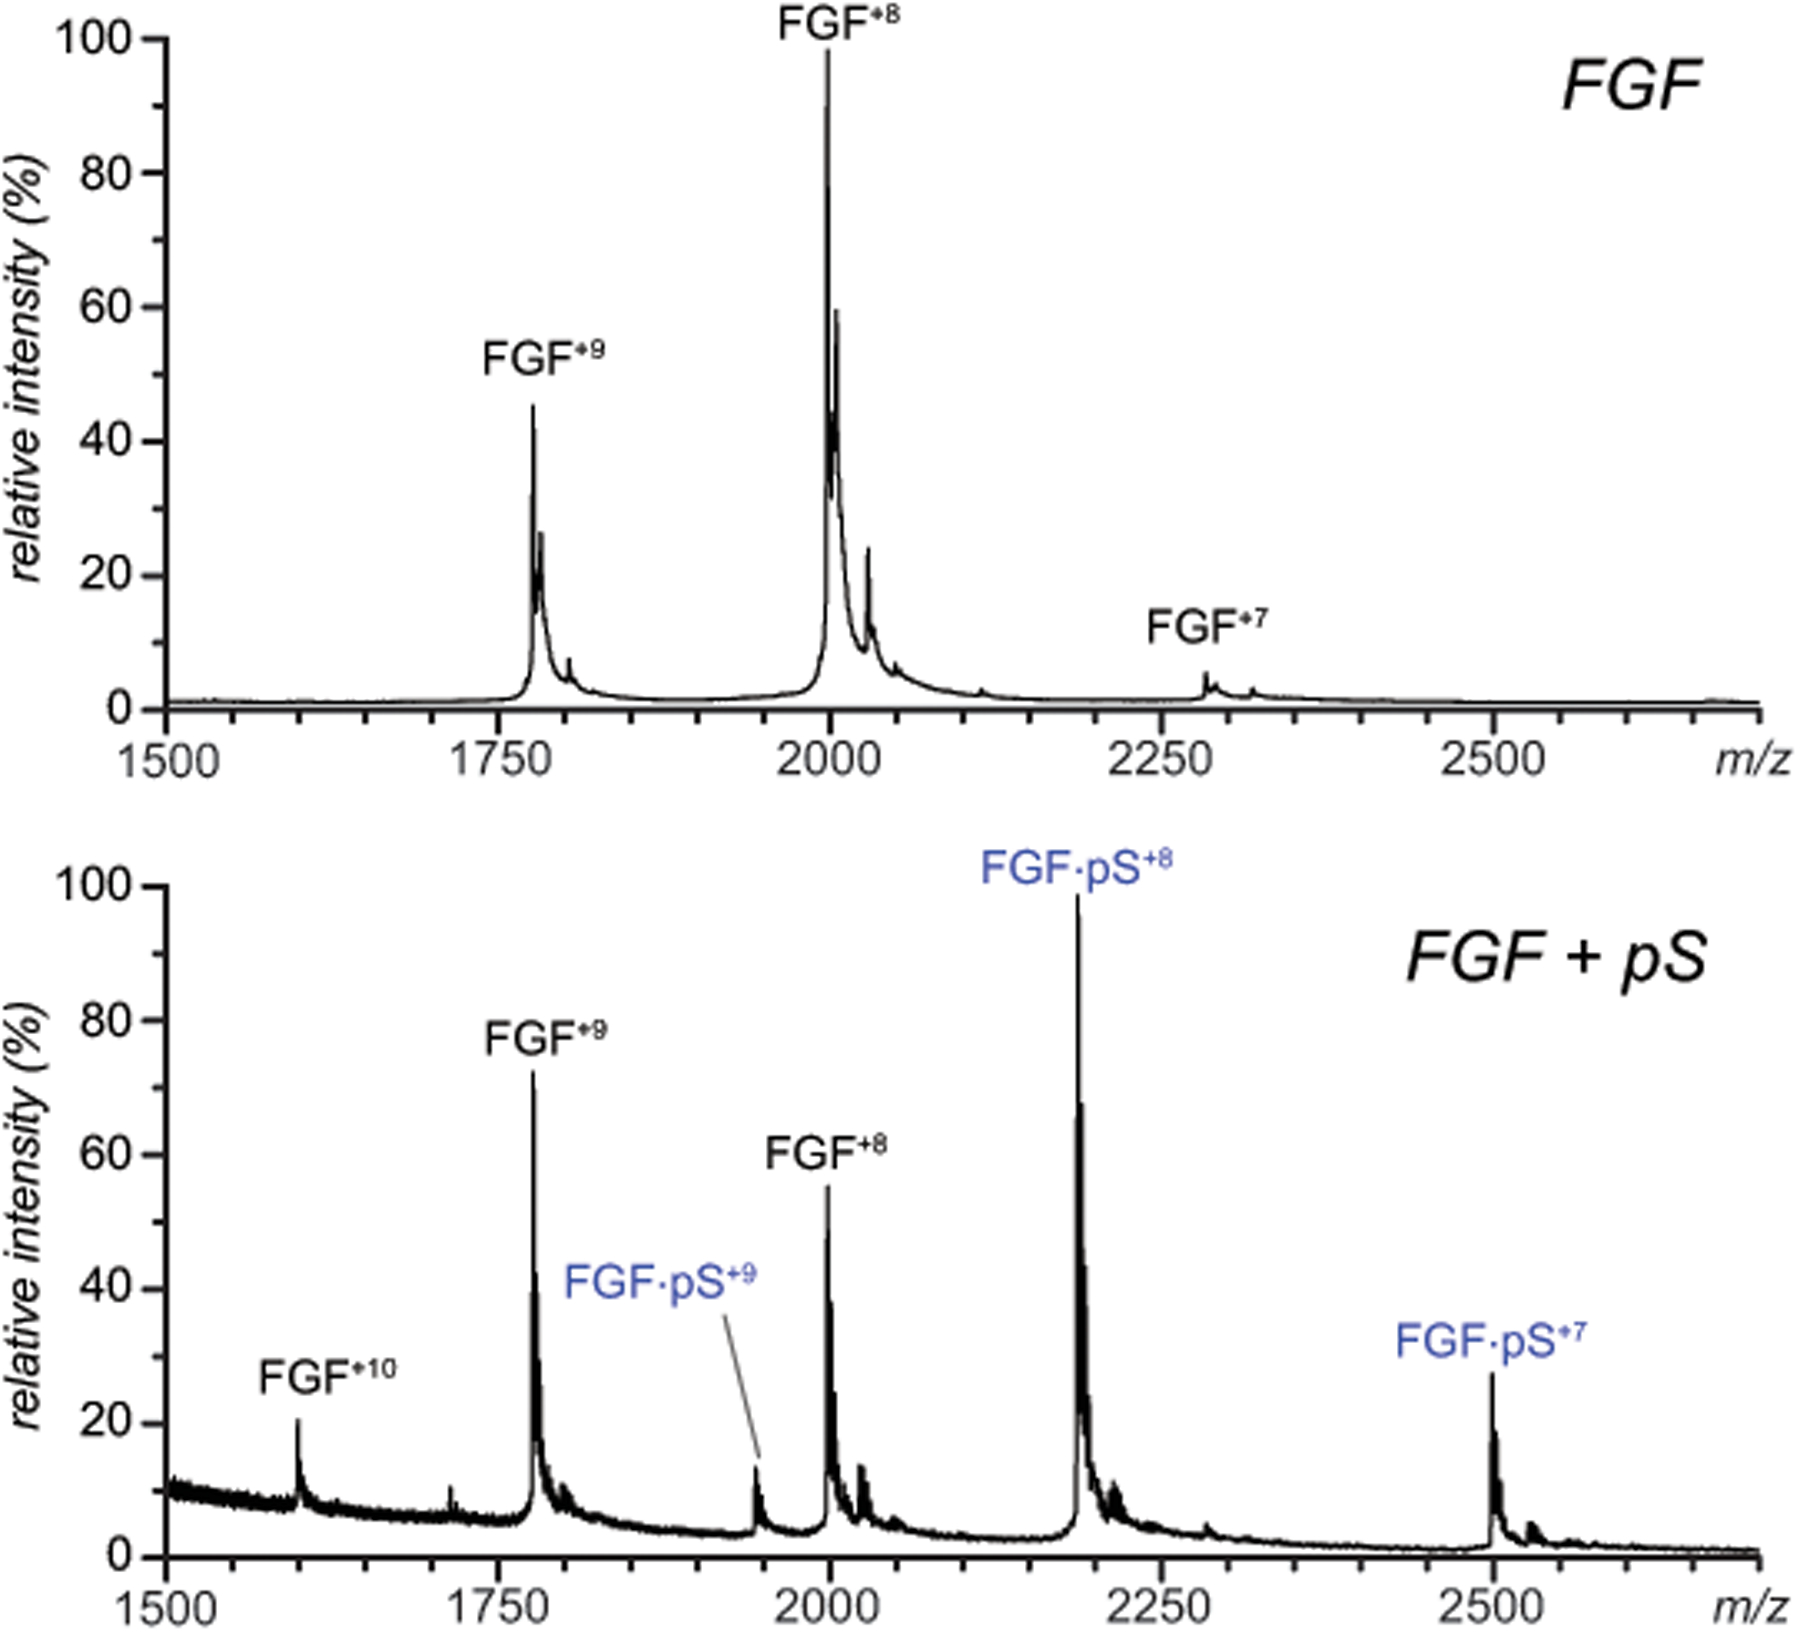
Native MS of a 5 μM solution of FGF-1 (100 mM ammonium acetate) obtained from heparin-free solution (blue trace) and in the presence of 50 μM synthetic pentasaccharide, fondaparinux (red). The synthetic pentasaccharide is annotated on the graph as pS.
Ion fragmentation becomes evident in the MS/MS spectrum of mass-selected FGF ions at charge state +7 in both heparin-free and pentasaccharide-bound forms at collisional activation as low as 70 V; however, there is a notable difference between the two sets of MS/MS data. While the precursor ion in the CID spectrum of the heparin-free FGF shows a gradual decrease of its relative abundance (due to formation of distinct fragment ions), the precursor ion in the CID spectrum of the FGF/pentasaccharide complex exhibits a gradual shift downward the m/z scale, followed by the appearance of an ion representing the heparin-free protein at the same charge state (Figure S2). A two-dimensional plot containing both drift times and m/z values allows both the fragmentation of the precursor ion and the conformational changes to be visualized simultaneously (Figure 2A). At low collision activation (4V) the precursor ions maintain a near-native conformation, with a CCS value of 18.0 nm2 (highlighted in green in Figure 2A and 2B). A sub-population of precursor ions with altered conformation (an increase in CCS from 18.0 to 20.5 nm2) does not become visible until the collisional voltage is elevated to 50 V (highlighted in blue in Figures 2A and 2B). More significant loss of conformational integrity (CCS increase to 25.9 nm2) is not evident in the mass spectra until the excitation potential is elevated to nearly 100 V (highlighted in red in Figures 2A and 2B). Importantly, the loss of conformational integrity within the FGF/pentasaccharide ions is closely mirrored by unfolding of the heparin-free protein in the gas phase, although the collisional energy thresholds for the latter are notably lower (see Figure S3 in the Supplementary Material section for more detail).
Figure 2.
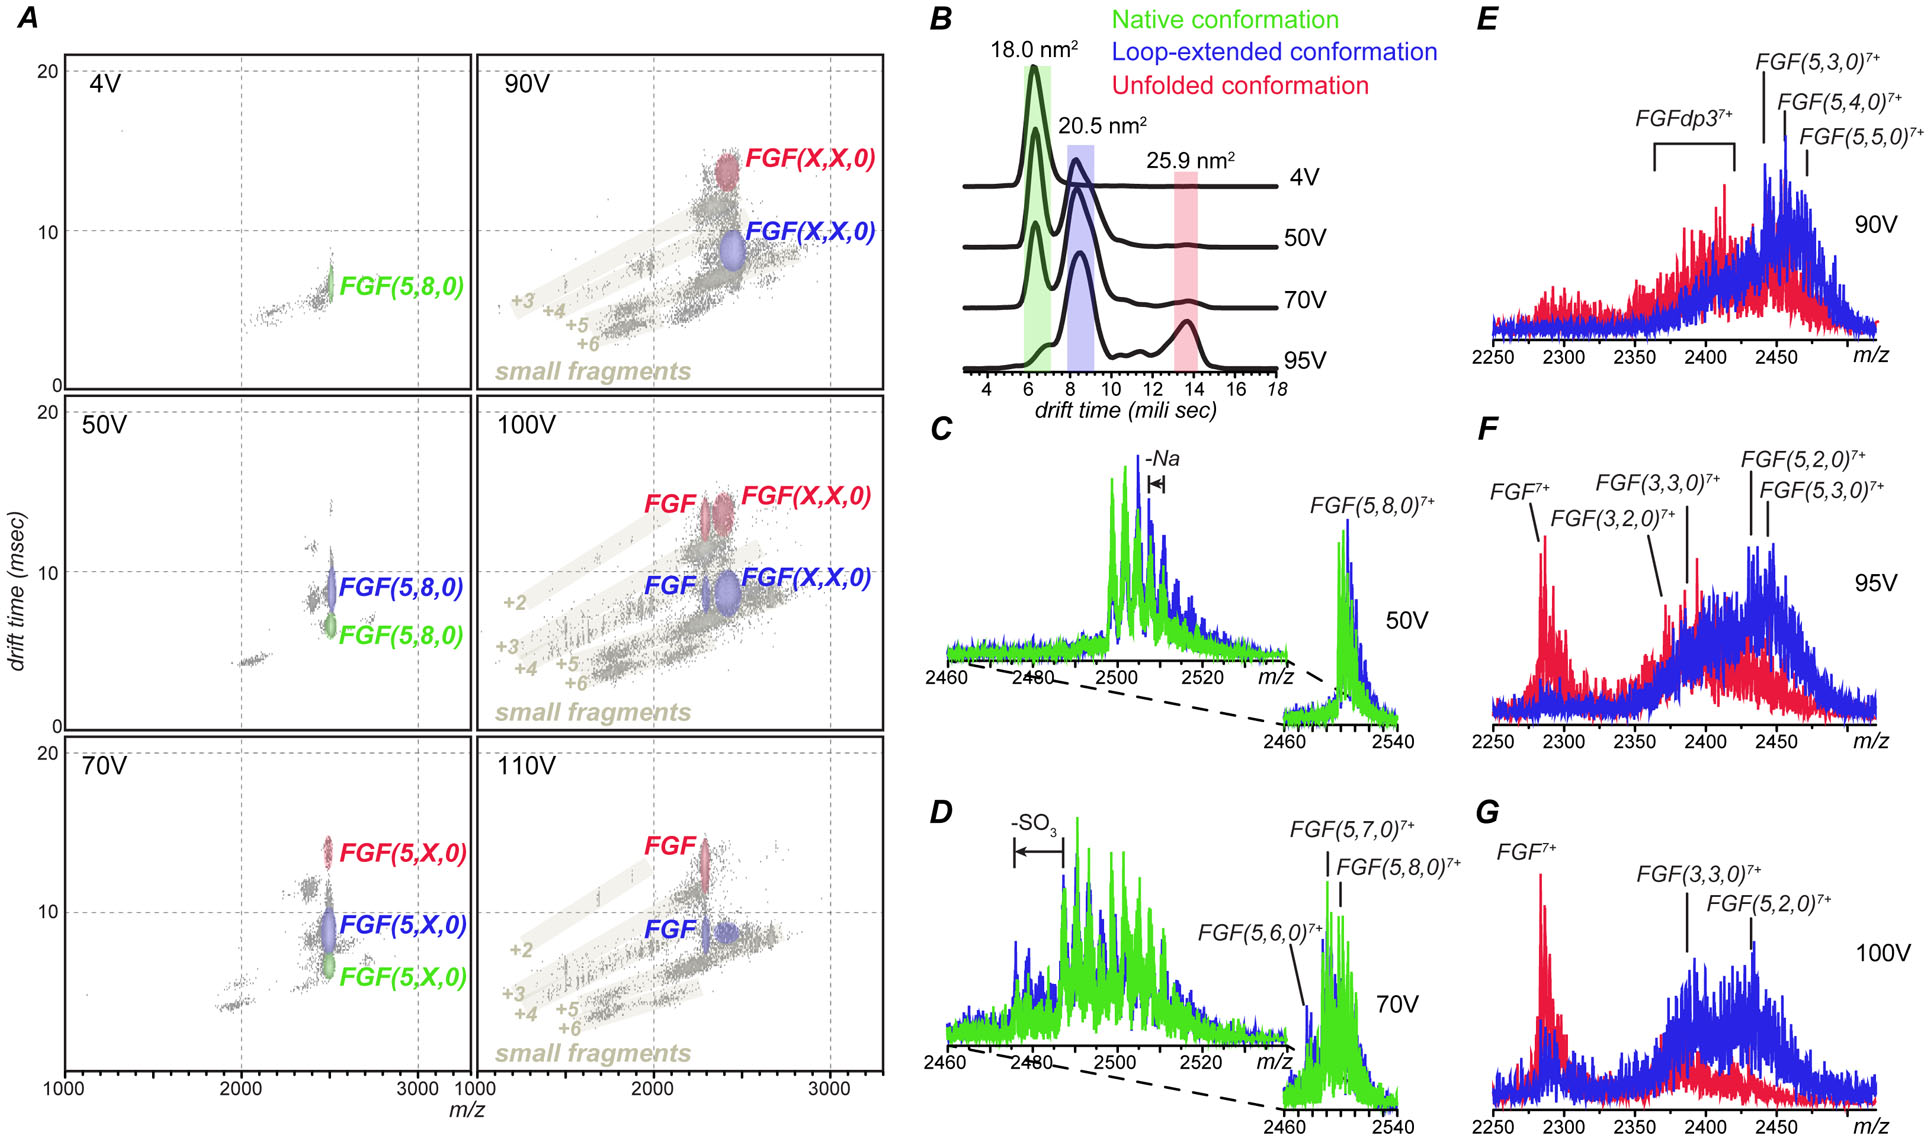
The effect of collisional energy on population of fragment ions derived from dissociation of FGF/pentasaccharide complexes (charge state +7) and their gas-phase mobility represented by (A) two-dimensional IMS-MS plots, (B) extracted CIU profile of the precursor ion and (C-G) conformer-specific fragment ion spectra where the fragment ions are derived from compact, near-native (green), partially unfolded (blue) and fully unfolded (red) precursor ions at different activation energies. The three numbers in parentheses are used to designate composition of GAG fragments (the number of saccharide monomers in the chain, the number of sulfate groups and the number of acetyl groups) following the commonly accepted convention.46
In addition to providing evidence of the protein conformation stabilization in the gas phase due to the heparin oligomer binding and identifying the range of collisional energies where fragmentation of the complex can be carried out without the catastrophic loss of the higher order structure, measuring the CCS values in the course of CID experiments allows various classes of fragment ions to be readily distinguished. For example, the fragment ions produced by dissociation of the heparin oligomer that still remains bound to the intact protein can be readily distinguished from fragments produced by fission of amide bonds within the protein (labeled in gray in Figure 2A) based on their mobility profiles even though their ionic signals overlap in the m/z space. This allows interference-free signal representing protein ions with partially degraded pentasaccharide ligand to be extracted from the MS/MS data sets in a conformer-specific fashion (Figure 2C–G).
Establishing the correlation between the precursor ion conformation and the observed mass losses in the CID mass spectra acquired at different collisional energies provides clear evidence that moderate sulfate shedding from the protein-bound pentasaccharide proceeds without any changes to the higher order structure of the precursor ion in the gas phase. Indeed, only the compact (near-native) and activated conformations of the FGF/pentasaccharide complex are populated in the gas phase at crapping voltages of 50 and 70 V, and a loss of three sulfate groups from the complex ion is observed, with the highest number of sulfates that can be eliminated from the complex under these conditions being five. Importantly, the drift time distributions of all these fragments mirror that of the precursor ion; and the green and blue traces in Figure 2C and D show the conformer-specific fragment ion spectra (for the compact and extended states, respectively). The number of sulfate groups that are retained preferentially under these relatively mild collisional activation conditions is five (see Figure 2D). The fragmentation pathways appear to be identical for these two conformers, indicating that the protein/GAG binding interface remains intact in the extended state of FGF, and the limited loss of the protein higher order structure (as reflected in the increased CCS value) occurs elsewhere, without having any detectable influence on the protein/heparin oligomer interaction.
Elevation of the collisional energy above 80V (560 eV if adjusted for the precursor ion charge) results in a complete elimination of the protein population with compact conformations; instead giving rise to conformations with a high degree of conformational disorder alongside the extended (partially folded) state. While the protein/pentasaccharide complex retaining three to five sulfate groups continues to generate the most abundant ionic signal for the fragment ions originating from the activate state of the ion, more extensive fragmentation is evident for ligands bound to the more extensively unfolded protein molecules (blue and red traces in Figure 2E). In fact, a complete loss of the pentasaccharide and/or its fragments from the complex is observed at collisional energy exceeding 95V (650 eV) (Figure 2F). Some complexes do survive even under these conditions, but the extent of ligand fragmentation goes beyond sulfate shedding: the apparent dissociation of glycosidic bonds results in removal of two saccharide units from the heparin oligomer which still remains bound to the protein. The dissociation is nearly complete at 100V (700 eV), with the most abundant fragments derived from the FGF/pentasaccharide ions with a high degree of structural disorder representing a ligand-free protein (Figure 2G). Remarkably, even under these conditions the pentameric structure remains bound to the protein in a significant fraction of fragment ions derived from the partially folded precursor, although glycosidic bond cleavages become evident as well (blue trace in Figure 2F). These results are consistent with the notion of the protein/GAG binding interface remaining intact within the extended state of the protein, allowing gas phase fragmentation to be employed for identifying the protein-binding segments of heparin chains even under conditions when collisional activation results in partial (limited) loss of the protein higher order structure in the gas phase.
Protein ions at higher charge states have notably lower CIU energy thresholds (see Figure S3 in the Supporting Information section), and the corresponding average CCS values are slightly higher (e.g., compare 18.3 ± 0.1 nm2, 20.2 ± 0.1 nm2 and 23.6 ± 0.1 nm2 measured for FGF ions at charge state +8 with 17.5 ± 0.1 nm2, 19.6 ± 0.1 nm2 and 22.6 ± 0.1 nm2 for +7. Average CCS values and uncertainty were generated based on multiple measurements at different collisional energies). The partially unfolded state of the FGF+8 ion can be detected alongside the compact conformation even at the lowest collisional energy (a feature not exhibited by FGF+7 ions until the value of collisional energy exceeded 100 eV (adjusted for the protein ion charge). The lower conformational stability of FGF+8 ions is also reflected by the observation that complete unfolding of the protein ions in the gas phase is evident at collision energy as low as 100 eV. Lower stability of FGF ions at higher charge states was the reason the top-down characterization of the protein/heparin oligomer interaction was carried out with ions at the +7 charge state, despite their having lower fragmentation efficiency compared to ions at the +8 charge state.
Mass evolution of ions representing various gas-phase conformations of the protein/pentasaccharide complexes is shown in Figure 3. The gradual mass loss due to the sulfate shedding from the partially unfolded conformation of the complex levels off after losing six (out of eight) sulfate groups, leaving only two of them intact. Intriguingly, the same number of sulfate groups remain following the truncation of the heparin chain down to a trisaccharide level. It might be tempting to speculate that the trisaccharide segment that remains bound to the protein when high collisional energy is applied is produced by removing the monosaccharide units from the reducing and non-reducing ends of fondaparinux, leaving the residue resembling the FGF-binding trisaccharide (Scheme 1). However, a more definitive conclusion vis-à-vis the feasibility of using the heparin chain truncation in the gas phase as a means of identifying the protein-binding GAG segments can only be drawn by using polysaccharide chains whose length significantly exceeds that of the “minimal binders.”
Figure 3.
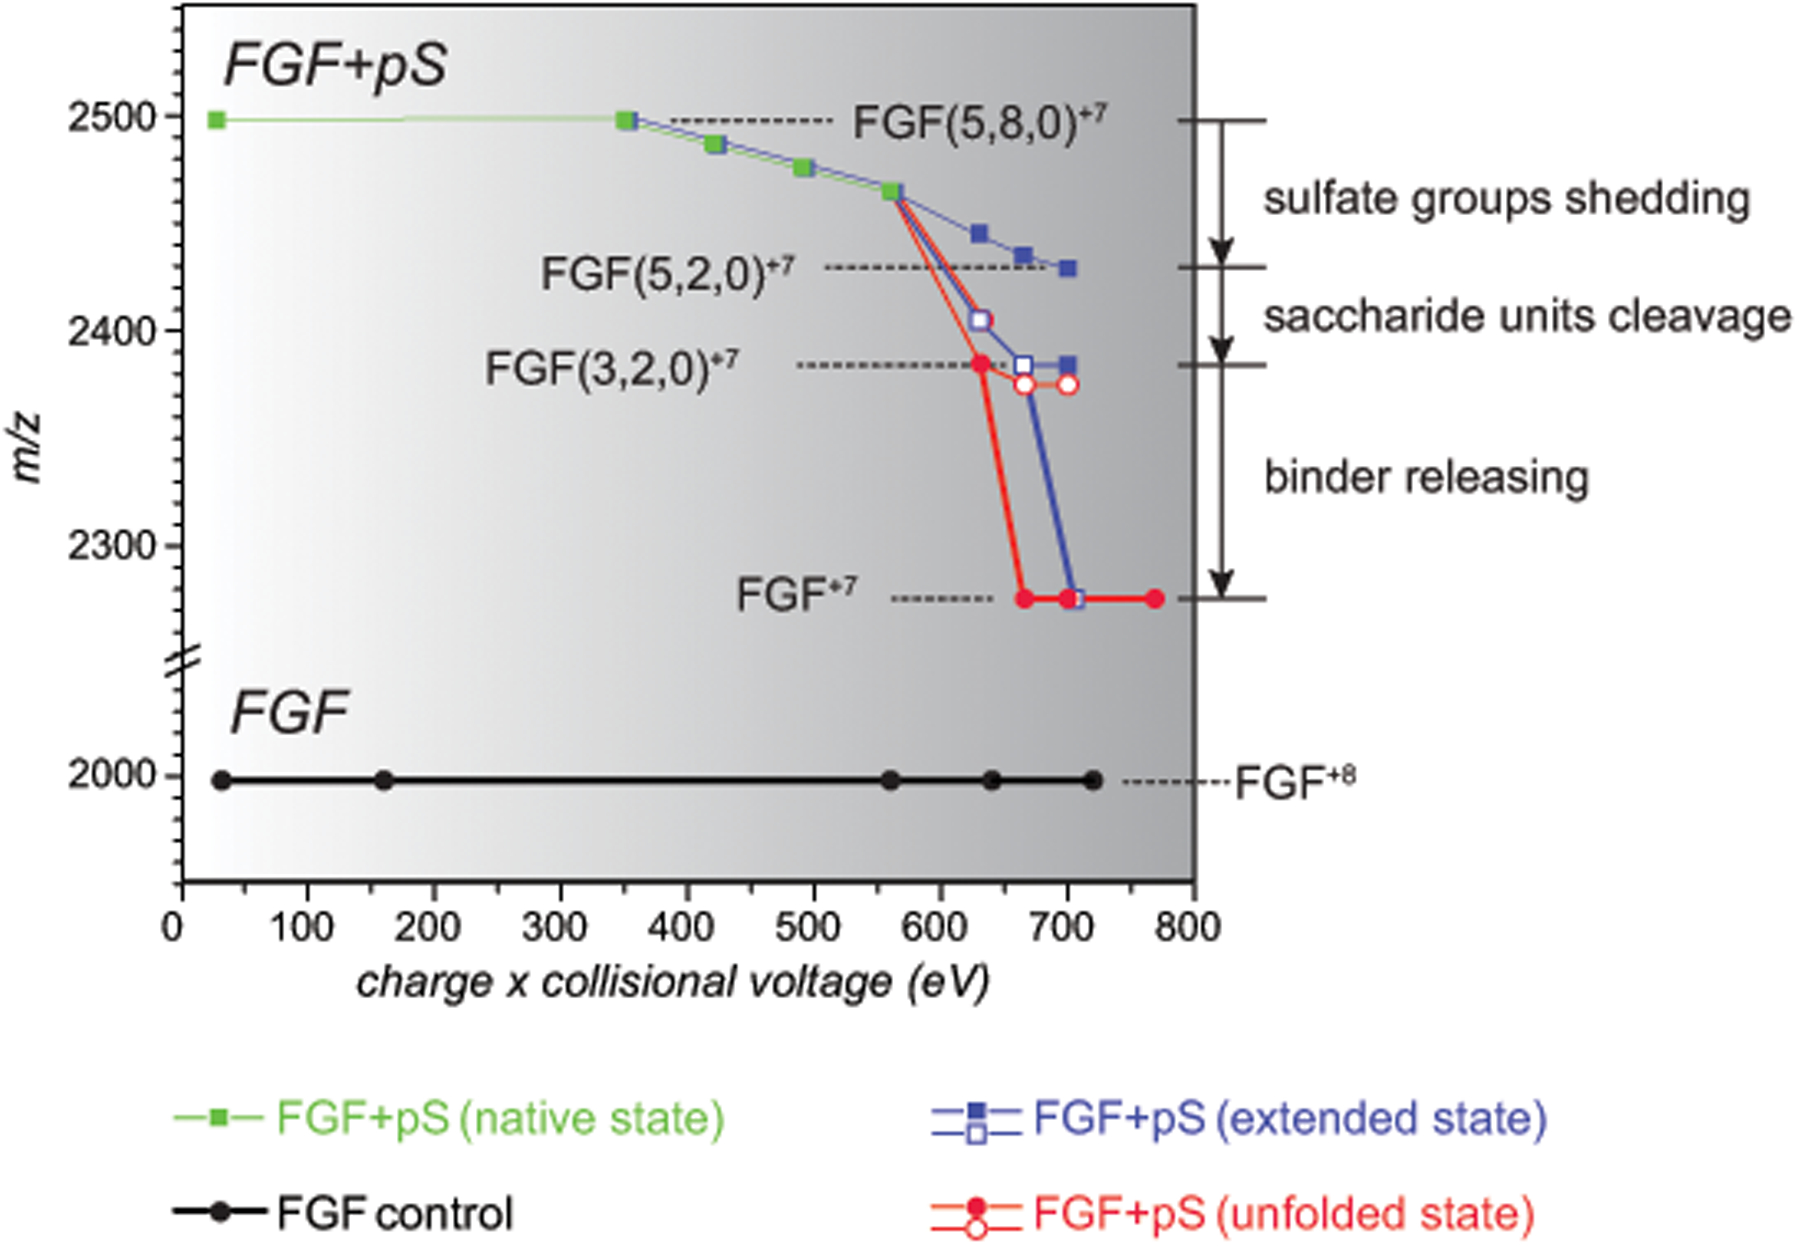
Mass evolution of FGF·pS complexes as a function of collisional energy plotted for three different precursor conformations: native (green), partially unfolded (blue) and fully unfolded (red). The boldness of line indicates the category of mass change: sulfate shedding (thin), saccharide unit(s) removal (normal) and complete ligand release (bold). Only the lowest-m/z edge of the ionic distributions is represented on plot. The shaded squares/circles represent the dominant features in the mass spectra (relative abundance ≥ 45%); the minor features are represented with the open squares/circles.
Polysaccharide chain truncation within the protein/oligoheparin complex in the gas phase.
Oligosaccharide chain length is one of the determinants of the FGF/heparin binding strength. While this dependence is monotonic, the affinity gains become incremental upon the chain reaching the level of an octamer24 (the high-affinity binding core segment had been recognized as a trimer,21 and the minimal-length binders produced by heparin depolymerization are tetramers24). Therefore, we used decameric heparin oligomers (dp10) to test the feasibility of chain truncation in the gas phase as a means of identifying minimal-length protein binders. Incubation of FGF with dp10 exhibiting diverse sulfation patterns gave rise to protein/heparin complexes of both 1:1 and 2:1 stoichiometries as has been reported previously.37 However, the relatively broad mass distribution of the dp10 molecules (see Figure S1 in the Supplementary Material section) results in extensive peak overlaps, making the peak assignment a challenging task if based on m/z measurement alone (Figure 4A). Complementing MS analysis with ion mobility measurements enables more confident identification of ionic species in the mass spectra (Figure 4B), but significant overlaps still remain, e.g. at m/z 2700, where signals of two different ionic species partially overlap: 1:1 FGF/dp10 complex (charge state +7), and 2:1 FGF/dp10 complex (charge state +13).
Figure 4.
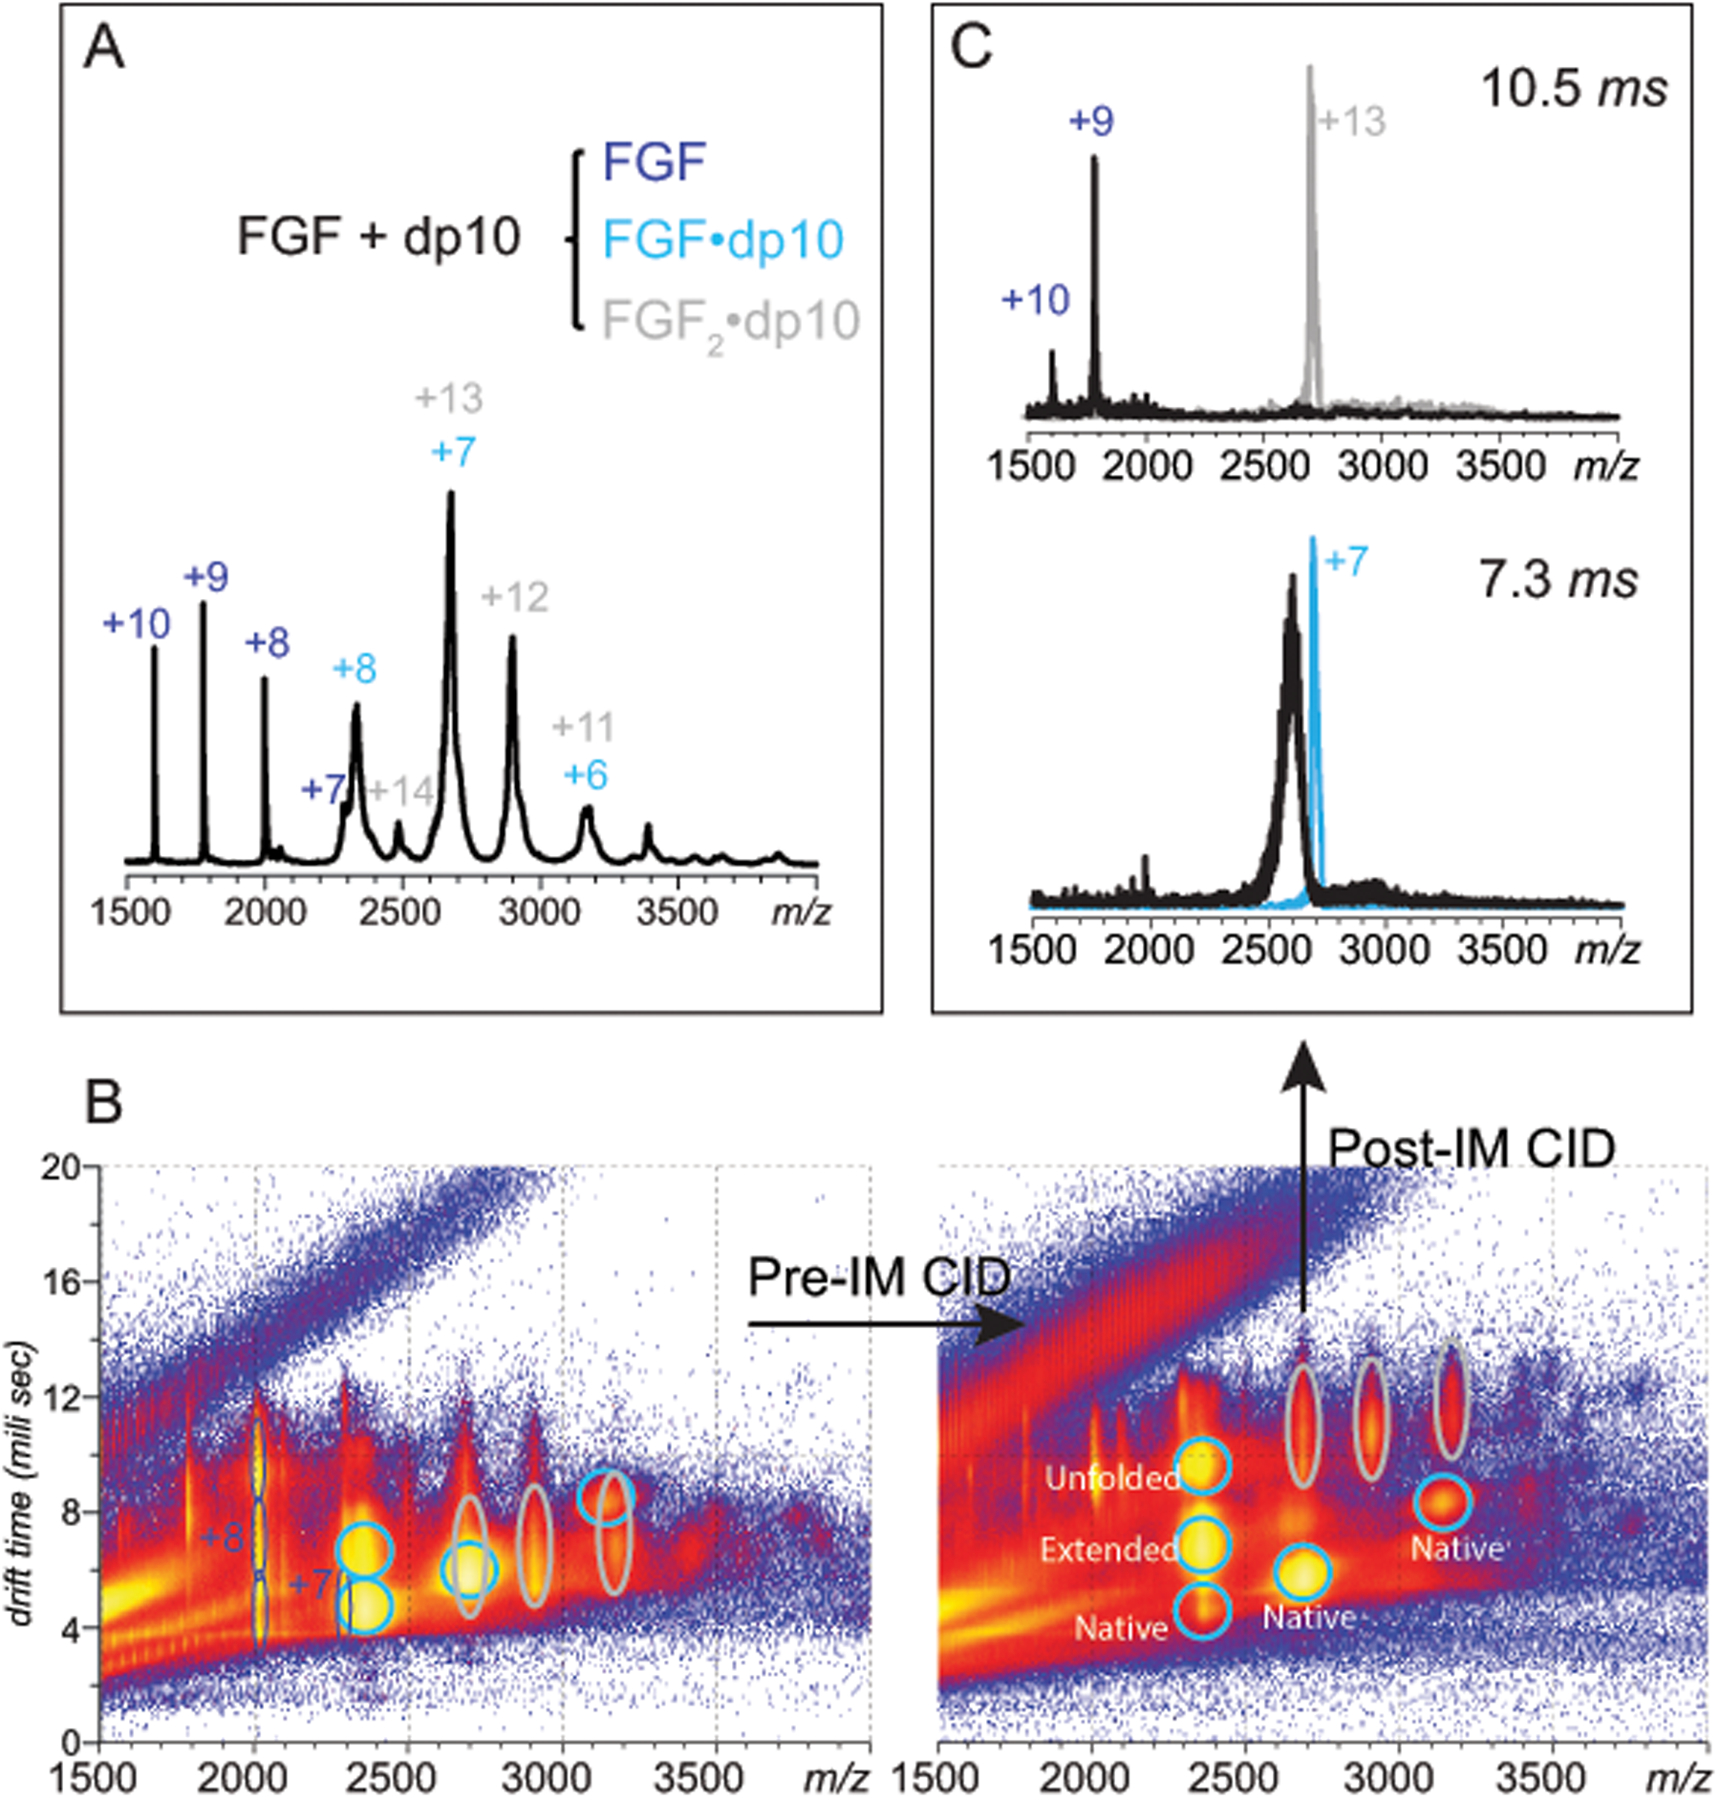
Native MS/IMS characterization of SEC-purified FGF/dp10 complexes. A: a mass spectrum of the FGF/dp10 in 100 mM ammonium acetate; the charge states are labeled for the heparin-free protein (blue), as well as for 1:1 (cyan) and 2:1 (gray) FGF/dp10 complexes. B (left panel): a two-dimensional IMS/MS plot of for the mass spectrum shown in (A) showing significant overlap of ions representing FGF/dp10 complexes with different stoichiometries (cyan and gray ovals) in both m/z and drift time domains (left). B (right panel): modest pre-IM collisional activation (10 V) allows the ions representing the two different FGF/dp10 complexes to be completely separated. C: the pre-IM separated complexes can be activated independently post-IM, giving rise to distinct fragmentation patterns at collisional activation of 80 V.
Separation of ionic species with overlapping m/z distributions can be significantly enhanced by moderate collisional excitation of the entire ionic population due to the unique CIU behavior exhibited by each species. For example, relatively mild collisional activation (collisional voltage 50 V) of the entire ionic ensemble prior to ion mobility measurements results in separation of the ionic population at m/z 2700 into several distinct components, making it possible to group ions with different charge states representing the same solution-phase species (Figure 4C). It appears that this differential effect of protein ion activation on different ionic species is correlated with the extent of multiple charging of various ions within the unresolved ionic population (e.g., FGF·dp10 and FGF2dp10 complexes at charge states +7 and +13, respectively). Since collisional energy is proportional to the ionic charge, the higher charge-state ions would be expected to have lower CIU thresholds, enough to separate them from ions with lower number of charges. Indeed, the higher drift-time subpopulation of ions at m/z 2700, which becomes resolved following mild collisional activation is now clearly aligned (i.e., shares the same diagonal) with FGF2dp10 at charge states +12 (m/z 2900) and +11 (m/z 3200), and can be readily assigned as FGF2dp10 (charge state +13). The lower drift-time subpopulation, on the other hand, is aligned with FGF·dp10 signals at charge states +8 (m/z 2400) and +6 (m/z 3150), and can be unambiguously assigned as a binary protein/heparin oligomer complex at a charge state +7 (Figure 4C).
Separation of the ionic signals of FGF·dp10 and FGF2dp10 complexes allows their behavior at higher collisional energies to be monitored independently and without any interferences. For example, application of a trap voltage of 80V to the FGF·dp10+7 ions isolated based on both m/z and drift time (Figure 4D) resulted in monotonically increasing mass losses from the precursor ion, consistent with truncation of parts of the dp10 chain (vide infra). A similar behavior was exhibited by the isolated FGF·dp10+8 ions subjected to further collisional activation. In contrast, collisional activation of the isolated FGF2dp10+13 ions do not proceed via incremental mass loss that would be indicative of the sulfate shedding or glycosidic bond cleavages within the segments of the GAG chain not involved in protein binding. Instead, the lowest-energy fragmentation channel in this case appeared to be dissociation of the non-covalent complex to its constituent parts proceeding via asymmetric charge partitioning38, 39 (Figure 4D).
Although the mechanism of the gas-phase fragmentation of a heparin oligomer-bridged FGF dimer rules out the use of CID as a means of mapping the protein-bound GAG segment(s), collisional activation can still be used to localize GAG segments involved in formation of binary FGF·dp10 complexes. Precursor ions at m/z 2350 and 2680 representing FGF·dp10+8 and FGF·dp10+7, respectively, were isolated for the MS/MS work (see Figure S4 in Supporting Information). While progressive mass decrease consistent with the truncation of the GAG chain is observed for both +7 and +8 charge states of the binary complex, FGF·dp10+7 has significantly higher CIU thresholds (Figure S5), and was therefore selected for mapping the protein-bound GAG segments. Figure 5 shows the evolution of the mass of the FGF·dp10+7 ion as a function of applied collisional voltage. The mass spectra are more crowded compared to the datasets for the FGF/pentasaccharide complex, reflecting significant structural heterogeneity of dp10 making definitive mass assignments difficult. Nevertheless, the number of saccharide units involved in protein binding can be deduced from the m/z ranges populated by the fragment ions produced by truncation of “unengaged” heparin segments off the FGF·dp10 complexes in the gas phase (see Figure 5B). As the collision energy is gradually increased from the initial 490 eV to 630 eV, the distribution of fragment ions shifts noticeably along the m/z scale (with the apex moving from m/z 2680 to 2540). This mass loss is consistent with extensive sulfate shedding and removal of no more than three monosaccharide units. Further increase of collisional energy (to 665 eV) gives rise to a heparin-free protein signal at charge state +6, while a significant proportion of proteins still retain heparin fragments. A significant decrease of the m/z values of these fragments indicates extensive cleavage of the glycosidic bonds through the polysaccharide chain, truncating the latter down to the tetrasaccharide segment (which remains bound to the protein).
Figure 5.
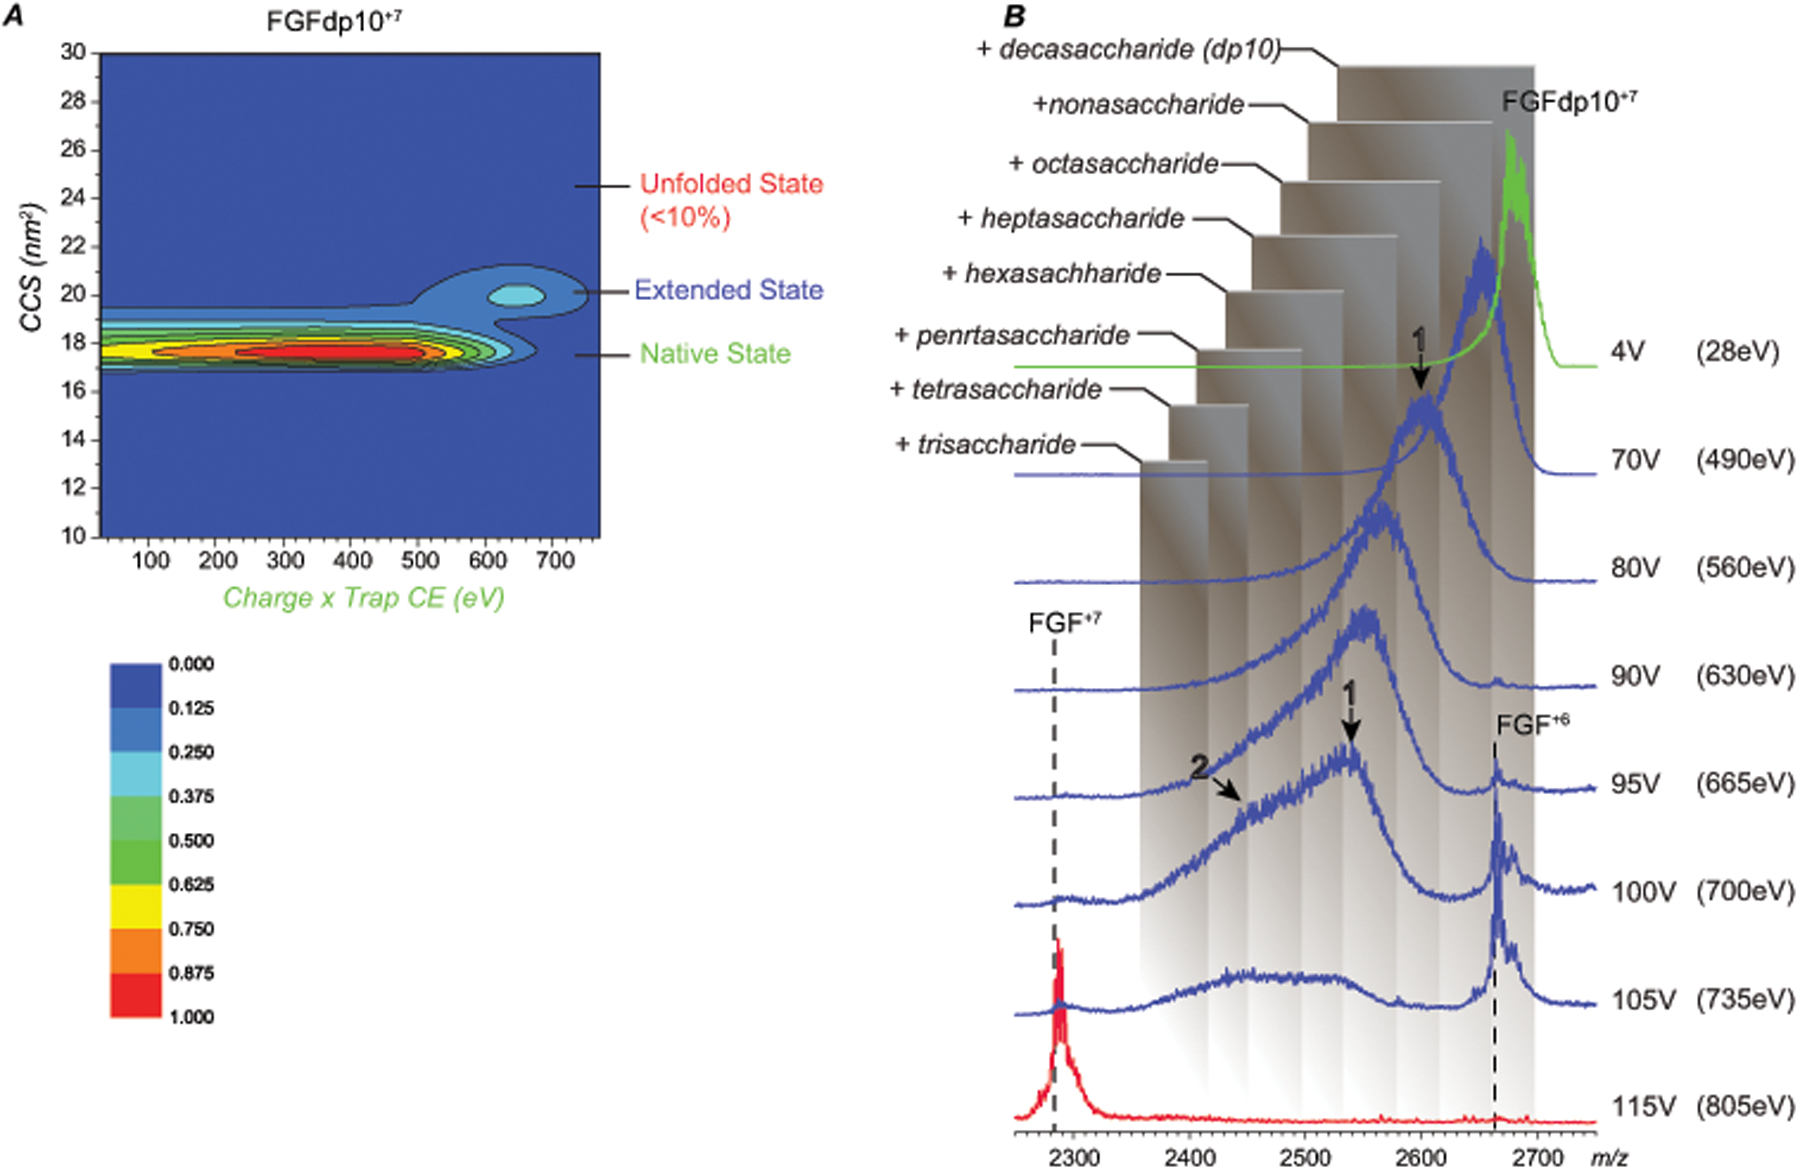
CCS (A) and m/z (B) evolution of ions representing the 1:1 FGF/dp10 complex (charge state +7) following collisional activation. The shaded boxes in panel B represent m/z ranges for FGF bound to truncated forms of the heparin oligomer of varying lengths.
Partial unfolding of the protein complex is not evident until the applied collisional voltage reaches 90 V, at which point the GAG chain remaining bound to the protein is reduced down to a tetrasaccharide (Figure 5). At this level of collisional activation a new peak is observed at m/z 2664, representing the GAG-free polypeptide (charge state +6). Importantly, the drift-time distribution of this charge-reduced product ion is consistent with a compact (native-like) protein without any signs of gas-phase unfolding. It remains to be seen if this dissociation product is formed by removing the GAG chain form the compactly folded protein or the latter simply refolds in the gas phase following reduction of the number of charges (via charge stripping by the departing GAG segment). Another GAG-free intact polypeptide (FGF+7) remains undetected until the collisional voltage is raised above 100 V (Figure 5); its CCS is nearly the same as that of the FGF bound to truncated heparin oligomers. The delayed appearance of the FGF+7 fragment (compared to FGF+6) is consistent with the dissociation channel proceeding through charge separation in the gas phase being energetically favorable compared to the charge-neutral separation (due to the electrostatic repulsion acting to diminish the transition energy barrier in the fragment separation process). As far as the size of the shortest surviving GAG fragments that remain bound to FGF at collisional voltage of 100 V and above, the masses are consistent with a range of lengths of truncated chains (with the low-mass limit corresponding to highly sulfated trisaccharides, which represent the shortest surviving fragments – see Figure 5). This is in agreement with the results obtained with the FGF/fondaparinux complex (vide supra), and consistent with the notion of a high-affinity FGF/heparin interaction being dependent on the presence of a trisaccharide motif within the GAG chains.21 The significant heterogeneity of the dp10 fragments remaining bound to the protein even at the threshold of the GAG/polypeptide complex dissociation (i.e., at 105 V) is not surprising, as the FGF/oligoheparin contacts are known to extend beyond the core trisaccharide unit, involving a total of 4–5 saccharides (with up to six monosaccharide units being ordered in the crystal structure of the complex36).
Conclusions
The potential of native mass spectrometry as a means of evaluating protein interactions with heparin and related GAGs has been recognized over a decade ago,40–42 although the majority of applications were limited until recently to identifying the binding partners and/or binding stoichiometry. The initial evaluation of a new top-down approach to mapping protein-binding segments within heparin chains presented in this work takes advantage of the lability of both sulfate groups and glycosidic bonds in the gas phase. Collisional activation of the protein/GAG complex results in effective shedding of sulfate groups and truncation of saccharide units that are not directly involved in protein binding prior to complete loss of the protein higher order structure in the gas phase and/or dissociation of the non-covalent complex. Intriguingly, the collisional activation process in CID is commonly assumed to proceed via rapid energy equilibration of the excitation energy across all vibrational degrees of freedom in the biomolecular ion. Such a scenario might be expected to result in fission of all glycosidic bonds with similar efficiency (regardless of whether they connect the saccharide units within the protein-bound segment of the GAG chain or not). The fact that the preferred dissociation channels favor removal of the saccharide segments outside of the protein-bound segment may indicate that the cleavage of a covalent bond within the protein-bound segment of the GAG chain may not be sufficient for the ligand departure, as long as it remains to be bound to the protein surface via non-covalent bonds. This scenario would be reminiscent of gas-phase dissociation of folded proteins, where physical separation of two fragments may require significant collisional heating to disrupt the network of non-covalent bonds in addition to fission of the covalent bond connecting the two segments.43
Dissociation of 1:1 complexes formed by FGF-1 with both structurally homogeneous pentasaccharide (fondaparinux) and heterogeneous heparin oligomers (dp10) proceeds via incremental mass losses, revealing trisaccharides as the minimal-length heparin fragments that remain bound to the protein. At the same time, noticeable heterogeneity of the surviving complexes even at the thresholds of protein unfolding/complex dissociation is consistent with the protein/GAG binding extending beyond the core trisaccharide segment. Selecting the precursor ions at low charge states for CID measurements allows the protein unfolding threshold to be noticeably increased, providing an opportunity for the heparin segments outside of the protein-binding core to be eliminated more completely. Reduction of the ionic charge (e.g., via limited charge reduction in the gas phase44, 45) prior to collisional activation of the complex may prove useful in this regard as a means of achieving complete removal of heparin chain segments not participating in protein binding. In a stark contrast to the gradual mass loss by collisionally activated binary complexes, dissociation of the ternary complexes (FGF2dp10) proceeds via loss of the non-covalent structure following the classical asymmetric charge partitioning mechanism without any evidence of heparin fragments remaining bound to the polypeptide chain. While this prevents identification of the protein-interacting heparin segments within such complexes, more work is needed in order to determine if this behavior is common to all heparin-bound multi-subunit proteins or unique to FGF-1 dimers assembled on relatively short heparin chains.
Supplementary Material
Acknowledgements
This work was supported by a grant R01 GM112666 from the National Institutes of Health and carried out at the Mass Spectrometry Core facility at UMass-Amherst. We are grateful to Prof. Robert J. Linhardt (Rensselaer Polytechnic Institute) for providing samples of synthetic heparin pentasaccharide (fondaparinux) and FGF-1.
References
- 1.Pomin VH and Mulloy B, Curr. Opin. Struct. Biol, 2015, 34, 17–25. [DOI] [PubMed] [Google Scholar]
- 2.Jin L, Abrahams JP, Skinner R, Petitou M, Pike RN and Carrell RW, Proceedings of the National Academy of Sciences of the United States of America, 1997, 94, 14683–14688. [DOI] [PMC free article] [PubMed] [Google Scholar]
- 3.Weitz JI, The New England journal of medicine, 1997, 337, 657–662.9280815 [Google Scholar]
- 4.McNeely TB and Griffith MJ, Blood, 1985, 65, 1226–1231. [PubMed] [Google Scholar]
- 5.Lindahl U, Haemostasis, 1999, 29 Suppl S1, 38–47. [DOI] [PubMed] [Google Scholar]
- 6.Lever R, Mulloy B, Page CP and Page C, in Heparin - A Century of Progress, Springer Berlin Heidelberg, 2012, vol. 207, pp. 281–305. [Google Scholar]
- 7.Page C, ISRN Pharmacology, 2013, DOI: 10.1155/2013/910743, 1–13. [DOI] [PMC free article] [PubMed] [Google Scholar]
- 8.Peysselon F and Ricard-Blum S, Matrix Biol, 2014, 35, 73–81. [DOI] [PubMed] [Google Scholar]
- 9.Meneghetti MC, Hughes AJ, Rudd TR, Nader HB, Powell AK, Yates EA and Lima MA, J. R. Soc. Interface, 2015, 12, 0589. [DOI] [PMC free article] [PubMed] [Google Scholar]
- 10.Wilkie AO, Morriss-Kay GM, Jones EY and Heath JK, Current biology : CB, 1995, 5, 500–507. [DOI] [PubMed] [Google Scholar]
- 11.Billings PC and Pacifici M, Connect Tissue Res, 2015, 56, 272–280. [DOI] [PMC free article] [PubMed] [Google Scholar]
- 12.Joung YK, Bae JW and Park KD, Expert opinion on drug delivery, 2008, 5, 1173–1184. [DOI] [PubMed] [Google Scholar]
- 13.Soares da Costa D, Reis RL and Pashkuleva I, Annual review of biomedical engineering, 2017, 19, 1–26. [DOI] [PubMed] [Google Scholar]
- 14.Gama CI, Tully SE, Sotogaku N, Clark PM, Rawat M, Vaidehi N, Goddard WA 3rd, Nishi A and Hsieh-Wilson LC, Nat. Chem. Biol, 2006, 2, 467–473. [DOI] [PubMed] [Google Scholar]
- 15.Habuchi H, Habuchi O and Kimata K, Glycoconj. J, 2004, 21, 47–52. [DOI] [PubMed] [Google Scholar]
- 16.Petitou M, Casu B and Lindahl U, Biochimie, 2003, 85, 83–89. [DOI] [PubMed] [Google Scholar]
- 17.Vanboeckel CAA and Petitou M, Angew. Chem. Int. Ed. Engl, 1993, 32, 1671–1690. [Google Scholar]
- 18.Petitou M and van Boeckel CAA, Angew. Chem. Int. Ed. Engl, 2004, 43, 3118–3133. [DOI] [PubMed] [Google Scholar]
- 19.Jemth P, Kreuger J, Kusche-Gullberg M, Sturiale L, Gimenez-Gallego G and Lindahl U, J. Biol. Chem, 2002, 277, 30567–30573. [DOI] [PubMed] [Google Scholar]
- 20.Maccarana M, Casu B and Lindahl U, The Journal of biological chemistry, 1993, 268, 23898–23905. [PubMed] [Google Scholar]
- 21.Kreuger J, Salmivirta M, Sturiale L, Giménez-Gallego G and Lindahl U, J. Biol. Chem, 2001, 276, 30744–30752. [DOI] [PubMed] [Google Scholar]
- 22.Mach H, Volkin DB, Burke CJ, Middaugh CR, Linhardt RJ, Fromm JR, Loganathan D and Mattsson L, Biochemistry, 1993, 32, 5480–5489. [DOI] [PubMed] [Google Scholar]
- 23.Fromm JR, Hileman RE, Weiler JM and Linhardt RJ, Arch. Biochem. Biophys, 1997, 346, 252–262. [DOI] [PubMed] [Google Scholar]
- 24.Kreuger J, Prydz K, Pettersson RF, Lindahl U and Salmivirta M, Glycobiology, 1999, 9, 723–729. [DOI] [PubMed] [Google Scholar]
- 25.Guerrini M, Agulles T, Bisio A, Hricovini M, Lay L, Naggi A, Poletti L, Sturiale L, Torri G and Casu B, Biochem. Biophys. Res. Commun, 2002, 292, 222–230. [DOI] [PubMed] [Google Scholar]
- 26.Muneeruddin K, Thomas JJ, Salinas PA and Kaltashov IA, Anal. Chem, 2014, 86, 10692–10699. [DOI] [PubMed] [Google Scholar]
- 27.Zaia J, Mass Spectrom. Rev, 2004, 23, 161–227. [DOI] [PubMed] [Google Scholar]
- 28.Naggar EF, Costello CE and Zaia J, J. Am. Soc. Mass Spectrom, 2004, 15, 1534–1544. [DOI] [PubMed] [Google Scholar]
- 29.Gong F, Jemth P, Escobar Galvis ML, Vlodavsky I, Horner A, Lindahl U and Li JP, J. Biol. Chem, 2003, 278, 35152–35158. [DOI] [PubMed] [Google Scholar]
- 30.Peterson SB and Liu J, Matrix Biol, 2013, 32, 223–227. [DOI] [PubMed] [Google Scholar]
- 31.Yamada S, Yoshida K, Sugiura M, Sugahara K, Khoo KH, Morris HR and Dell A, J. Biol. Chem, 1993, 268, 4780–4787. [PubMed] [Google Scholar]
- 32.Uchimura K, Methods Mol. Biol, 2015, 1229, 401–412. [DOI] [PubMed] [Google Scholar]
- 33.Goth M and Pagel K, Anal. Bioanal. Chem, 2017, 409, 4305–4310. [DOI] [PubMed] [Google Scholar]
- 34.Zhao Y, Singh A, Xu Y, Zong C, Zhang F, Boons GJ, Liu J, Linhardt RJ, Woods RJ and Amster IJ, J. Am. Soc. Mass Spectrom, 2017, 28, 96–109. [DOI] [PMC free article] [PubMed] [Google Scholar]
- 35.Ruotolo BT, Benesch JL, Sandercock AM, Hyung SJ and Robinson CV, Nature protocols, 2008, 3, 1139–1152. [DOI] [PubMed] [Google Scholar]
- 36.DiGabriele AD, Lax I, Chen DI, Svahn CM, Jaye M, Schlessinger J and Hendrickson WA, Nature, 1998, 393, 812–817. [DOI] [PubMed] [Google Scholar]
- 37.Minsky BB, Dubin PL and Kaltashov IA, J. Am. Soc. Mass Spectrom, 2017, 28, 758–767. [DOI] [PMC free article] [PubMed] [Google Scholar]
- 38.Jurchen JC and Williams ER, J Am Chem Soc, 2003, 125, 2817–2826. [DOI] [PMC free article] [PubMed] [Google Scholar]
- 39.Abzalimov RR, Frimpong AK and Kaltashov IA, Int. J. Mass Spectrom, 2006, 253, 207–216. [Google Scholar]
- 40.Abzalimov RR, Dubin PL and Kaltashov IA, Anal. Chem, 2007, 79, 6055–6063. [DOI] [PubMed] [Google Scholar]
- 41.Yu Y, Sweeney MD, Saad OM, Crown SE, Handel TM and Leary JA, J. Biol. Chem, 2005, 280, 32200–32208. [DOI] [PubMed] [Google Scholar]
- 42.Harmer NJ, Robinson CJ, Adam LE, Ilag LL, Robinson CV, Gallagher JT and Blundell TL, Biochem. J, 2006, 393, 741–748. [DOI] [PMC free article] [PubMed] [Google Scholar]
- 43.Oh H, Breuker K, Sze SK, Ge Y, Carpenter BK and McLafferty FW, Proc. Natl. Acad. Sci. U. S. A, 2002, 99, 15863–15868. [DOI] [PMC free article] [PubMed] [Google Scholar]
- 44.Abzalimov RR and Kaltashov IA, Anal. Chem, 2010, 82, 7523–7526. [DOI] [PubMed] [Google Scholar]
- 45.Zhao Y, Abzalimov RR and Kaltashov IA, Anal. Chem, 2016, 88, 1711–1718. [DOI] [PubMed] [Google Scholar]
- 46.Henriksen J, Ringborg LH and Roepstorrf P, J. Mass Spectrom, 2004, 39, 1305–1312. [DOI] [PubMed] [Google Scholar]
Associated Data
This section collects any data citations, data availability statements, or supplementary materials included in this article.


