

Abstract
The role of Ataxia Telangiectasia Mutated (ATM) gene in human malignancies, especially in solid tumors, remains poorly understood. In the present study, we explored the involvement of ATM in transforming primary human cells into cancer stem cells. We show that ATM plays an unexpected role in facilitating oncogene-induced malignant transformation through transcriptional reprogramming. Exogenous expression of an oncogene cocktail induced a significant amount of DNA double strand breaks in human fibroblasts that caused persistent activation of ATM, which in turn enabled global transcriptional reprogramming through chromatin relaxation, allowing oncogenic transcription factors to access chromatin. Consistently, deficiencies in ATM significantly attenuated oncogene-induced transformation of human cells. In addition, ATM inhibition significantly reduced tumorigenesis in a mouse model of mammary cancer. ATM and cellular DNA damage response (DDR) therefore play a previously unknown role in facilitating rather than suppressing oncogene-induced malignant transformation of mammalian cells.
Keywords: ATM, transcriptional reprogramming, cancer stem cells, chromatin access, oncogenic transformation
Introduction
ATM is the susceptibility gene for Ataxia Telangiectasia, a rare genetic disorder characterized by deficiencies in the nervous, immune, and other bodily systems (1). Since its initial cloning in 1995 (2), much has been learned about its biochemical and cellular functions (3–5). ATM protein is a key player in the DNA Damage Response (DDR), a eukaryotic cellular signaling pathways that are responsible for detecting, signaling, and repairing DNA lesions (6–8). Because of ATM’s central role in sensing and signaling for DNA double strand breaks, ATM-deficient cells showed extreme sensitivity to ionizing radiation (9).
At the molecular level, it was found that radiation-induced DSBs caused rapid phosphorylation of ATM, which in turn phosphorylated the tumor suppressor p53. Phosphorylation of p53 was shown to contribute to its stability as well as transcriptional activities (3). Furthermore, ATM phosphorylated the E3 ligase COP1, which stimulated its nuclear export and stabilizes p53 (10). In addition, ATM was shown to phosphorylate BRCA1, which was important for its DSB-repairing capacity of the latter (11). Even in the absence of external DNA damage, it was discovered that ATM was part of the so-called BASC complex, which contained ATM, BLM, MSH2, MSH6, MLH1, the RAD50-MRE11-NBS1 complex, and the RFC1-RFC2-RFC4 complex (12). BASC was suggested to be a sensor of erroneous DNA structures and part of the post-replication DNA repair process. Among those proteins, both BLM and NBS1 were shown to undergo radiation-induced phosphorylation that was dependent on ATM, indicating a key regulatory role for ATM in the complex.
Because of ATM’s role in signaling DNA repair and initiate cell cycle arrest when cells experience DNA damage, and the fact that patients with ATM deficiencies are at higher risks for developing leukemia and lymphomas, ATM has traditionally been assigned the role of a tumor suppressor. However, in both humans and mice, lymphoma and leukemia are the only clear-cut examples of cancer development caused by ATM deficiency(13). Its roles in other types of cancer, especially solid tumors, are much less clear. Indeed, earlier studies implicating ATM mutation as a causal event for breast cancer remain controversial (14–18). Even studies that support a role for ATM in mammary carcinogenesis suggest that it is only a very modest risk (19). Given the pronounced effect of ATM deficiency on genomic instability and the central role of ATM in the DNA damage response, one has to wonder whether the relatively low risk for solid tumor development indicates the existence of some yet unidentified biological functions of ATM limits its role as a tumor suppressor. On the other hand, evidence is emerging that ATM may be a double-edged sword in cancer cells. For example, recent studies indicate that ATM plays key roles in maintaining the stemness of cancer cells (20–22). Furthermore, in clinical samples higher levels of ATM activation, as indicated by phosphorylation of ATM in tumor tissues, predict for worse prognosis in breast and colon cancer patients (20). In other studies, higher ATM levels in Her2+ breast cancer patients also predict for shorter survival in patients (21).
In the present study, we attempted to clarify the roles of ATM in solid tumor carcinogenesis by use of a “oncogenic cocktail” approach that was recently developed (23). In that system, 4–6 oncogenes and stem cell genes were used to rapidly transform primary human cells into potent tumorigenic cells resembling cancer stem cells. By use of that approach, we show that ATM and DDR in fact plays an essential role in facilitating the oncogene-induced malignant transformation of human fibroblast cells. Furthermore, the facilitation is based on ATM’s ability to relax the chromatin (24,25). We discovered that chromatin relaxation allows for the oncogenic transcriptional factors to access their targets and reprogram the transcriptome of target cells, which proves to be essential for oncogenic transformation.
Material and Methods
Cell Lines and Tissue Culture
Early passage, hTERT immortalized non-transformed human foreskin fibroblast cell line, HFF, was a kind gift from Dr. Michael Kastan of Duke University (Durham, NC). Normal and ataxia-telangiectasia (A-T) primary fibroblast cell strains were obtained from the Coriell Institute (Camden, NJ) (Supplementary Table S1). The cells were not authenticated because they are primary fibroblasts. The cells were tested periodically for and made sure for lack of mycoplasma infection. The culture medium was composed of DMEM supplemented with 10%−20% fetal bovine serum (Sigma) and 100 units/ml penicillin and 100 μg/ml streptomycin. The p53 status of HFF and primary fibroblast cells was further confirmed by doxorubicin treatment induced p53 stabilization and downstream p21 and MDM2 transactivation (Supplementary Fig. S1A).
CRISPR/Cas9-mediated gene knockout
ATM and KAP1 knockout cell lines were generated by use of lentivirus-mediated CRISPR/Cas9 technology. Single guided RNA (sgRNA) sequences targeting ATM gene were designed with the use of a free online CRISPR design tool (crispr.mit.edu). Annealed double stranded sgRNA oligos were ligated into the lentiCRISPRv2 (deposited by Dr. Feng Zhang of MIT to Addgene, Cambridge, MA) at BsmB1 site, which co-expresses Cas9 and sgRNA in the same vector. The sgRNA-encoding CRISPR lentivirus vector plasmids were transduced into 293T cells together with second generation packaging plasmids (psPAX2, pMD2.G; both deposited at Addgene by Dr. Didier Trono of EPFL (Ecole Polytechnique Fédérale de Lausanne, Switzerland) following a published, calcium phosphate-based Trono Lab protocol (http://tronolab.epfl.ch/page58122.html). Supernatants containing lentivirus particles were collected 48hrs after transfection.
Oncogene-induced transformation
The plasmids encoding MycT58A, HRasG12V, p53DD, Cyclin D1 and CDK4R24C were obtained from Addgene. They were deposited by Dr. Christopher Counter of Duke University (Durham, NC). The plasmid encoding the human OCT4 gene was also obtained from Addgene. It was deposited by Dr. James A. Thomson of University of Wisconsin (Madison, Wisconsin). KAP1 wild type gene and KAP1 gene mutants with S824A and S824D substitutions were synthesized by Integrated DNA Technologies. All of the above genes were transferred into the pLEX lentiviral vector with human influenza hemagglutinin (HA) tag (Open Biosystems, Huntsville, AL) by use of PCR-mediated subcloning. The lentivirus particles encoding the above genes were packaged following a standard protocol. The supernatants, which contain active recombinant lentiviral vectors, were then used in gene transduction experiments. Four factors (MPOR; MycT58A, p53DD, Oct4, HRasG12V) or six factors (MPORCC; MycT58A, p53DD, Oct4, HRasG12V, Cyclin D1 and CDK4R24C) were transduced into fibroblasts to reprogram normal fibroblasts into malignant tumor cells.
Soft agar assay.
Soft agar assay was carried out according to an established protocol (26). Growth of cells in soft agar was determined by plating 500–5000 cells in 0.3% Noble agar in 6-well plates. Three weeks after plating, soft agar plates were stained with 0.005% crystal violet. Colonies were then photographed and counted with the NIH ImageJ software.
Antibodies used for immunofluorescence staining and western blot analysis
Antibodies use in this study are listed in Supplemental Table S2.
Real-time quantitative PCR
Total RNA was extracted by use of the RNeasy kit(QIAGEN). Real-time quantitative PCR was performed to quantify the relative abundance of select genes using the QuantiTest SYBR Green PCR Kit (Qiagen) as recommended by the manufacturers on an Applied Biosystems ViiA7 real-time PCR system. Primers used in the study are listed in Supplementary Table S3.
TRAP assay for telomerase activities
The telomerase activities of control and transformed cells were measured by use of the TRAPeze Telomerase detection kit (EMD Millipore, Cat#S7700, Darmstadt, Germany) following manufacturer`s protocol.
Limiting dilution assay
Limiting dilution assay for tumor sphere formation assay was performed as described previously by Bellows and Aubin (27) and Tropepe et al. (22). Briefly, trypsinized individual cells were plated in 96-well tissue culture plates with 0.2 ml/well of sphere growth media (DMEM/F12 supplemented with non–essential amino acid, Glutamine, B-27 supplement without vitamin A, 0.2% heparin, 20 ng/ml EGF and 25ng/ml b-FGF). The final diluted average cell numbers ranged from 0.5 to 800 /well. Cells were cultured up to 14 days during which time they were monitored for sphere formation.
mRNA-SEQ
RNA-seq was carried out by the Duke University Sequencing and Genomic Technologies Core. The Kapa Stranded mRNA-seq library prep kit was used to make sequencing libraries. The libraries were sequenced by use of an Illumina Hiseq 4000 instrument with a 50 bp single end reads length. RNA-seq data were analyzed with the help from the Duke Genomic Analysis and Bioinformatics Core. RNA-seq data were processed using the TrimGalore toolkit which employs Cutadapt (28) to trim low-quality bases and Illumina sequencing adapters from the 3’ end of the reads. Only reads that were 20nt or longer after trimming were kept for further analysis. Reads were mapped to the GRCh37v75 version of the human genome and transcriptome (29) using the STAR RNA-seq alignment tool (30). Reads were kept for subsequent analysis if they mapped to a single genomic location. Gene counts were compiled using the HTSeq tool. Only genes that had at least 10 reads in any given library were used in subsequent analysis. Normalization and differential expression was carried out using the DESeq2 (31) and Bioconductor package s with the R statistical programming environment (32). The false discovery rate was calculated to control for multiple hypothesis testing. Gene set enrichment analysis (33) was performed to identify differentially regulated pathways and gene ontology terms for each of the comparisons performed.
ATAC-seq
Cells in exponential phase were harvested. For each sample to be analyzed, a total of 50,000 cells were washed once with 50 μL of cold PBS and re-suspended in 50 μL lysis buffer (10 mM Tris-HCl pH 7.4, 10 mM NaCl, 3 mM MgCl2, 0.1% (v/v) IGEPAL CA-630). Samples were then centrifuged at 500g at 4°C and supernatants were removed. The final crude nuclear pellet was re-suspended in 50 μL transposition reaction mix (25 μL TD buffer, 3 μL Tn5 transposase and 22 μL nuclease-free H2O) of Nextera DNA library Preparation Kit (Illumina). Libraries were prepared for sequencing as described (34). All samples were barcoded and combined into a single pool. The pool was sequenced on two lanes of an Illumina 4000 sequencer (San Diego, CA, USA) at the Duke Sequencing and Genomic Technologies Core.
Analysis of the data were carried out with the assistance of Duke Genomic Analysis and Bioinformatics Core. Briefly, ATAC-Seq raw fastq files were processed using the TrimGalore toolkit(http://www.bioinformatics.babraham.ac.uk/projects/trim_galore) which employs Cutadapt (28) to trim low quality bases and Illumina sequencing adapters from the 3’ end of the reads. Only reads that were 20 nt or longer after trimming were kept for further analysis. Reads were mapped to the mm10 version of the human genome using the bowtie alignment tool (35). Reads were kept for subsequent analysis if they mapped to a single genomic location. Amplification artifacts were removed using the Picard toolkit (http://broadinstitute.github.io/picard). Regions of open chromatin regions were called using the MACS2 peak calling algorithm (36). To compare across the different conditions, peaks were called using the merged set of reads from all replicates of a single condition. Peaks that overlapped across the two conditions being compared were merged into a single peak. The number of reads from each individual sample that overlapped the peaks were quantified. Normalization and differential openness of chromatin regions were calculated using DESeq2 (31) and Bioconductor (32) package with the R statistical programming environment (www.r-project.org). Peaks were then annotated with their nearest gene using the GRCh37v75(29) of the human transcriptome.
Tumorigenesis experiments
All animal experiments conducted in this study is approved by Duke University Institutional Animal Use and Care Committee (IACUC) and conducted according to institutional guidelines.
To test athymic nude mice (6–8 weeks old, Jackson Laboratory, Bar Harbor, Maine) were used. Putative transformed cells were injected subcutaneously into mouse hind leg. Tumor sizes were monitored twice a week by use of caliper.
MMTV-PyMT and ATM+/− mice from Jackson Laboratory were used in our experiments. They were deposited by William Muller of McGill University and Michael Weil of Colorado State University, respectively. MMTV-PyMT mice were crossed with ATM+/− mice. The resulting offspring had a mixed FVB/129S6 genetic background. Mice were housed in pathogen-free housing following the Institutional Animal Use and Care Committee of Duke University guidelines. Since most ATM homozygous develop thymic lymphoma quickly and died before their mammary tumors could be examined, only mice in ATM+/− background were used in our experiments. PyMT;ATM(WT) and PyMT:ATM(+/−) age-matched female virgin littermates were observed for mammary tumorigenesis experiments. Tumor growth was monitored twice a week by use of caliper. Tumor-bearing mice were sacrificed once their tumor sizes reached 1.5cm in diameter. After sacrifice, the final number of tumors were counted for each mouse and total tumor mass for each mouse were also determined.
Analysis of ATM and KAP1 mRNA expression levels in matched human normal and tumor tissues
To analyze ATM and KAP1 mRNA expression levels in normal and tumor tissues, the preprocessing and normalized human tissue gene expression data sets were obtained from Gene Expression across Normal and Tumor tissue (GENT, http://medicalgenome.kribb.re.kr/GENT/index.php). The original datasets were derived from various sources by use of the Affymetrix U133A and U133Plus2 platforms deposited either in the Gene Expression Omnibus (http://www.ncbi.nlm.nih.gov/geo/) or the ArrayExpress (http://www.ebi.ac.uk/microarray-as/ae/) public resources. A total of 30435 GSM samples in 576 GSE from 11 type of matched normal and cancer tissues were analyzed. Details of sample types and numbers were provided in Supplementary Table S4. Statistical analysis comparing each type of normal and cancer tissues was performed by use of Student’s t test.
Statistical Analysis
All reported values correspond to a minimum of 3 biological replicates. Data are represented as average ± SEM (standard error of the mean). Comparisons among different groups were mostly carried out by use of unpaired Student’s t test. In addition, for limiting dilution analysis, one-way ANOVA test was used for statistical analysis. For RNAseq and ATAC analyses, please refer to the statistical analysis description described in previous sections. For Kaplan-Meier analysis, log-rank test was used. In all cases, p<0.05 was defined as statistically significant results.
Results
Persistent DNA double strand break induction and activation of the DNA damage response during “oncogenic cocktail” induced transformation of human fibroblasts
We employed a recently developed system in our laboratory to achieve rapid transformation of human fibroblast cells by use of defined genetic factors. In a previous study, we showed that an “oncogenic cocktail” of 4 genetic factors (OCT4, c-MycT58A, P53DD, H-RasG12V, or MPOR in short) could rapidly and efficiently transform astrocytes into malignant cancer cells with cancer stem cell-like properties (23). In this study, we used recombinant lentivirus vectors to transduce the same four transcription factors into an hTERT-immortalized human foreskin fibroblast (HFF) cells following a scheme depicted in Fig. 1A. Western blot analysis showed that our protocol led to efficient expression of the exogenous factors in the fibroblasts (Supplementary Fig. S1B). Transduced human fibroblasts went through a period of significant cell death, as observed previously in oncogene transduced astrocytes (23). Most of the cells that survived showed an epithelial morphology, different from parental human fibroblasts, which are usually spindle shaped (Fig. 1A). Previously, forced expression of Myc and Ras in normal human cells has been associated with increased DNA damage and associated apoptosis (37) and senescence (38), respectively. Therefore, we carried out western blot analysis to determine the levels of several well-established protein markers of DNA damage response: γH2AX and phosphorylated ATM (pATM) in MPOR-transduced HFF cells. Our data show that MPOR transduction induced a time-dependent increase in γH2AX levels (Fig. 1B), which were completely absent in parental HFF fibroblasts. Consistently, phosphorylated ATM levels were also increased significantly when compared with non-transduced parental fibroblasts (Fig. 1B). The authenticity of the activation of the DNA damage response in MPOR-transduced cells were further verified by in situ immunofluorescence staining (Fig. 1C–F). Our results showed significantly higher levels of γH2AX and ATM foci in transduced cells (Fig. 1D and F). Thus there was clear evidence for robust induction of DNA double strand breaks and activation of the DNA damage response in the process of oncogene-induced transformation of human fibroblasts.
Fig.1. Oncogene-induced cellular transformation accompanied by DNA double strand breaks and activation of DNA damage response.
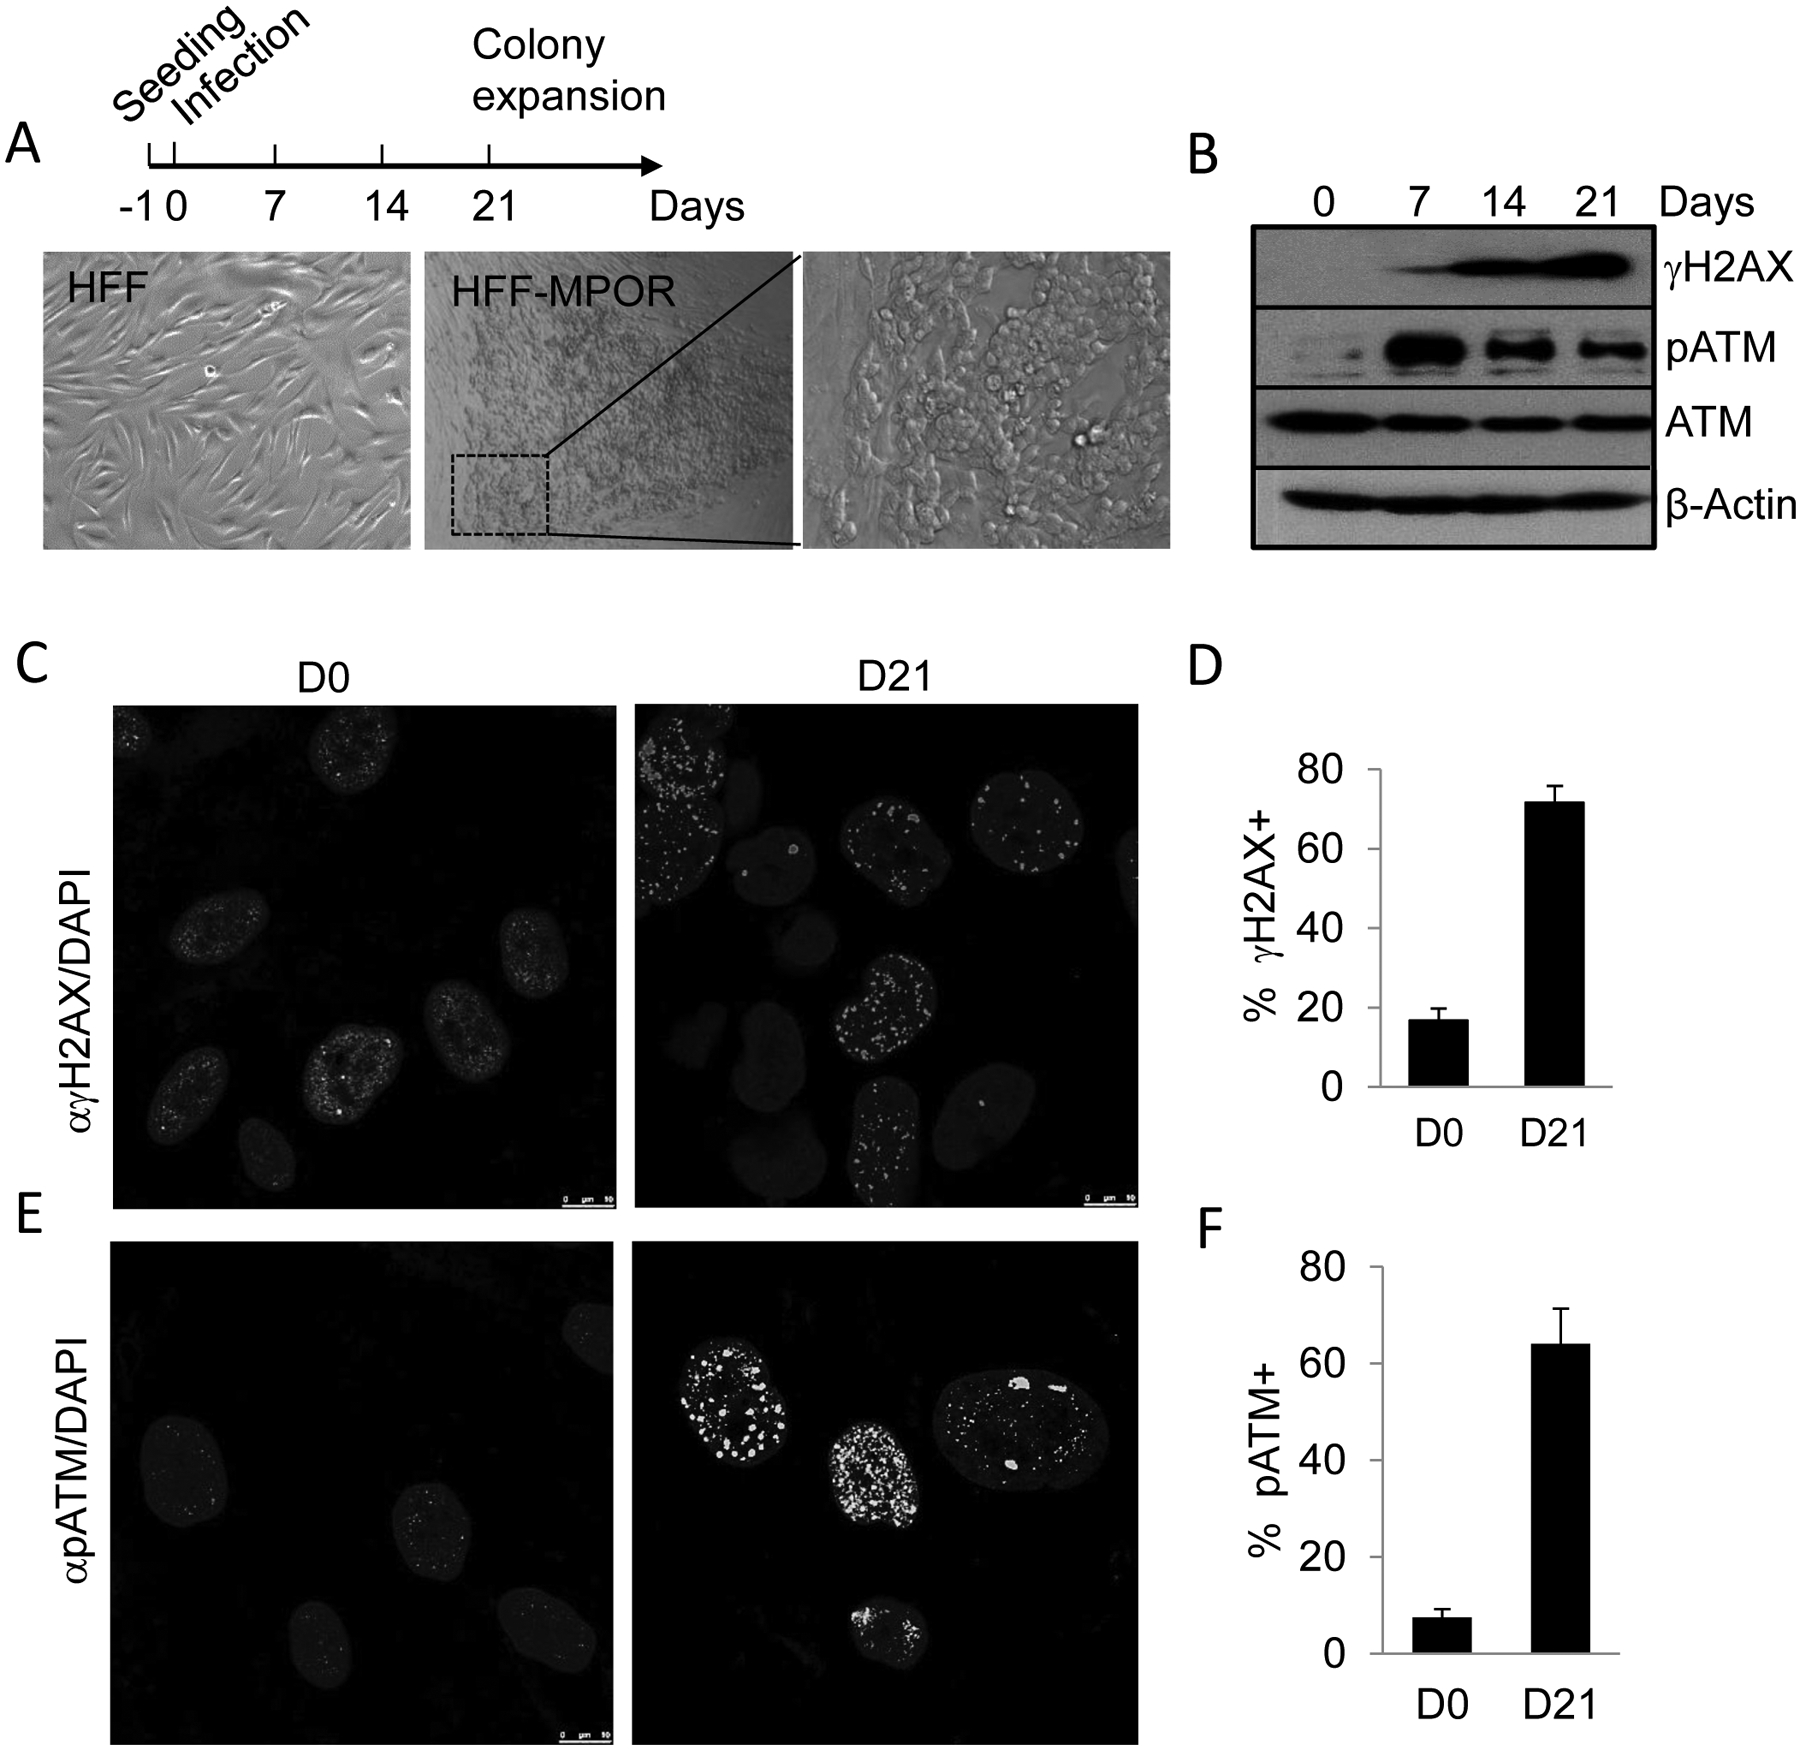
A). Schedule of oncogene transduction and representative cellular morphology in MPOR-transduced HFF cells at day 21 post transduction.
B). Activation of the DNA damage response as indicated by increasing levels of phosphorylated H2AX and ATM at different time points post oncogene transduction.
C, D). Phosphorylated H2AX in MPOR-transduced HFF cells on day 21. Error bars represent Mean±SEM, ****P <0.001,unpaired t test.
E, F). Phosphorylated ATM of MPOR-transduced HFF cells on day 21. Error bars represent Mean±SEM, ****P <0.001,unpaired t test.
Significant attenuation of malignant transformation in ATM knockout fibroblasts
Our observation of constitutive DSBs and ATM activation in MPOR-transduced fibroblasts begs for an important question: what are the roles of constitutive DNA damage and ensuing DNA damage response in oncogenic transformation? According to the current paradigm, ATM and DDR are activated by the cells to protect itself from genetic instability and mutagenesis and thus a key tumor-suppressive cellular process. In order to determine the role of ATM in oncogene induced transformation of fibroblasts, we used ATM knockout cells derived from HFF-hTERT cell line by use of the CRISPR-Cas9 technology (39) (Supplementary Fig. S1C, left panel). We then evaluated the ability of MPOR to transform isogenic control and ATMKO HFF-hTERT cells. As expected, control cells were readily transformed, eventually forming colonies that were clearly visible in the Petri dish after crystal violet staining (Supplementary Fig. S2A, left panel). Surprisingly, both the numbers (Fig. 2A) and sizes (Supplementary Fig. S2A, right panel) of transformed colonies in MPOR-transduced ATMKO cells were significantly attenuated instead of being enhanced as expected from the currently established paradigm. The reduction in transform efficiency was also observed when a small molecule inhibitor of ATM (KU55933) was administered to MPOR-transduced HFF cells (Supplementary Fig. S2B and C).
Fig.2. ATM is required for oncogene-induced transformation, tumorigenesis and stemness.
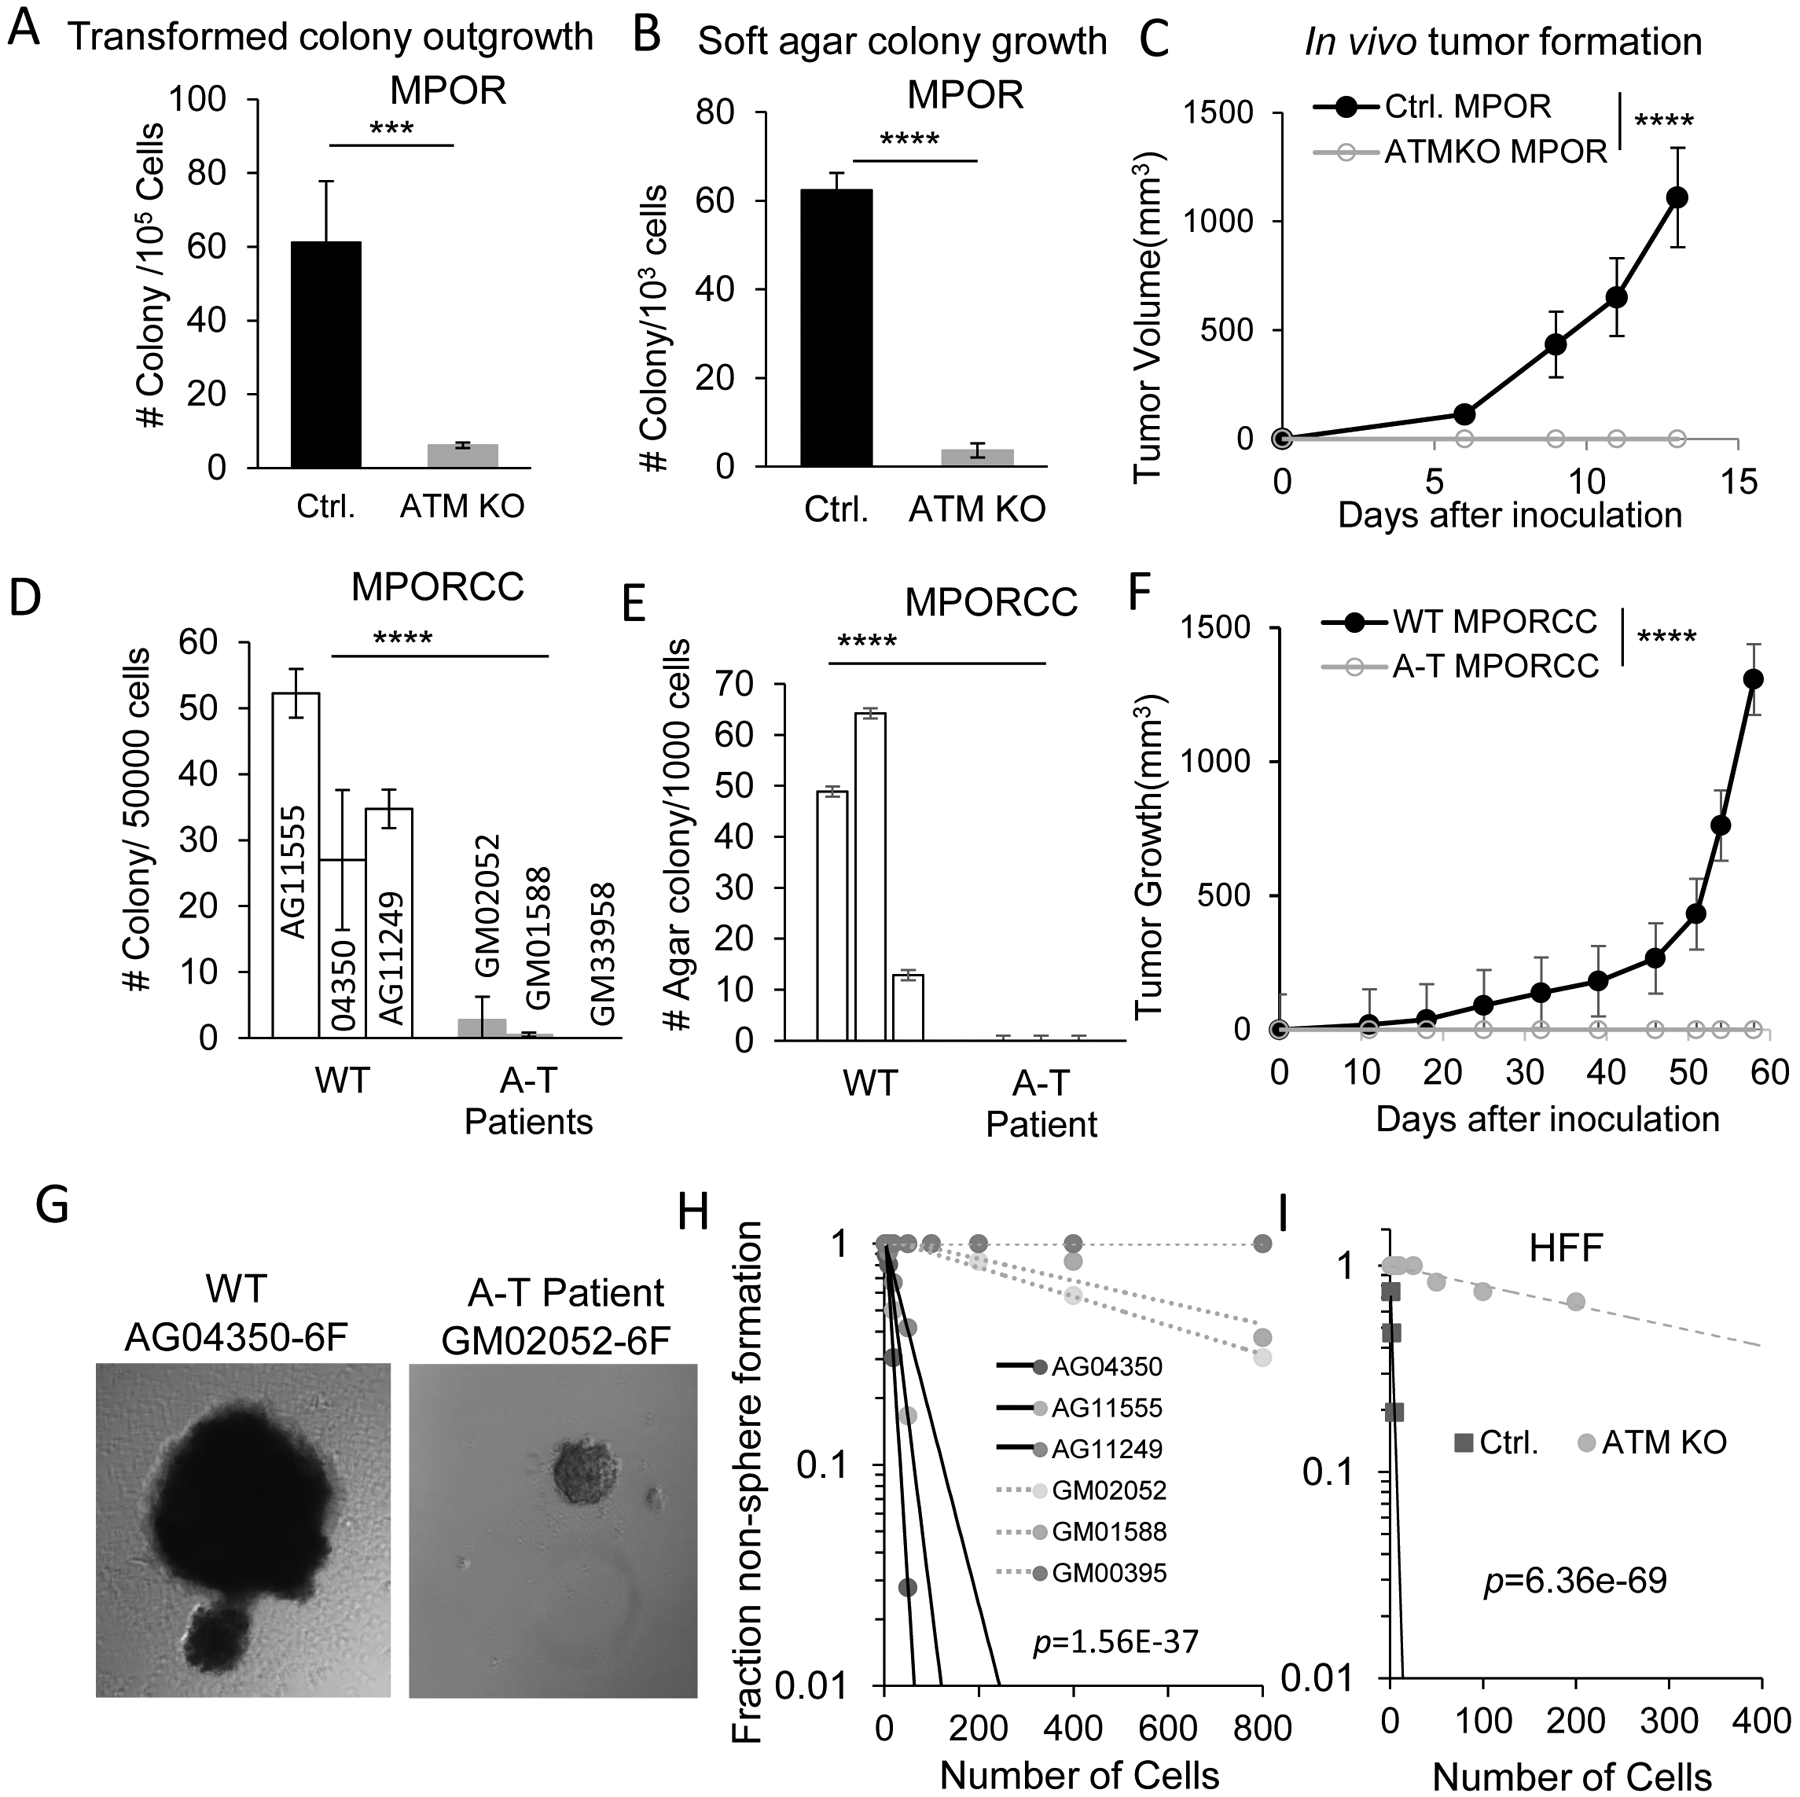
A). Morphologically transformed colony outgrowth in MPOR-transduced control and ATMKO HFF cells. n=3.
B). Soft agar colony growth from MPOR-transduced, morphologically transformed control and ATMKO HFF cells. n=3.
C).Tumor formation in nude mice from MPOR transduced, morphologically transformed control and ATM deficient HFF cells. n=6.
D). Morphologically transformed colony outgrowth in MPORCC transduced primary fibroblast cells from normal and A-T patients. n=3.
E). Soft agar colony growth from mixed populations of MPORCC transduced primary fibroblast cells from control and A-T patients evaluated at day 30 post transduction. n=3.
F). Tumor growth of from mix populations of MPORCC transduced primary fibroblast cells from normal and A-T patients evaluated at day 30 post transduction. n=5.
G).Representative morphology of tumor spheres formed by MPORCC transduced primary fibroblast cells from normal adult (AG04350) and A-T patient (GM02052), respectively.
H). Extreme limiting dilution assay evaluation of tumor sphere forming abilities of MPORCC transduced primary fibroblast cells from normal adults and A-T patients. p value represents chi-square.
I). Extreme limiting dilution assay evaluation of tumor sphere formation abilities of MPOR transduced, morphologically transformed parental and ATM deficient HFF cells. p value represents chi-square.
A, B, D, and E, error bars represent Mean±SEM, ***p<0.005; ****p<0.001. unpaired t test.
C and F error bars represent Mean±SEM, ****p<0.001, two-way ANOVA.
In further experiments, we picked up and expanded some of the colonies from both control and ATM-KO cells and evaluated their abilities for anchorage-independent growth in soft agar, a well-recognized characteristic of tumorigenic cells. Our results indicated MPOR-transformed HFF-ATMKO cells showed significantly reduced soft agar colony formation when compared with control HFF cells (Fig.2B). In a further experiment, we evaluated the tumor-forming ability of MPOR-transformed cells in nude mice. Compared with the potent tumor-forming abilities of MPOR-transduced control cells, putative transformed cells with ATM deficiency did not generate any visible tumor growth (Fig.2C). The above experiments clearly showed that ATM was required for oncogenic transformation of HFF cells, especially for in vivo tumor formation.
In order to rule out the possibility that our observation was only true for the HFF cell line we used, we carried out further transformation experiments in primary fibroblasts from Ataxia-telangiectasia (A-T) patients as well as normal adults (wild type) (see Supplementary Fig. S1C for confirmation of ATM expression). To boost the efficiency of transformation in these primary cells, they were transduced with the 6 factors: MPOR, cyclin D1 and CDK4 (MPORCC in short). Our results showed that MPORCC-transduced wild type fibroblasts could be transformed in three weeks. In contrast, MPORCC-transduced primary fibroblast from A-T patients could barely form any transformed colonies 8 weeks post transduction (Fig. 2D). We next evaluated the soft agar forming abilities of MPORCC-transduced primary fibroblasts at 4 weeks post oncogene transduction. Our results showed that MPORCC-transduced A-T fibroblast cells could not form any soft agar colonies while MPORCC-transduced wild type fibroblast cells formed soft agar colonies in a robust manner (Fig.2E). We further evaluated the effect of ATM on the tumorigenic abilities of MPORCC-transduced fibroblast cells (mixed cell population) in nude mice. Similar to soft agar experiments, MPORCC-transduced A-T fibroblast cells could not form any tumors in nude mice while MPORCC-transduced wild type cells formed tumors easily (Fig.2F and Supplementary Fig. S2D). These results suggested that our observation of the facilitative role for ATM in oncogene-induced transformation was also applicable to primary human fibroblasts in addition to immortalized HFF cells.
ATM deficiency significantly reduced tumor sphere forming ability and tumorigenicity of morphologically transformed cells
To further assess the influence of ATM on the tumor-forming abilities of oncogene transformed fibroblasts, we examined the tumor sphere forming abilities of wild type and ATM-deficient fibroblasts transformed with MPORCC. Tumor sphere formation in suspension culture is an important characteristic of cancer stem cells (40). We believe MPORCC transformed fibroblasts should possess properties of cancer stem cells based on our previous experience with transformed primary astrocytes (23). We conducted limiting dilution assays (27,41) in 96-well plates and our results indicated that MPORCC-transformed wild type fibroblasts formed tumor spheres in stem cell media at low cells number per well. In contrast, only two out of three MPORCC-transformed A-T fibroblast cell lines formed tumor spheres at all and even those tumor spheres were fewer and smaller when compared those of the wild type cells (Fig. 2G and H). The influence of ATM on tumor sphere forming ability was further verified in MPOR-transduced control or ATM-deficient HFF cells (Fig. 2I).
The ability to form tumors in immune-deficient mice is the gold standard when measuring the tumorigenicity of human cancer stem cells. Therefore, we evaluated the capacity of MPORCC-transformed fibroblast cells to grow in nude mice when injected at limited numbers. Injection of only 200 or 400 MPORCC-transformed wild type fibroblasts subcutaneously into nude mice gave rise to tumor growth in 3 out of 6 and 4 out of 6 mice, respectively (Supplementary Fig.S2E and F) during eight weeks of observation, indicating potent tumor initiating abilities. This was in stark contrast to morphologically transformed ATM-deficient cells, which did not form any tumors in 8 weeks even after inoculations of 1×10⁶ cells per mouse (Supplementary Fig. S2D). The critical role of ATM for the induction of stemness in MPORCC-transformed cells was reminiscent of the requirement of ATM in the self-renewal of hematopoietic stem cells (42), lowered efficiency of iPSC formation from ATM-deficient fibroblasts (43,44), and significantly attenuated ability to form teratoma in mice from ATM- deficient ES cells (45). It is also consistent with reports of ATM being a driver for stemness of glioma, colon, and breast cancer cells, respectively (20–22).
Taken together, the above data provide compelling evidence for a pivotal role of ATM in facilitating oncogene-induced transformation in human fibroblast cells.
Lack of transcriptional reprogramming in ATMKO cells transduced with the MPOR oncogenic cocktail
In order to explore the potential mechanism of ATM’s involvement in facilitating oncogene-induced transformation, we carried out a transcriptome profiling analysis of MPOR-transduced human fibroblasts with or without ATM gene by use of RNA-seq. In control HFF cells, transduction of MPOR caused significant changes in global gene expression patterns at 21 days post transduction, as shown on the heat map derived from hierarchical cluster analysis (Fig. 3A, left lanes). The results were thus consistent with the powerful transcriptional reprogramming activities of the oncogene “cocktail.” Strikingly, in isogenic HFFATM-KO fibroblasts, there was a high degree of similarity in gene expression profiles between control and MPOR transduced cells at 21 days post transduction (Fig. 3A, right lanes). Furthermore, transcriptional changes post MPOR transduction were also smaller in morphologically transformed colonies from the ATM-KO cells (ATMKO MOPR-T) when compared with those from control cells (Supplementary Fig. S3A). Principal Component Analysis (PCA) further confirmed the above results (Fig. 3B and supplementary Fig. S3B). It showed significant differences when comparing MPOR transduced, mixed HFF cells (MPOR day 21 vs control, Fig.3B) and even bigger differences comparing transformed colonies (MPOR-T) vs control or vs mixed population at day 21 (MPOR D21) (Supplementary Fig. S3B). In contrast, the differences for transformed ATM-KO colonies (ATMKO MPOR-T) vs ATMKO control or ATMKO-MPOR day 21 were much smaller, and mainly reflected in the second component (Supplementary Fig. S3B). Most strikingly, the ATMKO mixed cell population showed minimal difference when comparing with control cell population (Fig. 3B). In a further volcano plot analysis (Fig. 3C), we plotted every expressed gene out according to fold change (x-axis) and significance of difference (-Log(p), y axis) in a series of 4 comparisons. It is clear in control HFF cells, MPOR transduction induced or suppressed many more genes with higher levels of significance (lower p values) and greater amplitudes (fold changes) in changes (Fig. 3C, top panels). In contrast, changes in ATM-KO cells were fewer with less significance and smaller amplitudes (Fig. 3C, lower panels). Fig. 3D shows the fraction of genes with changes (both increases and reductions) of more than 4-fold in Fig. 3C.
Fig. 3. Global gene expression profiling of MPOR transduced HFF cells based on RNA-seq.
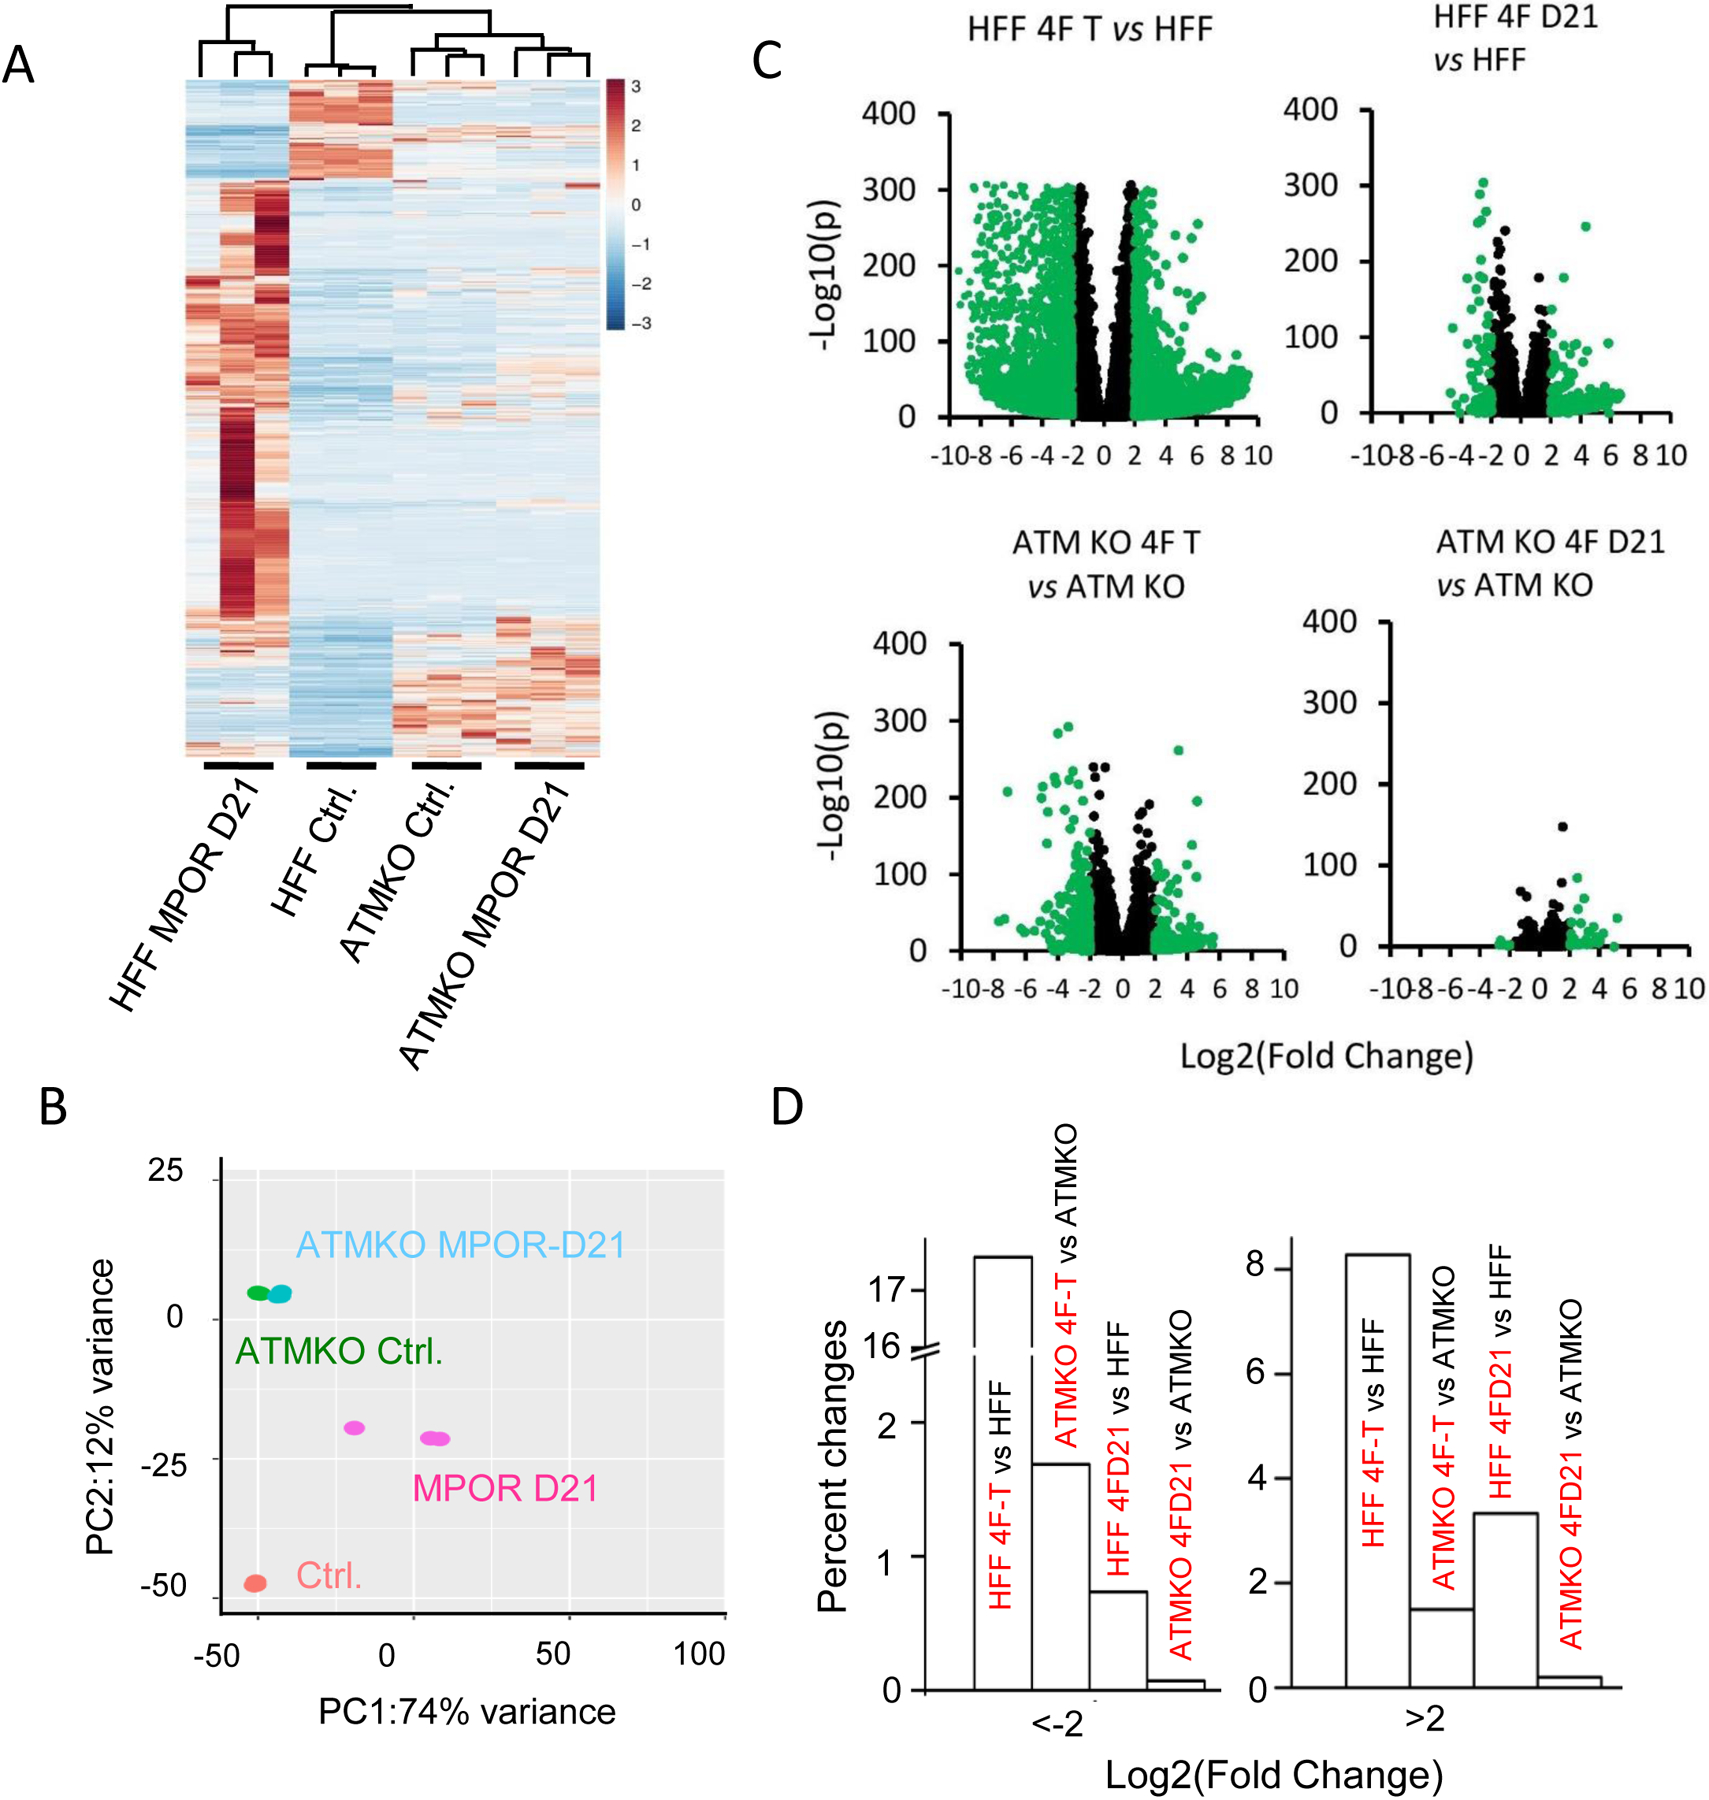
A). Unsupervised Heat map and hierarchical cluster analysis of the whole transcriptome in MPOR transduced parental and ATM deficiency HFF cells on Day 21 by RNA-seq. n=3.
B). Additional principal component analysis (PCA) of MPOR transduced parental and ATM deficient HFF cells on Day 21. n=3.
C). Volcano plots of gene expression changes in different pairs of cell populations.
D). Percent of genes with more than 4-fold changes in gene expression levels in different comparisons. 4F-T in C & D indicate MPOR transduced, morphologically transformed control or ATM KO cells. 4F-D21 in C & D indicate mixed population cells at day 21 post MPOR transduction.
Genes that showed more than 2-fold alterations in expression levels were subjected to further gene set enrichment analysis (GSEA). Gene set size filters (min=15, max=500) resulted in 907 gene sets that were used in gene ontology analysis. Compared with parental HFF cells, there were 67 gene sets with significant enrichment (FWER p <0.05) in MPOR transduced HFF cells at day 21, which were mainly related to stem cell signaling, RNA polymerase transcription signaling pathways, mitochondria genes, and chromatin architecture gene module (Supplementary Table S5 and Fg.S3C). At the individual gene levels, when comparing gene expression through Q-RT-PCR in transformed vs control HFF cells, many representative cancer- and stem cell-specific genes including Sox17, Lin28B, FGFR2, and chromatin regulating genes RCC1/RCC2, were strongly upregulated. In contrast, fibroblast-specific genes including TGFB1I1, COL1A2, and FN1 showed down-regulation in wild type fibroblasts (Supplementary Fig. S4A). In both cases, the same genes were affected much less significantly in ATM knockout HFF or A-T mutant fibroblast cells transduced with the same 4 genes at day 21 (Supplementary Fig. S4A), indicating significant lack of induced transcriptional changes. Our transcriptional profiling analysis thus clearly implicated ATM in facilitating transcriptional reprogramming during oncogene induced transformation.
Essential roles for ATM in mediating chromatin access in oncogene-induced transformation.
One possibility for the lack of transcriptional reprogramming by the oncogenic factors in ATMKO HFF cells was that chromatin access for transcriptional factors such as Oct4 and Myc were limited in ATMKO cells. In order to determine if this was indeed the case, we used ATAC-seq (Assay for Transposase-Accessible Chromatin using sequencing) to assess chromatin access in normal and ATM mutant primary human fibroblasts transduced with 6 oncogenic factors (MPORCC). Our ATAC-seq data indicate that in normal fibroblasts, significant changes in chromatin access were induced by transduction of MPORCC when compared with ATM mutant cells that were transduced with the same factors, which showed much less changes (principal component analysis, Fig. 4A). Fig. 4B shows the distribution of p values in normal vs ATM mutant fibroblasts transduced with MPORCC. It is clear that normal cells had many more gene locations that underwent significant changes in chromatin access when compared with ATM mutant cells. Next we analyzed the number of chromatin locations that showed significant changes in chromatin access (Fig.4C). In normal control fibroblast cells 3531 new chromosomal locations changed from closed to open (CO) status while 16240 gene locations changed from open to close status after MPORCC transduction. In contrast, in ATM mutant fibroblasts, only 5 genes changed from closed to open status while 337 gene changed from open to close status. KEGG gene ontology analysis of 1571 identifiable genes (from 3531 chromosomal locations) that changed from closed to open status in MPORCC transduced normal fibroblasts indicated that cancer-related pathways, ECM-receptor interaction pathway, and the PI3K-Akt pathway are among the notable gene pathways that were “opened” by oncogene transduction (Fig. 4D). At the individual gene levels (Fig. 4E), we found examples of genes involved in the fibroblast cellular phenotype (ITIH5, FLI1, TEAD3, and ITGA8) that changed from open to close in MPORCC transduced normal cells but not in ATM mutant fibroblasts. On the other hand, genes known to be involved in stem cell regulation and carcinogenesis such as ELF3, LAMA4, SOX5, PAX8, AKT3, TET2, FGF12, and ETS1 changed from closed to open in normal fibroblast cells after MPORCC transduction. Among them, we confirmed that TET2 and AKT3 were indeed upregulated in MPORCC transduced wild type but not ATM knockout fibroblast cells (Supplementary Fig. S4B). However, this is not surprising given that it is already known that ATACseq identifies chromatin access and chromatin access does not always lead to changes in gene expression (46).
Fig. 4. ATAC-seq analysis of chromatin accessibility in normal (04350) and ATM mutant (02052) fibroblasts before and after transduction with MPORCC oncogenic cocktail.
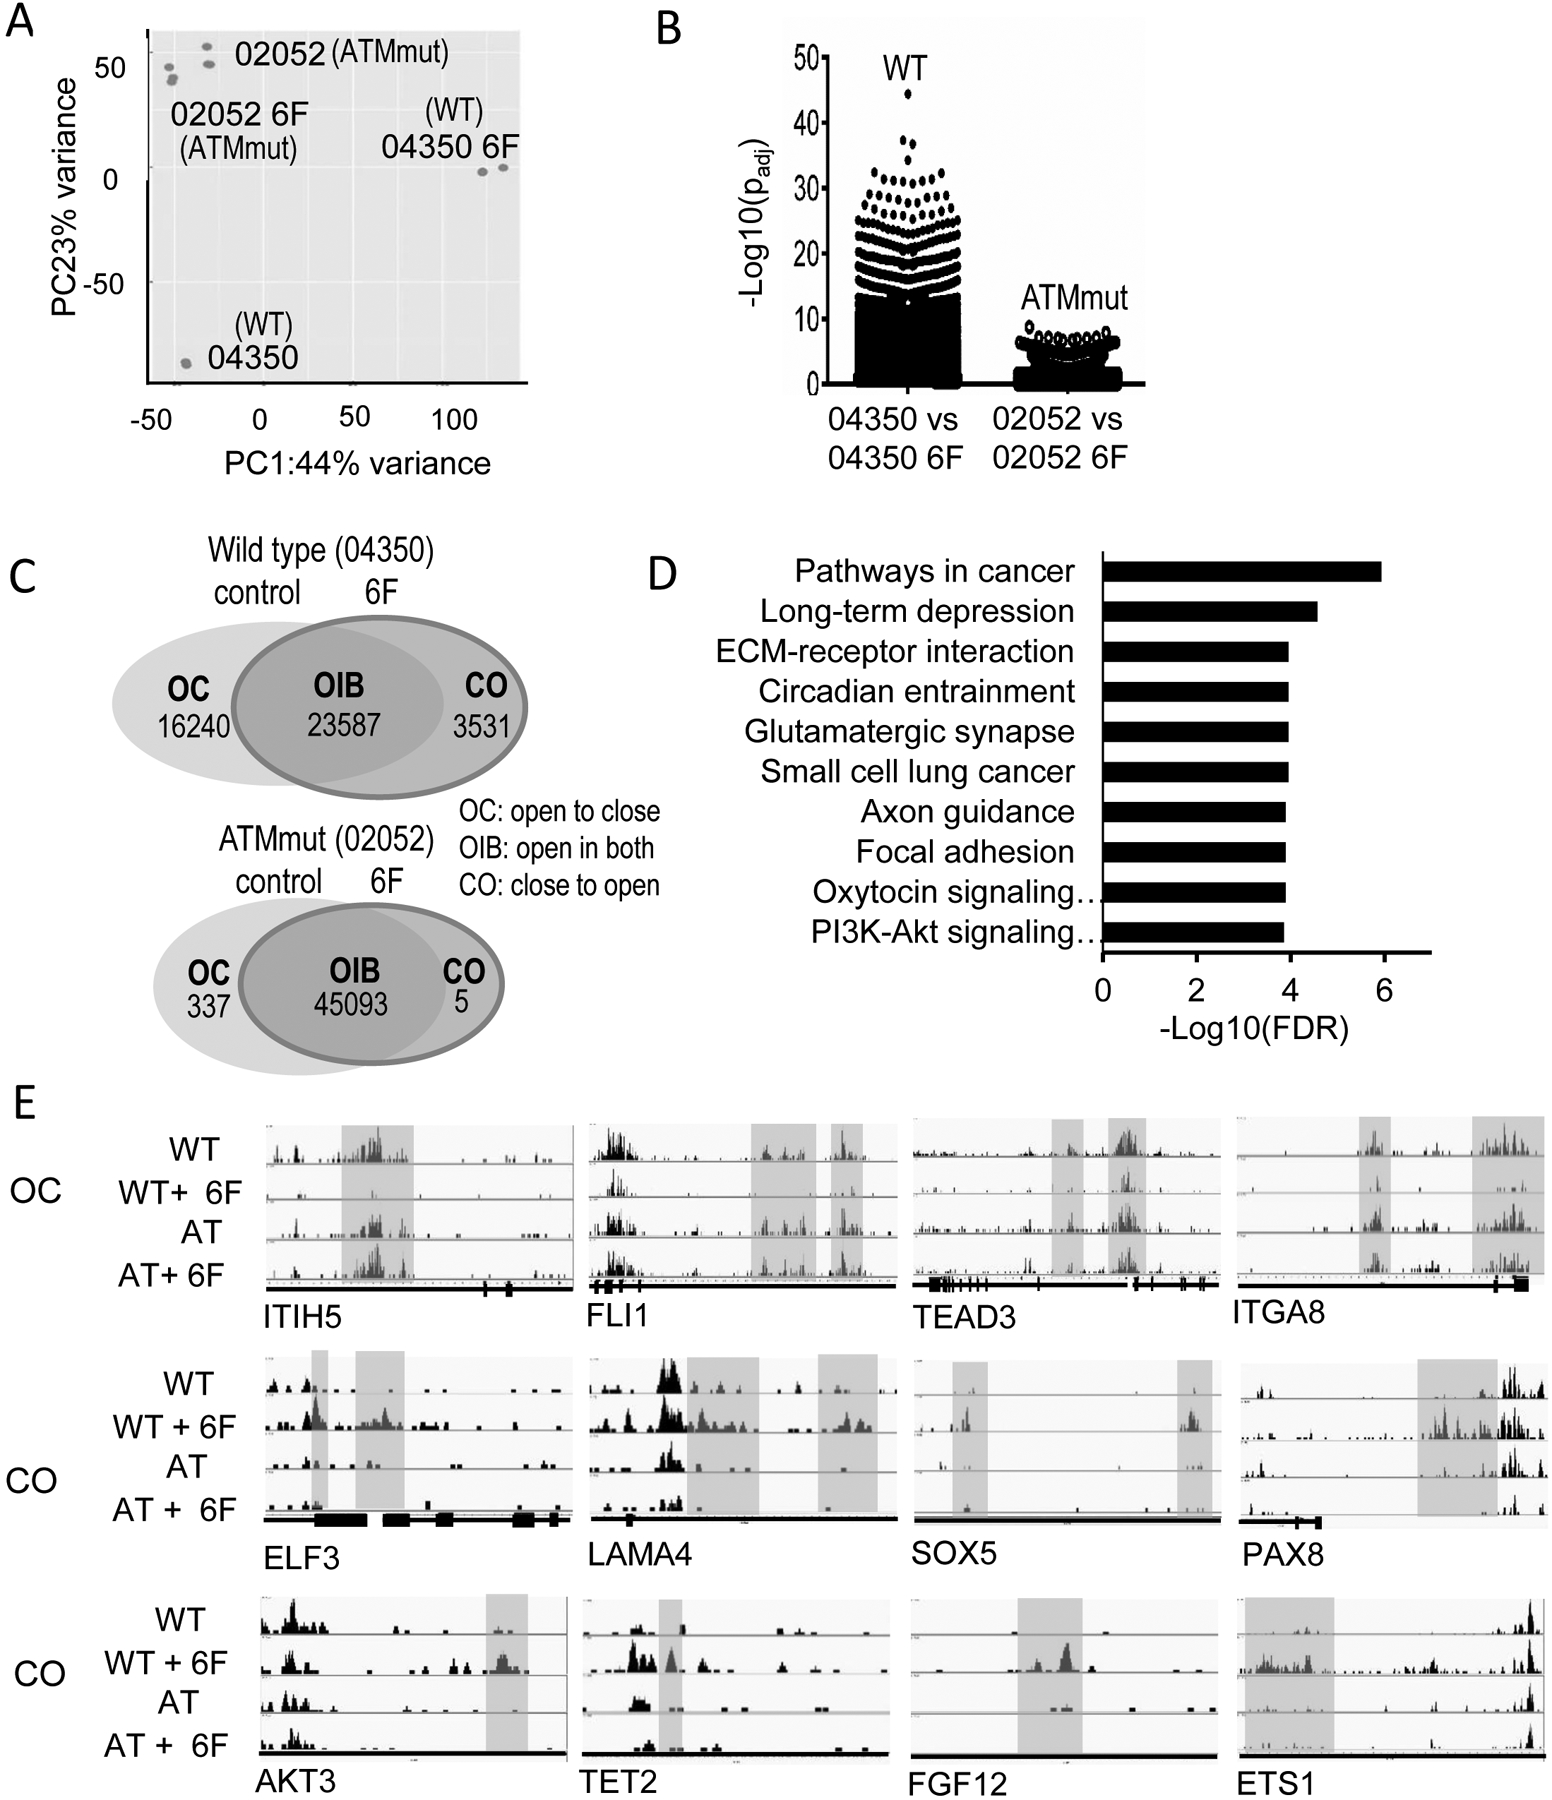
A) PCA analysis of the ATACs-seq data from normal (04350) and ATM mutant (02052) fibroblasts before and 6-factor oncogene transduction. N=3 for each group.
B) The significant changes in accessibility in normal and ATM mutant fibroblasts cells transduced with MPORCC.
C) Venn diagram of number of gene regions recognized in ATAC-seq before and (30 days) after transduction of 6-factor oncogene cocktail (MPORCC).
D) KEGG pathway analysis of 1571 identifiable genes (from 3531 chromosomal locations indicated in Fig.4B) that transitioned from closed to open status in normal human fibroblasts transduced with MPORCC.
E) Examples of gene locations that transitioned from open to close (OC) or from close to open (CO).
We also carried out ATAC seq analysis of MPOR-transduced wild type and ATMKO HFF-hTERT cells. Similar to MPORCC-transduced primary fibroblast cells, PCA analysis of the ATAC-seq data indicated that ATM deficiency reduced oncogene-induced changes in accessible genomic sites (Supplementary Fig. 5A, B). This was further confirmed when changes in accessible sites were enumerated (combined numbers of genes with OC and CO changes) (Supplementary Fig. S5C, D). Our ATAC-seq data therefore strongly suggest that ATM enabled chromatin access by the oncogenic factors during oncogene induced transformation.
Further verification of ATM in mediating transcriptional activation and a potential role of KAP1 in oncogene-mediated transformation of human fibroblasts.
To provide further proof that ATM is important for chromatin access, we determined the transcriptional levels of hTERT, the telomerase gene in MPORCC-transduced control and ATM deficient primary human fibroblast cells. The hTERT gene has been shown to be re-activated in almost 90% human tumor cells but inactive in the vast majority of untransformed somatic cells. Our results indicated that transcription levels (Fig. 5A) as well as telomerase activities (Fig. 5B) of hTERT were significantly activated in control primary fibroblast cells after MPORCC transduction. Transcriptional activation occurred in a time dependent manner (Supplementary Fig. S6A). In contrast, MPORCC transduction into ATM deficient primary fibroblasts failed to activate hTERT transcription (Fig. 5A and Supplementary Fig. S6A). Our result here thus confirmed the critical role of ATM in facilitating the transcriptional activation of hTERT, a nearly obligatory factor for oncogenic transformation of human cells.
Fig.5. Key roles of ATM in hTERT activation and oncogene-induced transformation.
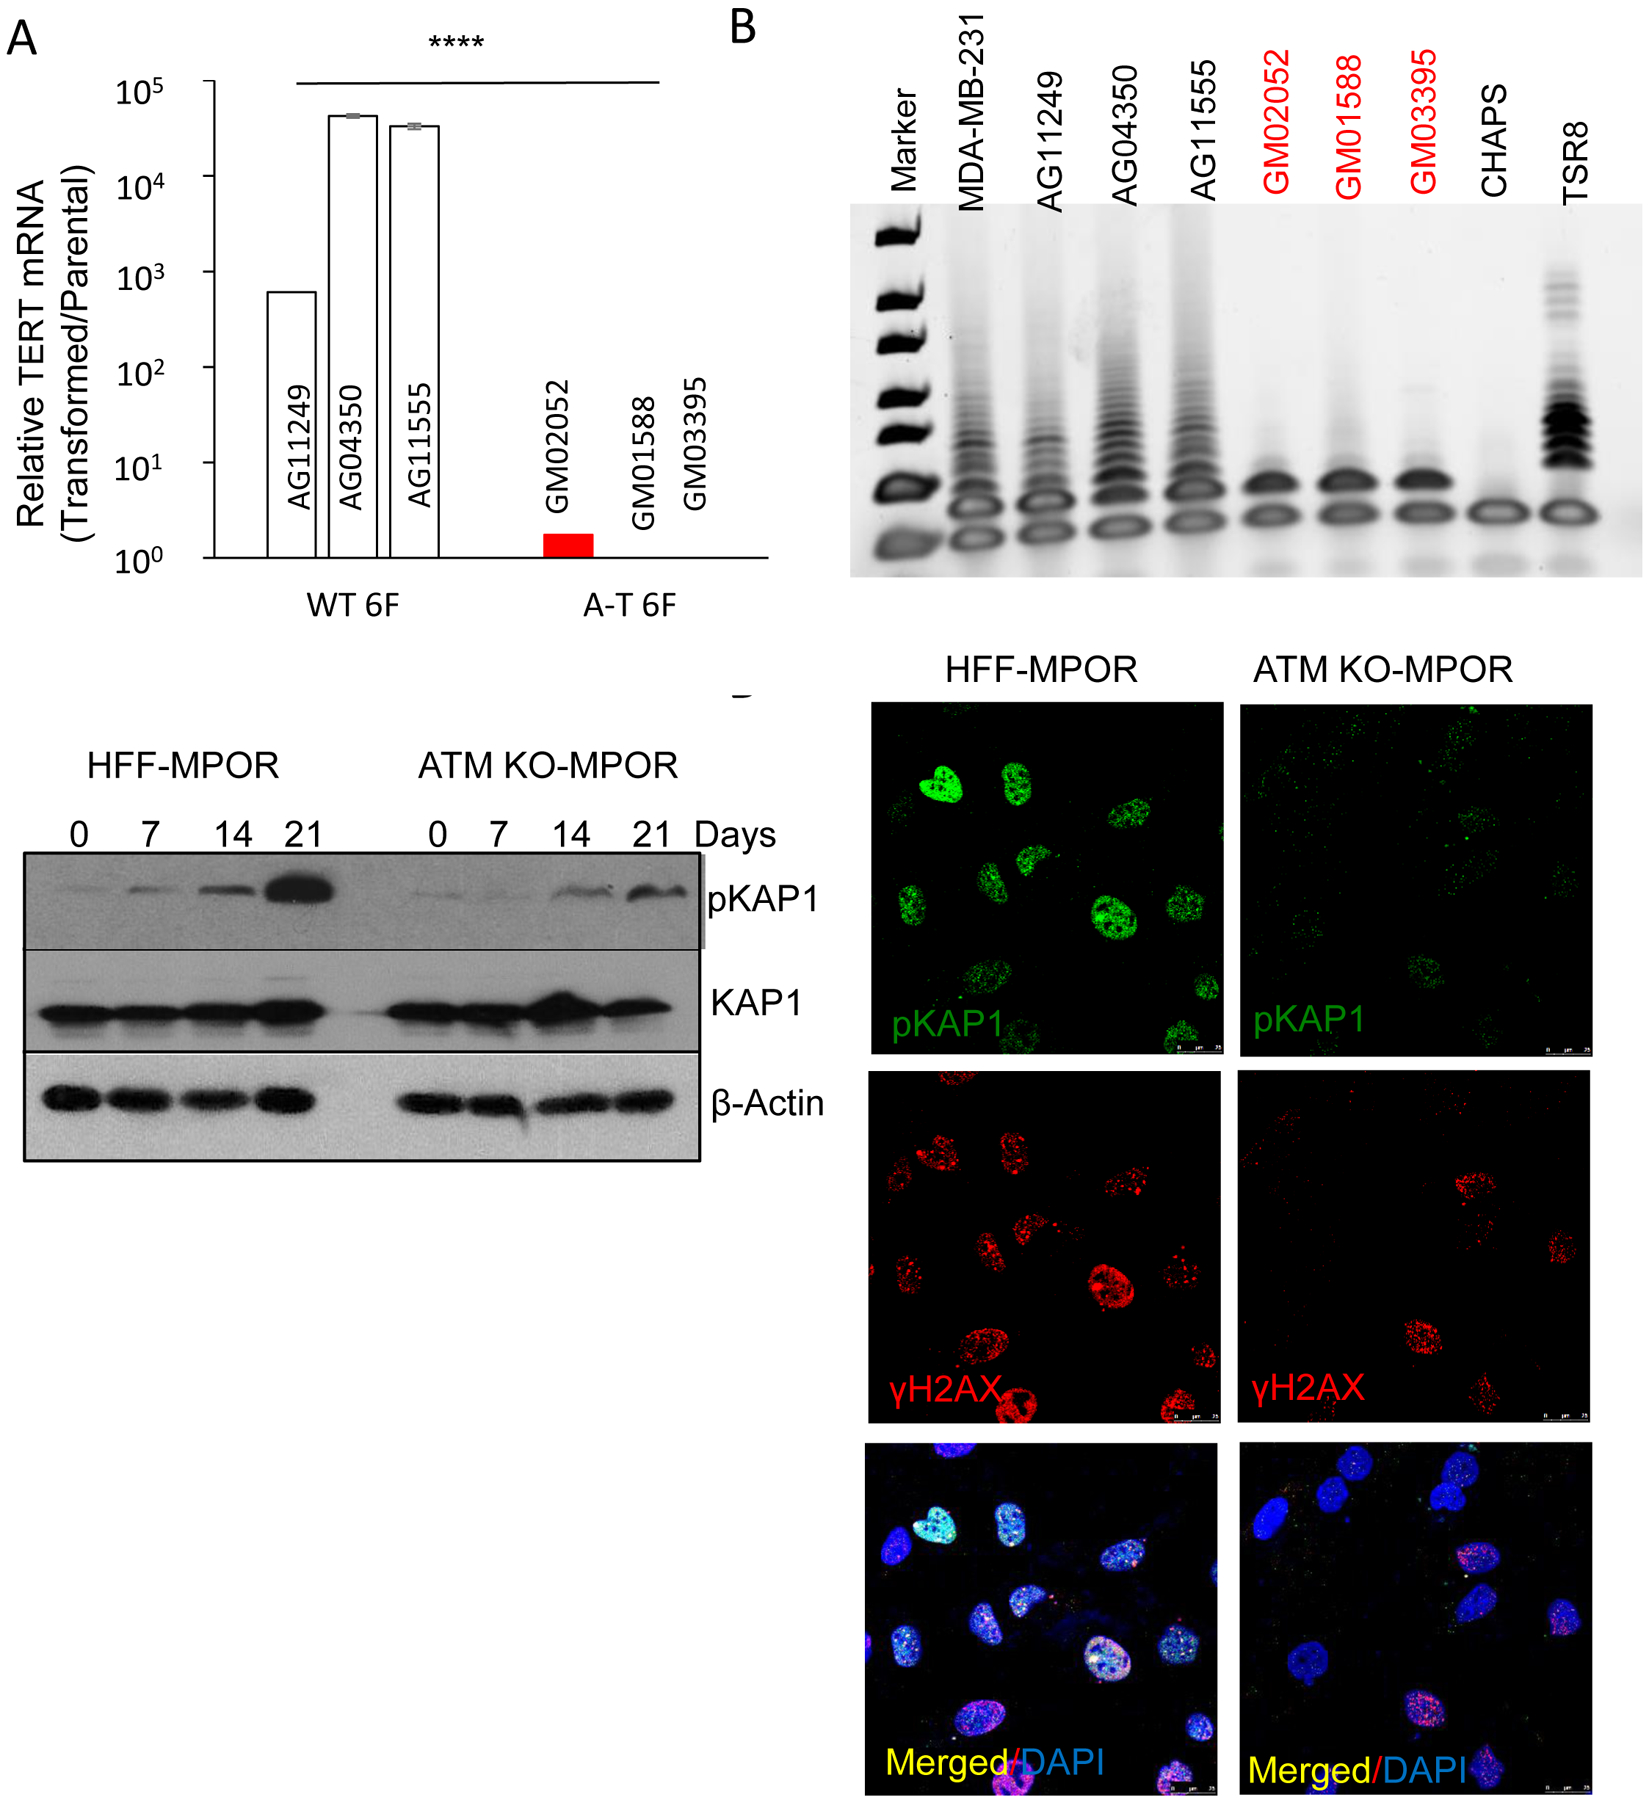
A). Relative levels of endogenous hTERT mRNA transcript levels in MPORCC transduced primary fibroblast cells from normal adults and A-T patients. n=3. Error bars represent SEM, ****p<0.001, unpaired t test.
B). TRAP evaluation for telomerase activities in MPORCC transduced primary fibroblast cells from normal adults and A-T patients. MDA-MB-231 is an established breast cancer cell line used as a positive control. CHAPS is a buffer used as negative control. TSR8 is manufacturer provided positive control.
C), Western blot analysis of phosphorylated KAP1 during the course of MPOR transduced parental and ATM deficiency HFF cells.
D). Immunofluorescence staining of phosphorylated KAP1 and H2AX in MPOR transduced parental and ATM deficiency HFF cells on Day21.
Our observation that ATM deficiency could profoundly affect global access of the oncogenic transcription factors to the chromatin, in combination with the constitutive presence of double strand breaks in human fibroblast cells after oncogene expression, led us to surmise that, KAP1, a chromatin-regulating protein and a key downstream factor for ATM in the DNA damage response, might be involved. KAP1 plays key roles in maintaining heterochromatin and is a key part of the cellular machinery that keeps the heterochromatin in a locked state (47). If double strand breaks are incurred in the heterochromatin regions, such as after exposure to ionizing radiation, KAP1 is phosphorylated rapidly in an ATM-dependent manner at the Ser824 site (24). Its phosphorylation leads to relaxed chromatin around the DSBs to allow for the cellular DNA repair machinery to access the DNA strand breaks in the heterochromatin and repair them (24,25). Thus it is possible that persistent DSBs induced by oncogene transduction (Fig. 1) activates ATM, which phosphorylate KAP1 persistently. Such persistent KAP1 phosphorylation may then relax the chromatin in a prolonged manner, which enables oncogenic transcriptional reprogramming.
Western blot analysis was conducted to examine the status of KAP1 during oncogene induced transformation (Fig. 5A). Our results indicate in control HFF cells, MPOR transduction changed KAP1 from a barely phosphorylated state to a heavily phosphorylated one in a time-dependent manner (Fig. 5C, left lanes). In comparison, KAP1 phosphorylation occurred much slower and to a much lesser extent in ATMKO HFF cells, especially at 21 days post gene transduction (Fig. 5C, right lanes). For comparison, we exposed the control and ATMKO HFF cells to ionizing radiation (x-rays at 3 Gy). In irradiated HFF cells, KAP1 phosphorylation occurred rapidly and peaks at around 1hr and was gone by 5 hrs (Supplementary Fig. S6B, left lanes). In ATMKO HFF cells, KAP1 phosphorylation occurred slower and at significantly reduced levels (Supplementary Fig.S6B, right lanes), consistent with previous observations (24). Immunofluorescence analysis confirmed the western blot analysis. Both phosphorylated KAP1 and γH2AX foci were observed prominently in control HFF cells at 21 days post MPOR transduction (Fig. 5D, left panels; and Supplementary Fig. S6C, top panels). In comparison, MPOR-transduced ATMKO cells showed significantly less KAP1 phosphorylation and very few γH2AX foci staining (Fig. 5D, right panels; and Supplementary Fig. 6C, lower panels;). This is consistent with previous reports that both KAP1 (24,25) and H2AX (48) depend on ATM for phosphorylation after DNA damage.
In order to determine if KAP1 is functionally required in oncogene-induced transformation, we generated to KAP1 knockout HFF cells by use of CRISPR/Cas9 technology (Supplementary Fig. 6D). We then attempted to transform the knockout cells with MPOR. Our results indicated that KAP1 deficiency significantly deceased MPOR-induced transformation of HFF cells (Supplementary Fig. 6E).
To determine if KAP1 phosphorylation is required for oncogene-induced transformation, two mutant versions of KAP1 were transduced together with MPOR into ATMKO HFF cells, respectively (Supplementary Fig. S6F, G). Our results indicate that ectopic expression of KAP1(S824D), a phospho- mimic of KAP1 that simulated a constitutively phosphorylated form of KAP1, could rescue the lack of MPOR-induced transformation in ATMKO cells. This was reflected both in terms of morphological transformation (Supplementary Fig. 6F) and growth in soft agar (Supplementary Fig. 6G). In contrast, co-transduction of KAP1(S824A), which could not be phosphorylated, could not rescue MPOR’s failure to transform ATMKO cells. These results thus suggest that ATM-dependent KAP1 phosphorylation and chromatin relaxation is a key downstream event in oncogene-induced transformation of HFF fibroblasts.
To provide further proof that KAP1 phosphorylation is important for chromatin access, we determined the transcriptional levels of hTERT, in MPORCC-transduced ATM deficient primary human fibroblast cells. Co-transduction of KAP1 (S824D), but not KAP1(S824A) enhanced MPORCC-induced hTERT transcription in AT-deficient cells GM02052 (Supplementary Fig. 6H). Our results were thus consistent with the hypothesis that ATM-dependent KAP1 phosphorylation and chromatin relaxation is a key downstream event in oncogene induced transformation of HFF fibroblasts.
Relevance of ATM in mouse and human malignancies
So far our data has been generated mostly from human fibroblasts in vitro. In order to determine if our findings could be extended to in vivo tumorigenesis models, we examined the effect of ATM on carcinogenesis in the MMTV-PyMT transgenic carcinogenesis model. In this model, the expression of polyoma middle T antigen (PyMT) is driven by the mouse mammary tumor virus promoter (MMTV). These mice develop mammary tumors readily (100%). Our data indicated ATM attenuation (in the ATM+/− heterozygous genetic background) significantly delayed the onset of mammary tumorigenesis (Fig. 6A) when compared with wild type mice. In addition, the survival of tumor-bearing mice was also extended in the ATM heterozygous background (Fig. 6B). Furthermore, mice in the ATM heterozygous background also showed reduced tumor numbers (Fig. 6C) and tumor mass (Fig. 6D) when compared with wild type mice. Those data thus clearly indicated that our findings in vitro in human fibroblasts also extended to in vivo tumorigenesis models.
Fig. 6. A facilitative role for ATM in MMTV-PyMT induced mouse mammary tumorigenesis.
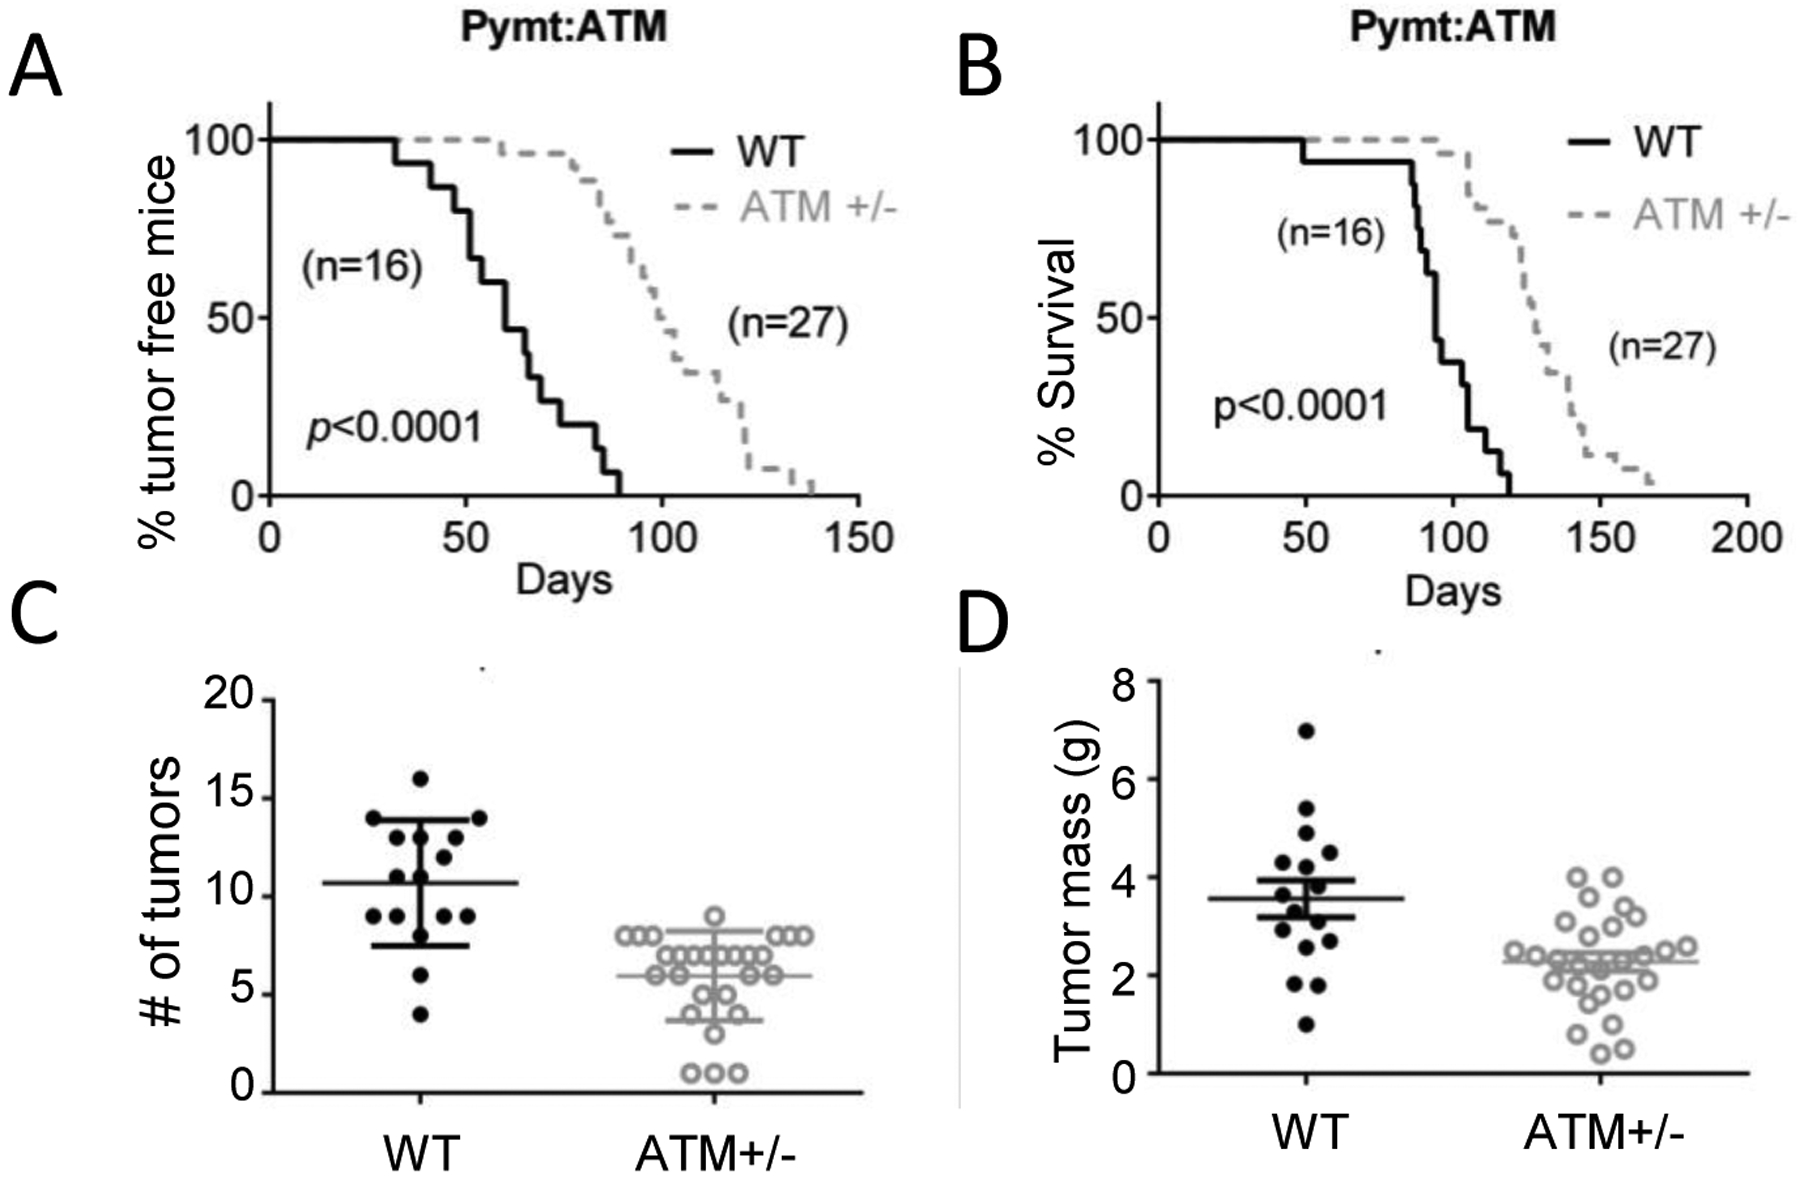
A). Kaplan-Meier plot showing the percentage of tumor-free mice in wild type (WT) and ATM heterozygous (ATM+/−) MMTV-PyMT transgenic mice. Log-rank test.
B). Kaplan-Meier plot showing the survival rate of wild type (WT) and ATM heterozygous (ATM+/−) MMTV-PyMT transgenic mice. Mice were sacrificed when the diameter of any of its tumors reaches 1.5cm. Log-rank test.
C). Numbers of tumors per mouse in wild type (WT) and ATM heterozygous (ATM+/−) MMTV-PyMT transgenic mice. The difference between the two groups is statistically significant (p<0.0001, unpaired t test).
D). Weights of tumors in wild type (WT) and ATM heterozygous (ATM+/−) MMTV-PyMT transgenic mice. The difference between the two groups is statistically significant. (p=0.0014, unpaired t test).
To further determine if our findings also apply for human tumors, we analyzed the RNA expression data in from 30435 GSM data sets with matched human normal and tumor tissue samples (Supplementary Table S4). Our analysis indicated that ATM expression was significantly higher (tumor vs normal tissues) in 6 out of 11 tumor types, significantly lower in two tumor types, and no difference in three tumor types (Supplementary Fig. 7). Thus in most solid tumors ATM’s expression patterns are consistent with its role as a tumor promoter, as our study suggests. Interestingly, ATM expression is lower in blood-borne cancers, consistent with its roles as a tumor suppressor in leukemia and lymphomas. Taken together, our data thus support a pro-carcinogenesis role for ATM in both mouse and human solid tumors.
Discussion
ATM has so far been considered a tumor suppressor gene that mostly serves a “caretaker” role in signaling DNA repair for DNA double strand breaks, especially in the heterochromatin regions (24,25). Our finding of ATM playing a crucial role in facilitating, rather than suppressing oncogene induced transformation of human and mouse cells is certainly unexpected and counter intuitive. It also underscores the complicated nature of ATM’s cellular functions.
While ATM clearly behaves like a classical tumor suppressor in lymphoma and leukemia, its role in solid tumors is very limited and controversial. To date, only a very modest risk for breast cancer (~2 fold) was observed in positive studies and none has been observed for other solid tumors (19). In contrast, mutation carriers of BRCA, another DNA double strand break repair factor, have a 9–36 fold increase in breast cancer and 6–61 fold increase in ovarian cancer, and significant increases in a host of other cancers (49). Mutation carriers of p53, the most commonly mutated tumor suppressor gene, have dramatic increases in multiple cancers (50). Those data are clearly at odds with the central role of ATM as a guardian of genome stability similar to p53. Our finding of ATM being a key facilitator in malignant transformation provides plausible explanation: ATM is a double-edged sword in carcinogenesis. On the one hand, its deficiencies lead to genomic instability and increased likelihood of mutations in oncogenes and tumor suppressor genes. On the other hand, it also prevented a major means for oncogenes to drive transcriptional reprograming that is necessary for cellular transformation. This latter property is consistent with several studies published on significantly reduced likelihood of success in induction of iPS cells from human fibroblasts with ATM deficiencies by use Yamanaka factors (44).
The counter-intuitive role of ATM in facilitating oncogenic transformation rather than preventing it also calls for a major revision of our current thinking of carcinogenesis. At present it is still a common belief that the key to carcinogenesis lies in mutations in oncogenes and tumor suppressor genes. Although it was generally recognized that epigenetic regulations play key roles, it was unclear how important epigenetics changes/transcriptional reprogramming is in the overall carcinogenic process. The present study clearly demonstrates the critical roles of chromatin access and transcriptional reprogramming in oncogene-mediated transformation of human fibroblasts. Despite robust expression of potent oncogenes (Myc, p53DD, Oct4, Ras, cyclinD, Cdk4) that in theory endowed the host cells with all genetic factors needed to become malignant cancer cells, ATM deficiency prevented host cells from becoming tumorigenic. Such striking data indicate that transcriptional reprogramming is clearly essential for oncogenic transformation. Most surprisingly, reprogramming is achieved through DDR machinery, which previously were mostly thought of as a bulwark against genomic instability and oncogenic transformation. Thus the importance of DNA double strand breaks in carcinogenesis has to be re-evaluated. In addition to being a major source of gene and chromosomal mutations that are clearly important in carcinogenesis, they also play critical roles in facilitating epigenetic reprogramming by activating the DNA damage response and relaxing the chromatin, which allows the oncogenes to access their target genes.
There were some limitations of our studies: 1) our in vitro studies were done in human fibroblast cells, which was used for their robust growth properties, while most human malignancies are of the epithelial origin; 2) our in vivo carcinogenesis experiments were conducted using heterozygous ATMKO mice, which did not exactly recapitulate the ATMKO genotype of the in vitro experiments. This was mainly because full ATMKO mice usually die of lymphoma/leukemia before they have a chance to develop solid malignancies. In future experiments, a Cre-Lox mediated knockout of ATMKO model might replicate the in vitro oncogenic transformation experiments more closely.
In summary, our study provides compelling evidence that ATM, instead of being a pure tumor suppressor gene, can unexpectedly act as a facilitating factor in oncogene-induced transformation of human and mouse cells. Our findings also suggest that we need to re-consider the consequences of DNA double strand breaks and ensuing DNA damage response in oncogene-induced carcinogenesis. In addition to their well-established roles in causing mutations and chromosomal aberrations, DSB- and DDR-induced chromosomal relaxation and chromatin access should now be considered significant risk factors in promoting carcinogenesis.
Supplementary Material
Acknowledgments
The study is supported in part by grants ES024015, CA208852, CA216876 from US National Institutes of Health (to C-Y. Li). It is also supported by grant 81572788 from the National Natural Science Foundation of China (to X.Liu). We thank Drs. Michael Kastan and Don Fleenor for providing us with HFF-hTERT and HFF-hTERT-ATM-KO fibroblast cell lines. We also thank Dr. Zhaohui Wang and Hai Yan for help with the telomerase activity assay. We thank Dr. Michael Kastan for critical reading of our manuscript. The authors thank Drs. James Thomson, Shinya Yamanaka, and Christopher Counter for making their plasmids available through Addgene.
Footnotes
Competing financial interests
The authors declare no competing interests.
Statement of Significance
Findings uncover a novel pro-oncogenic role for ATM and show that contrary to established theory, ATM does not always function as a tumor suppressor, its function is however dependent on cell type.
References
- 1.Chun HH, Gatti RA. Ataxia-telangiectasia, an evolving phenotype. DNA Repair (Amst) 2004;3:1187–96 [DOI] [PubMed] [Google Scholar]
- 2.Savitsky K, Bar-Shira A, Gilad S, Rotman G, Ziv Y, Vanagaite L, et al. A single ataxia telangiectasia gene with a product similar to PI-3 kinase. Science 1995;268:1749–53 [DOI] [PubMed] [Google Scholar]
- 3.Canman CE, Lim DS, Cimprich KA, Taya Y, Tamai K, Sakaguchi K, et al. Activation of the ATM kinase by ionizing radiation and phosphorylation of p53. Science 1998;281:1677–9 [DOI] [PubMed] [Google Scholar]
- 4.Lim DS, Kim ST, Xu B, Maser RS, Lin J, Petrini JH, et al. ATM phosphorylates p95/nbs1 in an S-phase checkpoint pathway. Nature 2000;404:613–7 [DOI] [PubMed] [Google Scholar]
- 5.Hirao A, Cheung A, Duncan G, Girard PM, Elia AJ, Wakeham A, et al. Chk2 is a tumor suppressor that regulates apoptosis in both an ataxia telangiectasia mutated (ATM)-dependent and an ATM-independent manner. Mol Cell Biol 2002;22:6521–32 [DOI] [PMC free article] [PubMed] [Google Scholar]
- 6.Matsuoka S, Ballif BA, Smogorzewska A, McDonald ER 3rd, Hurov KE, Luo J, et al. ATM and ATR substrate analysis reveals extensive protein networks responsive to DNA damage. Science 2007;316:1160–6 [DOI] [PubMed] [Google Scholar]
- 7.Morales M, Theunissen JW, Kim CF, Kitagawa R, Kastan MB, Petrini JH. The Rad50S allele promotes ATM-dependent DNA damage responses and suppresses ATM deficiency: implications for the Mre11 complex as a DNA damage sensor. Genes Dev 2005;19:3043–54 [DOI] [PMC free article] [PubMed] [Google Scholar]
- 8.Denchi EL, de Lange T. Protection of telomeres through independent control of ATM and ATR by TRF2 and POT1. Nature 2007;448:1068–71 [DOI] [PubMed] [Google Scholar]
- 9.Rotman G, Shiloh Y. ATM: a mediator of multiple responses to genotoxic stress. Oncogene 1999;18:6135–44 [DOI] [PubMed] [Google Scholar]
- 10.Dornan D, Shimizu H, Mah A, Dudhela T, Eby M, O’Rourke K, et al. ATM engages autodegradation of the E3 ubiquitin ligase COP1 after DNA damage. Science 2006;313:1122–6 [DOI] [PubMed] [Google Scholar]
- 11.Xu B, O’Donnell AH, Kim ST, Kastan MB. Phosphorylation of serine 1387 in Brca1 is specifically required for the Atm-mediated S-phase checkpoint after ionizing irradiation. Cancer Res 2002;62:4588–91 [PubMed] [Google Scholar]
- 12.Wang Y, Cortez D, Yazdi P, Neff N, Elledge SJ, Qin J. BASC, a super complex of BRCA1-associated proteins involved in the recognition and repair of aberrant DNA structures. Genes Dev 2000;14:927–39 [PMC free article] [PubMed] [Google Scholar]
- 13.Taylor AM, Metcalfe JA, Thick J, Mak YF. Leukemia and lymphoma in ataxia telangiectasia. Blood 1996;87:423–38 [PubMed] [Google Scholar]
- 14.Swift M, Reitnauer PJ, Morrell D, Chase CL. Breast and other cancers in families with ataxia-telangiectasia. N Engl J Med 1987;316:1289–94 [DOI] [PubMed] [Google Scholar]
- 15.FitzGerald MG, Bean JM, Hegde SR, Unsal H, MacDonald DJ, Harkin DP, et al. Heterozygous ATM mutations do not contribute to early onset of breast cancer. Nat Genet 1997;15:307–10 [DOI] [PubMed] [Google Scholar]
- 16.Stankovic T, Kidd AM, Sutcliffe A, McGuire GM, Robinson P, Weber P, et al. ATM mutations and phenotypes in ataxia-telangiectasia families in the British Isles: expression of mutant ATM and the risk of leukemia, lymphoma, and breast cancer. Am J Hum Genet 1998;62:334–45 [DOI] [PMC free article] [PubMed] [Google Scholar]
- 17.Inskip HM, Kinlen LJ, Taylor AM, Woods CG, Arlett CF. Risk of breast cancer and other cancers in heterozygotes for ataxia-telangiectasia. Br J Cancer 1999;79:1304–7 [DOI] [PMC free article] [PubMed] [Google Scholar]
- 18.Olsen JH, Hahnemann JM, Borresen-Dale AL, Brondum-Nielsen K, Hammarstrom L, Kleinerman R, et al. Cancer in patients with ataxia-telangiectasia and in their relatives in the nordic countries. J Natl Cancer Inst 2001;93:121–7 [DOI] [PubMed] [Google Scholar]
- 19.Renwick A, Thompson D, Seal S, Kelly P, Chagtai T, Ahmed M, et al. ATM mutations that cause ataxia-telangiectasia are breast cancer susceptibility alleles. Nat Genet 2006;38:873–5 [DOI] [PubMed] [Google Scholar]
- 20.Liu X, Li F, Huang Q, Zhang Z, Zhou L, Deng Y, et al. Self-inflicted DNA double-strand breaks sustain tumorigenicity and stemness of cancer cells. Cell Res 2017;27:764–83 [DOI] [PMC free article] [PubMed] [Google Scholar]
- 21.Stagni V, Manni I, Oropallo V, Mottolese M, Di Benedetto A, Piaggio G, et al. ATM kinase sustains HER2 tumorigenicity in breast cancer. Nat Commun 2015;6:6886. [DOI] [PubMed] [Google Scholar]
- 22.Gallmeier E, Hermann PC, Mueller MT, Machado JG, Ziesch A, De Toni EN, et al. Inhibition of ataxia telangiectasia- and Rad3-related function abrogates the in vitro and in vivo tumorigenicity of human colon cancer cells through depletion of the CD133(+) tumor-initiating cell fraction. Stem Cells 2011;29:418–29 [DOI] [PubMed] [Google Scholar]
- 23.Li F, Liu X, Sampson JH, Bigner DD, Li CY. Rapid Reprogramming of Primary Human Astrocytes into Potent Tumor-Initiating Cells with Defined Genetic Factors. Cancer Res 2016;76:5143–50 [DOI] [PMC free article] [PubMed] [Google Scholar]
- 24.Ziv Y, Bielopolski D, Galanty Y, Lukas C, Taya Y, Schultz DC, et al. Chromatin relaxation in response to DNA double-strand breaks is modulated by a novel ATM- and KAP-1 dependent pathway. Nat Cell Biol 2006;8:870–6 [DOI] [PubMed] [Google Scholar]
- 25.Goodarzi AA, Noon AT, Deckbar D, Ziv Y, Shiloh Y, Lobrich M, et al. ATM signaling facilitates repair of DNA double-strand breaks associated with heterochromatin. Mol Cell 2008;31:167–77 [DOI] [PubMed] [Google Scholar]
- 26.Cifone MA, Fidler IJ. Correlation of patterns of anchorage-independent growth with in vivo behavior of cells from a murine fibrosarcoma. Proc Natl Acad Sci U S A 1980;77:1039–43 [DOI] [PMC free article] [PubMed] [Google Scholar]
- 27.Bellows CG, Aubin JE. Determination of numbers of osteoprogenitors present in isolated fetal rat calvaria cells in vitro. Dev Biol 1989;133:8–13 [DOI] [PubMed] [Google Scholar]
- 28.Martin M Cutadapt Removes Adapter Sequences from High-Throughput Sequencing Reads. EMBnet Journal 2011;17:10–2 [Google Scholar]
- 29.Kersey PJ, Staines DM, Lawson D, Kulesha E, Derwent P, Humphrey JC, et al. Ensembl Genomes: an integrative resource for genome-scale data from non-vertebrate species. Nucleic Acids Res 2012;40:D91–7 [DOI] [PMC free article] [PubMed] [Google Scholar]
- 30.Dobin A, Davis CA, Schlesinger F, Drenkow J, Zaleski C, Jha S, et al. STAR: ultrafast universal RNA-seq aligner. Bioinformatics 2013;29:15–21 [DOI] [PMC free article] [PubMed] [Google Scholar]
- 31.Love MI, Huber W, Anders S. Moderated estimation of fold change and dispersion for RNA-seq data with DESeq2. Genome Biol 2014;15:550. [DOI] [PMC free article] [PubMed] [Google Scholar]
- 32.Huber W, Carey VJ, Gentleman R, Anders S, Carlson M, Carvalho BS, et al. Orchestrating high-throughput genomic analysis with Bioconductor. Nat Methods 2015;12:115–21 [DOI] [PMC free article] [PubMed] [Google Scholar]
- 33.Mootha VK, Lindgren CM, Eriksson KF, Subramanian A, Sihag S, Lehar J, et al. PGC-1alpha-responsive genes involved in oxidative phosphorylation are coordinately downregulated in human diabetes. Nat Genet 2003;34:267–73 [DOI] [PubMed] [Google Scholar]
- 34.Buenrostro JD, Giresi PG, Zaba LC, Chang HY, Greenleaf WJ. Transposition of native chromatin for fast and sensitive epigenomic profiling of open chromatin, DNA-binding proteins and nucleosome position. Nat Methods 2013;10:1213–8 [DOI] [PMC free article] [PubMed] [Google Scholar]
- 35.Langmead B, Trapnell C, Pop M, Salzberg SL. Ultrafast and memory-efficient alignment of short DNA sequences to the human genome. Genome Biol 2009;10:R25. [DOI] [PMC free article] [PubMed] [Google Scholar]
- 36.Zhang Y, Liu T, Meyer CA, Eeckhoute J, Johnson DS, Bernstein BE, et al. Model-based analysis of ChIP-Seq (MACS). Genome Biol 2008;9:R137. [DOI] [PMC free article] [PubMed] [Google Scholar]
- 37.Evan GI, Wyllie AH, Gilbert CS, Littlewood TD, Land H, Brooks M, et al. Induction of apoptosis in fibroblasts by c-myc protein. Cell 1992;69:119–28 [DOI] [PubMed] [Google Scholar]
- 38.Serrano M, Lin AW, McCurrach ME, Beach D, Lowe SW. Oncogenic ras provokes premature cell senescence associated with accumulation of p53 and p16INK4a. Cell 1997;88:593–602 [DOI] [PubMed] [Google Scholar]
- 39.Cong L, Ran FA, Cox D, Lin S, Barretto R, Habib N, et al. Multiplex genome engineering using CRISPR/Cas systems. Science 2013;339:819–23 [DOI] [PMC free article] [PubMed] [Google Scholar]
- 40.Singh SK, Clarke ID, Hide T, Dirks PB. Cancer stem cells in nervous system tumors. Oncogene 2004;23:7267–73 [DOI] [PubMed] [Google Scholar]
- 41.Tropepe V, Sibilia M, Ciruna BG, Rossant J, Wagner EF, van der Kooy D. Distinct neural stem cells proliferate in response to EGF and FGF in the developing mouse telencephalon. Dev Biol 1999;208:166–88 [DOI] [PubMed] [Google Scholar]
- 42.Ito K, Hirao A, Arai F, Matsuoka S, Takubo K, Hamaguchi I, et al. Regulation of oxidative stress by ATM is required for self-renewal of haematopoietic stem cells. Nature 2004;431:997–1002 [DOI] [PubMed] [Google Scholar]
- 43.Nayler S, Gatei M, Kozlov S, Gatti R, Mar JC, Wells CA, et al. Induced pluripotent stem cells from ataxia-telangiectasia recapitulate the cellular phenotype. Stem Cells Transl Med 2012;1:523–35 [DOI] [PMC free article] [PubMed] [Google Scholar]
- 44.Kinoshita T, Nagamatsu G, Kosaka T, Takubo K, Hotta A, Ellis J, et al. Ataxia-telangiectasia mutated (ATM) deficiency decreases reprogramming efficiency and leads to genomic instability in iPS cells. Biochem Biophys Res Commun 2011;407:321–6 [DOI] [PubMed] [Google Scholar]
- 45.Song H, Chung SK, Xu Y. Modeling disease in human ESCs using an efficient BAC-based homologous recombination system. Cell Stem Cell 2010;6:80–9 [DOI] [PubMed] [Google Scholar]
- 46.Starks RR, Biswas A, Jain A, Tuteja G. Combined analysis of dissimilar promoter accessibility and gene expression profiles identifies tissue-specific genes and actively repressed networks. Epigenetics Chromatin 2019;12:16. [DOI] [PMC free article] [PubMed] [Google Scholar]
- 47.Kepkay R, Attwood KM, Ziv Y, Shiloh Y, Dellaire G. KAP1 depletion increases PML nuclear body number in concert with ultrastructural changes in chromatin. Cell Cycle 2011;10:308–22 [DOI] [PubMed] [Google Scholar]
- 48.Burma S, Chen BP, Murphy M, Kurimasa A, Chen DJ. ATM phosphorylates histone H2AX in response to DNA double-strand breaks. J Biol Chem 2001;276:42462–7 [DOI] [PubMed] [Google Scholar]
- 49.Kauff ND, Mitra N, Robson ME, Hurley KE, Chuai S, Goldfrank D, et al. Risk of ovarian cancer in BRCA1 and BRCA2 mutation-negative hereditary breast cancer families. J Natl Cancer Inst 2005;97:1382–4 [DOI] [PubMed] [Google Scholar]
- 50.Li FP, Fraumeni JF Jr., Mulvihill JJ, Blattner WA, Dreyfus MG, Tucker MA, et al. A cancer family syndrome in twenty-four kindreds. Cancer Res 1988;48:5358–62 [PubMed] [Google Scholar]
Associated Data
This section collects any data citations, data availability statements, or supplementary materials included in this article.