

Abstract
It has tremendous values for both drug discovery and basic research to develop a solid bioinformatical tool for guiding peptide reagent design. Based on the physical and chemical properties of amino acids, a new strategy for peptide reagent design, the so‐called AABPD (amino acid based‐peptide design), is proposed. The peptide samples in a training dataset are described by a series of HMLP (heuristic molecular lipophilicity potential) parameters and other physicochemical properties of amino acid residues that form a three‐dimensional data matrix where each component is defined by three indexes: the first index refers to the peptide samples, the second to the amino acid positions, and the third to the amino acid parameters. The binding free energy between a peptide ligand and its protein receptor is calculated by a linear free energy equation through the physicochemical parameters, resulting in a set of simultaneous linear equations between the bioactivity of the peptides and the physicochemical properties of amino acids. An iterative double least square technique is developed for the solution of the three‐dimensional simultaneous linear equation set to determine the amino acid position coefficients of peptide sequence and the physicochemical parameter coefficients of amino acid residues alternately. The two sets of coefficients thus obtained are used for predicting the bioactivity of other query peptide reagents. Two calculation examples, the peptide substrate specificity of the SARS coronavirus 3C‐like proteinase and the affinity prediction for epitope‐peptides with Class I MHC molecules are studied by using the peptide reagent design strategy. © 2007 Wiley Periodicals, Inc. J Comput Chem, 2007
Keywords: peptides, amino acids, drug design, QSAR, SARS, class I MHC
Introduction
The elucidation of the human genome has revitalized the interest in using proteins or pieces of proteins (peptides) for the treatment of presently incurable diseases.1, 2, 3 Human diseases for which the peptide‐based drug therapies are applied include osteoporosis (calcitonin), diabetes (insulin), prostate cancer and endometriosis (gonadotropin‐releasing hormone), acromegaly and ulcers (somatostatin), as well as hypothyroidism (thyrotropin‐releasing hormone, TRH).1, 4 The brain, as a major control center, is an important target for many pharmaceutical drugs, such as opioid peptide analogues designed for the treatment of pain, neuropeptides and growth peptides for the treatment of neurological disorders. One of the recently most remarkable examples of peptide drugs is the HIV fusion inhibitor T‐20, which is a 36‐peptide derived from the structure of gp41 and practically used in clinical treatment for AIDS patients.5 HIV entry inhibitors6 are the first antiretroviral drugs in widespread clinical evaluation to target HIV replication at sites other than reverse transcriptase or protease as focused previously (see, e.g., Refs.7, 8, 9, 10, 11, 12, 13, 14). The HIV fusion inhibitors have received the fast‐track designation by the United States Food and Drug Administration because of the resistance of HIV to the drugs targeting on reverse transcriptase and protease. The successful implication of diverse peptides with special physiological activity in medicinal treatment has also increased the interest in exploiting peptides, peptide analogues, and peptide mimetics as therapeutic drugs.15, 16, 17, 18, 19, 20
Peptide reagent design may be one of the most challenging research topics in life science owing to the extremely large amount of possible arrangements. For example, for an octapeptide sample, the number of possible sequence arrangements13, 21 are 208 = 2.56 × 10¹⁰; for designing a peptide regent of 36 amino acids, the number of possible amino acid sequence arrangement would be 2036 = 6.87 × 1046. This is an astronomical number! Therefore, it is vitally important to develop a computational method to guide us for efficiently designing peptide reagents. The present study was initiated in an attempt to develop a rational peptide reagent design method on the basis of the physical and chemical properties of amino acids, particularly their heuristic molecular lipophilicity potential (HMLP) parameters.22, 23, 24 Unlike the purely statistical techniques in drug design that only pursue the statistical results without physical and chemical rationale, the HMLP approach has a solid theoretical foundation. Moreover, the prediction equations not only can indicate the bioactivity of a query peptide reagent but also can reveal the physical and chemical features for each of the subsites along the peptide sequence.
Theory and Method
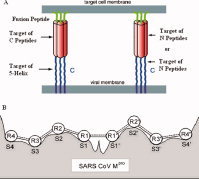
The calculation of interaction free energy between two peptides, or between a peptide and a protein, is a fundamental problem in protein science and medicinal chemistry. In this study, the peptide–protein interaction is simplified as the interaction between a peptide reagent P i and a target peptide P0, which is a segment of a protein receptor, or a set of amino acid residues at its active sites. The main idea of peptide–protein interaction is schematically illustrated in Figure 1, where panel A shows the peptide fusion inhibitors interacting with a part of the HIV‐1 gp41 envelope glycoprotein, and panel B shows the amino acid residues of peptide substrates interacting with the active sites of SARS coronavirus main protease.
Figure 1.
Protein and peptide targets of peptide reagents. (A) C peptides derived from the C‐region of gp41, such as C34, bind to the N‐region in its trimeric coiled‐coil state; the proteins NCCG‐gp41 and 5‐helix, which expose either the complete or a portion of the N‐region trimeric coiled‐coil in a stable form, bind to the C‐region. N peptides may target a vulnerable C‐helix region of gp41. Alternatively, the N peptides could intercalate with the N helices of gp41 to form a heterotrimeric coiled‐coil and interfere with the coiled‐coil formation of gp41. (B) Interaction between peptide substrate and SARS coronavirus main protease. The amino acid residues of peptide substrates interact with the active sites of SARS coronavirus main protease. Figure 1B was adapted from Figure 2 of Chou (Ref.13, with permission from Academic Press). [Color figure can be viewed in the online issue, which is available at www.interscience.wiley.com.]
The binding free energy ΔG between peptide P i and its target peptide P0 is considered as the summation of interactions from all residue pairs of two peptides at the corresponding sequence positions; i.e.,
| (1) |
where Δg i,α is the interaction free energy of residue pair at position α of peptide Pi and target peptide P0, and M is the total number of residue pairs involved. The binding free energy Δg i,α from different residue pairs may have different weights to the total free energy ΔG due to their different microenvironments and different roles in bioactivity. We use a set of sensitive coefficients {b α } to describe their microenvironments of residues. The binding free energy Δg i,α of residue pair α is described by a series of physical and chemical properties of amino acids. In this study we use the heuristic molecular lipophilicity potential (HMLP) parameters of amino acids through the following linear free energy equation22, 23, 24:
| (2) |
where R
0,i,α
is the distance between peptide P
i
and peptide P0 at residue position α, and γ is an exponent. In eq. (2), H
i,α
and L
i,α are respectively the hydrophilic parameter and lipophilic parameter of residue α in peptide P
i
;
 and
and  are the surface areas of residue α with hydrophilic potential and lipophilic potential, respectively. Similarly, H
0,α
, L
0,α
,
are the surface areas of residue α with hydrophilic potential and lipophilic potential, respectively. Similarly, H
0,α
, L
0,α
,  , and
, and  are the HMLP parameters of target peptide P0. The HMLP parameters of amino acids were derived from the quantum chemical electrostatic potential with the ability to reflect the hydrophilic and lipophilic interactions of amino acid residues.25, 26, 27 The first term in eq. (2) describes the hydrophilic interactions, including the hydrogen bond interaction, ionic interaction, and dipole interaction; the second term describes the lipophilic interaction between amino acid residues; while the third and fourth terms describe the free energies from the solvation and dissolvation of amino acid residues, respectively. In eq. (2) we can add other terms that can affect the interaction or recognition between peptide ligand and protein receptor.
Actually, peptide P0 is a virtual target peptide, and we do not need to know its real chemical structure. If the HMLP parameters H
0,α
, L
0,α
,
 , and
, and  of the virtual target peptide P0 and the distance R
0,i,α
are assumed to be constants, eq. (2) will be reduced to a linear equation of the HMLP parameters of peptide P
i
; i.e.,
of the virtual target peptide P0 and the distance R
0,i,α
are assumed to be constants, eq. (2) will be reduced to a linear equation of the HMLP parameters of peptide P
i
; i.e.,
| (3) |
where v i,α,l denotes the l‐th HMLP parameter of peptide P i of amino acid residue at peptide position α. The role of the coefficients {a l } is the same as in traditional 2D‐QSAR. Inserting the Δg i,α of eq. (3) into eq. (1) and transferring the binding free energy ΔG to bioactivity pk i = −logk i = ΔG of peptide P i , we obtain the following simultaneous linear equations,
| (4) |
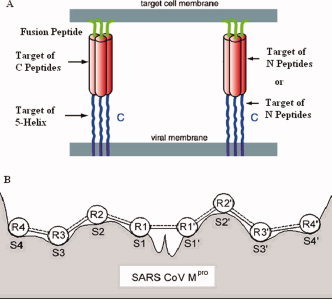
where N is the number of peptide samples, M is the number of amino acid residues in the peptides, and L is the number of physicochemical parameters of amino acid residues. In a training set of peptide reagents, the physicochemical parameters form a three‐dimensional data matrix, V N×M×L , as shown in Figure 2.
Figure 2.
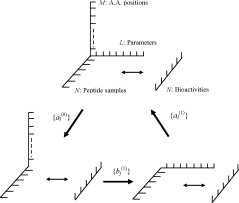
Schemetic illustration of the three‐dimensional data matrix and iterative double least square (IDLS) solution. N is the number of peptide samples, M is the number of amino acid residues in peptide, and L is the number of physicochemical parameters of amino acid residues.
Although the transformation from eq. (1) to eq. (4) is not a rigorous theoretical derivation, it can be used to explain the physical implication of the linear free energy equation and the functions of HMLP parameters and some theoretical considerations in our model. Like all other QSAR approaches, the linear free energy equation is not unique. However, we can refine the binding free energy by utilizing other linear free energy equations and including more parameters.
In eq. (4) there are two sets of coefficients: {a l } are sensitive coefficients of the physicochemical parameters, and {b α } are the sensitive coefficients of amino acid residue positions in peptides. An iterative double least square (IDLS) technique was developed to determine the values of the coefficient sets {a l } and {b α } alternately by solving the three‐dimensional simultaneous linear equations. By using a set of initial values of coefficients {a }, the three‐dimensional data matrix V N×M×L is reduced to a two‐dimensional data matrix D with the elements given by
| (5) |
Thus, the set of three‐dimensional simultaneous linear equations [eq. (4)] is reduced to a set of two‐dimensional equations, i.e.,
| (6) |
The above equation set can be solved by using the least square approach, yielding the first solutions of the sensitive coefficients
 . Then the values of
  are used to reduce the three‐dimensional data matrix V
N×M×L
to a two‐dimensional data matrix T
with the elements given by
are used to reduce the three‐dimensional data matrix V
N×M×L
to a two‐dimensional data matrix T
with the elements given by
| (7) |
Similarly, the set of three‐dimensional simultaneous linear equations [eq. (4)] is reduced to a set of two‐dimensional equations by eq. (7), as given by
| (8) |
The above equation can be solved by using the least square approach, leading to the solution of sensitive coefficients {a }. Then the values of {a } are used for the new solutions of the sensitive coefficients {b } of amino acid residue positions. The above procedure is performed iteratively for n steps, i.e., until reaching the converged solutions as denoted by {a } and {b }. Now, the values of {a } and {b } can be used to predict the bioactivities pk of the i‐th peptide reagent through the following equation:
| (9) |
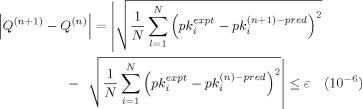
where the term b Δg i,α is the contribution of amino acid α of the i‐th peptide reagent to the bioactivity. The convergence criterion for the iterative procedure is given by the following equation
 |
(10) |
where Q (n) represents difference between the square root of the summation of squared differences between experimental bioactivities and the predicted bioactivities in the nth step, and Q (n+1) that in the (n + 1)th step.
Calculations and Results
In this section two calculation examples are used to prove the predictive power of AABPD. The HMLP parameters of the 20 natural amino acid residues are taken from our previous work22 and listed in Table1 with the secondary structural potency indices. One of the merits of the HMLP approach is that it can provide a lipophilic index and a hydrophilic index for every amino acid side chain, describing its lipophilic moiety and hydrophilic moiety, respectively. In the first example the 22 octapeptides in training set is taken from Ref.28, which was originally used in the substrate specificity study for the SARS coronavirus 3C‐like proteinase.29, 30 In Table2, the notation ↓ indicates the cleavage site in octapeptides. From ↓ to left side, the amino acid residues are numbered as R1, R2, R3, R4, and R5; from ↓ to right side, the amino acid residues are numbered as R1′, R2′, and R3′. The first octapeptide S12 (SAVLQ↓SGF‐CONH2) is the parent of other octapeptides in the training set. It is a naturally cleavable peptide of 3C‐like proteinase, derived from polyprotein pp1ab of SARS coronavirus, covering the first cleavage site of pp1ab.31, 32, 33, 34 Other octapeptides are mutated from octapeptide S12, in which one or more residues are replaced. In Table 2 the mutated residues are indicated with bold letters. The names of octapeptides used in this study are the same as in Ref.28.
Table 1.
HMLP Parametersa and Secondary Structural Potencies of 20 Amino Acids Side Chains.
| A.A. | S L (Å2) | S H (Å2) | L | H | b P α | b P β | b P c |
|---|---|---|---|---|---|---|---|
| Leu (L) | 84.5476 | 0.0000 | 1.2906 | 0.0000 | 1.21 | 1.30 | 0.68 |
| Ile (I) | 88.6055 | 0.0000 | 1.1046 | 0.0000 | 1.08 | 1.60 | 0.66 |
| Val (V) | 77.8108 | 0.0000 | 0.5324 | 0.0000 | 1.06 | 1.70 | 0.62 |
| Phe (F) | 105.7054 | 11.2472 | 0.4412 | −0.1195 | 1.13 | 1.38 | 0.71 |
| Met (M) | 70.3631 | 23.2299 | 1.0768 | −0.3068 | 1.45 | 1.05 | 0.58 |
| Trp (W) | 133.6980 | 14.8820 | 0.8364 | −0.4310 | 1.08 | 1.37 | 0.75 |
| Ala (A) | 34.7760 | 0.0000 | 0.1744 | 0.0000 | 1.42 | 0.83 | 0.70 |
| Cys (C) | 23.5563 | 30.4540 | 0.2479 | −0.2402 | 0.70 | 1.19 | 1.18 |
| Gly (G) | 3.7616 | 0.0000 | 0.0208 | 0.0000 | 0.57 | 0.75 | 1.50 |
| Tyr (Y) | 80.9646 | 42.7160 | 0.4534 | −0.5896 | 0.69 | 1.47 | 1.06 |
| Thr (T) | 46.7285 | 16.0490 | 1.4265 | −0.4369 | 0.83 | 1.19 | 1.07 |
| Ser (S) | 26.0681 | 15.9613 | 0.2346 | −0.6040 | 0.77 | 0.75 | 1.32 |
| His (H) | 82.1701 | 13.8631 | 0.8124 | −0.7766 | 1.00 | 0.87 | 1.06 |
| Gln (Q) | 70.0876 | 17.8662 | 1.0036 | −0.7211 | 1.11 | 1.10 | 0.86 |
| Lys (K) | 97.7144 | 8.0786 | 1.4600 | −0.6229 | 1.16 | 0.74 | 0.98 |
| Asn (N) | 50.5075 | 17.7804 | 0.6396 | −0.7211 | 0.67 | 0.89 | 1.35 |
| Glu (E) | 57.1582 | 25.5726 | 1.0315 | −0.9298 | 1.51 | 0.37 | 0.84 |
| Asp (D) | 37.4173 | 25.2736 | 0.6058 | −0.9298 | 1.01 | 0.54 | 1.20 |
| Arg (R) | 90.8008 | 35.3095 | 1.2424 | −1.4797 | 0.98 | 0.93 | 1.04 |
| Pro (P) | 69.2297 | 0.0000 | 0.3226 | 0.0000 | 0.57 | 0.55 | 1.59 |
Notations used: S L , surface area of side chain with lipophilic potential; S H , surface area of side chain with hydrophilic potential; L, lipophilic index of side chains; H, hydrophilic index of side chains; P α, α potency index; P β, β potency index; P c, coil potency index.
Table 2.
Experimental and Predicted Peptide Substrate Cleavage Activities of SARS Coronavirus 3C‐like Proteinase.
| Namea | Sequenceb | (K cat/K m)rel a | log(K cat/K m)expt a | log(K cat/K m)calc c | log(K cat/K m)pred d |
|---|---|---|---|---|---|
| S12 | SAVLQ↓SGF | 1.0000 | 0.0000 | −0.0338 | −0.0396 |
| P5L | LAVLQ↓SGF | 3.9000 | 1.3610 | 1.7060 | 1.9394 |
| P5T | TAVLQ↓SGF | 3.6600 | 1.2975 | 1.3252 | 1.3306 |
| P5V | VAVLQ↓SGF | 3.5900 | 1.2782 | 1.0332 | 0.9280 |
| P5A | AAVLQ↓SGF | 3.3300 | 1.2030 | 0.6025 | 0.3333 |
| P4L | SLVLQ↓SGF | 0.1500 | −1.8971 | −0.8152 | 0.4788 |
| P4T | STVLQ↓SGF | 1.4700 | 0.3853 | −0.5455 | −0.9877 |
| P4V | SVVLQ↓SGF | 2.4400 | 0.8920 | −0.3388 | −0.5486 |
| P3L | SALLQ↓SGF | 0.8700 | −0.1393 | 0.5149 | 1.0315 |
| P3T | SATLQ↓SGF | 1.1900 | 0.1740 | 0.2043 | 0.2272 |
| P3A | SAALQ↓SGF | 0.1900 | −1.6607 | −0.3850 | 0.3295 |
| P3K | SAKLQ↓SGF | 2.6800 | 0.9858 | −0.0289 | 0.1694 |
| P1′A | SAVLQ↓AGF | 2.0400 | 0.7130 | 0.4130 | 0.1084 |
| P1′G | SAVLQ↓GGF | 0.8300 | −0.1863 | 0.2582 | Outlier |
| P2M | SAVMQ↓SGF | 0.2080 | −1.5702 | −1.4607 | −1.3500 |
| P2F | SAVFQ↓SGF | 0.0460 | −3.0791 | −3.5378 | −4.5758 |
| P2V | SAVVQ↓SGF | 0.0056 | −5.1850 | −3.6989 | −2.9612 |
| P2A | SAVAQ↓SGF | 0.0046 | −5.3817 | −6.0456 | −5.5328 |
| S21 | TVVLQ↓SGF | 3.9800 | 1.3813 | 1.0201 | 0.9197 |
| S22 | TVTLQ↓SGF | 2.6200 | 0.9632 | 1.2582 | 1.4161 |
| S23 | VVTLQ↓SGF | 2.4300 | 0.8879 | 0.9663 | 0.9465 |
| S24 | TVKLQ↓AGF | 4.3100 | 1.4609 | 1.4717 | 1.5935 |
The names of peptides are taken from Ref.28. S12 is the parent peptide in the training set. All other peptides are mutated from it.
The notation ↓ indicates the cleavage site of SARS coronavirus 3C‐like proteinase.13
Calculated bioactivities of 22 octapeptides after 10 iterative calculations.
Predicted bioactivities of 21 octapeptides in Jackknife test.
The iterative double least square (IDLS) technique described in the second Section is used in the peptide substrate specificity study for the SARS coronavirus 3C‐like proteinase based on the experimental data listed in Table 2. The initial values of sensitive coefficients of physicochemical parameters {a } are assigned to be 1.0. In the first calculation only four HMLP parameters are used, which yields the correlation coefficient R = 0.9375 and average predictive residue Q = ±0.4804. Q is the average square root of the summation of squared differences between predicted bioactivities and experimental bioactivities. Its definition can be found in eq. (10). In the second calculation total of 7 parameters are used, which gives better results than the first calculation (R = 0.9705 and Q = ±0.2305). The other three parameters are the secondary structural potency indices of amino acid residues. The curves of correlation coefficients R is shown in Figure 3, where R a is for the iterated coefficients {a } and R b is for the iterated coefficients {b }. The average residue Q between the predicted bioactivities and the experimental bioactivities of octapeptides are shown in Figure 4, where Q a is for {a } and Q b is for {b }. It has been observed that, after 5–6 iterations, the iterative result is converged smoothly. The converged sensitive coefficient sets {a } and {b }, as well as the corresponding R and Q for the octapeptides in the training dataset are given in Table 3.
Figure 3.
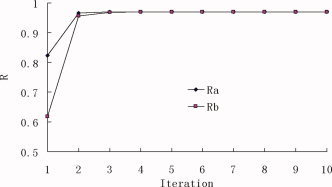
The correlation coefficients between experimental and predicted bioactivities. R a is for {a } iteration and R b is for {b } iteration. [Color figure can be viewed in the online issue, which is available at www.interscience.wiley.com.]
Figure 4.
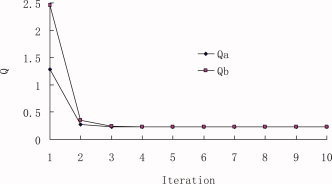
The value of Q between predicted bioactivities and experimental bioactivities of octapeptides. Q a is for {a } iteration and Q b is for {b } iteration. The Q is the average square root of the summation of squared differences between predicted bioactivities and experimental bioactivities (cf. Eq. 10). [Color figure can be viewed in the online issue, which is available at www.interscience.wiley.com.]
Table 3.
The Converged Sensitive Coefficient Sets {a }, {b }, Correlation Coefficient R, and Average Residue Q of 22 Octapeptides in Training Calculation and in Jackknife Test.
| 4 Parameters | 7 Parameters |
|---|---|
| a 1(S L) = 0.16205 | a 1(S L) = 0.64288 |
| a 2(S H) = 0.94055 | a 2(S H) = −0.60573 |
| a 3(L) = 45.11523 | a 3(L) = 31.18381 |
| a 4(H) = 78.24573 | a 4(H) = 7.90862 |
| – | a 5(P α) = 50.47151 |
| – | a 6(P β) = −26.15246 |
| – | a 7(P c) = −3.59095 |
| – | – |
| R | R |
| Q | Q |
| Jackknife Test | |
| R | – |
| Q | – |
| b 1(R5) = 0.01925 | b 1(R5) = 0.01875 |
| b 2(R4) = −0.01321 | b 2(R4) = −0.04513 |
| b 3(R3) = 0.01682 | b 3(R3) = 0.00510 |
| b 4(R2) = 0.10315 | b 4(R2) = 0.11854 |
| b 5(R1) = −0.75093 | b 5(R1) = −0.10948 |
| b 6(R′1) = 0.01418 | b 6(R1′) = 0.00863 |
| b 7(R′2) = 26.69763 | b 7(R2′) = −0.26087 |
| b 8(R′3) = −0.79655 | b 8(R3′) = 0.05023 |
| 0.9375 | 0.9705 |
| ±0.4804 | ±0.2305 |
| 0.8472 | – |
| ±0.6375 | – |
The two sets of coefficients {a } and {b } and eq. (4) can then be used for the bioactivity prediction of new peptide reagents. Jackknife test35 is performed for evaluating the predictive power of AABPD approach. The predicted bioactivities of the 22 octapeptides obtained in the Jackknife test are listed in Table 2 with correlation coefficient R = 0.8472 and predictive residue Q = ±0.7375. In the Jackknife test we found that the octapeptide P1′G (SAVLQ↓GGF) is an outlier with an very high predicted bioactivity. This may be caused by the small training dataset with limited diversity. In octapeptide P1′G the residue serine (S) in position R1′ of the parent octapeptide S12 (SAVLQ↓SGF) is replaced by glycine (G). On this position only two mutations are made. In the Jacknife test for P1′G in training set there is only one mutated octapeptide P1′A on the position R1′, no sufficient information on this position. The comparison between experimental and predictive bioactivities of the 21 octapeptides are shown in Figure 5.
Figure 5.
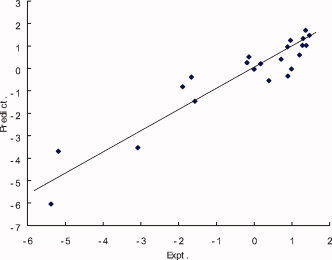
The experimental and predicted bioactivities of octapeptides in training set of 22 octapeptides after 10 iterations. [Color figure can be viewed in the online issue, which is available at www.interscience.wiley.com.]
Peptide‐based vaccines, in which small peptides derived from target proteins (epitopes) are used to provoke an immune reaction, have attracted considerable attention as a potential means both of treating infectious diseases and promoting the destruction of cancerous cells by a patient's own immune system.36, 37 With the availability of large sequence databases, computer aided design of peptide‐based vaccines has emerged as a promising approach for screening among billions of possible immune‐active peptides to find those likely to provoke an immune response to a particular cell type. The second example is the affinity prediction for epitope‐peptides with class I MHC (major histocompatibility complex) molecules. Forty samples of 9‐peptides are used in the training set, which are taken form Ref.38. The 9‐peptide sequences, the experimental bioactivities pIC50, and the predicted bioactivities in Jackknife test are shown in Table4. In the training calculation we get the correlation coefficient R = 0.8988 and average residue Q = ±0.6246, and in the Jackknife test we get the correlation coefficient R = 0.8285 and predictive average residue Q = ±0.7949.
Table 4.
Experimental and Predicted Bioactivities of 40 Epitope‐Peptides.
| Name | Sequence | Exp. pIC50 a | Calc. pIC5 b | Pred. pIC50 c |
|---|---|---|---|---|
| P01 | WLEPGPVTA | 6.082 | 6.341 | 6.582 |
| P02 | ITSQVPFSV | 6.196 | 6.495 | 6.568 |
| P03 | FLEPGPVTA | 6.898 | 7.163 | 7.465 |
| P04 | ITAQVPFSV | 7.020 | 6.799 | 6.726 |
| P05 | YLEPGPVTL | 7.058 | 7.364 | 7.498 |
| P06 | YTDQVPFSV | 7.066 | 7.498 | 7.758 |
| P07 | YLEPGPVTI | 7.187 | 7.375 | 7.443 |
| P08 | YLEPGPVTV | 7.342 | 7.453 | 7.461 |
| P09 | YLSPGPVTA | 7.383 | 7.305 | 7.287 |
| P10 | IIDQVPFSV | 7.398 | 7.667 | 7.707 |
| P11 | ITWQVPFSV | 7.463 | 7.362 | 7.348 |
| P12 | ITYQVPFSV | 7.480 | 7.302 | 7.234 |
| P13 | ILSQVPFSV | 7.699 | 7.797 | 7.815 |
| P14 | IMDQVPFSV | 7.719 | 7.717 | 7.717 |
| P15 | YLMPGPVTV | 7.932 | 8.056 | 8.074 |
| P16 | WLDQVPFSV | 7.939 | 7.574 | 7.285 |
| P17 | YLAPGPVTA | 8.032 | 7.608 | 7.526 |
| P18 | YLYPGPVTV | 8.051 | 7.998 | 7.975 |
| P19 | YLWPGPVTV | 8.125 | 8.058 | 8.090 |
| P20 | ILYQVPFSV | 8.310 | 8.603 | 8.648 |
| P21 | ILDQVPFSV | 8.481 | 7.827 | 7.713 |
| P22 | YLFPGPVTA | 8.495 | 8.131 | 8.069 |
| P23 | YLDQVPFSV | 8.638 | 8.799 | 8.892 |
| P24 | ILFQVPFSV | 8.699 | 8.623 | 8.605 |
| P25 | ILWQVPFSV | 8.770 | 8.663 | 8.649 |
| P26 | WTDQVPFSV | 6.145 | 6.273 | 6.381 |
| P27 | YLEPGPVTA | 6.668 | 7.567 | 7.748 |
| P28 | ITDQVPFSV | 6.947 | 6.526 | 6.643 |
| P29 | ITFQVPFSV | 7.179 | 7.321 | 7.344 |
| P30 | FTDQVPFSV | 7.212 | 7.094 | 7.028 |
| P31 | ITMQVPFSV | 7.398 | 7.360 | 7.357 |
| P32 | YLSPGPVTV | 7.642 | 7.191 | 7.124 |
| P33 | YLYPGPVTA | 7.772 | 8.111 | 8.147 |
| P34 | YLAPGPVTV | 7.818 | 7.495 | 7.466 |
| P35 | ILAQVPFSV | 7.939 | 8.100 | 8.119 |
| P36 | ILMQVPFSV | 8.125 | 8.661 | 8.749 |
| P37 | YLFPGPVTV | 8.237 | 8.017 | 7.981 |
| P38 | YLMPGPVTA | 8.367 | 8.169 | 8.135 |
| P39 | YLWPGPVTA | 8.495 | 8.171 | 8.112 |
| P40 | FLDQVPFSV | 8.658 | 8.395 | 8.191 |
The experimental bioactivities pIC50 are taken from Ref.38.
Calculated bioactivities pIC50 of 9‐peptides in training set.
Predicted bioactivities pIC50 of 9‐peptides in Jackknife test.
Discussion
The theoretical model of AABPD is built upon the structure features of peptides with clear physical implications. A merit of the peptide reagent design method developed in this paper is that the binding free energy between peptide reagent P i and the target peptide P0 is described by the physicochemical parameters of amino acids at every sequence site. It is through eq. (4) that has made it possible to not only predict the bioactivities of new peptide reagents, but also describe the physical and chemical features of an amino acid at every sequence position. This is very helpful for designing peptide reagents, peptide analogues, as well as peptide mimetics and modified peptides for drug development. In the traditional QSAR only one set of predictive coefficients {a l } is used, that is for the physical parameters in linear free energy equation. However, in the AABPD model two sets of predictive coefficients {a l } and {b α} are used for physical parameters and for the position of residues in peptide, respectively. Two least square procedures are performed for {a l } and {b α} alternately and iteratively. In this way the predictive residue Q decreases and the correlation coefficient R increases step by step. In the first calculation example the first correlation coefficient R (0) = 0.6175 is the results of traditional QSAR method and the converged correlation coefficient R (10) = 0.9705 is the improved result with the AABPD method. Usually after 5–6 iteration steps, the iterative procedure converged smoothly for two sensitive coefficient sets {a l } and {b α}. However, in the case the diversification of peptides is very poor we may get very bad solution, because of the matrix singularity problem. To build a good training set with proper diversification, two criteria have to be satisfied. First, the range of binding affinities in the test set should not exceed the range of affinities in the training set. Second, each amino acid at each position in the test set should also be present at that position in the training set in different peptides.
The iterative double least square (IDLS) technique has been used in more than 10 peptide systems. In all these cases we got converged results. So far we have not observed any unconverged example. In the IDLS technique general inverse matrix method is applied for the least square solution of simultaneous linear equation set. This is a very robust method. Only in the case the diversification of peptide training set is very poor, we may get a very bad solution because of the matrix singularity problem.
Conclusion
The linear free energy equation plays an important role in the QSAR study. The physicochemical parameters used in the linear free energy equation should describe the binding free energy from all aspects and include all factors that affect the interaction and recognition between ligand and receptor. Generally speaking, more physical parameters are used in linear free energy equation, better results may be achieved. However, sometimes additional parameters do not work harmonically and may conflict each other. For rational drug design, chemists developed many good parameters for QSAR study. However, the physicochemical parameters of amino acid residues for peptide design are not so ready. For further improvement of AABPD, better linear free energy equations and more optimized physicochemical parameters are needed.
Acknowledgements
The authors like to expresses their gratitude to the two anonymous reviewers, whose constructive comments were very helpful for improving the presentation of this paper.
Contributor Information
Qi‐Shi Du, Email: duqishi@yahoo.com.
Kuo‐Chen Chou, Email: kchou@san.rr.com.
References
- 1. Adessi, C. ; Soto, C. Curr Med Chem 2002, 9, 963. [DOI] [PubMed] [Google Scholar]
- 2. Venkatesan, N. ; Kim, B. H. Curr Med Chem 2002, 9, 2243. [DOI] [PubMed] [Google Scholar]
- 3. Chou, K. C. Curr Med Chem 2004, 11, 2105. [DOI] [PubMed] [Google Scholar]
- 4. Sawyer, T. K. In ACS Professional Reference Book; Reid, R. E. , Ed.; ACS Publisher: New York, 2000; Vol. 17, pp. 387–422. [Google Scholar]
- 5. Tremblay, C. L. ; Kollmann, C. ; Giguel, F. ; Chou, T. C. ; Hirsch, M. S. J Acquir Immune Defic Syndr 2000, 25, 99. [DOI] [PubMed] [Google Scholar]
- 6. Nagashima, K. A. ; Thompson, D. A. ; Rosenfield, S. I. ; Maddon, P. J. ; Dragic, T. ; Olson, W. C. J Infect Dis 2001, 183, 1121. [DOI] [PubMed] [Google Scholar]
- 7. Althaus, I. W. ; Chou, J. J. ; Gonzales, A. J. ; Diebel, M. R. ; Chou, K. C. ; Kezdy, F. J. ; Romero, D. L. ; Aristoff, P. A. ; Tarpley, W. G. ; Reusser, F. J Biol Chem 1993, 268, 6119. [PubMed] [Google Scholar]
- 8. Althaus, I. W. ; Gonzales, A. J. ; Chou, J. J. ; Diebel, M. R. ; Chou, K. C. ; Kezdy, F. J. ; Romero, D. L. ; Aristoff, P. A. ; Tarpley, W. G. ; Reusser, F. J Biol Chem 1993, 268, 14875. [PubMed] [Google Scholar]
- 9. Althaus, I. W. ; Chou, J. J. ; Gonzales, A. J. ; Diebel, M. R. ; Chou, K. C. ; Kezdy, F. J. ; Romero, D. L. ; Aristoff, P. A. ; Tarpley, W. G. ; Reusser, F. Biochemistry 1993, 32, 6548. [DOI] [PubMed] [Google Scholar]
- 10. Althaus, I. W. ; Chou, J. J. ; Gonzales, A. J. ; Diebel, M. R. ; Chou, K. C. ; Kezdy, F. J. ; Romero, D. L. ; Aristoff, P. A. ; Tarpley, W. G. ; Reusser, F. Experientia 1994, 50, 23. [DOI] [PubMed] [Google Scholar]
- 11. Althaus, I. W. ; Chou, J. J. ; Gonzales, A. J. ; Diebel, M. R. ; Chou, K. C. ; Kezdy, F. J. ; Romero, D. L. ; Thomas, R. C. ; Aristoff, P. A. ; Tarpley, W. G. ; Reusser, F. Biochem Pharmacol 1994, 47, 2017. [DOI] [PubMed] [Google Scholar]
- 12. Althaus, I. W. ; Chou, K. C. ; Franks, K. M. ; Diebel, M. R. ; Kezdy, F. J. ; Romero, D. L. ; Thomas, R. C. ; Aristoff, P. A. ; Tarpley, W. G. ; Reusser, F. Biochem Pharmacol 1996, 51, 743. [DOI] [PubMed] [Google Scholar]
- 13. Chou, K. C. Anal Biochem 1996, 233, 1. [DOI] [PubMed] [Google Scholar]
- 14. Chou, K. C. ; Kezdy, F. J. ; Reusser, F. Anal Biochem 1994, 221, 217. [DOI] [PubMed] [Google Scholar]
- 15. Bewley, C. A. ; Louis, J. M. ; Ghirlando, R. ; Clore, G. M. J Biol Chem 2002, 277, 14238. [DOI] [PubMed] [Google Scholar]
- 16. Eckert, D. M. ; Kim, P. S. Proc Natl Acad Sci USA 2001, 98, 11187. [DOI] [PMC free article] [PubMed] [Google Scholar]
- 17. Root, M. J. ; Kay, M. S. ; Kim, P. S. Science 2001, 291, 884. [DOI] [PubMed] [Google Scholar]
- 18. Doms, R. W. ; Moore, J. P. J Cell Biol 2000, 151, F9. [DOI] [PMC free article] [PubMed] [Google Scholar]
- 19. Doms, R. W. Aids 2001, 15 Suppl 1, S34. [DOI] [PubMed] [Google Scholar]
- 20. Chen, J. ; Skehel, J. J. ; Wiley, D. C. Proc Natl Acad Sci USA 1999, 96, 8967. [DOI] [PMC free article] [PubMed] [Google Scholar]
- 21. Chou, K. C. J. Biol. Chem. 1993, 268, 16938–16948. [PubMed] [Google Scholar]
- 22. Du, Q. S. ; Li, D. P. ; He, W. Z. ; Chou, K. C. J Comput Chem 2006, 27, 685. [DOI] [PubMed] [Google Scholar]
- 23. Du, Q. S. ; Mezey, P. G. ; Chou, K. C. J Comput Chem 2005, 26, 461. [DOI] [PubMed] [Google Scholar]
- 24. Du, Q. S. ; Liu, P. J. ; Mezey, P. G. J Chem Inf Model 2005, 45, 347. [DOI] [PubMed] [Google Scholar]
- 25. Du, Q. ; Mezey, P. G. J Comput Aided Mol Des 1998, 12, 451. [DOI] [PubMed] [Google Scholar]
- 26. Du, Q. ; Arteca, G. A. ; Mezey, P. G. J Comput Aided Mol Des 1997, 11, 503. [DOI] [PubMed] [Google Scholar]
- 27. Du, Q. ; Arteca, G. A. J Comput Aided Mol Des 1996, 10, 133. [DOI] [PubMed] [Google Scholar]
- 28. Fan, K. ; Ma, L. ; Han, X. ; Liang, H. ; Wei, P. ; Liu, Y. ; Lai, L. Biochem Biophys Res Commun 2005, 329, 934. [DOI] [PMC free article] [PubMed] [Google Scholar]
- 29. Anand, K. ; Ziebuhr, J. ; Wadhwani, P. ; Mesters, J. R. ; Hilgenfeld, R. Science 2003, 300, 1763. [DOI] [PubMed] [Google Scholar]
- 30. Yang, H. ; Yang, M. ; Ding, Y. ; Liu, Y. ; Lou, Z. ; Zhou, Z. ; Sun, L. ; Mo, L. ; Ye, S. ; Pang, H. ; Gao, G. F. ; Anand, K. ; Bartlam, M. ; Hilgenfeld, R. ; Rao, Z. Proc Natl Acad Sci USA 2003, 100, 13190. [DOI] [PMC free article] [PubMed] [Google Scholar]
- 31. Chou, K. C. ; Wei, D. Q. ; Zhong, W. Z. Biochem Biophys Res Comm 2003, 308, 148. [DOI] [PMC free article] [PubMed] [Google Scholar]
- 32. Du, Q. S. ; Wang, S. Q. ; Wei, D. Q. ; Zhu, Y. ; Guo, H. ; Sirois, S. ; Chou, K. C. Peptides 2004, 25, 1857. [DOI] [PMC free article] [PubMed] [Google Scholar]
- 33. Du, Q. S. ; Wang, S. ; Wei, D. Q. ; Sirois, S. ; Chou, K. C. Anal Biochem 2005, 337, 262. [DOI] [PMC free article] [PubMed] [Google Scholar]
- 34. Du, Q. S. ; Wang, S. Q. ; Jiang, Z. Q. ; Gao, W. N. ; Li, Y. D. ; Wei, D. Q. ; Chou, K. C. Med Chem 2005, 1, 209. [DOI] [PubMed] [Google Scholar]
- 35. Chou, K. C. ; Zhang, C. T. Crit Rev Biochem Mol Biol 1995, 30, 275. [DOI] [PubMed] [Google Scholar]
- 36. Garcia, K. C. Immunol Rev 1999, 172, 73. [DOI] [PubMed] [Google Scholar]
- 37. Jardetzky, T. S. ; Lane, W. S. ; Robinson, R. A. ; Madden, D. R. ; Wiley, D. C. Nature 1991, 353, 326. [DOI] [PubMed] [Google Scholar]
- 38. Parkhurst, M. R. ; Salgaller, M. L. ; Southwood, S. ; Robbins, P. F. ; Sette, A. ; Rosenberg, S. A. ; Kawakami, Y. J Immunol 1996, 157, 2539. [PubMed] [Google Scholar]