

Abstract
The current clinical standard for mass screening of prostate cancer are prostate-specific antigen (PSA) biomarker assays. Unfortunately, the low specificity of PSA’s bioassays to prostate cancer leads to high false-positive rates, as such there is an urgent need for the development of a more specific detection system independent of PSA levels. In our previous research, we have successfully demonstrated, with the use of our Photonic-Crystal based biosensor in a Total-Internal-Reflection (PC-TIR) configuration, detection of prostate cancer (PC-3) cells against benign prostate hyperplasia (BPH-1) cells. The PC-TIR biosensor achieved detection of individual prostate cancer cells utilizing cellular refractive index (RI) as the only contrast parameter. To further study this methodology in vitro, we report a comprehensive study of the cellular RI’s of various prostate cancer and noncancerous cell lines (i.e. RWPE-1, BPH-1, PC-3, DU-145, and LNCaP) via reflectance spectroscopy and single-cell RI imaging utilizing the PC-TIR biosensor. Our study shows promising clinical potential in utilizing the PC-TIR biosensor system for the detection of prostate cancer against noncancerous prostate epithelial cells.
Keywords: Optical Biosensors, Prostate Cancer, Label-Free Imaging, Cellular Refractive Index, Photonic-Crystal Biosensor, Cancer Diagnostics
1. INTRODUCTION
A reliable, noninvasive method is critically important for large-scale screening of prostate cancer, the most common male malignancy. Unfortunately, PSA tests that are used in current clinical practice are far from providing satisfactory diagnosis and result in a large number of unnecessary prostate biopsies (up to 70–80% of over 600,000 diagnostic prostate biopsy procedures each year in US alone) due to a high false-positive rate.1,2 Issues with PSA test are caused by its low specificity; besides associated with prostate cancer, PSA elevation may also occur in men with benign prostatic hyperplasia (BPH), acute bacterial prostatitis, cystitis, or perineal trauma.2–4 Therefore, there is a need in developing other biomarkers with higher specificity for improved detection of prostate cancer in recent years.5–14 Despite the significant progress in finding several new molecular biomarkers, none of them has been successful enough to replace the PSA test yet. On the other hand, using exfoliated prostate cancer cells isolated from urine specimens for diagnosing the carcinoma of the prostate has been proposed several decades ago.15,16 Although the examination at cellular levels provides excellent specificities in contrast to PSA tests, past attempts at diagnosing prostate cancer via traditional urine cytology were abandoned due to unacceptably low sensitivities.17 The challenge in increasing sensitivity mainly stems from lacking sensitive and specific markers that allow visualization and differentiation of malignant prostate cancer cells through immunofluorescence labeling for cancer-specific markers.
In our previous research, we have successfully demonstrated, with the use of our Photonic-Crystal based biosensor in a Total-Internal-Reflection (PC-TIR) configuration, detection of prostate cancer (PC-3) cells against benign prostate hyperplasia (BPH-1) cells. The PC-TIR biosensor achieved detection of individual prostate cancer cells utilizing cellular refractive index (RI) as the only contrast parameter.18 To further study this methodology in vitro, we report a comprehensive study of the cellular RI’s of various prostate cancer and noncancerous cell lines (i.e. RWPE-1, BPH-1, PC-3, DU-145, and LNCaP) via reflectance spectroscopy utilizing the PC-TIR biosensor. The PC-TIR biosensor has an innovative working mechanism that utilizes photonic crystal (PC) structure in a unique configuration to create a novel open optical microcavity that allows easy functionalization of the exposed sensing surface and direct access for analyte molecules and cells.18–29 Conventionally, a sharp resonant condition can be achieved with a high-Q optical microcavity with a cavity layer sandwiched by two pieces of PC structures. However, this conventional, closed configuration is not suitable for biosensing, because in practice it is impossible to put analyte cells in the closed microcavity. For quantitative measurements of cell RI values, we open up the closed microcavity structure and use only one piece of a PC structure in a total-internal-reflection (TIR) configuration. This unique configuration forms a PC-TIR biosensor with an open sensing surface, which allows for easy attachment of cells directly onto the biosensor surface.20,21 Compared with a surface plasmon resonance (SPR) sensor that has a typical bandwidth of ~40 nm,30,31 a PC-TIR biosensor possesses a much sharper resonant dip (~ 1 nm),24 thus allowing for precise measurements of the change in RI of attached cells by accurately monitoring the change in the sharp resonant condition of the open microcavity. Furthermore, in contrast to the surface wave of an SPR sensor, the cavity mode of a PC-TIR biosensor is localized, which makes it possible to measure individual cells atop of a PC-TIR biosensor chip.
2. MATERIALS & METHODS
Similar experimental methods were descried in our previous work.18,19 A summary of the methods conducted is presented below.
2.1. Cells and Cell Culture
Normal human prostate epithelial cells, RWPE-1, were obtained from Dr. Lu-Zhe Sun at the University of Texas Health at San Antonio. Human noncancerous benign prostate hyperplasia cells, BPH-1, were obtained from Dr. Scott Lucia’s laboratory at the University of Colorado Health Science Center. Human prostate cancer cells, PC-3, DU-145, and LNCaP, were obtained from ATCC. RWPE-1 cells were cultured in Keratinocyte Serum Free Medium containing 1% Penicillin; BPH-1, PC-3, and LNCaP cells were cultured in RPMI-1640 medium containing 10% fetal bovine serum (FBS) and 1% Penicillin; DU-145 cells were cultured in EMEM medium containing 10% FBS and 1% Penicillin. All cells were maintained in a humidified incubator with 5% CO2 at 37°C, and passaged for 2 to 15 times (P2 – P15).
2.2. Experimental Set-up for quantifying Bulk Cellular RIs
A broadband white light source was coupled into a single-mode optical fiber to obtain a good spatial mode. The output beam from the fiber was polarized and collimated to illuminate the PC-TIR biosensor placed on a prism. The reflectance spectrum of the biosensor was monitored with a high-resolution spectrometer (Ocean Optics, HR4000) illustrated in Figure 1. The desired cells were then placed on top of the biosensor and allowed to settle onto the sensing surface. Our PC-TIR based method provides a direct and simple way to measure the RI of a well-defined layer of cells (of a single cell line). It should be noted that the cells are within the evanescent field of the probe light that has a penetration depth of ~ 300 nm. Hence the detection with the PC-TIR biosensor allows the measurements to be focused on cell membrane and cytoplasm, which is expected to have a different molecular composition and nanostructures between cancerous and noncancerous cells.
Figure 1.

The PC-TIR biosensor: (a) Schematic structure of a PC-TIR biosensor, (b) The PC-TIR biosensor, and its use of TIR to form an open microcavity, offering a unique sensing interface open for direct interactions with cells, (c) Representation of the Optical/Resonant dip, and it shifting from blue to red with the increase of RI.
2.3. Experimental Set-up for quantifying Single Cell RIs
To achieve an imaging modality, the PC-TIR biosensor was placed atop a prism, coupled to a rotational stage (illustrated in Figure 2). The rotational stage is computer controlled and operated, allowing for precise control of the laser’s angle of incidence (by an accuracy of .001°). Cell solution was placed atop the biosensor, within a sample well made of Polydimethylsiloxane (PDMS). Acquired data represent the cellular membrane’s resonance at varying angles, this cellular resonance being a direct variable of the cell membrane’s refractive index, which is unique to each cell line. Desired cells were tyrpsinized, re-suspended in cell medium, and dyed (with Vybrant DiD cell-labeling solution). Cell solution was diluted to approximately 10,000 cells/100 μL. A PC-TIR biosensor surface was cleaned for attaching a PDMS sample well. The sensor was then placed atop the prism. 100 μL of cell solution was then placed atop the biosensor, and allowed to set for 30 minutes (to allow the cells to settle within the evanescent field). A Helium–Neon laser at 632 nm was expanded with a beam expander, then coupled into the PC-TIR biosensor with a prism to monitor the resonant condition of the biosensor. The rotational stage was rotated, allowing for the identification of the resonate angle (RA). The RA is the angle of incidence of the laser, at which the RI of the cells meet the resonant condition of the open cavity of the PC-TIR sensor (shown in Figure 2B and 2C).
Figure 2.
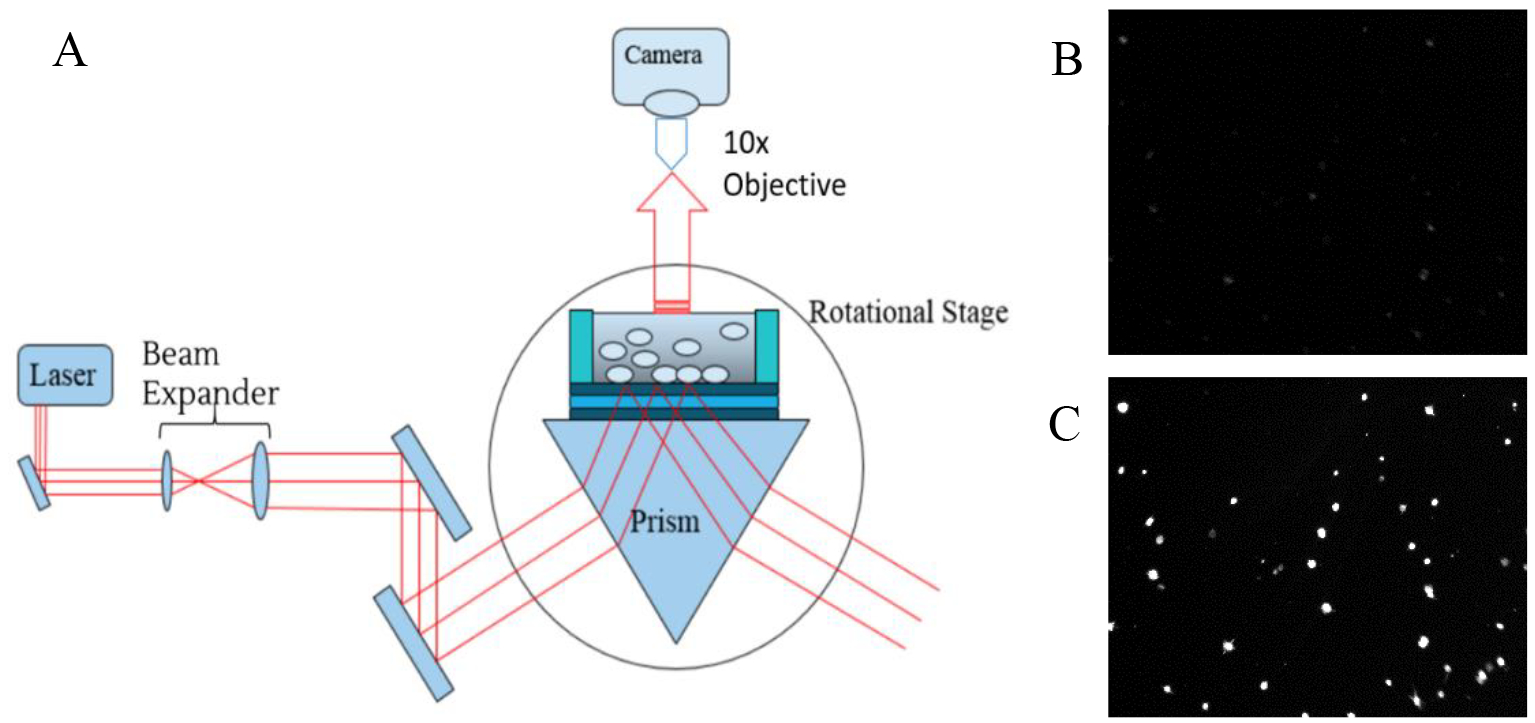
Imaging set-up for the PC-TIR. (a) Schematic diagram of the experimental set-up for quantifying cellular RI values with a PC-TIR biosensor. (b) Representative image of cells not in resonance. (c) Representative image of cells in resonance.
2.4. Analysis of Difference from the Maximum-Likelihood Resonant Curve
Once the angle was identified, images were acquired at sequential angles around the identified RA. A graph was then built with a MatLab program to show the fluorescence intensity of the cell membrane as a function of the incident angle of the laser beam at the PC-TIR sensor. All frames (images) are separated by an angle change of .005°, all starting from an arbitrary 0 (or first image). To analyze symmetry of the data, the difference from the maximum-likelihood resonant curve (MLRC) was taken (shown in Figure 3). The MLRC is obtained by analyzing the highest frequency of the cells appearing at certain RA. If cells being analyzed are from a single population, then there should be symmetry, but if cells from multiple populations are sampled, then there will be a skew in the symmetry across the RA of the MLRC.
Figure 3.
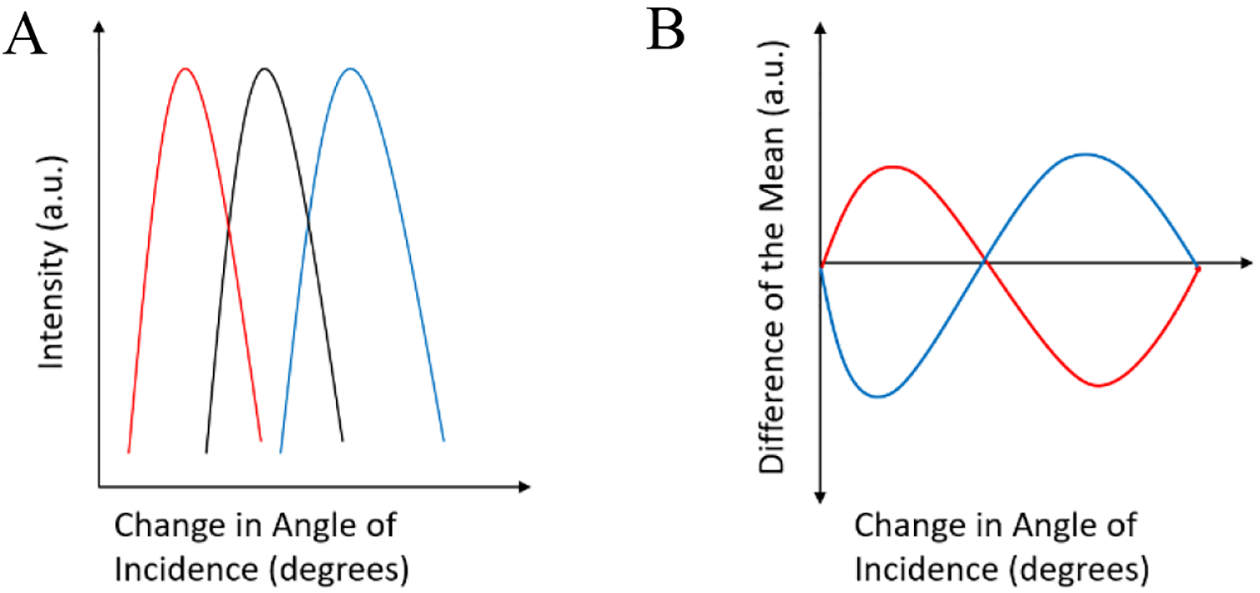
Representative image of the data (a) being analyzed by subtracting each cells resonant curve (red and blue) to the MLRC (black). (b) Shows the resulting plot.
3. RESULTS
3.1. Bulk Refractive Index Measurement of All Prostate Cell Lines
Utilizing the experimental setup described in Figure 1B, we measured the Reflectance Spectra of the PC-TIR sensor when RWEP-1 (black), BPH-1 (red), LNCaP (blue), DU-145 (green), and PC-3 (purple) cells (shown in Figure 4) are loaded on the sensor surface, respectively. All cells are normalized to a common reference, distilled water (yellow). Values are calculated by measuring the distance between the reference and the resonant dip for each cell (shifts calculated in the table in Figure 4). The shift in the wavelength of the resonant dip is a direct function of the cell’s RI.
Figure 4.
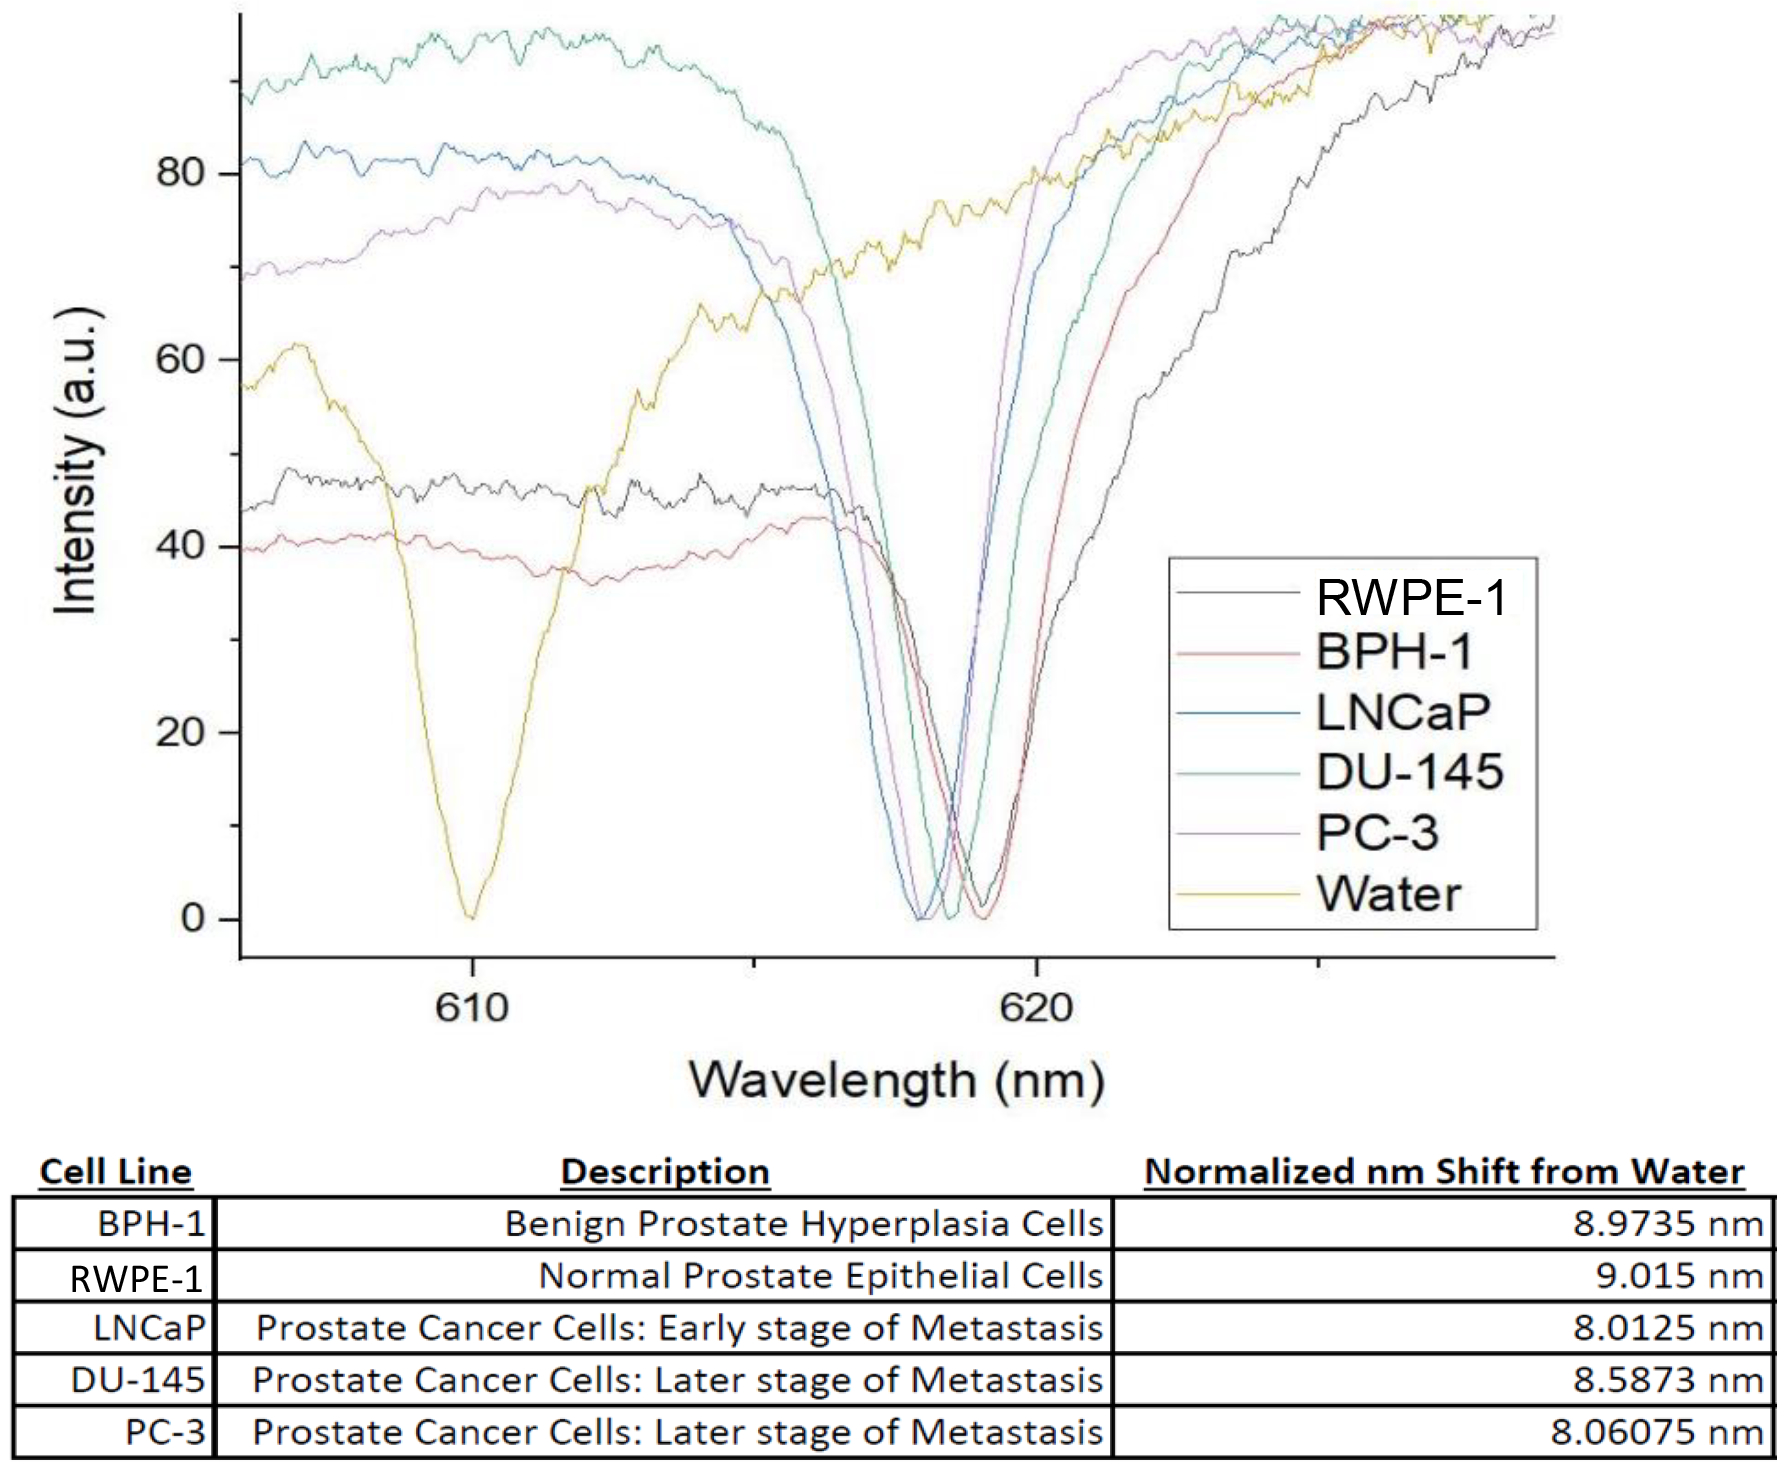
Reflectance spectra of all Prostate Cell Lines, and the normalized shift from the reference (water).
3.2. Single Cell Analysis for DU-145, BPH-1 and a Mix sample of both
Utilizing the experimental setup described in Figure 2, data was collected and analyzed for 3 samples, pure DU-145 cells, pure BPH-1 cells, and a mix of 30% DU-145 cells and 70% BPH-1 cells. Plots were generated by plotting each cell’s individual intensity against the angle of incidence of the laser (shown in Figure 5). The angle at which the cell is brightest, is the corresponding RA for that cell. The RA Events where then plotted to show population distribution within each sample. Figure 5A and Figure 5B demonstrates the uniformity of a pure DU-145 cells solution sample test across 23 analyzed cells. Figure 5C and Figure 5D demonstrates the uniformity of a pure BPH-1 cell solution sample test across 27 analyzed cells. Figure 5E and Figure 5F show the data for the mixed sample, with no visible difference as compared to the two pure samples prior, test across 29 analyzed cells, because the subtle difference in RI values for the two cell populations.
Figure 5.
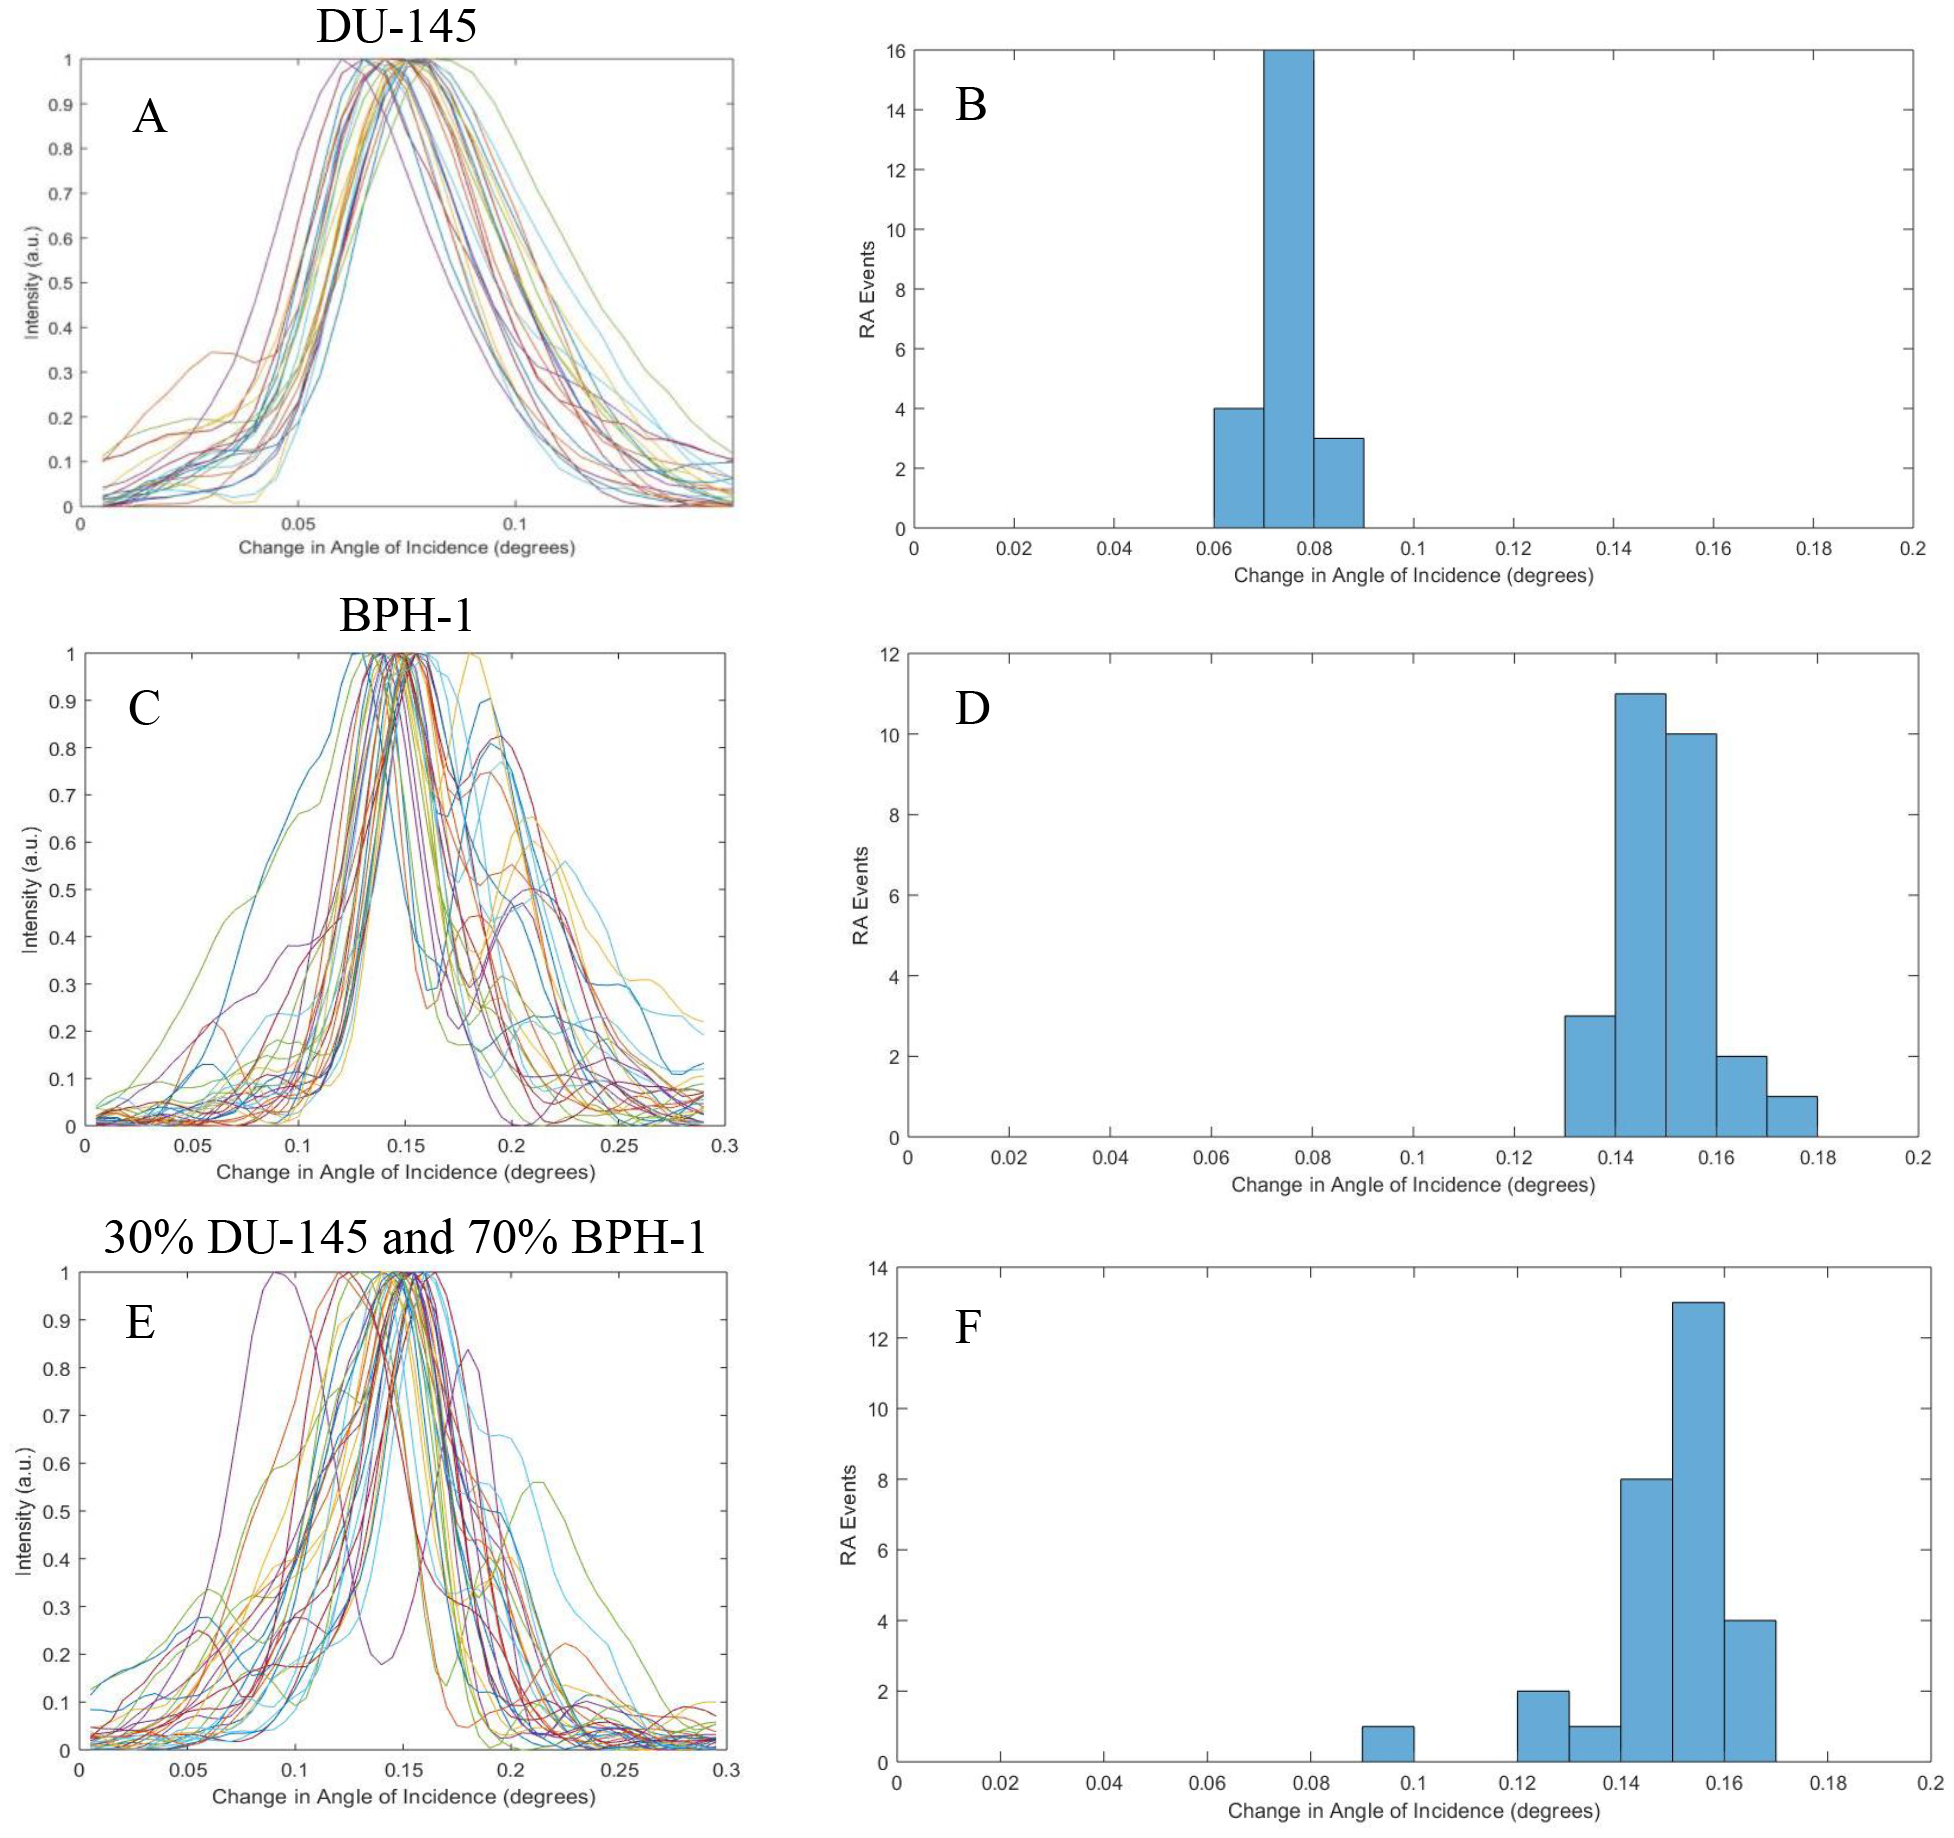
Compiled resonant plots for DU-145, BPH-1, and a Mixed sample. (a, c, and e) Show the individual cell’s resonance against the change of angle of incidence. (b, d, and f) Show the calculated RA (function of RI) of each sample to show population distribution.
3.3. Analyzing the Difference from the Maximum-Likelihood Resonant Curve (MLRC) to Show the Presence of Prostate Cancer in the Mixed Sample
Taking the resonant plots (against the angle of incidence) for each sample, the difference from the MLRC was calculated and plotted for each individual cell within the samples (shown in Figure 6). Then the distribution of the cells across the MLRC was calculated by counting the number of positive versus negative cells prior to the conversion on the graph. Calculated values are shown in Figure 6.
Figure 6.
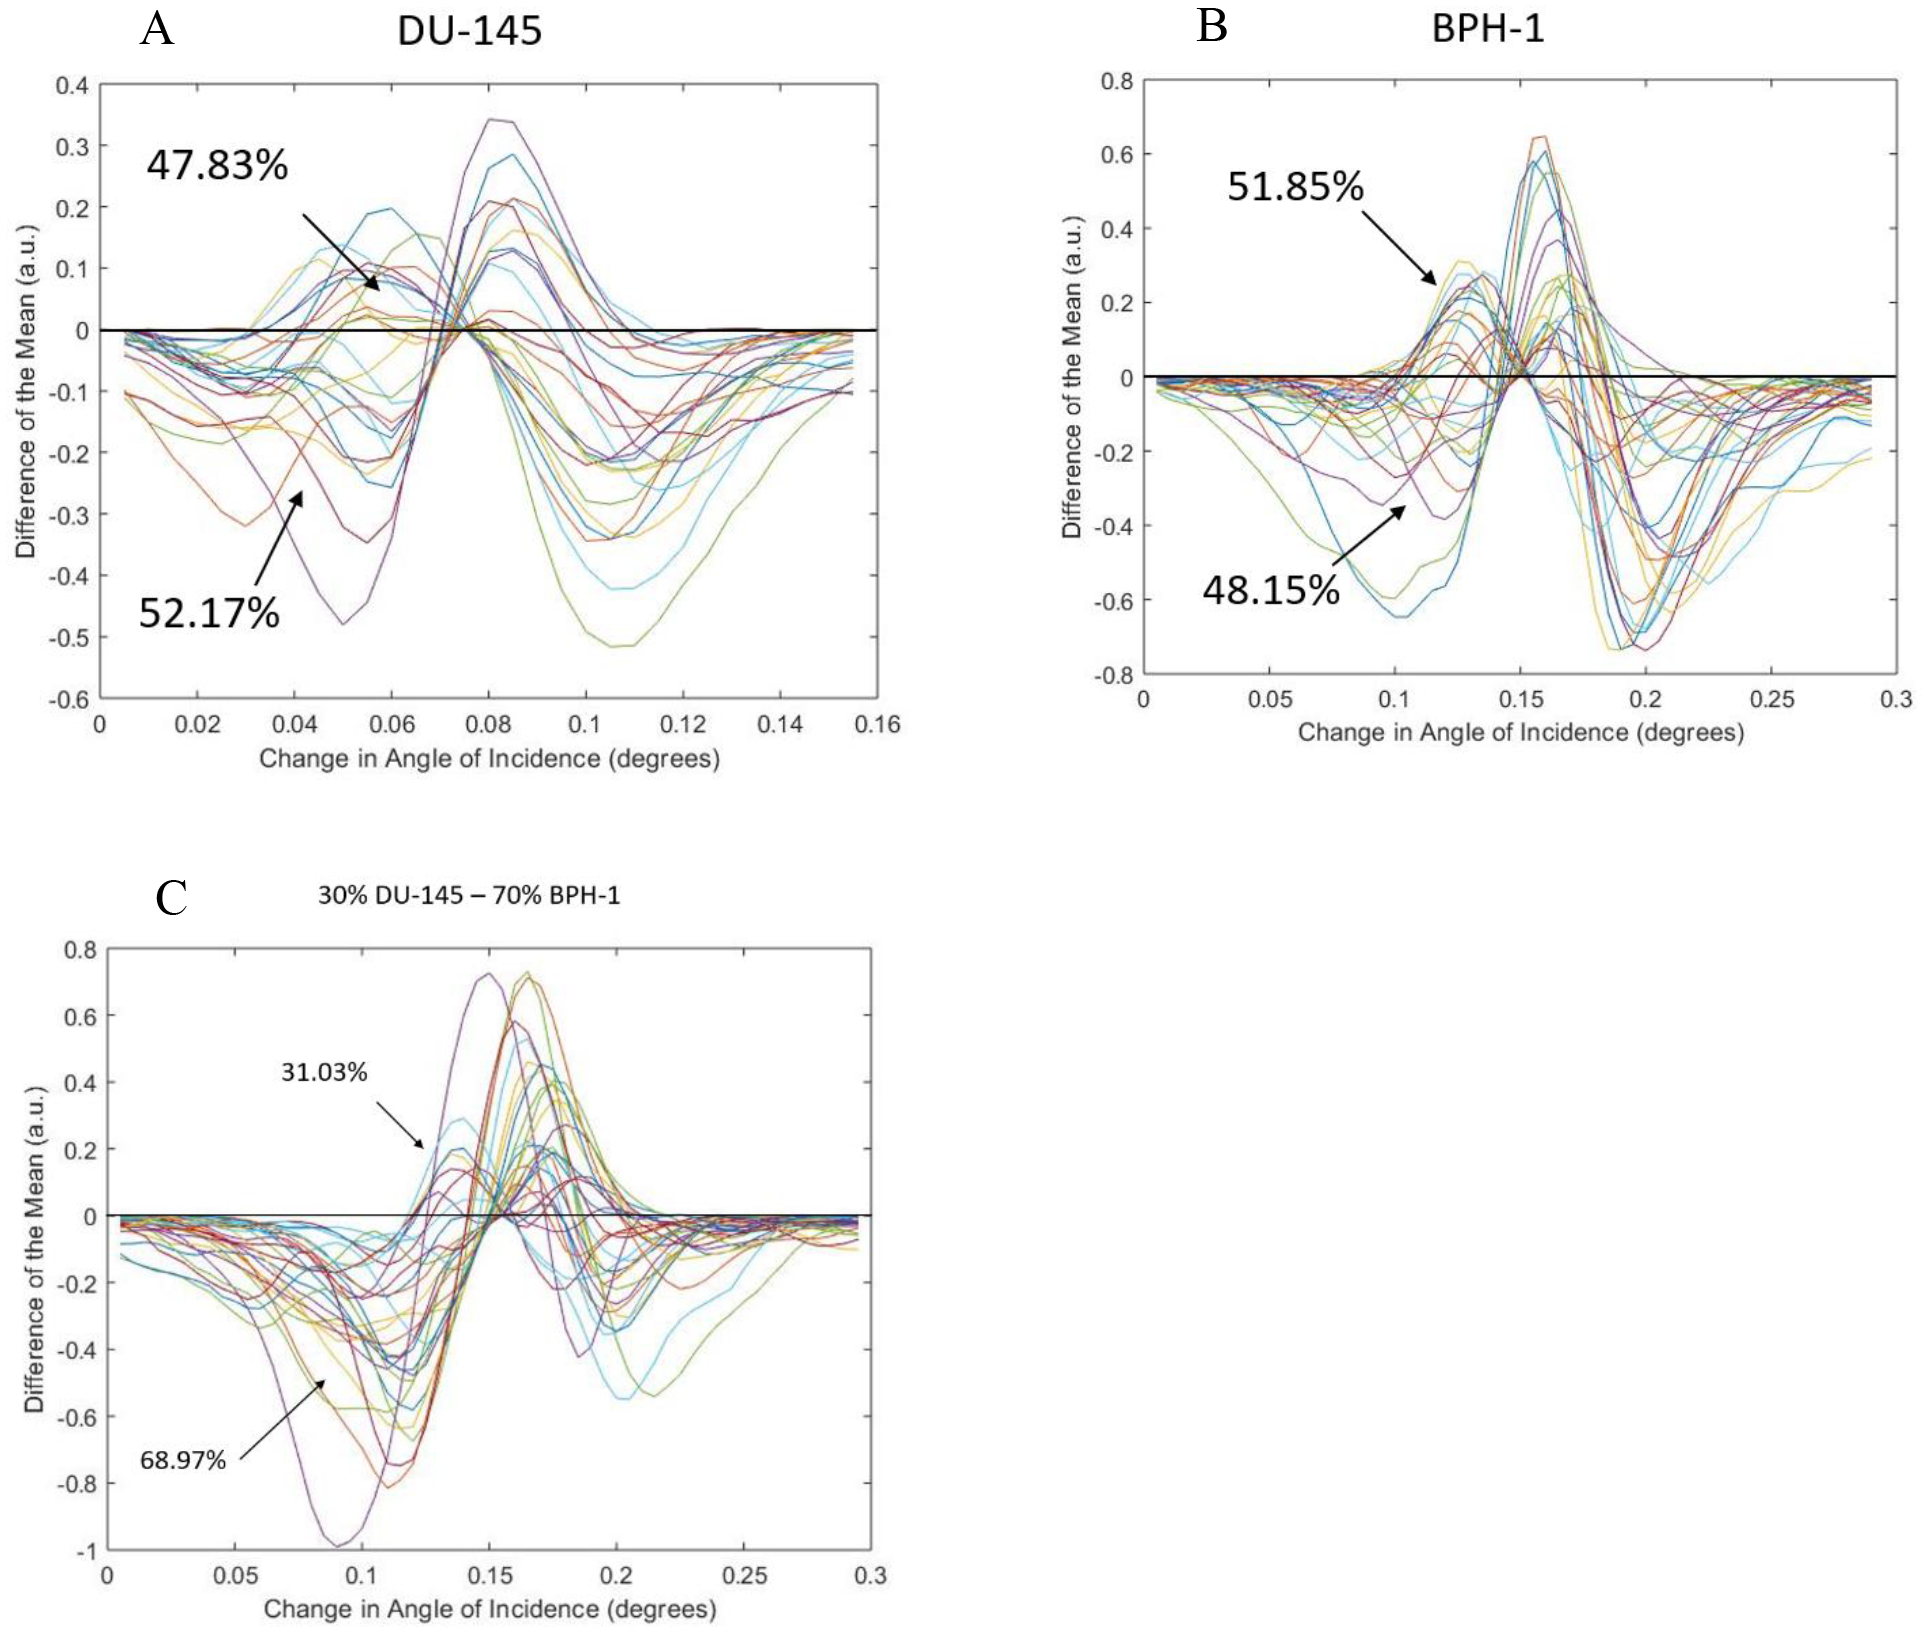
Difference from the MLRC for the chosen cell lines. (a) Shows the calculated difference from the MLRC for all DU-145 cells. (b) Shows the calculated difference from the MLRC for all BPH-1 cells. (c) Show the calculated difference from the MLRC for all cells within the mixed sample.
4. DISCUSSION
The presented study was conducted in order to quantify the RI of various prostate cancerous and noncancerous cell lines, shown and quantified in Figure 4. Although the observed shift differences between cell lines are small (spanning ~1 nm), there does seem to be some correlation between cancerous cells having a smaller RI versus noncancerous cells. We then choose DU-145 and BPH-1 as a new model for the presence of prostate cancer cells against noncancerous cells, as they had the smallest difference in RI; according to Figure 4 a shift of ~0.4 nm was observed. This shift is smaller than the PC-TIR biosensors’ optical bandwidth, and we wanted to see if single cell detection was possible with this model. Looking at Figure 5, we can see that there seems no notable difference in the distribution of RAs of the cells in the mixed sample, as compared to the pure (single cell line) samples. As such, we employed the analysis by calculating the difference from the MLRC to show the population distribution within each sample. As expected, single population samples (such as the pure DU-145, and pure BPH-1) showed even distribution across the MLRC (shown in Figure 6A and Figure 6B respectively). In contrast, there is dissymmetry in the distribution for the sample with mixed DU-145 and BPH-1 cells, inferring the presence of two different populations. Pervious success of single cell detection with PC-3 and BPH-1 is attributed to the 1 nm difference between the two cell lines. Cells with less than a 1 nm shift in difference are difficult to distinguish by using only the mean of the resonant curves of all the cells. Nevertheless, by utilizing the analysis of the difference from the MLRC, we have demonstrated the possibility for distinguishing different cell populations with even only subtle a difference in RI values.
5. ACKNOWLEDGEMENTS
This work was primarily supported by a grant from the National Institutes of Health, R21CA198389, and partially supported by another NIH grant, R25GM060655.
6. REFERENCES
- [1].Schroder FH, Hugosson J, Roobol MJ, Tammela TL, Ciatto S, Nelen V, Kwiatkowski M, Lujan M, Lilja H, Zappa M, Denis LJ, Recker F, Berenguer A, Maattanen L, Bangma CH, Aus G, Villers A, Rebillard X, van der Kwast T, Blijenberg BG, Moss SM, de Koning HJ & Auvinen A Screening and prostate-cancer mortality in a randomized European study. N Engl J Med 360, 1320–1328 (2009). [DOI] [PubMed] [Google Scholar]
- [2].Bjartell A, Montironi R, Berney DM & Egevad L “Tumour markers in prostate cancer II: diagnostic and prognostic cellular biomarkers.” Acta Oncol 50 Suppl 1, 76–84 (2011). [DOI] [PubMed] [Google Scholar]
- [3].Freedland SJ, Humphreys EB, Mangold LA, Eisenberger M, Dorey FJ, Walsh PC & Partin AW “Risk of prostate cancer-specific mortality following biochemical recurrence after radical prostatectomy.” JAMA 294, 433439 (2005). [DOI] [PubMed] [Google Scholar]
- [4].Hoffman RM Clinical practice. “Screening for prostate cancer.” N Engl J Med 365, 2013–2019 (2011). [DOI] [PubMed] [Google Scholar]
- [5].Hessels D, Gunnewiek JMTK, van Oort I, Karthaus HFM, van Leenders GJL, van Balken B, Kiemeney LA, Witjes JA & Schalken JA “DD3(PCA3)-based molecular urine analysis for the diagnosis of prostate cancer.” European Urology 44, 8–15 (2003). [DOI] [PubMed] [Google Scholar]
- [6].Cairns P, Esteller M, Herman JG, Schoenberg M, Jeronimo C, Sanchez-Cespedes M, Chow NH, Grasso M, Wu L, Westra WB & Sidransky D “Molecular detection of prostate cancer in urine by GSTP1 hypermethylation.” Clinical Cancer Research 7, 2727–2730 (2001). [PubMed] [Google Scholar]
- [7].Gonzalgo ML, Pavlovich CP, Lee SM & Nelson WG “Prostate cancer detection by GSTP1 methylation analysis of postbiopsy urine specimens.” Clinical Cancer Research 9, 2673–2677 (2003). [PubMed] [Google Scholar]
- [8].Laxman B, Tomlins SA, Mehra R, Morris DS, Wang L, Helgeson BE, Shah RB, Rubin MA, Wei JT & Chinnaiyan AM “Noninvasive detection of TMPRSS2 : ERG fusion transcripts in the urine of men with prostate cancer.” Neoplasia 8, 885–888 (2006). [DOI] [PMC free article] [PubMed] [Google Scholar]
- [9].Rogers CG, Yan G, Zha S, Gonzalgo ML, Isaacs WB, Luo J, De Marzo AM, Nelson WG & Pavlovich CP “Prostate cancer detection on urinalysis for alpha methylacyl coenzyme A racemase protein.” Journal of Urology 172, 1501–1503 (2004). [DOI] [PubMed] [Google Scholar]
- [10].Jeronimo C, Usadel H, Henrique R, Silva C, Oliveira J, Lopes C & Sidransky D “Quantitative GSTP1 hypermethylation in bodily fluids of patients with prostate cancer.” Urology 60, 1131–1135 (2002). [DOI] [PubMed] [Google Scholar]
- [11].Tricoli JV, Schoenfeldt M & Conley BA “Detection of prostate cancer and predicting progression: Current and future diagnostic markers.” Clinical Cancer Research 10, 3943–3953 (2004). [DOI] [PubMed] [Google Scholar]
- [12].Smith AM, Dave S, Nie SM, True L & Gao XH “Multicolor quantum dots for molecular diagnos tics of cancer.” Expert Rev Mol Diagn 6, 231–244 (2006). [DOI] [PubMed] [Google Scholar]
- [13].March-Villalba JA, Martinez-Jabaloyas JM, Herrero MJ, Santamaria J, Alino SF & Dasi F “Cell-Free Circulating Plasma hTERT mRNA Is a Useful Marker for Prostate Cancer Diagnosis and Is Associated with Poor Prognosis Tumor Characteristics.” Plos One 7 (2012). [DOI] [PMC free article] [PubMed] [Google Scholar]
- [14].Duijvesz D, Luider T, Bangma CH & Jenster G “Exosomes as Biomarker Treasure Chests for Prostate Cancer.” Eur Urol 59, 823–831 (2011). [DOI] [PubMed] [Google Scholar]
- [15].Bologna M, Vicentini C, Festuccia C, Muzi P, Napolitano T, Biordi L & Miano L “Early Diagnosis of Prostatic-Carcinoma Based on Invitro Culture of Viable Tumor-Cells Harvested by Prostatic Massage.” European Urology 14, 474–476 (1988). [DOI] [PubMed] [Google Scholar]
- [16].Garret M & Jassie M “Cytologic Examination of Post Prostatic Massage Specimens as an Aid in Diagnosis of Carcinoma of Prostate.” Acta Cytologica 20, 126–131 (1976). [PubMed] [Google Scholar]
- [17].Fujita K, Pavlovich CP, Netto GJ, Konishi Y, Isaacs WB, Ali S, De Marzo A & Meeker AK “Specific detection of prostate cancer cells in urine by multiplex immunofluorescence cytology.” Hum Pathol 40, 924–933 (2009). [DOI] [PMC free article] [PubMed] [Google Scholar]
- [18].DeLuna Frank, Ding XiaoFei, Sagredo Ismael, Bustamante Gilbert, Sun Lu-Zhe, and Jing Yong Ye. “Label-free in vitro prostate cancer cell detection via photonic-crystal biosensor.” In Proc. of SPIE Vol, Vol. 10504, p. 105040D, (2018). [DOI] [PMC free article] [PubMed] [Google Scholar]
- [19].DeLuna F, Ding X, Sun LZ, & Ye JY “Evaluation of a novel label-free photonic-crystal biosensor imaging system for the detection of prostate cancer cells.” In Proc. ofSPIE Vol, Vol. 10068, p. 100681H, (2017). [Google Scholar]
- [20].Ye JY, Guo Y, Norris TB & Baker JR Jr. “Novel Photonic Crystal Sensor.” Patent No 7,639,362. [Google Scholar]
- [21].Ye JY, Gestwicki J, Norris TB, Baker J J. R. & Bersono-Begey T “Analytical system with photonic crystal sensor.” Patent No. 8,497,992. [Google Scholar]
- [22].Ye JY & Ishikawa M “Enhancing fluorescence detection with a photonic crystal structure in a total-internal-reflection configuration.” Optics Letters 33, 1729–1731 (2008). [DOI] [PubMed] [Google Scholar]
- [23].Guo YB, Divin C, Myc A, Terry FL, Baker JR, Norris TB & Ye JY “Sensitive molecular binding assay using a photonic crystal structure in total internal reflection.” Optics Express 16, 11741–11749 (2008). [DOI] [PMC free article] [PubMed] [Google Scholar]
- [24].Guo YB, Ye JY, Divin C, Huang BH, Thomas TP, Baker JR & Norris TB “Real -Time Biomolecular Binding Detection Using a Sensitive Photonic Crystal Biosensor.” Anal Chem 82, 5211–5218 (2010). [DOI] [PMC free article] [PubMed] [Google Scholar]
- [25].Zhang B, Morales AW, Peterson R, Tang L & Ye JY “Label-free detection of cardiac troponin I with a photonic crystal biosensor.” Biosensors & bioelectronics 58, 107–113 (2014). [DOI] [PMC free article] [PubMed] [Google Scholar]
- [26].Zhang B, Tamez-Vela J, Solis S, Bustamante B, Peterson R, Rahman S, Morales A, Tang L & Ye JY “Detection of Myoglobin with open-cavity and label-free photonic crystal biosensor.” Journal of Medical Engineering, 808056 (2013). [DOI] [PMC free article] [PubMed] [Google Scholar]
- [27].Zhang B, Dallo S, Peterson R, Hussain S, Weitao T & Ye JY “Detection of anthrax lef with DNA-based photonic crystal sensors.” JBiomed Opt 16, 127006 (2011). [DOI] [PubMed] [Google Scholar]
- [28].Moralesa AW, Zhangb YS, Alemanb J, Alerasoolb P, Dokmecib MR, Khademhosseinib A, & Yea JY “Label-free detection of protein molecules secreted from an organ-on-a-chip model for drug toxicity assays.” In Proc. ofSPIE Vol, Vol. 9725, pp. 972508–1, (2016). [Google Scholar]
- [29].Scudder Jonathan and Jing Yong Ye, “Limulus Amoebocyte Lysate Test of Endotoxin via a Photonic Crystal Biosensor”, Journal of Biomedical Optics 23(2), 027001 (2018). [DOI] [PMC free article] [PubMed] [Google Scholar]
- [30].Homola J “Surface plasmon resonance sensors for detection of chemical and biological species.” Chemical Reviews 108, 462–493 (2008). [DOI] [PubMed] [Google Scholar]
- [31].Hoa XD, Kirk AG & Tabrizian M “Towards integrated and sensitive surface plasmon resonance biosensors: A review of recent progress.” Biosensors & bioelectronics 23, 151–160 (2007). [DOI] [PubMed] [Google Scholar]