

Abstract
Ebola viruses (EBOVs) have been identified as an emerging threat in recent year as it causes severe haemorrhagic fever in human. Epitope‐based vaccine design for EBOVs remains a top priority because a mere progress has been made in this regard. Another reason is the lack of antiviral drug and licensed vaccine although there is a severe outbreak in Central Africa. In this study, we aimed to design an epitope‐based vaccine that can trigger a significant immune response as well as to prognosticate inhibitor that can bind with potential drug target sites using various immunoinformatics and docking simulation tools. The capacity to induce both humoral and cell‐mediated immunity by T cell and B cell was checked for the selected protein. The peptide region spanning 9 amino acids from 42 to 50 and the sequence TLASIGTAF were found as the most potential B and T cell epitopes, respectively. This peptide could interact with 12 HLAs and showed high population coverage up to 80.99%. Using molecular docking, the epitope was further appraised for binding against HLA molecules to verify the binding cleft interaction. In addition with this, the allergenicity of the epitopes was also evaluated. In the post‐therapeutic strategy, docking study of predicted 3D structure identified suitable therapeutic inhibitor against targeted protein. However, this computational epitope‐based peptide vaccine designing and target site prediction against EBOVs open up a new horizon which may be the prospective way in Ebola viruses research; the results require validation by in vitro and in vivo experiments.
Introduction
The curse of Ebola virus is not new; it is almost several decades older, but now the disasters caused by Ebola virus is severe than ever, and it may become even worse if we do not pay proper attention. Ebola viruses (EBOVs) belong to the Filoviridae family and are negative‐strand RNA, non‐segmented, enveloped viruses. They are responsible for causing fatal haemorrhagic fever in human and non‐human primates with a fatality rate up to 90% 1, 2.
Ebola virus infection in human is characterized by an immediate onset of flu‐like illness, followed a preliminary incubation period of 2–21 days. After this initial period of infection, the sign and symptoms of the disease became prominent which include nausea, anorexia, chest pain, vomiting, neurological complications, cough, oedema, postural hypotension and mucosal haemorrhage 3. Transmission of EBOVs occurs among human and non‐human primate such as chimpanzees or gorillas through direct contact with infected bodily fluids, blood, from an infected person or animal; even the intentional release of EBOVs may also cause mucosal infection by aerosol dispersion 4, 5, 6.
Up to now, five different strains of EBOV have been identified: Sudan (SEBOV); Ivory Coast; Zaire (ZEBOV); Reston and the most recently identified strain Bundibugyo 7. Among them, SEBOV and ZEBOV are considered as the most commonly occurring infections with the highest number of deaths. The most current occurrence of Ebola virus reported in Guinea in December 2013 8, 9 and afterwards spread to Liberia, Sierra Leone and Nigeria 10. The unpredictable size and scale of this current outbreak has the capability to destabilize already delicate economies and health care. Wild‐type Filovirus infection is considered to be the most deadly one having mortality rate as high as 90% in human cases only 11. This high mortality rates, deficiency of treatment and vaccination make Ebola virus a potential public enemy and a category of biothreat pathogen 12.
Several attempts have been made to develop effective vaccine against Ebola virus due to its reoccurrence and deadly nature.
An ideal vaccine which initiates both humoral and cell‐mediated immune response is essential to completely eradicate the chance of re‐infection. Vaccine design methods based on T cell epitope can be characterized as the recognition of immune‐dominant epitopes of the virus and synthesizing it to be utilized as vaccines to induce effective immune response 13. These assessments enhance the possibility of an ideal vaccine candidate. Computer‐based prediction tools reduce the number of validation experiments and time for epitope prediction 14. There are a number of epitope prediction tools now available on the Web, and bioinformatics‐based prediction of CTL epitopes has gained huge popularity in drug design and development activity.
Conventional vaccines are usually prepared based on either attenuated or inactivated whole pathogen. This approach has a number of limitations, but among them, safety is the most fundamental problem, because pathogens that are utilized for vaccination may revert to its pathogenic form and can cause infection. Moreover, genetic variation of these pathogens all over the globe may results in reduced efficiency of these vaccines in different parts of the world. But vaccine designing methodology such as DNA vaccines and epitope‐based vaccines have the capability to overcome these obstacles for the development of vaccine that can initiate more effective, specific, strong and long‐lasting immune response with minimal cost and side effects 15. The method of epitope‐based vaccine development has been reported against rhinovirus 16, dengue virus 17, human coronaviruses 18, chikungunya virus 19 and Saint Louis encephalitis virus 20. Although, most the epitope‐based vaccines are developed based on B cell epitopes, the potentiality of T cell epitope‐based vaccine is also promising because CD8+ T cell can induce a more effective immune response of the host cell to the infected T cells 21.
Various potential vaccine candidates that are developed based on the EBOV‐GP have been successfully exhibited protection in non‐human primates: Ebola virus‐like particles 22; a replication‐deficient adenovirus expressing the EBOV‐GP 23, 24, 25; a replication‐competent vesicular stomatitis virus expressing EBOV‐GP 26, 27; and a recombinant paramyxovirus expressing EBOV‐GP 28.
Many Ebola vaccine candidates had been developed in the decade prior to 2014 29, but none has yet been approved for clinical use in humans. Two vaccine candidates currently being tested in humans are the ChAd3‐ZEBOV vaccine, being developed by GlaxoSmithKline, in collaboration with the United States National Institute of Allergy and Infectious Diseases, and the rVSV‐ZEBOV vaccine, being developed by New Link Genetics and Merck Vaccines USA, in collaboration with the Public Health Agency of Canada. Both vaccines have shown to be safe and efficacious in animals 30, 31, 32.
In our present study, we attempted to recognize major immunogenic epitopes on Ebola viral proteins and predict a vaccine as well as effective inhibitor binding sites. Simultaneously, we also performed a genomewide search to recognize the most suitable drug target site and simulated inhibition of the target site by a predicted inhibitor molecule by utilizing bioinformatics tools. The study will enhance further future laboratory‐based attempts developing effective treatment and prevention of Ebola virus infection.
Materials and methods
The flow chart representing the overall procedures of peptide vaccine development and target site depiction for Ebola virus is illustrated in Fig. 1.
Figure 1.
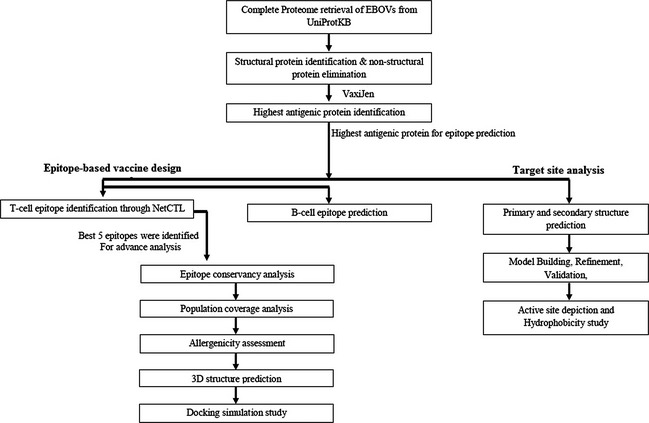
Graphical representation of Peptide vaccine design and target site depiction against Ebola viruses.
Epitope‐based vaccine design
From the complete proteome of EBOVs, the amino acid sequences were retrieved using UniProt Knowledge Base (UniProtKB) database in FASTA format excluding the variable region. UniProtKB can be defined as the exclusive protein sequence and annotation information server which provide functional information about proteins with accuracy and consistency. A number of non‐structural proteins (NSP) were expelled from this selection. Then, analyses of the sequences were conducted to study antigenicity, solvent‐accessible regions, surface accessibility, flexibility and MHC class‐I binding sites 33, 34.
Proteins were submitted in the VaxiJen v2.0 server which was utilized for the prediction of effective antigens and subunit vaccines using defaults parameter 35. Plain sequence format was uploaded, and virus was chosen as target organism. All antigenic proteins were then sorted out accordingly their relevant score in an excel file. Only one antigenic protein having the highest antigenicity score was selected to carry out further the evaluation.
Constant predictions of CTL epitopes are very essential for designing coherent vaccine. For this purpose, NetCTL‐1.2 36, an internet‐based server devised for identifying human CTL epitopes in a target protein was used. The total score was then calculated by summing up the values of TAP transport efficiency, proteasomal cleavage and MHC‐I molecules binding affinity. For our present study, we set the parameter at 0.5 which have sensitivity and specificity of 0.89 and 0.94, respectively. Five highest score containing epitopes were selected for further dry laboratory experimentation. IC50 values to determine the binding affinity of peptide with MHC‐I molecules 37 were calculated by utilizing the stabilized matrix base method (SMM) 38. For both frequent and non‐frequent allele, peptide length was defaulted at 9 amino acids prior to prediction. For further validation, we only selected the alleles with less than 200 nm binding affinity IC50. To calculate the processing score, TAP score, proteasomal cleavage score and MHC‐I binding affinity, an additional IEDB analysis resource tool was also used. We also implemented the SMM tool to predict these scores for every single selected peptide 39.
Epitope conservancy prediction for each epitopes was calculated using the IEDB analysis resource 40.
Using IEDB population coverage tool, population coverage for individual epitope was calculated. Every epitope and their MHC‐I molecules were added, and population coverage area was also selected earlier before submission 40.
AllerHunter, an online server, was implemented to predict the allergenicity of the selected epitope. This server predicts allergenicity utilizing a combinational prediction method, where combined allergenicity assessment protocols of the Food & Agriculture Organization (FAO) and World Health Organization (WHO) were followed with the support vector machines (SVM)‐pairwise sequence similarity. AllerHunter predict both allergen and non‐allergens with high specificity which contributes AllerHunter to be a very comprehensive tool for allergen cross‐reactivity prediction 41, 42. To make stronger the AllerHunter prediction, allergenicity was also checked by another online tool named AllerTop 2.0 (http://www.ddg-pharmfac.net/AllerTOP/).
The highest conserve TLASIGTAF epitope was submitted to PEP‐FOLD 43 server to conduct docking simulation study which provided 5 probable 3D structures. The best model was taken to study the interactions with HLAs.
A docking analysis is conducted to ensure the interaction between HLA molecules and our targeted epitope by implementing AutoDockVina 44. We retrieved 3LKM (a crystal structure of HLA‐B*3501) from the RCSB database to perform docking analysis 45. Before performing the docking analysis, the NP418 epitope of influenza, which form a complex with the HLA‐B*3501 binding groove 46, was eliminated by utilizing Discovery Studio 47. First docking study between predicted epitope and prepared HLA‐B*3501 was performed followed by influenza NP418 epitope and prepared HLA‐B*3501.
B cell epitope prediction tools of IEDB were used to predict linear B cell epitopes based on the highest immunogenic protein sequence. The most important properties for predicting B cell epitopes are flexibility, antigenicity, surface accessibility, hydrophilicity and linear epitope predictions 48. We analysed the flexibility, antigenicity, surface accessibility, hydrophilicity and linear epitope predictions of our selected highest antigenic protein using the Karplus and Schulz flexibility prediction 49, Kolaskar and Tongaonkar antigenicity scale 50, Emini surface accessibility prediction 51, Parker hydrophilicity prediction 52 and Bepipred linear epitope prediction algorithms 53, respectively, of IEDB analysis resource. A number of wet laboratory studies stated that the antigenic portion was located in beta‐turn regions of a protein 54. Chou and Fasman beta‐turn 55 prediction method was utilized for analysing that region.
Target site analysis
For the assessment of different physiological and chemical characteristics of the selected protein, several tools such as ProtParam 56 and self‐optimized prediction method with alignment (SOPMA) of Expasy server were utilized. Isoelectric point (pI), molecular weight, amino acid composition, grand average hydropathicity (GRAVY), estimated half‐life, extinction coefficient 57, instability index 58 and aliphatic index 59 of the protein were calculated using default parameters through ProtParam. Properties such as solvent accessibility, globular regions, transmembrane helices, random coil, bend region and coiled‐coil region were anticipated by SOPMA.
For functional analysis of this protein, a specialized tool PFP from Kihara Bioinformatics Laboratory (http://kiharalab.org/web/pfp.php) was used. The retrieved amino acid sequence in FASTA format was used as input data. GlobPlot 2.3 (http://globplot.embl.de/) was used for the prediction of disease‐causing regions.
Modeller 9.14 through HHpred was implemented for predicting the three‐dimensional (3D) structure of the selected protein 60, 61. FASTA format data were submitted, and intensive modelling option was selected to yield protein model. ModRefiner 62 was used to refine homology predicted protein structure. In our current study, refinement was performed for several times to get better minimized protein energy. Lastly, the protein was visualized by Swiss‐PDB Viewer 63. For the assessment of accuracy and stereochemical properties of the predicted model, PROCHECK was performed by Ramachandran plot analysis 64 utilizing ‘protein structure and model assessment tools’ of SWISS‐MODEL workspace. Refined PDB format of the protein was submitted, and 2.5 Å resolution value was selected. Protein structure assessment and 3D profiling of the predicted protein and model quality estimation were performed by ERRAT 56 and QMEAN 65, respectively. All the parameters were kept default for the above evaluation tools.
Active site analysis gives a clear perception about the docking simulation study. The active binding sites of the protein were searched accordingly to the structural association of template and the model construct with CASTp (computed atlas of surface topography of proteins) 66 server. This was utilized to identify and determine the binding sites, surface structural pockets, internal cavities of proteins and active sites, area, shape and volume of every pocket. The measurement of the hydrophobicity of desired protein sequences also represents many biophysical consequences, for example protein–protein or protein–ligand binding which play an important role in drug design. Discovery Studio 4.0 client (http://accelrys.com/products/discovery-studio/) has been employed in this regard.
Result
Epitope‐based peptide vaccine design
As a result of our query for Ebola virus structural and non‐structural protein, 282 hits are generated in total. All the proteins were assessed by VaxiJen server. The capability of each protein sequence to initiate an immune response is indicated by the overall score produced by the specific protein sequence using VaxiJen server. The protein sequence having the UniprotKB ID: K4G1K7 achieved the highest score of 0.7024 in VaxiJen analysis among all the query proteins. The protein itself is named as the L protein comprising of 128 amino acids which is also known as RNA‐dependent RNA polymerase. In our present study, we have selected this protein to carry out further analysis.
NetCTL server was utilized to predict the T cell epitopes of the protein. The first 5 epitopes VEIKTGFKL, GFKLRSAVM, ARVAASLAK, TSACGIFLK and TLASIGTAF were selected according to the highest combinatorial score. Based on the IEDB MHC class‐1 binding prediction tool, the previously selected epitopes were found to be identified by a range of MHC class‐1 molecule. In this study, we opted for the selection of the MHC‐I molecules with coupled IC50 value less than 200 nm (IC50 <200), this ensured the selection of the MHC‐I molecules (Table 1) for which the selected epitopes showed higher affinity. MHC‐I processing efficiency tool of IEDB generates an overall score for every epitope accordingly their proteasomal cleavage efficiency, TAP transport efficiency and MHC‐I binding efficiency combined. The combined score represented the potentiality of the peptides for presentation, the higher the score, the better they are, and this is the most crucial step for initiating a successful immune response. The scores obtained from IEDB MHC‐I binding analysis and processing tools are summarized in Table 1. Identification of epitopes by HLA molecules combined with effective determines the intensity of immune response. So, a peptide recognized by the highest number of HLA alleles possesses the highest potentiality to initiate a strong immune response. Among the 5 epitopes studied, one epitope has interacted with higher number of HLA alleles than the other epitopes. The 9‐mer epitope TLASIGTAF showed affinity for highest 12 MHC‐I molecules including HLA‐C*03:03, HLA‐A*32:07, HLA‐B*27:20, HLA‐A*68:23, HLA‐C*14:02, HLA‐B*15:01, HLA‐B*15:02 (0.47) HLA‐A*02:50, HLA‐B*15:03, HLA‐A*02:02, HLA‐A*32:15 and HLA‐A*32:01.
Table 1.
Most potential 5 T cell epitopes with interacting MHC‐I alleles, total processing score and epitope conservancy result
| Epitope | Interacting MHC‐I allele with an affinity <.200 (total score of proteasome score, TAP score, MHC score, processing score and MHC‐I binding) | Epitope conservancy analysis result (%) |
|---|---|---|
| VEIKTGFKL | HLA‐A*02:17 (0.74) | 74.47 |
| HLA‐A*02:50 (0.48) | ||
| HLA‐B*40:01 (0.23) | ||
| HLA‐A*32:07 (0.20) | ||
| HLA‐B*27:20 (0.09) | ||
| HLA‐C*03:03 (0.06) | ||
| HLA‐C*12:03 (0.05) | ||
| HLA‐B*40:13 (−0.02) | ||
| HLA‐B*15:02 (−0.04) | ||
| HLA‐A*68:23 (−0.07) | ||
| GFKLRSAVM | HLA‐C*12:03 (0.34) | 72.34 |
| HLA‐A*68:23 (0.05) | ||
| HLA‐A*32:07 (0.03) | ||
| HLA‐B*27:20 (0.02) | ||
| HLA‐C*03:03 (−0.33) | ||
| HLA‐A*02:17 (−0.49) | ||
| HLA‐C*14:02 (−0.60) | ||
| HLA‐A*32:15 (−0.77) | ||
| HLA‐B*40:13 (−0.98) | ||
| ARVAASLAK | HLA‐B*27:20 (0.64) | 76.24 |
| HLA‐C*03:03 (−0.23) | ||
| HLA‐C*12:03 (−0.38) | ||
| HLA‐A*32:07 (−0.75) | ||
| HLA‐A*68:23 (−0.76) | ||
| HLA‐C*14:02 (−0.84) | ||
| HLA‐B*27:05 (−1.03) | ||
| TSACGIFLK | HLA‐B*27:20 (0.25) | 70.21 |
| HLA‐A*11:01 (−0.10) | ||
| HLA‐A*68:01 (−0.16) | ||
| HLA‐A*32:07 (−0.44) | ||
| HLA‐C*03:03 (−0.51) | ||
| HLA‐B*40:13 (−0.56) | ||
| HLA‐A*68:23 (−0.75) | ||
| HLA‐C*12:03 (−0.81) | ||
| HLA‐C*07:01 (−0.95) | ||
| HLA‐A*03:01 (−1.11) | ||
| TLASIGTAF | HLA‐C*03:03 (1.32) | 76.60 |
| HLA‐A*32:07 (0.94) | ||
| HLA‐B*27:20 (0.83) | ||
| HLA‐A*68:23 (0.67) | ||
| HLA‐C*14:02 (0.56) | ||
| HLA‐B*15:01 (0.49) | ||
| HLA‐B*15:02 (0.47) | ||
| HLA‐A*02:50 (0.43) | ||
| HLA‐B*15:03 (0.42) | ||
| HLA‐A*02:02 (0.27) | ||
| HLA‐A*32:15 (0.23) | ||
| HLA‐A*32:01 (0.20) |
This article is being made freely available through PubMed Central as part of the COVID-19 public health emergency response. It can be used for unrestricted research re-use and analysis in any form or by any means with acknowledgement of the original source, for the duration of the public health emergency.
Conserved epitopes can give a more successful immunization; therefore, better conservancy of an epitope is expected. Epitope conservancy analysis exposed (Table 1) the epitope ARVAASLAK to be 76.00% conserved whereas epitope TLASIGTAF scored 76.60%. Other three epitopes VEIKTGFKL, GFKLRSAVM and TSACGIFLK showed 74.47%, 72.34% and 70.21% conservancy, respectively.
For every epitope, the MHC‐I binders that were recognized as optimum were then selected for the population coverage analysis. Identified optimum MHC‐I binders for each epitopes were considered for the population coverage analysis of the epitopes. The epitopes indicated that 59.30% coverage in West Africa along with 55.93% and 60.89% coverage in Central Africa and North Africa, respectively. In some recently Ebola virus‐infected area such as Uganda, Sudan and Mali, the epitopes revealed 61.84%, 69.09% and 52.56% population coverage, respectively. The population coverage analysis of the selected epitopes is tabulated in Table 2.
Table 2.
Population coverage calculated by epitopes
| Population | Coverage (%)a | Average hitb | PC90c |
|---|---|---|---|
| East Asia | 65.78 | 2.04 | 0.29 |
| South‐East Asia | 69.00 | 1.54 | 0.32 |
| Europe | 77.57 | 2.08 | 0.45 |
| West Africa | 59.30 | 0.93 | 0.25 |
| Central Africa | 55.93 | 1.00 | 0.23 |
| North Africa | 60.89 | 1.25 | 0.26 |
| North America | 65.19 | 1.46 | 0.29 |
| United States | 65.86 | 1.48 | 0.29 |
| Australia | 65.43 | 1.73 | 0.29 |
| Papua New Guinea | 70.24 | 1.81 | 0.34 |
| Pakistan | 69.75 | 1.44 | 0.33 |
| Philippines | 70.95 | 1.72 | 0.34 |
| Germany | 80.99 | 2.19 | 0.53 |
| Uganda | 61.84 | 1.25 | 0.26 |
| Sudan | 69.09 | 1.70 | 0.32 |
| Mali | 52.56 | 0.97 | 0.21 |
| United States Asian | 71.42 | 1.87 | 0.35 |
| United States Caucasoid | 78.29 | 2.05% | 0.46 |
| United States Polynesian | 72.57 | 2.88 | 0.36 |
Projected population coverage.
Average number of epitope hits/HLA combinations recognized by the population.
Minimum number of epitope hits/HLA combinations recognized by 90% of the population.
This article is being made freely available through PubMed Central as part of the COVID-19 public health emergency response. It can be used for unrestricted research re-use and analysis in any form or by any means with acknowledgement of the original source, for the duration of the public health emergency.
The query sequence does not meet the standard set by the FAO/WHO evaluation scheme for cross‐reactive allergen prediction. As a result, the query sequence is considered as a non‐allergen by the FAO/WHO evaluation scheme. AllerHunter revealed the query sequence as a non‐allergen with score of 0.02. (SE = 94.4%, SP = 70.3%) in contrast, AllerTop 1.0 disclosed our selected sequence as probable allergen. The probability to be food and inhalant was 33.3.
By evaluating the five initially chosen epitopes, it was found that the epitope ‘TLASIGTAF’ was the most ideal one as a vaccine candidate than other epitopes by considering its overall epitope conservancy, population coverage and by the affinity for highest number of HLA molecules.
AutoDockVina predicted the binding mode for the epitope TLASIGTAF with HLA molecules. To conduct further analysis, we first retrieved HLA‐B*3501 attached with influenza NP418 epitope crystal structure. After that docking simulation was performed with NP418 epitope eliminated HLA molecule. The binding energy of predicted epitope with HLA‐B*3501 receptor was found to be −6.2 kcal/mol. The binding energy of influenza NP418 epitope was then compared to HLA‐B*3501 epitope which was −7.6 kcal/mol. The 3D structures shown in Fig. 2 of HLA and Epitope are visualized and captured with Pymol molecular graphics system (Version 1.5.0.3).
Figure 2.
Docking simulation analysis revealed by AutodockVina. (A) 3D structure of our predicted epitope, ‘TLASIGTAF’ and (B) visualization of docking results of ‘TLASIGTAF’ with HLAB*3501.
The query protein was evaluated to identify B cell epitopes by various online tools available in IEDB. Kolaskar and Tongaonkar antigenicity prediction tool evaluated the protein for B cell epitopes analysing the physicochemical properties of the amino acids and their profusion in recognized B cell epitopes. The tool provided a result predicting an average antigenic propensity value of 1.043 for the protein with the maximum value of 1.214 and minimum of 0.915. The tool was tagged with the targeted value of 0.920 to scan for antigenically potent regions, and about all regions showed desired B cell epitope properties. Surface accessibility of B cell epitopes is essential because hydrophilic regions are usually exposed on the surface and likely to initiate B cell immune response. The Emini surface accessibility prediction and Parker hydrophilicity prediction tools were utilized. The highest surface accessible region was from 39 to 52 amino acid sequences. On the other hand, the most hydrophilic region was between 42 and 50 amino acid sequences. The beta‐turns in a protein are usually surface accessible and exhibit hydrophilic nature. Chou and Fasman beta‐turn prediction was performed for the protein to find the beta‐turn regions in the query protein as beta‐turns have an important consequence in initiating antigenicity. Generated outcomes recognized regions from 23 to 29, 41 to 51 and 87 to 100 with constant predicted B‐turn region.
Flexible regions on the query protein can be recognized using Karplus Schulz flexibility prediction tool. The regions from 13 to 20, 39 to 51, 96 to 102 and 115 to 121 are considerably the most favourable region in the flexibility prediction analysis. Linear B cell epitopes were determined by utilizing Bepipred, a machine learning process based on hidden Markov model. The region from 38 to 55 is also the most favourable region in Bepipred linear epitope prediction.
After cross‐processing all the data obtained from the previous B cell epitope prediction tools, the region from 42 to 50 amino acids is found to be the best capable region for inducing B cell response. The overall result of B cell epitope analysis was represented in Figure S1.
Target site analysis
Structural features and function of protein are interrelated. ProtParam generated results provided 43.28 instability index (II), 90.78 aliphatic index and negative GRAVY (grand average hydropathy) of 0.120 for the protein. SOPMA calculated the secondary structural features of the protein and reported that the protein is dominated by alpha‐helix 38.28%, consisting random coils and extended strands formed 23.44% and 23.44% of the protein, respectively. Lastly, it showed beta‐turns constituting 14.84%. The parameters calculated by both the tools are shown in Tables S1 and S2, respectively.
The functions of protein under study were predicted by PFP from Kihara Bioinformatics Laboratory, which uses references from Gene Ontology. These are shown in Table S3. The result from GlobPlot 2.3 was used to identify three disease‐causing regions (Figure S2).
A 3D structure of the Ebola L protein was predicted utilizing Modeller 9.11. Modeller generated model was refined with ModRefiner to acquire a more stereochemically precise model. Refined model demonstrated that most of the residues of the protein (>90%) is in the most favoured region. The refined model was utilized to perform subsequent analysis. A Swiss‐PDB generated view of the 3D model is displayed in Figure S3. The predicted model in our present study was validated to determine its accuracy comparing it with high‐resolution models with a various structure of validation tools. PROCHECK conducted an overall analysis of the model and generated the Ramachandran plot shown in Figure S4 and Table S4. Other verification tool QMEAN generated an environmental profile graph for a given protein and perform a verification of protein model, respectively.
The active sites of the EBOVs L protein are shown in Fig. 3 identified from CASTp server. The measured outcome indicated that amino acid position 4–60 is predicted to be conserved with the active site. The server predicted the best active site with an area of 232.7 and formed with 224.9 amino acid residues. For facilitating the drug discovery against Ebola viruses, the hydrophobicity has been depicted in Figure S5, which stands strong hydrophobicity in nature of our desired protein sequence.
Figure 3.

Ligand binding sites on the predicted 3D structure of RNA‐dependent RNA polymerase. (A) Active site residues in the 3D structure. (B) Active site cavity by Discovery Studio.
Discussion
T cell epitope‐based vaccination is a distinctive approach. Despite the fact that antibody memory response can be easily avoided by antigenic drift over the period of time, cell‐mediated immunity frequently elicits enduring immunity 32. A significant number of time and money has already been spent on EBOVs‐vaccine design, however, with very little achievement to show for it. We believe that, although some of the steps forward made in this regard have brought in the promises in clinical trials, this standpoint is very worth trying and attempting.
To be a good peptide epitope, a particular sequence has to posses some key properties. Firstly, the epitope has to be fairly well conserved among EBOVs proteome. Additionally, the epitope must have the qualities that make sure processivity. Moreover, the processed peptide has to be able relate with MHC alleles with high affinity. Lastly, the interacting MHC allele has to generally confirm good population coverage. The predicted T cell epitope fulfilled all the criteria mentioned above.
Five prospective T cell epitopes were found in EBOVs L protein, which cross‐reacts with 23 HLA variants (11 HLA‐A, 7 HLA‐B and 5 HLA‐C alleles). The predicted T cell epitope, TLASIGTAF, is well conserved among the five most probable epitopes selected from NetCTL T cell epitope analysis. In epitope‐based vaccine development, a well‐conserved epitope is expected to express a higher protection across different strains. The conservancy of our selected epitope is 76.60%, and consequently, it was regarded as a universal epitope target.
Population coverage is another key factor in the development of a peptide vaccine that measures the percentage of people living in a given area to be potentially responsive to the query epitopes.
The epitope was subjected to allergenicity analysis by two online tools. AllerHunter pointed out it as non‐allergen although AllerTop 1.0 identified it as probable allergen. Therefore, if an epitope vaccine was developed by utilizing selected peptides, the probability of allergic reactions is very low. There have another concern that epitope design based on prediction might not effort in reality. So, the selected epitope was subjected to in silico docking simulation study. The docking analysis concluded that our selected epitope can bind as competently as the control considered in this regard.
EBOVs L protein was also searched for B cell epitopes which can induce both primary and secondary immunity. After cross‐referencing several tools of IEDB generated results, it was found that the most favourable region from 42 to 50 (PEEQEQSAE) as potent 9‐mer B cell epitope.
In the post‐therapeutic strategy, an insight was attained from the primary and secondary structure analysis of the protein from ProtParam and SOPMA tools. The L protein, suggested by VaxiJen is found to be stable in vitro with below 43.28 instability indexes, low GRAVY and higher aliphatic index. The higher proportion of coiled region in SOPMA analysis implicated stability of the selected protein 59, 67, 68. An algorithm, called PFP from Kihara Bioinformatics Laboratory, and GlobPlot 2.3 was used for functional characterization and disordered region identification.
To assist future drug design and drug discovery, Ligand binding sites and hydrophobicity analysis were performed. Hydrophobicity impacts every aspect of drug design and even delivery, as has been repeatedly pointed out over the past century. Understanding and exploiting the hydrophobic effect in drug design, for example docking and target structure prediction, will undoubtedly be more important in the future 69.
Conclusion
Development of effective therapeutics for Ebola virus remains a high priority, and considerable improvement has been made over the last few years. However, we still need to know a lot about the biology and pathogenesis of Ebola virus infections to identify a suitable vaccine. Keeping these facts in mind, in this present study, using computational and bioinformatics tools, we try to identify a novel therapeutic vaccine besides target site study for the treatment of Ebola virus with previously established procedures. The B cell and T cell epitopes we identified could be a breakthrough for the development for new therapeutic and diagnostic tools. However, it is also recommended that further in vivo and in vitro assessment of this vaccine have to perform for the confirmation of this study.
Supporting information
Figure S1 B cell epitope identification of the most antigenic protein, K4G1K7.
Figure S2 GlobPlot result presents the disease‐causing regions of RNA‐dependent RNA polymerase.
Figure S3 Swiss‐pdb generated structure of the EBOVs RNA‐dependent RNA polymerase.
Figure S4 Ramachandran plot analysis of K4G1K7. Here, red region indicates favoured region, yellow region for allowed, and light yellow shows generously allowed region and white for disallowed region. Phi and Psi angels determine torsion angels.
Figure S5 Hydrophobicity plot analysis of K4G1K7.
Table S1 Different physiochemical properties of Ebola RNA‐dependent RNA polymerase.
Table S2 Secondary structure analysis through SOPMA of Ebola RNA‐dependent RNA polymerase.
Table S3 Predicted functions of Ebola RNA‐dependent RNA polymerase.
Table S4 Ramachandran plot of EBOVs RNA‐dependent RNA polymerase.
References
- 1. Beer B, Kurth R, Bukreyev A. Characteristics of Filoviridae: Marburg and Ebola viruses. Naturwissenschaften 1999;86:8–17. [DOI] [PubMed] [Google Scholar]
- 2. Feldmann H, Geisbert TW. Ebola haemorrhagic fever. Lancet 2011;377:849–62. [DOI] [PMC free article] [PubMed] [Google Scholar]
- 3. Genton C, Cristescu R, Gatti S et al Recovery potential of a western lowland gorilla population following a major Ebola outbreak: results from a ten year study. PLoS ONE 2012;7:e37106. [DOI] [PMC free article] [PubMed] [Google Scholar]
- 4. Bausch DG, Towner JS, Dowell SF et al Assessment of the risk of Ebola virus transmission from bodily fluids and fomites. J Infect Dis 2007;196 (Suppl. 2):S142–7. [DOI] [PubMed] [Google Scholar]
- 5. Dowell SF, Mukunu R, Ksiazek TG, Khan AS, Rollin PE, Peters CJ. Transmission of Ebola hemorrhagic fever: a study of risk factors in family members, Kikwit, Democratic Republic of the Congo, 1995. Commission de Luttecontre les Epidemies a Kikwit. J Infect Dis 1999;179 (Suppl 1):S87–91. [DOI] [PubMed] [Google Scholar]
- 6. Jaax N, Jahrling P, Geisbert T et al Transmission of Ebola virus (Zaire strain) to uninfected control monkeys in a biocontainment laboratory. Lancet 1995;346:1669–71. [DOI] [PubMed] [Google Scholar]
- 7. Towner JS, Sealy TK, Khristova ML et al Newly discovered Ebola virus associated with hemorrhagic fever outbreak in Uganda. PLoS Pathog 2008;4:e1000212. [DOI] [PMC free article] [PubMed] [Google Scholar]
- 8. Baize S, Pannetier D, Oestereich L, Rieger T, Koivogui L, Magassouba N, Soropogui B, Sow MS, Keïta S, De Clerck H, Tiffany A, Dominguez G, Loua M, Traoré A, Kolié M, Malano ER, Heleze E, Bocquin A, Mély S, Raoul H, Caro V, Cadar D, Gabriel M, Pahlmann M, Tappe D, Schmidt‐Chanasit J, Impouma B, Diallo AK, Formenty P, Van Herp M, Günther S. Emergence of Zaire Ebola virus disease in Guinea – preliminary report. N Engl J Med 2014;371:1418–25. [DOI] [PubMed] [Google Scholar]
- 9. Bausch DG, Schwarz L. Outbreak of Ebola virus disease in Guinea: where ecology meets economy. PLoS Negl Trop Dis 2014;8:e3056. [DOI] [PMC free article] [PubMed] [Google Scholar]
- 10. ECDC . Outbreak of Ebola virus disease in West Africa. Stockholm: ECDC, 2014. [Google Scholar]
- 11. Sanchez A, Geisbert TW, Feldmann H. Filoviridae: Marburg and Ebola Viruses In: Knipe DM, Howley PM, eds. Fields Virology, Vol. 1. Philadelphia, PA, USA: Lippincott Williams & Wilkins, 2007:1409–48. [Google Scholar]
- 12. Centers for Disease Control and Prevention . Bioterrorism agents/diseases, 2014. Available at: http://www.bt.cdc.gov/agent/agentlist-category.asp#a (accessed 10th January 2015).
- 13. Atanas P, Irini D. T‐cell epitope vaccine design by immunoinformatics. Open Biol 2013;3:120139. [DOI] [PMC free article] [PubMed] [Google Scholar]
- 14. Lin HH, Zhang GL, Tongchusak S, Reinherz EL, Brusic V. Evaluation of MHCII peptide binding prediction servers: applications for vaccine research. BMC Bioinformatics 2008;9 (Suppl. 12):S22. [DOI] [PMC free article] [PubMed] [Google Scholar]
- 15. Arnon R. A novel approach to vaccine design–epitope‐based vaccines. FEBS J 2006;273:33–4. [Google Scholar]
- 16. Lapelosa M, Gallicchio E, Arnold GF, Arnold E, Levy RM. In silico vaccine design based on molecular simulations of rhinovirus chimeras presenting HIV‐1 gp41 epitopes. J Mol Biol 2009;385:675–91. [DOI] [PMC free article] [PubMed] [Google Scholar]
- 17. Chakraborty S, Chakravorty R, Ahmed M et al A computational approach for identification of epitopes in dengue virus envelope protein: a step towards designing a universal dengue vaccine targeting endemic regions. Silico Biol 2010;10:235–46. [DOI] [PubMed] [Google Scholar]
- 18. Sharmin R, Islam AB. A highly conserved WDYPKCDRA epitope in the RNA directed RNA polymerase of human coronaviruses can be used as epitope‐based universal vaccine design. BMC Bioinformatics 2014;15:161. [DOI] [PMC free article] [PubMed] [Google Scholar]
- 19. Hasan MA, Khan MA, Datta A, Mazumder MHH, Hossain MU. A comprehensive immunoinformatics and target site study revealed the corner‐stone toward Chikungunya virus treatment. Mol Immunol 2015;65:189–204. [DOI] [PMC free article] [PubMed] [Google Scholar]
- 20. Hasan MA, Hossain M, Alam MJ. A computational assay to design an epitope‐based Peptide vaccine against Saint Louis encephalitis virus. Bioinform Biol Insights 2013;7:347–55. [DOI] [PMC free article] [PubMed] [Google Scholar]
- 21. Klavinskis LS, Whitton JL, Oldstone MB. Molecularly engineered vaccine which expresses an immunodominant T‐cell epitope induces cytotoxic T lymphocytes that confer protection from lethal virus infection. J Virol 1989;63:4311–6. [DOI] [PMC free article] [PubMed] [Google Scholar]
- 22. Warfield KL, Swenson DL, Olinger GG, Kalina WV, Aman MJ, Bavari S. Ebola virus‐like particle‐based vaccine protects nonhuman primates against lethal Ebola virus challenge. J Infect Dis 2007;196 (Suppl. 2):S430–7. [DOI] [PubMed] [Google Scholar]
- 23. Pratt WD, Wang D, Nichols DK et al Protection of nonhuman primates against two species of Ebola virus infection with a single complex adenovirus vector. Clin Vaccine Immunol 2010;17:572–81. [DOI] [PMC free article] [PubMed] [Google Scholar]
- 24. Sullivan NJ, Geisbert TW, Geisbert JB et al Immune protection of nonhuman primates against Ebola virus with single low‐dose adenovirus vectors encoding modified GPs. PLoS Med 2006;3:e177. [DOI] [PMC free article] [PubMed] [Google Scholar]
- 25. Sullivan NJ, Geisbert TW, Geisbert JB et al Accelerated vaccination for Ebola virus haemorrhagic fever in non‐human primates. Nature 2003;424:681–4. [DOI] [PMC free article] [PubMed] [Google Scholar]
- 26. Feldmann H, Jones SM, Daddario‐DiCaprio KM et al Effective post‐exposure treatment of Ebola infection. PLoS Pathog 2007;3:e2. [DOI] [PMC free article] [PubMed] [Google Scholar]
- 27. Jones SM, Feldmann H, Stroher U et al Live attenuated recombinant vaccine protects nonhuman primates against Ebola and Marburg viruses. Nat Med 2005;11:786–90. [DOI] [PubMed] [Google Scholar]
- 28. Bukreyev A, Rollin PE, Tate MK et al Successful topical respiratory tract immunization of primates against Ebola virus. J Virol 2007;81:6379–88. [DOI] [PMC free article] [PubMed] [Google Scholar]
- 29. Richardson JS, Dekker JD, Croyle MA, Kobinger GP. Recent advances in Ebolavirus vaccine development. Human Vaccines 2010;6:439–49. [DOI] [PubMed] [Google Scholar]
- 30. Hoenen T, Groseth A, Feldmann H. Current Ebola vaccines. Expert Opin Biol Ther 2012;12:859–72. [DOI] [PMC free article] [PubMed] [Google Scholar]
- 31. Fausther‐Bovendo H, Mulangu S, Sullivan NJ. Ebolavirus vaccines for humans and apes. Curr Opin Virol 2012;2:324–9. [DOI] [PMC free article] [PubMed] [Google Scholar]
- 32. Galvani AP et al Ebola vaccination: if not now, when? Ann Intern Med 2014;161:749–50. [DOI] [PMC free article] [PubMed] [Google Scholar]
- 33. The UniProt Consortium . Activities at the universal protein resource (UniProt). Nucleic Acids Res 2014;42:D191–8. [DOI] [PMC free article] [PubMed] [Google Scholar]
- 34. Magrane M, the UniProt consortium . UniProt Knowledgebase: a hub of integrated protein data. Database (Oxford) 2011;29:bar009. [DOI] [PMC free article] [PubMed] [Google Scholar]
- 35. Doytchinova IA, Flower DR. VaxiJen: a server for prediction of protective antigens, tumour antigens and subunit vaccines. BMC Bioinformatics 2007;8:4. [DOI] [PMC free article] [PubMed] [Google Scholar]
- 36. Larsen MV, Lundegaard C, Lamberth K, Buus S, Lund O et al Large‐scale validation of methods for cytotoxic T‐lymphocyte epitope prediction. BMC Bioinformatics 2007;8:424. [DOI] [PMC free article] [PubMed] [Google Scholar]
- 37. Buus S, Lauemoller SL, Worning P, Kesmir C, Frimurer TS et al Sensitive quantitative predictions of peptide‐MHC binding by a ‘Query by Committee’ artificial neural network approach. Tissue Antigens 2003;62:378–84. [DOI] [PubMed] [Google Scholar]
- 38. Peters B, Sette A. Generating quantitative models describing the sequence specificity of biological processes with the stabilized matrix method. BMC Bioinformatics 2005;6:132. [DOI] [PMC free article] [PubMed] [Google Scholar]
- 39. Tenzer S, Peters B, Bulik S, Schoor O, Lemmel E et al Modeling the MHC class I pathway by combining predictions of proteasomal cleavage, TAP transport and MHC class I binding. Cell Mol Life Sci 2005;62:1025–37. [DOI] [PMC free article] [PubMed] [Google Scholar]
- 40. Bui HH, Sidney J, Li W, Fusseder N, Sette A. Development of an epitope conservancy analysis tool to facilitate the design of epitope‐based diagnostics and vaccines. BMC Bioinformatics 2007;8:361. [DOI] [PMC free article] [PubMed] [Google Scholar]
- 41. Liao L, Noble WS. Combining pairwise sequence similarity and support vector machines for detecting remote protein evolutionary and structural relationships. J Comput Biol 2003;10:857–68. [DOI] [PubMed] [Google Scholar]
- 42. Muh HC, Tong JC, Tammi MT. AllerHunter: a SVM‐pairwise system for assessment of allergenicity and allergic cross‐reactivity in proteins. PLoS ONE 2009;4:e5861. [DOI] [PMC free article] [PubMed] [Google Scholar]
- 43. Thevenet P, Shen Y, Maupetit J, Guyon F, Derreumaux P et al PEP‐FOLD: an updated de novo structure prediction server for both linear and disulfide bonded cyclic peptides. Nucleic Acids Res 2012;40:W288–93. [DOI] [PMC free article] [PubMed] [Google Scholar]
- 44. Trott O, Olson AJ. AutoDockVina: improving the speed and accuracy of docking with a new scoring function, efficient optimization and multithreading. J Comput Chem 2010;31:455–61. [DOI] [PMC free article] [PubMed] [Google Scholar]
- 45. Berman HM, Westbrook J, Feng Z, Gilliland G, Bhat TN et al The protein data bank. Nucleic Acids Res 2000;28:235–42. [DOI] [PMC free article] [PubMed] [Google Scholar]
- 46. Gras S, Kedzierski L, Valkenburg SA. Cross reactive CD8+ T‐cell immunity between the pandemic H1N1–2009 and H1N1–1918 influenza A viruses. Proc Natl Acad Sci USA 2010;107:12599–604. [DOI] [PMC free article] [PubMed] [Google Scholar]
- 47. Accelrys Software Inc . Discovery Studio Modeling Environment, Release 4.0. San Diego: Accelrys Software Inc., 2013. [Google Scholar]
- 48. Fieser TM, John A, Tainer H. Influence of protein flexibility and peptide conformation on reactivity of monoclonal anti‐peptide antibodies with a protein a‐helix. Proc Natl Acad Sci USA 1987;84:8568–72. [DOI] [PMC free article] [PubMed] [Google Scholar]
- 49. Karplus PA, Schulz GE. Prediction of chain flexibility in proteins. Naturwissenschaften 1985;72:212–3. [Google Scholar]
- 50. Kolaskar AS, Tongaonkar PC. A semi‐empirical method for prediction of anti‐genic determinants on protein antigens. FEBS Lett 1990;276:172–4. [DOI] [PubMed] [Google Scholar]
- 51. Emini EA, Hughes JV, Perlow DS, Boger J. Induction of hepatitis A virus‐neutralizing antibody by a virus‐specific synthetic peptide. J Virol 1985;55:836–9. [DOI] [PMC free article] [PubMed] [Google Scholar]
- 52. Parker JM, Guo D, Hodges RS. New hydrophilicity scale derived from high‐performance liquid chromatography peptide retention data: correlation of predicted surface residues with antigenicity and X‐ray‐derived accessible sites. Biochemistry 1985;25:5425–32. [DOI] [PubMed] [Google Scholar]
- 53. Andersen PH, Nielsen M, Lund O. Prediction of residues in discontinuous B‐cell epitopes using protein 3D structures. Protein Sci 2006;15:2558–67. [DOI] [PMC free article] [PubMed] [Google Scholar]
- 54. Rini JM, Schulze‐Gahmen U, Wilson IA. Structural evidence for induced fit as a mechanism for antibody‐antigen recognition. Science 1992;255:959–65. [DOI] [PubMed] [Google Scholar]
- 55. Chou PY, Fasman GD. Prediction of the secondary structure of proteins from their amino acid sequence. Adv Enzymol Relat Areas Mol Biol 1987;47:45–148. [DOI] [PubMed] [Google Scholar]
- 56. Colovos C, Yeates TO. Verification of protein structures: patterns of nonbonded atomic interactions. Protein Sci 1993;2:1511–9. [DOI] [PMC free article] [PubMed] [Google Scholar]
- 57. Gill SC, Von HP. Calculation of protein extinction coefficients from amino acid sequence data. Anal Biochem 1989;182:319–26. [DOI] [PubMed] [Google Scholar]
- 58. Guruprasad K, Reddy BV, Pandit MW. Correlation between stability of a protein and its dipeptide composition, a novel approach for predicting in vivo stability of a protein from its primary sequence. Protein Eng 1990;4:155–61. [DOI] [PubMed] [Google Scholar]
- 59. Ikai A. Thermostability and aliphatic index of globular proteins. J Biochem 1980;88:1895–8. [PubMed] [Google Scholar]
- 60. Šali A, Potterton L, Yuan F, van Vlijmen H, Karplus M. Evaluation of comparative protein modelling by MODELLER. Proteins 1995;23:318–26. [DOI] [PubMed] [Google Scholar]
- 61. Söding J, Biegert A, Lupas AN. The HHpred interactive server for protein homology detection and structure prediction. Nucleic Acids Res 2005;33:W244–8. [DOI] [PMC free article] [PubMed] [Google Scholar]
- 62. Dong X, Zhang Y. Improving the physical realism and structural accuracy of protein models by a two‐step atomic‐level energy minimization. Biophys J 2011;101:2525–34. [DOI] [PMC free article] [PubMed] [Google Scholar]
- 63. Guex N, Peitsch MC. SWISS‐MODEL and the Swiss‐PdbViewer, an environment for comparative protein modeling. Electrophoresis 1997;18:2714–23. [DOI] [PubMed] [Google Scholar]
- 64. Ramachandran GN, Ramakrishnan C, Sasisekharan V. Stereochemistry of polypeptide chain configurations. J Mol Biol 1963;7:95–9. [DOI] [PubMed] [Google Scholar]
- 65. Benkert P, Tosatto SC, Schomburg D. QMEAN, A comprehensive scoring function for model quality assessment. Proteins 1998;71:261–77. [DOI] [PubMed] [Google Scholar]
- 66. Dundas J, Ouyang Z, Tseng J, Binkowski A, Turpaz Y et al CASTp, computed atlas of surface topography of proteins with structural and topographical mapping of functionally annotated residues. Nucleic Acids Res 2006;34:116–8. [DOI] [PMC free article] [PubMed] [Google Scholar]
- 67. Gasteiger E, Hoogland C, Gattiker A, Duvaud S, Wilkins MR, Appel RD, Bairoch A. In: Walker John M, (Ed.); Protein Identification and Analysis Tools on the ExPASy Server. New York: The Proteomics Protocols Handbook, 2005:571–607. [Google Scholar]
- 68. Geourjon C, Deleage G. SOPMA, significant improvements in protein secondary structure prediction by consensus prediction from multiple alignments. Comput Appl Biosci 1995;11:681–4. [DOI] [PubMed] [Google Scholar]
- 69. Sarkar A, Kellogg GE. Hydrophobicity – shake flasks, protein folding and drug discovery. Curr Top Med Chem 2010;10:67–83. [DOI] [PMC free article] [PubMed] [Google Scholar]
Associated Data
This section collects any data citations, data availability statements, or supplementary materials included in this article.
Supplementary Materials
Figure S1 B cell epitope identification of the most antigenic protein, K4G1K7.
Figure S2 GlobPlot result presents the disease‐causing regions of RNA‐dependent RNA polymerase.
Figure S3 Swiss‐pdb generated structure of the EBOVs RNA‐dependent RNA polymerase.
Figure S4 Ramachandran plot analysis of K4G1K7. Here, red region indicates favoured region, yellow region for allowed, and light yellow shows generously allowed region and white for disallowed region. Phi and Psi angels determine torsion angels.
Figure S5 Hydrophobicity plot analysis of K4G1K7.
Table S1 Different physiochemical properties of Ebola RNA‐dependent RNA polymerase.
Table S2 Secondary structure analysis through SOPMA of Ebola RNA‐dependent RNA polymerase.
Table S3 Predicted functions of Ebola RNA‐dependent RNA polymerase.
Table S4 Ramachandran plot of EBOVs RNA‐dependent RNA polymerase.