Abstract
Purpose:
We present a classifier for automatically selecting a lesion border for dermoscopy skin lesion images, to aid in computer-aided diagnosis of melanoma. Variation in photographic technique of dermoscopy images makes segmentation of skin lesions a difficult problem. No single algorithm provides an acceptable lesion border to allow further processing of skin lesions.
Methods:
We present a random forests border classifier model to select a lesion border from twelve segmentation algorithm borders, graded on a “good-enough” border basis. Morphology and color features inside and outside the automatic border are used to build the model.
Results:
For a random forests classifier applied to an 802-lesion test set, the model predicts a satisfactory border in 96.38% of cases, in comparison to the best single border algorithm, which detects a satisfactory border in 85.91% of cases.
Conclusion:
The performance of the classifier-based automatic skin lesion finder is found to be better than any single algorithm used in this research.
Keywords: Image Analysis, Melanoma, Dermoscopy, Border, Lesion Segmentation, Skin Cancer, Classifier
I. INTRODUCTION
An estimated 91,270 new cases of invasive melanoma will be diagnosed in 2018 in the USA. In this year, about 9,320 people are expected to die of melanoma [1]. Using dermoscopy imaging, melanoma is fully visible at the earliest stage, when it is fully curable [2–6]. Over a billion dollars per year is spent on biopsies of lesions that turn out to be benign, and even then, cases of melanoma are missed by domain experts in dermoscopy. [7–9]. Dermoscopy increases the diagnostic accuracy over clinical visual inspection, but only after significant training [2–6]. Hence automatic analysis of lesion dermoscopy has been an area of research in recent years.
Skin lesion segmentation is the first step in any automatic analysis of a dermoscopy image [12–13]. Hence, an accurate lesion segmentation algorithm is a critical step in conventional image processing for automated melanoma diagnosis. Numerous research papers have been published describing a variety of lesion segmentation algorithms [14 – 36]. Each of those algorithms has its own advantages and disadvantages; each performing well on certain sets of images. But with the variety in skin color, skin condition, lesion type and lesion area, a single algorithm is not capable of providing the proper segmentation of a skin lesion every time. Inability of an individual lesion segmentation algorithm to achieve good lesion segmentation for all lesions leads to the idea of incorporating multiple lesion segmentation algorithms into a single system. An “ensemble of borders” using a weighted fusion has been proposed; it was found to be subject to error in the presence of hair or bubbles [36]. However, if the system could provide a “best match” among the candidate segmentation algorithms for a given type of lesion and image, segmentation results could be improved over results obtained from a single segmentation technique or a weighted fusion of borders that can propagate errors. The challenging aspect of the proposed system is to automatically select the best among the segmentations obtained from multiple algorithms. Hence, the idea of implementing a lesion border classifier to solve the border selection problem is proposed. In this study, we present an automatic dermoscopy skin lesion border classifier, to select the best lesion border among available choices for a skin lesion. Fig. 1 shows a block diagram of the proposed automatic border classifier. This border classifier uses morphological and color features from segmented border regions to select the best of multiple border choices. The rest of the paper is organized as follows. Section II explains the segmentation algorithms. Section III presents features used in the classifier. Section IV describes classifier experiments. Section V gives results and discussion. Section VI contains the conclusion and plans future work.
Fig. 1.
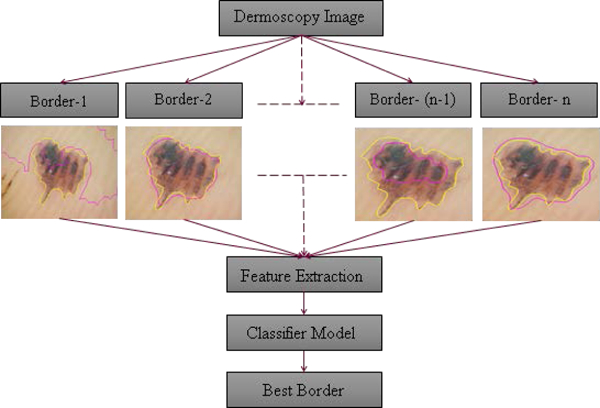
Diagram of border classifier, n = 13. Automatic border (dark red); manual border (light yellow).
II. LESION SEGMENTATION ALGORITHMS
Thirteen different segmentation algorithms are used to build a classifier model. These algorithms are implemented based on their performance on widely varying skin lesion images in a large and diverse image set. These border segmentation methods are described elsewhere [10, 32, 35–43].
A. Geodesic Active Contour (GAC) Segmentation (7 borders)
Seven of the border segmentation algorithms are based on the geodesic active contour (GAC) technique of Kasmi et al. [34], implemented using the level set algorithm [35, 37]. The initial contour is found by Otsu segmentation of a smoothed image. [17]. The tendency of the Otsu method to find internal gradients is avoided by a series of filtering and convolution operations. Seven different pre-processing methods performed on the initial image using GAC and the level set algorithm to yield borders GAC-1 through GAC-7.
B. Histogram Thresholding in Two Color Planes (2 borders)
Histogram thresholding applied separately on a smoothed blue color plane and on a pink-chromaticity image provide two different lesion borders, named Histo-1 and Histo-2 [14, 38].
C. Histogram Thresholding via Entropy and Fuzzy Logic Techniques (4 borders)
The final four borders are histogram thresholding methods modified from original methods [39–43], with details available in Kaur, et al. [43]. The image thresholding method of Huang and Wang [39] minimizes fuzziness measures in a dermoscopy skin lesion image. The segmentation method of Li and Tam [41] is based on minimum cross entropy thresholding, where threshold selection minimizes the cross entropy between the dermoscopy image and its segmented version [41]. Next, the segmentation algorithm of Shanbhag employs a modified entropy method for image thresholding [40,42]. The last segmentation algorithm is based on the principal components transform (PCT) and the median split algorithm modeled on the Heckbert compression algorithm [44,45]. An RGB image is first transformed using the PCT and then a median split is performed on the transformed image to obtain the lesion border mask. These four borders are named Huang, Li, Shanbhag-2, and PCT. In addition, one manually drawn border for each image is also used for training the classifier.
III. FEATURE DESCRIPTION
The proposed lesion border classifier uses morphological features calculated from the candidate lesion borders and color features calculated from the dermoscopy image to identify the best border among the choices available. There are nine morphological and forty-eight color-related features used in the classification process.
A. Morphological Features
-
1)
Centroid x and y locations
Centroid location is the location of the centroid of the area enclosed by the lesion border in terms of its x and y coordinates of the pixel location, origin at upper left corner of the image. Centroid location, in terms of x and y coordinates of a collection of n pixels {,} are given by:
| (1) |
| (2) |
where xi is the x coordinate of the ith pixel and yi is the y coordinate of the ith pixel.
-
2)
Centroid distance (Dc):
Centroid distance is the distance between the centroid of the image and the centroid of the lesion border. It is calculated as follows
| (3) |
where is lesion border centroid andis image centroid (center).
-
3)
Lesion perimeter (LP)
Lesion perimeter is calculated by counting the outermost pixels of the lesion.
-
4)
Lesion area (LA)
Lesion area is calculated by counting the number of pixels inside the lesion border.
-
5)
Scaled centroid distance (SDc):
Scaled centroid distance is the ratio of centroid distance (Dc) to the square root of lesion area:
| (4) |
-
6)
Compactness (C)
Compactness is defined as the ratio of the lesion perimeter to the square root of 4π times the lesion area. A circle has unity compactness. It is calculated as shown in (5).
| (5) |
-
7)
Size(mm) Recorded size in mm is obtained from medical record.
-
8)
(6)
B. Color Features
Color features are calculated separately from different target areas in the image, defined with an intention to identify color difference between the inside and outside of the lesion (Fig. 2). Rim target areas are calculated by the distance transform of the binary lesion border image. Empirically optimized parameters for rim and corner sizes are given in terms of the parameter d. The value d=50 is optimized for 1024 × 768 images; d should be proportional to image size.
Fig. 2.
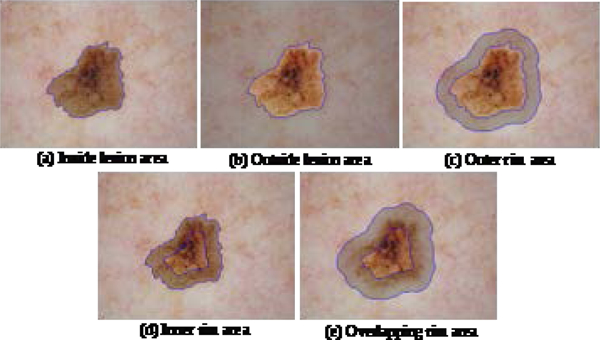
Target areas for extraction of color features are highlighted with a gray overlay
-
1)
Inside lesion area:
This region inside the lesion border = lesion area (LA), Fig. 2(a).
-
2)
Outside lesion area:
This region is the area of the image outside the lesion border, Fig. 2(b). If the lesion area covers the entire image, then the outside lesion area is zero and all the color features in this region = 0.
-
3)
Rim area outside lesion border:
This region is just outside the lesion border. The distance transform matrix is used to select pixels in this region. Pixels not in LA and within from the border are included, Fig. 2(c).
-
4)
Rim area inside lesion border:
This region is just inside the lesion border. The distance transform matrix is used to select pixels in the region. Pixels in LA and within from the border are included, Fig. 2(c).
-
5)
Overlapping rim area at lesion border:
This region is just inside and just outside the lesion boundary, Fig 2(e). A modified distance transform , 0.75 times the measure in the preceding rims to define this region.
C. Removal of Dark Corners
In calculating the color features, dark corners are excluded. A dark corner is defined as a region, within a distance of 5d pixels from an image corner, where intensity value of a grayscale image is less than 1.5d. This threshold is determined by histogram analysis of samples with dark corners in the training and the test set. All holes in that region are filled. A sample image with three dark corners is shown in Fig. 3(a) and the dark corner mask is shown in Fig. 3(b).
Fig. 3.
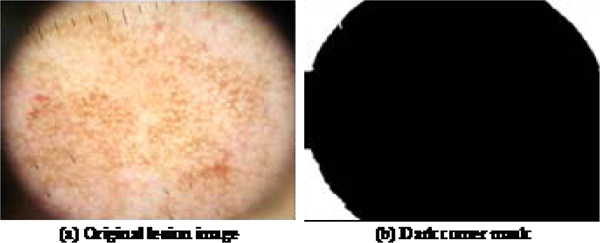
Sample dark corner image and its dark corner mask (shown in white).
The dark corner mask is ANDED with the original border mask in order to calculate the color features excluding the dark corners, since these areas result from dermatoscope optics when the lens is zoomed out. This operation is shown in (7) and (8), Fig. 4(a) and Fig. 4(b).
| (7) |
| (8) |
where, is dark corner mask, is region mask (one of 2(a)–2(e)), represents the common area between the dark corner and the selected region, is the effective region mask, represents logical AND operation, and ⊕ represents logical exclusive-OR (XOR) operation.
Fig. 4.

Exclusion of dark corner region by the logical operations of (6) and (7)
D. Color Plane Calculations
The operations in (7) and (8) are performed for all five regions, Fig. 2. The color features are calculated for these five effective regions. The color features used in the research are as follows.
-
1)
Mean intensity of red, green and blue color planes for each effective region: Red, green and blue intensity planes from the dermoscopy image are ANDED with individual effective region masks to calculate the mean intensity of red, green and blue planes, (equations 9–11).
| (9) |
| (10) |
| (11) |
where and represent the intensity of red, green and blue color planes, respectively, and N represents the total number of pixels in the effective region.
-
2)
Intensity standard deviation of red, green and blue planes for each effective region using the mean intensity of each color plane for each effective region, using (12), (13) and (14).
| (12) |
| (13) |
| (14) |
where and represent the intensity of red, green and blue color planes, respectively. and represent the mean intensity of red, green and blue planes, respectively, for the effective region. N represents the total number of pixels in the effective region.
-
3)
The luminance image is calculated by equation (15). mean intensity and standard deviation of the luminance image are calculated by equations (16) and (17), respectively.
| (15) |
| (16) |
| (17) |
-
4)
Difference of the mean intensity of outer and inner border rims: absolute difference between the mean intensity of the two rims for each RGB color plane and the grayscale image.
-
5)
Difference of the standard deviations of outer inner border rims: absolute difference between standard deviations of the two rims for each RGB color plane and the grayscale image.
IV. EXPERIMENTS PERFORMED
A. Image Database
A total of 833 dermoscopy images were used for training and 802 dermoscopy images were used as a disjoint test set in this research. These images were obtained in four clinics from 2007 – 2009 as part of NIH SBIR dermoscopy studies R43 CA153927–01 and CA101639–02A2. These images were acquired using Nikon DSC-W70 digital cameras and DermLite Fluid dermatoscopes (3Gen LLC, San Juan Capistrano, CA 92675) with all images reduced to resolution 1024 × 768 pixels.
B. Segmentation Algorithm Processing
Each image was processed by different segmentation algorithms (Section 2). In some cases, some of the segmentation algorithms did not return a lesion border based on size and location filter implemented in the algorithm itself. A total of 12,452 borders were obtained and assessed, based on the 833 manual lesion borders, validated by a dermatologist (WVS).
C. Subjective Border Grading System
Sforza et al. [46] and Kaur et al. [43] introduced new metrics to recognize relative border accuracy and border inclusiveness. Kaur defined three border grades: 0, 1, and 2. Each of the 12,452 training and 10,994 test borders was manually rated by both a dermatologist and a student to achieve a consensus scoring. Three grades were used:
Exact – (score = 2) at most, having minute differences from the manual border
Approximate – (score = 1) borders diagnosable, capturing all essential diagnostic features
Failing – (score = 0) missing essential diagnostic features (too small) or capturing much non-lesion (too large)
Examples are shown in Fig. 5.
Fig. 5.
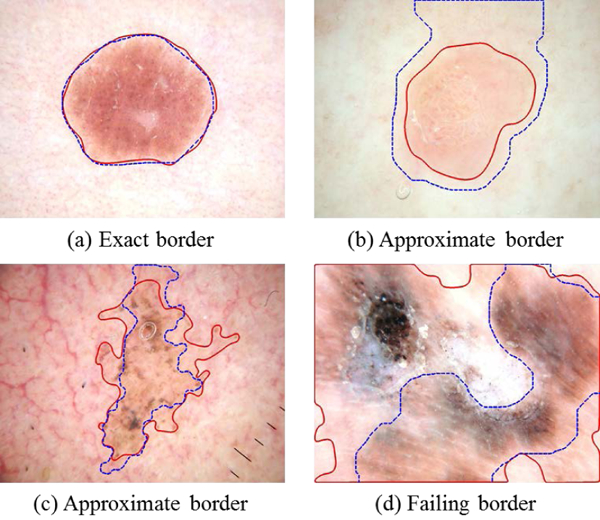
Examples of subjective border grading, showing manual border (solid line) and automatic border (dashed line). Approximate borders (b) and (c) are “good enough.” In (b) the border difference is due to low contrast. In (c) the automatic border is subjectively as valid as the manual border.
In order to create a classifier model, the borders rated as 2 were considered as good borders and borders rated as 0 were considered as bad borders. Three cases were developed that incorporated all borders rated as 0, 1 and 2.
For six of the 1635 (0.37%) borders, all methods failed to find an exact or approximate border. The remainder (99.63%) had a good enough border, as shown in Figs. 5(a-c).
D. Classifiers Developed for Three Training Cases
Case 1: For both training and test set, only borders rated as 0 and 2 were used to build a classifier model and to test it. Hence, a total of 7,649 borders were selected from the 12,452 borders obtained from the training set. In the selected 7,649 borders, there were 4,032 good borders (rated as 2) and 3,617 bad borders (rated as 0). The remaining 1-rated borders acceptable for melanoma detection were not used in the classifier model. The model used for testing was similar.
Case 2: Training was the same as for case 1, with only borders rated as 0 and 2 from the training set used to build a classifier model; 1-rated borders were not used in training. However, for testing the model, the test borders rated as 1 were considered successful borders.
Case 3: Unlike cases 1 and 2, borders rated as both 1 and 2 were included as successful borders in both the training set and the test set. To summarize these 3 cases: Case 1: Train and test to recognize good (1) vs. bad (0) borders, no approximate borders; Case 2: Train to recognize good vs. bad borders, and test differently, including approximate borders as successful borders in the test set. Case 3: Train to recognize good and approximate borders as successful and test the same. For both training and testing, 57 different features were calculated for each border (Section III).
E. Classifier Implementation
A random forests classifier was used to select lesion borders. The random forests classifier, an ensemble tree classifier that constructs a forest of classification trees from sample data subsets, is chosen because it is one of the most accurate learning models, and provides a model that is robust, efficient and inspectable (specified weights) [47]. To construct a forest, each tree must be built by randomly selecting training set data. A different subset of training data is used for each tree to develop a decision tree model and the remaining training data is used to test the accuracy of the model [47]. Then a split condition is determined for each node in the tree, where a subset of predictor variables is randomly selected. This reduces error because trees have less correlation. The implementation used the cran.R statistical package [48]; default values were B=500 trees; the entire data set is used for sampling, and samples were used with replacement [48].
V. RESULTS AND DISCUSSION
A. Classifier Model
The regression procedure generated a model based on training set border features. This model was then implemented for all test set images; the best border was selected by choosing the maximum predicted probability among all methods. The receiver operating characteristic (ROC) curve (shown in Fig. 6) is constructed for the subjective border metric model for the 3 test cases; the area under the ROC curve (AUC) is 0.9847, 0.9152, 0.9354 for case 1, 2 and 3 respectively. Case 3 (adding score-1 (approximate borders for training) improves results by 2.02% over Case 2. Case 1 results are artificially high, as Case 1 excludes the difficult-to-classify score-2 borders.
Fig. 6.
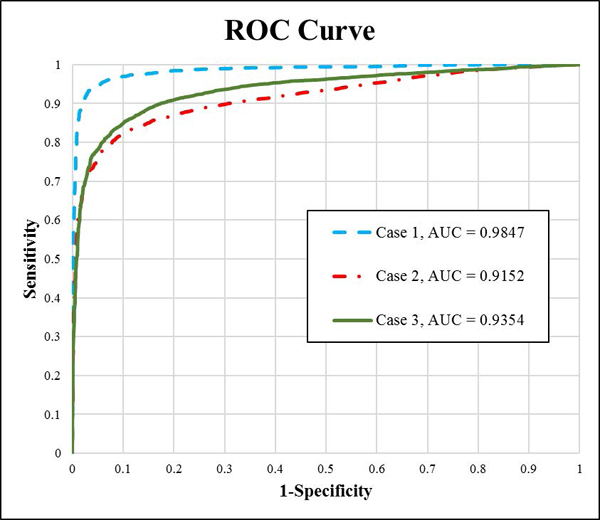
ROC curve for subjective border model for three cases using the random forests border classifier.
B. Border Selection Process
For each image, I, we calculate the feature vector, , for all 3 different border choices available. Then calculate the random forests probability values, using a subset of feature, , for each lesion border option. The border option yielding maximum is chosen. Formally,
| (18) |
| (19) |
C. Overall Results and Analysis
This section presents the overall accuracy achieved by the classifier model using the border selection process on the test set (802 lesions). After the best border is selected, a manual rating of 1 or 2 for the selected border determines classifier success for all three classifier cases, section IV. In case 1, 586 best choice lesion borders had manual grading of 2 (signifying accurate border) and the remaining 215 best choice lesion borders had a manual grading of 0 (bad border). The total accuracy of the classifier model on the test set was found to be 73.16%. However, in case 2, 712 best choice lesion borders had manual grading of either 2 (good) or 1 (acceptable) border and the remaining 89 best choice lesion borders had manual grading of 0 (bad border). As a result, the total accuracy of the classifier model on the test set was found to be 88.78%. In case 3, 720 best choice lesion borders had manual grading of either 1 or 2 and the remaining 81 best choice lesion borders had manual grading of 0. Thus, the total accuracy of the classifier model on the test set was found to be 89.78%. Hence, case 3 produced better accuracy for all borders compared with cases 1 and 2. The graph in Fig. 7 shows that in Case 3 the Li method is selected more than any other method. The GAC-1 method provides the lowest error (Fig. 8) of any single method; however, accuracy of the Case 1 classifier border is lower still.
Fig. 7.
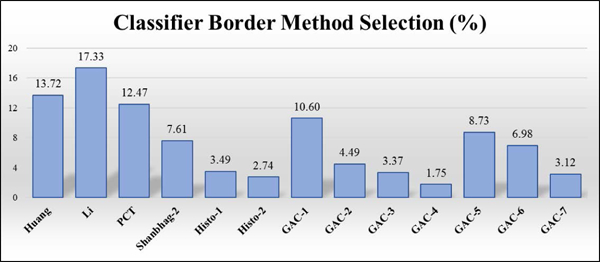
Classifier border method selection frequency. Lowest: GAC-4, 1.75%, Highest: Li, 17.33%.
Fig. 8.
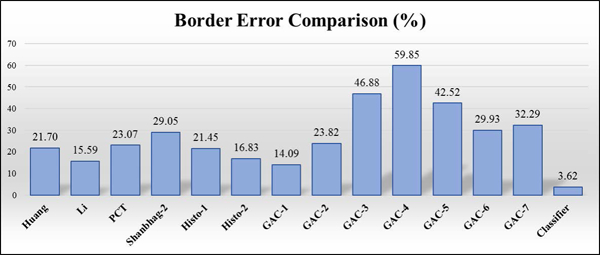
Border error comparison. Classifier error was 3.62% vs 14.09% for the best method.
This analysis shows that the automatic border finding system with a random forests classifier can reduce the error rate from 14.09% to 3.62%, a 74.3 % reduction in error rate.
VI. Discussion
The purpose of this study is to develop a better border detection method that is fully automatic. This method constructs a novel classifier using multiple color features in five regions for each candidate border to assess border quality. Geometric features include six measures that define candidate border quality to assess border size, centrality and compactness. A border is more likely to be accurate if it is central, large, and compact. This quality measure for the classifier can find uncommon instances when an infrequently chosen border such as GAC-4 and GAC-7 is the best border. Intuitively, a voting scheme might be able to yield the best border choice, operating on the assumption that the border choices are clustered about an optimal border. However, choosing the best border when lesions vary widely in size, shape, and contrast comprises a matching problem, with a solution presented here. Another novel technique is the subjective border grading system, based on the premise that borders need be just “good enough” to allow a correct diagnosis. Pixel-wise border grading does not capture “good-enough” borders. When the “good enough” borders are used in training in Case 3, results are improved.
VII. CONCLUSION AND FUTURE WORK
In this study, we develop a classifier for automatic dermoscopy image lesion border selection. The classifier model selects a good-enough lesion border from multiple lesion segmentation algorithms. Case 3, which best represents the clinical challenge, shows reduction in error from 14.09% for the best single border case to 3.62% for the automatic border.
The focus of this study was on the calculation of features representing good-enough borders. The lesion segmentation and feature generation for classification were both fully automatic. The lesion borders were dermatologist-rated for supervised learning and model creation. Future work includes application of other classifiers, inclusion of additional features, review of borders with the second and the third highest f(z) borders for inclusion or combining with existing borders, and additional post-processing techniques to eliminate grade 0 borders.
ACKNOWLEDGMENTS
This publication was made possible by SBIR Grants R43 CA153927–01 and CA101639–02A2 of the National Institutes of Health (NIH). Its contents are solely the responsibility of the authors and do not necessarily represent the official views of the NIH
Contributor Information
Nabin K. Mishra, Stoecker and Associates, Rolla, MO 65401, USA
Ravneet Kaur, Department of Electrical and Computer Engineering, Southern Illinois University Edwardsville, Edwardsville, IL 62025 USA.
Reda Kasmi, Department of Electrical Engineering, University of Bejaia, Bejaia, Algeria and University of Bouira, Bouira, Algeria
Jason R. Hagerty, Stoecker and Associates, Rolla, MO 65401, USA
Robert LeAnder, Department of Electrical and computer Engineering, Southern Illinois University Edwardsville, Edwardsville, IL 62025 USA
R. Joe Stanley, Department of Electrical and Computer Engineering, Missouri University of Science and Technology, Rolla, MO 65209, USA
Randy H. Moss, Department of Electrical and Computer Engineering, Missouri University of Science and Technology, Rolla, MO 65209, USA
William V. Stoecker, Stoecker and Associates, Rolla, MO 65401, USA
REFERENCES
- [1].Siegel RL, Miller KD, Jemal A. Cancer statistics, 2018. CA: Cancer J. Clin 2018; 64(1): 7–30. [DOI] [PubMed] [Google Scholar]
- [2].Pehamberger H, Binder M, Steiner A, Wolff K. In vivo epiluminescence microscopy: improvement of early diagnosis of melanoma. J. Invest. Dermatol. 1993; 100: 356S–362S. [DOI] [PubMed] [Google Scholar]
- [3].Soyer HP, Argenziano G, Chimenti S, Ruocco V. Dermoscopy of pigmented skin lesions. Eur. J. Dermatol. 2001; 11(3): 270–277. [PubMed] [Google Scholar]
- [4].Soyer HP, Argenziano G, Talamini R, Chimenti S. Is dermoscopy useful for the diagnosis of melanoma?. Arch. of Dermatol. 2001; 137(10): 1361–1363. [DOI] [PubMed] [Google Scholar]
- [5].Stolz W, Braun-Falco O, Bilek P, Landthaler M, Burgdorf WHC, Cognetta AB. Eds. Color Atlas of Dermatoscopy, Hoboken, NJ: Wiley-Blackwell, 2002. [Google Scholar]
- [6].Braun RP, Rabinovitz HS, Oliviero M, Kopf AW, Saurat JH. Pattern analysis: a two-step procedure for the dermoscopic diagnosis of melanoma. Clinics Dermatol. 2002; 20(3): 236–239. [DOI] [PubMed] [Google Scholar]
- [7].“The Cost of Cancer.” National Cancer Institute at the National Institutes of Health, 2011. [Online]. Available http://www.cancer.gov/aboutnci/servingpeople/understanding-burden/cost_of_cancer.
- [8].Esteva A, Kuprel B, Novoa RA, Ko J, Swetter SM, Blau HM, Thrun S. Dermatologist-level classification of skin cancer with deep neural networks. Nature 2017; 542(7639): 115–118. [DOI] [PMC free article] [PubMed] [Google Scholar]
- [9].Ferris LK, Harkes JA, Gilbert B, Winger DG, Golubets K, Akilov O, Satyanarayanan M. Computer-aided classification of melanocytic lesions using dermoscopic images. J. Am. Acad. Dermatol. 2015; 73(5): 769–76, 2015. [DOI] [PubMed] [Google Scholar]
- [10].Boldrick JC, Layton CJ, Nguyen J, Swetter SM. Evaluation of digital dermoscopy in a pigmented lesion clinic: clinician versus computer assessment of malignancy risk . J. Amer. Acad. Dermatol. 2007: 56(3): 417–421. [DOI] [PubMed] [Google Scholar]
- [11].Perrinaud A, Gaide O, French LE, Saurat JH, Marghoob AA, Braun RP. Can automated dermoscopy image analysis instruments provide added benefit for the dermatologist? A study comparing the results of three systems. Bri. J. Dermatol. 2007; 157(5): 926–933. [DOI] [PubMed] [Google Scholar]
- [12].Mishra NK, Celebi ME. An overview of melanoma detection in dermoscopy images using image processing and machine learning. arXiv preprint arXiv :1601.07843, 2016. [Google Scholar]
- [13].Gutman D, Codella NC, Celebi E, Helba B, Marchetti M, Mishra N, Halpern A. Skin lesion analysis toward melanoma detection: A challenge at the international symposium on biomedical imaging (ISBI) 2016, hosted by the international skin imaging collaboration (ISIC).” arXiv preprint arXiv:1605.01397, 2016. [Google Scholar]
- [14].Sahoo PK, Soltani S, Wong AKC. A survey of thresholding techniques. Comput. Vis., Graph., Image Proc. 1988; 41(2): 233–260. [Google Scholar]
- [15].Pal NR, Pal SK. A review on image segmentation techniques. Patt. Recog. 1993; 26(9): 1277–1294. [Google Scholar]
- [16].Silveira M, Nascimento JC, Marques JS, Marçal ARS, Mendonça T, Yamauchi S, Maeda J, Rozeira J. Comparison of segmentation methods for melanoma diagnosis in dermoscopy images. IEEE J. Selected Topics Signal Proc. 2009; 3(1): 35–45. [Google Scholar]
- [17].Celebi ME, Hwang S, Iyatomi H, Schaefer G. Robust border detection in dermoscopy images using threshold fusion. 17th IEEE International Conference on Image Processing (ICIP), Beijing, China, 2010: 2541–2544. [Google Scholar]
- [18].Taouil K, Romdhane NB. Automatic segmentation and classification of skin lesion images. The 2nd International Conference on Distributed Frameworks for Multimedia Applications, Palau Pinang, Malaysia, 2006: 1–12. [Google Scholar]
- [19].Erkol B, Moss RH, Stanley RJ, Stoecker WV, Hvatum E. Automatic lesion boundary detection in dermoscopy images using gradient vector flow snakes. Skin Res. Technol. 2005; 11(1): 17–26. [DOI] [PMC free article] [PubMed] [Google Scholar]
- [20].Zhou H, Schaefer G, Celebi ME, Lin F, Liu T. Gradient vector flow with mean shift for skin lesion segmentation. Computerized Medical Imaging and Graphics 2011; 35(2): 121–127. [DOI] [PubMed] [Google Scholar]
- [21].Chiem A, Al-Jumaily A, Khushaba RN. A novel hybrid system for skin lesion detection. 3rd International Conference on Intelligent Sensors, Sensor Networks and Information, Melbourne, Australia, 2007: 567–572. [Google Scholar]
- [22].Zhou H, Schaefer G, Sadka AH, Celebi ME. Anisotropic mean shift based fuzzy c-means segmentation of dermoscopy images. IEEE J. Sel. Topics Signal Proc. 2009; 3(1): 26–34. [Google Scholar]
- [23].Yuan X, Situ N, Zouridakis G. Automatic segmentation of skin lesion images using evolution strategies. Biomed. Signal Process. Control 2008; 3(3): 220–228. [Google Scholar]
- [24].Barcelos C, Zorzo CA, Pires VB. An automatic based nonlinear diffusion equations scheme for skin lesion segmentation. Appl. Math. Comput. 2009; 215(1): 251–261. [Google Scholar]
- [25].Yuan X, Situ N, Zouridakis G. A narrow band graph partitioning method for skin lesion segmentation. Patt. Recog. 2009; 42(6): 1017–1028. [Google Scholar]
- [26].Mete M, Kockara S, Aydin K. Fast density-based lesion detection in dermoscopy images. Comput. Med. Imag/ Graph. 2011; 35(2): 128–136. [DOI] [PubMed] [Google Scholar]
- [27].Zhou H, Li X, Schaefer G, Celebi ME, Miller P. Mean shift based gradient vector flow for image segmentation. Comput. Vis. Image Understanding 2013; 117(9): 1004–1016. [Google Scholar]
- [28].Abbas A, Fondón I, Rashid M. Unsupervised skin lesions border detection via two-dimensional image analysis. Comput. Meth. Prog. Biomed. 2011; 104(3): e1–e15. [DOI] [PubMed] [Google Scholar]
- [29].Wang H, Moss RH, Chen X, Stanley RJ, Stoecker WV, Celebi ME, Malters JM, Grichnik JM, Marghoob AA, Rabinovitz HS, Menzies SW, Szalapski TM. Modified watershed technique and post-processing for segmentation of skin lesions in dermoscopy images. Comput. Med. Imag. Graph 2011; 35(2): 116–120. [DOI] [PMC free article] [PubMed] [Google Scholar]
- [30].Celebi ME, Iyatomi H, Schaefer G, Stoecker WV. Lesion border detection in dermoscopy images. Comput. Med. Imag. Graph. 2009; 33(2): 148–153. [DOI] [PMC free article] [PubMed] [Google Scholar]
- [31].Zhou H, Schaefer G, Celebi ME, Lin F, Liu T. Gradient vector flow with mean shift for skin lesion segmentation. Comput.Med. Imag. Graph. 2011; 35(2): 121–127. [DOI] [PubMed] [Google Scholar]
- [32].Garnavi R, Aldeen M, Celebi ME, Varigos G, Finch S. Border detection in dermoscopy images using hybrid thresholding on optimized color channels. Comput.Med. Imag. Graph. 2011; 35(2): 105–115. [DOI] [PubMed] [Google Scholar]
- [33].Tang T A multi-direction GVF snake for the segmentation of skin cancer images. Patt. Recog. 2009; 42(6): 1172–1179. [Google Scholar]
- [34].Kasmi R R, Mokrani K K, Rader RK, Cole JG, Stoecker WV. Biologically inspired skin lesion segmentation using a geodesic active contour technique. Skin Res. Technol. 2016; 22(2): 208–222. [DOI] [PubMed] [Google Scholar]
- [35].Caselles V, Vicent R, Kimmel R, Sapiro G. Geodesic active contours. Int. J. Comput. Vis. 1997; 22(1): 61–79. [Google Scholar]
- [36].Celebi ME, Wen Q, Hwang S, Iyatomi H, Schaefer G. Lesion border detection in dermoscopy images using ensembles of thresholding methods. Skin Res Technol. 2013; 12(1): e252–e258. [DOI] [PubMed] [Google Scholar]
- [37].Osher S, Sethian JA. Fronts propagating with curvature-dependent speed: algorithms based on Hamilton-Jacobi formulations. J. Comput. Phys. 1988; 79(1): 12–49. [Google Scholar]
- [38].Szalapski TM, Mishra NK. Blue plane threshold and pink chromaticity based lesion segmentation. 3rd Quadrennial Automatic Skin Cancer Detection Symposium, Rolla, MO, 2013. [Google Scholar]
- [39].Huang L, Wang M. Image thresholding by minimizing the measures of fuzziness. Patt. Recog. Lett. 1995; 28(1): 41–51. [Google Scholar]
- [40].[Online].Available: http://fiji.sc/Auto_Threshold
- [41].Li CH, Tam PK. An iterative algorithm for minimum cross entropy thresholding. Patt. Recogn. Lett. 1998; 19(8): 771–776. [Google Scholar]
- [42].Shanbhag AG. Utilization of information measure as a means of image thresholding. CVGIP: Graph. Models Imag. Process. 1994; 56(5): 414–419. [Google Scholar]
- [43].Kaur R, LeAnder R, Mishra NK, Hagerty JR, Kasmi R, Stanley RJ, Celebi ME, Stoecker WV. Thresholding methods for lesion segmentation of basal cell carcinoma in dermoscopy images. Skin. Res. Technol. 2017; 23(3): 416–428. [DOI] [PubMed] [Google Scholar]
- [44].Heckbert P Color image quantization for frame buffer display. Proceedings of SIGGRAPH ‘82, Boston, MA, 1982: 297. [Google Scholar]
- [45].Umbaugh SE. Ch.:Segmentation and edge/line detection in Digital Image Processing and Analysis: Human and Computer Vision Applications with CVIPtools. Boca Raton, FL: CRC Press, 2010. [Google Scholar]
- [46].Sforza G, Castellano G, Arika SA, LeAnder RW, Stanley RJ, Stoecker WV, Hagerty JR. Using adaptive thresholding and skewness correction to detect gray areas in melanoma in situ images. IEEE Trans. Instrument. Meas. 2012; 61(7): 1839–1841. [Google Scholar]
- [47].Hastie T, Tibshirani R, Friedman J. Random forests. The elements of Statistical Learning: Data Mining, Inference and Prediction, 2nd ed., New York, NY, Springer: 587–604. [Google Scholar]
- [48].[Online].Available:https://cran.r-project.org/web/packages/randomForest/randomForest.pdf
- [49].Iyatomi H, Oka H, Saito M, Miyake A, Kimoto M, Yamagami J, Kobayashi S, Tanikawa A, Hagiwara M, Ogawa K, Argenziano G, Soyer HP, Tanaka M. Quantitative assessment of tumor extraction from dermoscopy images and evaluation of computer-based extraction methods for automatic melanoma diagnostic system, Melanoma Res. 2006; 16(2): 183–190. [DOI] [PubMed] [Google Scholar]
- [50].Garnavi R, Aldeen M, Celebi ME. Weighted performance index for objective evaluation of border detection methods in dermoscopy images. Skin Res Technol 2011; 17(1): 35–44. [DOI] [PubMed] [Google Scholar]


