

We report a microfluidic platform that maps target protein and mRNA expression with inter- and intraembryonic resolution.
Abstract
The process by which a zygote develops from a single cell into a multicellular organism is poorly understood. Advances are hindered by detection specificity and sensitivity limitations of single-cell protein tools and by challenges in integrating multimodal data. We introduce an open microfluidic tool expressly designed for same-cell phenotypic, protein, and mRNA profiling. We examine difficult-to-study—yet critically important—murine preimplantation embryo stages. In blastomeres dissociated from less well-studied two-cell embryos, we observe no significant GADD45a protein expression heterogeneity, apparent at the four-cell stage. In oocytes, we detect differences in full-length versus truncated DICER-1 mRNA and protein, which are insignificant by the two-cell stage. Single-embryo analyses reveal intraembryonic heterogeneity, differences between embryos of the same fertilization event and between donors, and reductions in the burden of animal sacrifice. Open microfluidic design integrates with existing workflows and opens new avenues for assessing the cellular-to-molecular heterogeneity inherent to preimplantation embryo development.
INTRODUCTION
The events that initiate cell fate commitment in preimplantation blastomeres remain open questions in developmental biology. While functional studies and embryonic plasticity suggest that blastomeres remain equivalent until the compacted morula (1, 2), growing evidence of interblastomeric differences in early-stage embryos points to heterogeneity even at the earliest multicellular stages (3–10). Although transcriptional profiling of single embryos and single blastomeres has greatly advanced our knowledge of key developmental steps (4), there is a disconnect between transcription and translation; this disconnect is especially apparent in the preimplantation embryo (11). Holistic understanding of transcript-based predictions demands companion phenotypic and protein-profiling analyses of the same embryo.
Same-cell mRNA and protein profiling capacities are emerging, yet the study of mammalian preimplantation embryos presents novel and long-standing challenges. At the protein level, immunofluorescence (IF) does report protein abundance and localization in embryos. Nevertheless, IF is stymied in three critical aspects. First, IF is unsuitable for detecting small variations in protein expression and multiplexing beyond ~5 targets (12) owing to cross-reactivity, a ubiquitous problem with immunoreagents. Second, even when immunoreagents with a measure of selectivity do exist, proteoforms remain “blind spots” because isoform-specific immunoreagents have limited availability (13). Third, chemical fixation artifacts confound measurement of endogenous intracellular protein targets (i.e., epitope masking, cell morphology modifications, and perturbation of protein localization by diffusional gradients in fixation) (14, 15). Given dependence on immunoreagents, flow cytometry and mass cytometry also suffer from specificity and fixation issues (16). While recent advances in bottom-up mass spectrometry afford single-cell sensitivity (17, 18), proteoforms remain a blind spot here as well. Bottom-up mass spectrometry requires protein digestion, which obscures proteoform stoichiometry. Top-down mass spectrometry of intact proteins has insufficient sensitivity, multiplexing, and protein identification to fill the gap (19). Further, benchtop approaches that complement wide-coverage discovery tools are lacking (17, 18). Although recently developed single-cell electrophoretic tools offer higher specificity by separating proteins by mass or charge before immunoreagent-based detection, they have primarily been designed to handle suspensions of cultured cell lines (20–24). For developmental biology questions, fundamental inconsistencies exist between cell lines and mammalian embryos. Critical differences include cell composition and size (i.e., oocyte volume is ~100× HeLa cell volume), membrane structure, embryo handling, and low cell availability (~10 to 20 embryos per mouse, depending on strain) (25–28).
Same-cell mRNA and protein analysis of single cells (3, 29) shows that mRNA measurements very often do not correlate with protein measurements (30). In the preimplantation embryo, transcription and translation can be asynchronous for up to 15 hours (11). To date, same-cell mRNA and protein analysis tools combine either fluorescence in situ hybridization (31, 32), proximity ligation (33), or standard single-cell mRNA sequencing approaches (34) to quantify mRNA, with IF (32), flow or mass cytometry (31), or proximity extension (30) to measure protein. Use of oligo-labeled immunoreagents allows both mRNA and protein to be amplified and measured via quantitative polymerase chain reaction (qPCR) or single-cell RNA sequencing workflows (34). Nevertheless, these protein analyses rely on immunoreagents and, thus, do not overcome the specificity issues outlined. In a different approach, capillary electrophoresis has measured both mRNA and protein from cell lysate (35), but neither the cellular specificity (i.e., single-cell resolution) nor the molecular specificity (i.e., distinguish specific mRNA sequences or protein isoforms) has been addressed.
Our approach to provide developmental biologists with multimodal profiles of preimplantation embryos is an open microfluidic tool that reports cell phenotype (whole-cell imaging), protein and protein isoform expression (single-cell immunoblotting), and mRNA expression [reverse transcription qPCR (RT-qPCR)] for the same single cells. Open microfluidic design is key, as the unenclosed devices integrate seamlessly with workhorse developmental biology approaches, including embryo preparation tools (pipettes) and whole-cell bright-field and fluorescence microscopy, as well as integrate with unique approaches introduced here, including release and retrieval of microscale gel pallets that shuttle nuclei off-chip for mRNA analysis after immunoblotting of that same cell. Precision microfluidic design maps the molecular composition of each component blastomere back to the originating murine embryo, providing datasets that are suitable for quantitative examination of cellular and molecular relationships. To generate robust, quantitative relationships, we establish and validate technical variation thresholds and expression normalization approaches. We then examine relationships by subjecting blastomeres from two-cell and four-cell embryos to protein analysis of GADD45a, a protein involved in DNA damage repair reported to show bimodal transcription levels at the two-cell and four-cell stages. Within oocytes, but not two-cell embryos, we find significant expression differences between truncated and full-length isoforms of DICER-1 (Dicer 1, ribonuclease type III) by both mRNA and direct alternate protein isoform detection. In the more mature blastocysts, we scrutinize dissociated blastomeres and—by integrating fluorescence imaging of intact blastomeres for internalized fluorescent beads—we corroborate mutually exclusive expression of CDX-2 versus SOX-2 in cells acquiring trophectoderm (TE) versus inner cell mass (ICM) state, respectively. Together, we see the study of preimplantation development as uniquely well positioned to benefit from multimodal molecular analysis tools offering single-blastomere resolution.
RESULTS
Early- and late-stage embryos exhibit differences in mRNA-to-protein correlation
We sought to examine the transition from maternally deposited transcripts and proteins to postzygotically activated blastocysts (36, 37). In early-stage preimplantation embryos, transcripts are maternally inherited. In late-stage preimplantation embryos (i.e., blastocysts), the zygotic genome is fully activated and maternal transcripts are largely cleared by active and passive mechanisms (36, 37). With maturation, we anticipate a strengthening correlation between mRNA and protein levels. Consequently, we assessed two-cell embryos, four-cell embryos and blastocysts by same-embryo immunoblotting and mRNA analysis (Fig. 1A). The same-cell, multimodal analysis uses an open microfluidic device designed for (i) precision cell isolation, imaging, and fractionation of the cytoplasm from nucleus; (ii) single-cell immunoblotting; and (iii) subsequent release and retrieval of nuclei-laden gel pallets for RT-qPCR. Suitable for analysis of intact embryos down to dissociated single blastomeres (100 to <5 pl), precision microfluidic handling indexes molecular and cellular information back to the originating intact embryo, allowing for measurements across multiple modalities to be compared. Given the wide range of cellular volumes among the preimplantation specimens under study (Fig. 1B) (25), at the protein level, we first established a dynamic protein detection range spanning femtomoles (10−15) to tens of attomoles (10−17), with an assumed starting protein concentration in the micromolar range (fig. S1) (38). At the mRNA level, nuclei derived from single blastocysts and analyzed by gel pallets subjected to RT-qPCR showed significantly lower cycle threshold (CT) values for β-actin than negative controls. Negative controls included blanks, gel pallets with empty microwells, and samples lacking reverse transcriptase (Mann-Whitney U Test, P = 0.0238, with n = 3 replicates per sample; fig. S2).
Fig. 1. Same-embryo mRNA and protein expression analyses show positive correlation for late-stage murine preimplantation embryos, but not two-cell and four-cell embryos.
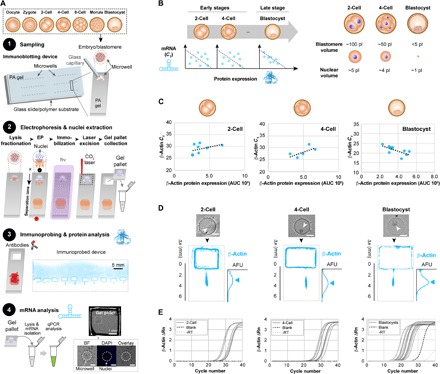
(A) The same-embryo mRNA and microfluidic immunoblotting workflow begins with (1) sampling a single embryo or single blastomere into a microwell patterned on a polyacrylamide (PA) gel. (2) The cytoplasmic fraction of embryos sampled into wells is first lysed and electrophoresed across the PA layer, achieving separation of proteins by molecular mass. EP, electrophoresis. Proteins are photoblotted, or immobilized to the PA by UV-activated benzophenone chemistry, while a CO2 laser cutter is used to extract sections of the PA-polymer film device, termed “gel pallets,” that contain nuclei retained in the microwells. (3) The cytoplasmic proteins are probed with fluorophore-conjugated antibodies. False-color fluorescence micrograph shows a device immunoprobed for β-actin. (4) mRNA is isolated from gel pallets and analyzed for targets by RT-qPCR. Micrograph of a gel pallet housing Hoechst-stained nuclei. DAPI, 4′,6-diamidino-2-phenylindole. Scale bars, 50 μm unless specified. (B) Schematic illustrations of the expected correlations between mRNA and protein for early-stage versus late-stage preimplantation embryos (left), and relative dimensions of embryos and blastomeres for the stages studied (right). (C) β-Actin mRNA CT values and protein expression levels (AUC) for two-cell, four-cell, and blastocyst-stage embryos. Dashed lines show best linear fits (Pearson correlation coefficients for two-cell embryos, four-cell embryos, and blastocysts: 0.437, 0.674, and −0.668; with P = 0.279, 0.212, and 0.0348, for n = 8, 5, and 10 embryos, respectively). AFU, arbitrary fluorescence units. (D) Bright-field micrographs show intact two-cell–, four-cell–, and blastocyst-laden microwells. False-color fluorescence micrographs show resulting β-actin immunoblots, with rectangular perimeter of excised gel pallets visible in micrographs and corresponding intensity profiles shown to the right. (E) RT-qPCR β-actin amplification curves for two-cell–, four-cell–, and blastocyst-stage embryos and corresponding negative controls (−RT and blank controls consisting of empty gel pallets).
We next examined protein and mRNA expression of β-actin in two- and four-cell embryos, where we observed no significant correlation between protein expression and β-actin CT (Pearson correlation coefficients of 0.437 and 0.674 with P = 0.279 and 0.212, n = 8 two-cell embryos and n = 5 four-cell embryos) (Fig. 1C). At the blastocyst stage, on the other hand, β-actin CT and protein expression showed a significant, negative correlation (Pearson correlation coefficient = −0.668, P = 0.0348, for n = 10 embryos), indicating that mRNA and protein expression are positively correlated (Fig. 1, C and D). For two-cell and four-cell embryos, negative controls did not amplify. For blastocysts, all β-actin CT values were significantly lower than the negative controls (Fig. 1E). For all murine embryo stages assayed, interembryonic mRNA variation was higher than the CT technical variation threshold (CVCT tech threshold = 0.77%; fig. S3), suggesting that biological and not technical variation was detected (CVCT = 7.2, 7.8, and 10.8% for two-cell embryos, four-cell embryos, and blastocysts, respectively).
These results are in line with the transitioning status of the embryo from maternally deposited transcripts and proteins (actively and passively degraded at different rates), to the more stable environment of the postzygotically activated blastocyst at which point maternal clearance is largely or totally complete (36). Given the unpredictable relationship between transcripts and protein at very early and unstable developmental stages, complementing transcriptional profiling with same-cell protein profiling provides a more comprehensive window into the biology governing preimplantation development.
Sister-blastomere GADD45a expression uniformity disappears between the two-cell and four-cell stages
The exact stage and circumstances by which blastomeres first acquire certain fates remain unknown. On the one hand, embryonic plasticity points to blastomere symmetry up to the eight-cell embryo, where embryos can compensate for the loss of one blastomere as early as the two-cell stage (39). On the other hand, studies showing consistent bimodal expression of genes related to differentiation in early-stage sister blastomeres suggest that the involved factors may not be inherited equally by all blastomeres (8). Whether this heterogeneity is transcriptional noise or leads to functional heterogeneity in the subsequent protein products remains an open question.
Consequently, we sought to inspect early-stage embryos for lineage biases by dissociating two-cell and four-cell embryos and measuring cell fate–related protein markers among the blastomeres of each embryo stage. We assayed early-stage blastomeres for a protein involved in DNA damage repair (GADD45a) that has been reported to show bimodal transcription levels at the two-cell and four-cell stages (Fig. 2A)(3). We controlled for variation arising from stochastic factors, such as asymmetrical partitioning of proteins and mRNA during cell division (10). To do this, we concurrently probed for intracellular structural proteins expressed proportionally to cell volume (β-tubulin and β-actin; Fig. 2B) (3) and compared protein expression variation among the protein markers.
Fig. 2. Microfluidic immunoblotting measures intraembryonic heterogeneity in GADD45a expression in murine four-cell and two-cell embryos.
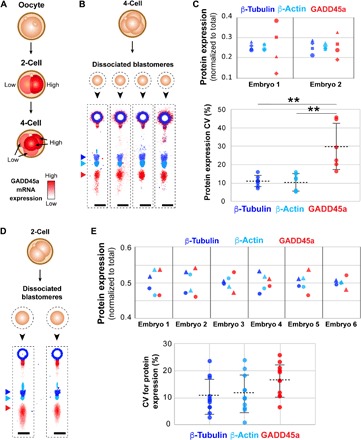
(A) GADD45a transcript levels have been shown to exhibit bimodality at the two- and four-cell stages. (B) Four-cell embryos are dissociated into individual blastomeres and immunoblotted for protein expression of β-tubulin, β-actin, and GADD45a, as shown in false-color fluorescence micrographs. (C) Dot plot of expression of β-tubulin (blue), β-actin (cyan), and GADD45a (red) normalized to total expression by individual blastomeres from two representative four-cell embryos (top). Dot plot of intraembryonic coefficient of variation (CV) in protein expression for β-tubulin, β-actin, and GADD45a (bottom, Mann-Whitney U test, P = 0.0012 for CVGADD45a versus CVβ-tub and CVGADD45a versus CVβ-actin, and P = 0.805 CVβ-tub versus CVβ-actin, for n = 6 dissociated embryos). **P < 0.01. (D) Two-cell embryos are dissociated into individual blastomeres and assayed for protein expression of β-tubulin, β-actin, and GADD45a, as shown in false-color fluorescence micrographs. (E) Dot plots of β-tubulin, β-actin, and GADD45a expression by sister blastomeres, normalized to sum of expression of sister blastomeres, for six representative two-cell embryos (top). Dot plot of interblastomeric CV% in expression of β-tubulin, β-actin, and GADD45a (bottom, Mann-Whitney U test, P = 0.0323 for CVGADD45a versus CVβ-tubulin, P = 0.130 for CVGADD45a versus CVβ-actin, and P = 0.598 for CVβ-tubulin versus CVβ-actin, for n = 11 dissociated two-cell embryos). Same marker for a given embryo in (C) and (E) indicates same blastomere. Horizontal bars in (C) and (E) indicate mean ± SD. Scale bars, 200 μm.
In four-cell embryos, where sister blastomeres were assayed in parallel, we observed intraembryonic GADD45a expression variation that was significantly higher than both β-actin and β-tubulin expression variation (CVGADD45a = 29.9 ± 12.7%; CVβ-tub = 11.1 ± 3.1%; CVβ-actin = 10.5 ± 4.6%; mean CVexpression ± SD, Mann-Whitney U test, P = 0.0012 for CVGADD45a versus CVβ-tub and CVGADD45a versus CVβ-actin, and P = 0.805 for CVβ-tub versus CVβ-actin, for n = 6 dissociated four-cell embryos, where all CVs > CVthreshold of 7.4%) (Fig. 2C). Furthermore, normalization by β-tubulin expression did not decrease the GADD45a CVs (Wilcoxon match-paired rank test, P = 0.156, n = 6). These findings suggest that blastomeres of four-cell embryos show heterogeneous expression of GADD45a, as corroborated by mRNA- and IF-based findings (3).
Given that Gadd45a transcript levels have been shown to differ between sister two-cell blastomeres (3), we next determined if this heterogeneity in mRNA levels manifests as differential GADD45a protein expression in the two-cell embryo (Fig. 2D). In contrast to the four-cell stage, dissociated two-cell sister blastomeres showed a statistically significant increase in GADD45a protein expression CV over β-tubulin, but not β-actin (CVGADD45a = 16 ± 6.0%; CVβ-tubulin = 10 ± 6.5%; CVβ-actin = 11 ± 7.0%; mean ± SD, Mann-Whitney U test, P = 0.0323 for CVGADD45a versus CVβ-tubulin and P = 0.130 for CVGADD45a versus CVβ-actin, for n = 11 dissociated two-cell embryos) (Fig. 2E). Thus, while the expression of GADD45a at the four-cell stage shows higher heterogeneity than both β-tubulin and β-actin, the same cannot be said about sister blastomeres from the two-cell stage.
Given the unique nature of the two-cell embryo, which is the only “multicellular” stage of development undergoing both zygotic genome activation (ZGA) and maternal clearance (37), single-blastomere protein analysis complements our understanding of heterogeneity observed at the mRNA level (3). While the exact nature of the transcriptional, translational, and degradation events occurring within the two-cell embryos are not completely clear, deeper scrutiny of the early two-cell state is essential.
Truncated DICER-1 isoform expression decreases from the oocyte to the two-cell stage
Alternative splicing occurs frequently during early embryonic development in mouse and human (40). However, efforts to investigate whether the corresponding alternate protein isoforms are ultimately and stably generated require pooling hundreds of collected embryos from each stage, losing interblastomeric information (41). The role of alternative isoform usage between sister blastomeres and what role this has on cell fate specification are still unclear. Thus, resolving proteoforms generated by alternative splicing would benefit from precision tools with single-embryo resolution.
To this end, we examined one of the earliest known examples of a protein isoform that exists in mouse development: DICER-1. DICER-1 is essential for small RNA–mediated gene expression regulation. By processing small RNAs into their mature form, DICER-1 generates sequence-specific guides required by effector complexes to target cognate mRNAs and regulate their translation (42). Bulk analyses of mouse oocytes by others have found high expression of an N-terminally truncated isoform, denoted DICERO (Fig. 3A) (42), which demonstrates higher catalytic activity than its full-length version and is believed to drive the high activity of endogenous small interfering RNAs (endo-siRNAs) in mouse oocytes, but not in somatic cells (42). The DICERO transcript persists until the fertilized zygote stage, but whether the DICERO protein isoform is exclusive to oogenesis or is maternally inherited by the preimplantation embryo remains unknown.
Fig. 3. Higher DICER-1 isoform expression in murine oocytes than in two-cell embryos correlates with mRNA levels.
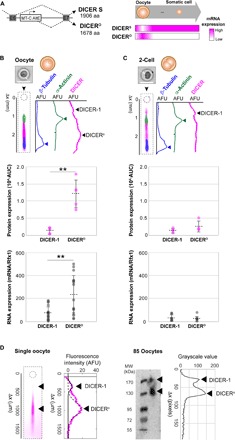
(A) DICERO, a truncated isoform of DICER-1, appears at the oocyte stage and is a product of alternative promoter usage. aa, amino acid. Bright-field micrographs of (B) a settled oocyte, **P < 0.01 and (C) a settled two-cell embryo, with corresponding overlaid false-color fluorescence micrographs and intensity profiles showing protein bands for loading controls (α-actinin and β-tubulin) and DICER-1. Oocyte immunoblot demonstrates presence of a full-length DICER-1 (top arrow) and a lower molecular mass isoform (bottom arrow). Under these, dot plots of DICER isoform mRNA levels normalized by endogenous control Rfx1 (top) and protein expression (AUC, bottom). Expression of the truncated isoform is higher than the full-length DICER-1 for both mRNA and protein in oocytes (mRNA/Rfx1DICER-1 versus mRNA/tDICERo: Mann-Whitney U test, P = 0.0052 for n = 18; for AUCDICER-1 versus AUCDICERo: Mann-Whitney U test, P = 0.0079 for n = 5), but not in two-cell embryos (for mRNA/Rfx1DICER-1 versus mRNA/Rfx1DICERo: Mann-Whitney U test, P = 0.9551 for n = 7 for DICER-1 and n = 8 for DICERO; for AUCDICER-1 versus AUCDICERo: Mann-Whitney U test, P = 0.20 for n = 4). Oocytes show higher mRNA and protein expression than two cells for the truncated isoform (mRNA/Rfx1DICERO: Mann Whitney U test, P = 0.0004 for n = 18 oocytes and 8 two cells; AUCDICERO: Mann Whitney U test, P = 0.0159 for n = 5 oocytes and 4 two-cell embryos), but not the full-length DICER-1 (mRNA/Rfx1DICER-1: Mann Whitney U test, P = 0.084 for n = 18 oocytes and 7 two-cell embryos; AUCDICER-1: Mann Whitney U test, P = 0.9048 for n = 5 oocytes and 4 two-cell embryos). Horizontal bars indicate mean ± SD. Scale bars, 200 μm. (D) Fluorescence micrograph of a single oocyte immunoblotted for DICER-1 with corresponding fluorescence intensity profiles and Gaussian curve fits to the DICERo isoform (low molecular mass, R2 = 0.83, solid black line) and DICER-1 full-length isoform (R2 = 0.89, dotted black line). To the right, slab-gel Western blot analysis of pooled oocytes (n = 85 oocytes) and corresponding grayscale value profile show two DICER-1 protein bands. Oocytes were pooled, lysed, and assayed by nonreducing SDS-PAGE followed by immunoprobing. Buffers and immunoprobing reagents matched the single-cell protocol. Black arrowheads mark the position of the DICER-1 bands.
We asked if DICERO is specific to the oocyte stage by assaying oocytes and two-cell embryos for isoforms of DICER-1 at the protein and mRNA level. We collected oocytes and two-cell embryos and divided each sample for analysis of either protein or mRNA.Samples destined for protein analysis were processed by single-cell immunoblotting, while samples analyzed for mRNA were individually lysed and processed by single-embryo RT-qPCR. Using a panspecific DICER-1 antibody probe, single-embryo polyacrylamide gel electrophoresis (PAGE) resolved multiple DICER-1 isoforms by relative order of electromigration, detecting both the full-length DICER-1 form (larger molecular mass band) and the truncated form (smaller molecular mass band; Fig. 3B). We observed that both oocytes and two-cell embryos expressed truncated isoforms of DICER-1 (Fig. 3, B and C). Nonreducing slab-gel Western blotting of 85 pooled oocytes also reported two DICER-1 protein bands, with a smaller molecular mass peak of higher intensity, corroborating single-oocyte immunoblotting results regarding the truncated DICER-1 isoform (Fig. 3D).
Within oocytes, we observed significantly higher expression of the truncated isoform over the full-length DICER-1 for both normalized mRNA and protein (for mRNA/Rfx1DICER-1 versus mRNA/Rfx1DICERo: Mann-Whitney U test, P = 0.0052 for n = 18; for protein band AUCDICER-1 versus AUCDICERo: Mann-Whitney U test, P = 0.0079 for n = 5; Fig. 3B). For whole two-cell embryos, we found no significant difference between expression of truncated and full-length isoforms of DICER-1 (for mRNA/Rfx1DICER-1 versus mRNA/Rfx1DICERo: Mann-Whitney U test, P = 0.9551 for n = 7 for DICER-1 and n = 8 for DICERO; for AUCDICER-1 versus AUCDICERo: Mann-Whitney U test, P = 0.20 for n = 4) (Fig. 3C).
When comparing full-length DICER-1 expression levels between the oocyte and two-cell stages, expression was not significantly different by mRNA or by protein expression (mRNA/Rfx1DICER-1: Mann Whitney U test, P = 0.084 for n = 18 oocytes and 7 whole two-cell embryos; AUCDICER-1: Mann-Whitney U test, P = 0.9048 for n = 5 oocytes and 4 two-cell embryos). When comparing the truncated DICER-1 isoform expression levels, however, we observed a significant decrease from the oocyte to the two-cell stage in both mRNA and protein levels (mRNA/Rfx1DICERO: Mann-Whitney U test, P = 0.0004 for n = 18 oocytes and 8 two cells; AUCDICERO: Mann-Whitney U test, P = 0.0159 for n = 5 oocytes and 4 two-cell embryos).
Precision analyses of oocytes and two-cell embryos report a notable decrease in the truncated DICER-1 protein isoform and mRNA expression between the stages, but no notable decrease in full-length DICER-1 across the same development stages. Our results support a role for DicerO being maternally generated and available at the time of fertilization. In line with previous studies (42), DicerO appears to have a critical role in oocyte maturation and spindle assembly before fertilization. The observed clearance of the truncated isoforms after fertilization suggests a role limited to the oocyte that does not extend into the preimplantation embryo.
Integrating phenotypic information with precision molecular profiling of cell lineage
We sought to achieve a more comprehensive understanding of cell state by integrating phenotype profiling of intact cells with subsequent single-cell analyses of mRNA and protein. First, we asked whether the TE or ICM state could be determined among blastomeres dissociated from blastocysts using a multimodal assay that integrates intact cell imaging with relative expression of protein markers understood to be specific to TE versus ICM (i.e., CDX-2 versus SOX-2, respectively) (Fig. 4A). Here, internalization of fluorescent beads acted as a proxy for TE or ICM cell type within a blastocyst (43), on the basis of the originating location of the blastomere.
Fig. 4. Whole-cell imaging adds phenotypic content to protein analysis of single embryos and blastomeres.

(A) Cell type–graded expression of CDX-2 and SOX-2 in blastomeres from dissociated blastocysts. Bright-field and fluorescence micrographs of dissociated blastocysts after incubation with fluorescent microspheres and corresponding micrographs of blastocysts immunoblotted for β-tubulin, CDX-2, and SOX-2. Scale bars, 50 μm. (B) Detection of membrane proteins in morula and blastocysts. Bright-field micrographs showing embryos settled into microwells before lysis, with resulting false-color micrographs immunoblots for β-tubulin, E-cadherin, and FGFR-1, with corresponding fluorescence intensity profiles shown to the right. Scale bars, 100 μm. Dot plots of E-cadherin (left) and FGFR-1 (right) expression for morula and blastocysts (for E-cadherin: n = 3 and 3 morula and blastocysts, for FGFR-1: n = 6 and 5 morula and blastocysts). Horizontal bars represent mean ± SD. (C) Microscopy and single-blastomere immunoblotting identifies correlations between cell volume and marker expression in dissociated morula blastomeres. False-color fluorescence micrographs show β-tubulin, β-actin, and SOX-2 protein bands, with intensity profiles adjacent to micrographs. Arrows mark the position of protein bands. Scale bars, 100 μm. To the right, bivariate plot of blastomere cell volume and loading control expression (β-tubulin and β-actin) shows significant positive linear correlation (Pearson correlation, n = 8, ρ = 0.883 and 0.908, P = 0.00366 and 0.00018, respectively). Bivariate plot of cell volume versus SOX-2 expression normalized by β-tubulin and β-actin expression show a negative, but nonsignificant, association (Pearson correlation, n = 8, ρ = −0.487 and −0.315, P = 0.221 and 0.447, respectively).
To obtain phenotypic information, we selectively stained the outer TE cells by incubating blastocysts (3.5 to 4 dpc) with a solution of fluorescent microspheres (43). With bead-based staining, ICM cells (inner cells) do not fluoresce, while TE cells (outer cells) do fluoresce, indicating internalization of fluorescent microspheres (43). Blastocysts were then dissociated into single cells, settled into microwells, and imaged for the presence of microspheres (Fig. 4A). Subsequent immunoblotting for β-tubulin, SOX-2, and CDX-2 revealed negligible levels of SOX-2 and high levels of CDX-2 in blastomeres that were positive for microsphere signal, indicating TE cell type (Fig. 4A). Blastomeres with no detectable microsphere signal, suggesting ICM cell type, expressed high levels of SOX-2 and negligible levels of CDX-2 (Fig. 4A).
In a corollary study, we considered modulation of preimplantation development through membrane proteins (44). In both morula and blastocysts, we profiled the cell adhesion protein E-cadherin and the cell surface receptor fibroblast growth factor receptor 1 (FGFR-1; Fig. 4B). For both proteins, expression did not significantly differ between the morula and blastocyst stages (Mann-Whitney U test, n = 3, P = 0.400 for E-cadherin; n = 6 and 5 for morula and blastocysts, respectively, P = 0.465 for FGFR-1; Fig. 4B).
Second, we sought to integrate knowledge that cellular concentration is understood to be a more accurate indicator of cell phenotype than total abundance (45). The transcriptional profile of housekeeping genes (e.g., β-actin and β-tubulin) is often not stably and homogeneously expressed across different cell samples, experimental conditions, or treatments (46). To understand if this observed variability prevails at the protein level, we scrutinized the assertion that—at the protein level—both β-tubulin and β-actin can be used as proxies for cell volume. Dissociated morula blastomeres were first interrogated by whole-cell bright-field imaging and subsequently by single-cell immunoblotting (Fig. 4C). We observed a significant, positive correlation between cell volume and protein expression of both β-tubulin and β-actin (Fig. 4C; Pearson correlation, ρ = 0.883 and 0.908, P = 0.00366 and 0.00018, respectively, for n = 8 blastomeres).
We further scrutinized dissociated blastocysts to establish if smaller blastomeres express higher levels of SOX-2, the transcription factor involved in pluripotency gene expression (47). We dissociated blastocysts into single blastomeres, measured the diameter of each by bright-field microscopy, and then assayed each for SOX-2 by single-blastomere immunoblot. For blastomeres expressing SOX-2, we compared SOX-2 expression to the measured cell volume and found a significant, negative correlation (Pearson correlation, ρ = −0.899, P = 0.00589 for n = 7 single blastomeres; fig. S4), as expected at the blastocyst stage (47, 48). We then performed the same analysis for morula and again observed an expected negative correlation (48) between SOX-2 expression and volume of morula blastomeres for both β-tubulin and β-actin normalization (Fig. 4C; Pearson correlation, n = 8, ρ = −0.487 and −0.315, P = 0.221 and 0.447, respectively).
DISCUSSION
The exact timing and mechanism by which the first cell fate decisions occur during mammalian preimplantation development remain unknown. Pivotal open questions include whether developing blastomeres remain homogeneous and functionally equivalent until the compacted morula stage (1) or if blastomeres exhibit symmetry-breaking configurations, perhaps as early as the two-cell stage (5, 7, 9). Yet, transcript abundance is not an accurate determinant of protein abundance. The asynchrony observed between mRNA and protein expression may reflect the uncoupled relationship between transcription and translation in the early embryo (up to 15 hours between transcription and translation), synchronizing more tightly in later cleavage stages (11).With both the now-understood loose correlation between mRNA and protein expression levels and critical shortcomings of the de facto standard for direct measurement of endogenous, unmodified proteins (i.e., immunoassays), we describe a multimodality microfluidic platform optimized for the study of murine preimplantation embryo development.
During cell fate determination, we scrutinized two-cell and four-cell embryos for GADD45a heterogeneity at protein level; GADD45a is a gene shown to be bimodally transcribed in early embryonic stages. By scrutinizing the blastomeres that comprise four-cell embryos, we detected higher heterogeneity in GADD45a protein expression than loading controls β-tubulin and β-actin, providing the protein-based validation of recent single-cell RNA sequencing (RNA-Seq) predictions. At the oocyte and two-cell embryo stages, we observed a truncated DICER-1 protein isoform as dominant in the oocyte stage with significantly lower truncated DICER-1 mRNA and isoform levels at the two-cell stage. The observation suggests inheritance from the oocyte stage and corroborates studies suggesting that the higher-activity truncated DICER-1 isoform is oocyte-specific.
Simultaneous measurement of mRNA and protein from embryos of the same donor enhances the biological accuracy of correlations between mRNA levels and protein expression at different stages of the preimplantation embryo. Such insight into the expression dynamics would clarify how modulation in transcription dictates cellular phenotype. Our findings more accurately characterize the discrepancy between transcript abundance and protein presence in the early preimplantation embryo, a phenomenon that is ameliorated by the blastocyst stage, which coincides precisely with the maternal-to-zygotic transition experienced by all preimplantation embryos of all studied species. Companion functional competency measurements guided by the ever-increasing resolution of single-cell transcript approaches will help in determining the proteins and isoforms involved in key cell fate decisions. Further, given the importance of secreted proteins in lineage segregation (44), a study is underway to advance same-cell microfluidic tools to assess both intraembryonic proteins and secreted proteins.
As detailed here, the ~10 to 20 embryos harvested from a single mouse donor are sufficient not just for one immunoblot but for multiple single-embryo and single-blastomere immunoblots. The precision in sample handling and enhanced sensitivity notably reduces the conventional PAGE sample requirements of several hundreds or thousands of embryos (41, 42). The implications are multifold. First, as single-embryo immunoblots inherently and markedly lower sample requirements, the burden of animal sacrifice is likewise reduced. Current gold standard protein measurements consist of conventional western blotting, which, depending on expected protein abundance, requires combination of 50 to 100 embryos to ensure a detectable signal (49). These issues are made further dismal in cases involving subfertility or when a specific genotype is required. For wild-type mouse conditions, conventional western blotting would require the sacrifice of 5 to 10 mice per lane (or measurement). If a specific genotype is needed, then this value is multiplied by the difficulty in procuring the needed samples. With the strategy described here, a single mouse could provide sufficient material for up to 10 to 20 individual measurements. Second, statistical interpretation of single-embryo and single-blastomere immunoblot results is feasible, revealing intraembryonic heterogeneity, as well as significant differences between embryos of the same fertilization event and between donors. Last, immunoblots can be stored and reprobed for additional proteins as previously unidentified, important targets emerge in the rapidly advancing field of developmental biology.
Open questions remain; although nuclear mRNA and whole-cell mRNA are strongly correlated (50), specific exceptions do exist, including genes involved in splicing (50, 51). Biological interpretation of correlation (or lack thereof) between mRNA and protein expression levels should include consideration of whether nuclear mRNA levels (measured here) reflect whole-embryo mRNA levels. Understanding of nuclear versus whole-cell mRNA distributions in the preimplantation embryo is currently lacking. Reports on ZGA and maternal clearance suggest that, as maternal transcripts are degraded (52), the whole-cell mRNA, thus, comprises a mixture of old (cytoplasmic) transcripts and new (nuclear) transcripts. After fertilization, nuclear transcripts should largely represent the total and zygotically active transcriptome, while most of cytoplasmic transcripts are inherited and no longer actively contribute to the newly active zygotic proteome; however, the kinetics of this transition have been difficult to study. Using approaches like that described here, we seek to boost understanding of questions such as if and when the nuclear mRNA fraction constitutes an accurate representation of the embryo’s emerging proteome.
In mice, ZGA occurs shortly after fertilization and is not fully realized until the two-cell stage, at which point nascent mRNA populates the embryonic transcriptome (52). At the same time, maternally inherited transcripts and proteins are being actively and passively cleared and degraded at different rates, further confounding results and interpretations of early preimplantation studies (36). While recent single-cell RNA-Seq experiments reveal sister blastomere transcriptome heterogeneity as early as the two-cell embryo in both humans and mice (3), functional studies suggest these differences may not be relevant until the four-cell stage or later (if at all) (2, 6). Therefore, careful assessment of exact fertilization times is needed to compare early embryos (pronucleus and two-cell), while sister blastomere comparisons are ideal for later stages. Biological variation such as the exact timing of fertilization can potentially be more tightly controlled using in vitro fertilization, at the risk of introducing technical artifacts. The use of in vitro culture could additionally complicate analysis as sibling embryos can spontaneously respond poorly to identical culturing conditions (53).
Last, with the advent of new gene editing technologies (e.g., CRISPR, genomic screening methods including targeted, exome, or whole-genome sequencing), screening for on-target and off-target activity has become critical, as unintended editing events can lead to exon skipping, alternative splicing, and deletions that occasionally lead to active versions of supposedly “knocked out” targets (54). Protein assays that can complement genomic screening, such as the one described in this study, will be crucial for screening embryos for protein-level effects of both on-target and off-target mutations, even when the latter occur in noncoding regions.
MATERIALS AND METHODS
Animals and ethics statement
As a matter of caution and compliance, all appropriate authorizations have been acquired from institutional and/or federal regulatory bodies before performing this protocol. All mouse use, including but not limited to housing, breeding, production, sample collection for genotyping, and euthanasia, is in accordance with the Animal Welfare Act, the American Veterinary Medical Association (AVMA) Guidelines on Euthanasia and are in compliance with the Institute of Laboratory Animal Resources (ILAR) Guide for Care and Use of Laboratory Animals, and the University of California Berkeley Institutional Animal Care and Use Committee (IACUC) guidelines and policies. Our animal care and use protocol has been reviewed and approved by our IACUC for this project.
Chemical reagents
Tetramethylethylenediamine (TEMED; T9281), ammonium persulfate (APS; A3678), β-mercaptoethanol (M3148), 30%T/2.7%C acrylamide/bis-acrylamide (37.5:1) (A3699), bovine serum albumin (BSA; A9418), Tyrode’s solution (T1788), trypsin 10× (59427C), Accutase (A6964), and 3-(trimethoxylsilyl)propyl methacrylate (440159) were purchased from Sigma-Aldrich. Triton X-100 (BP-151) and phosphate-buffered saline (PBS; pH 7.4; 10010023) were purchased from Thermo Fisher Scientific. Premixed 10× tris-glycine EP (electrophoresis) buffer [25 mM tris (pH 8.3), 192 mM glycine] was purchased from Bio-Rad. Tris-buffered saline with Tween-20 (TBST) was prepared from 20× TBST (sc-24953, Santa Cruz Biotechnology). Deionized water (18.2 megohms) was obtained using an ultrapure water system from Millipore. Alexa 555–labeled BSA (A34786) was purchased from Invitrogen. N-[3-[(3-benzoylphenyl)formamido]propyl] methacrylamide (BPMAC) was custom synthesized by Pharm-Agra Laboratories (Brevard, NC). GelSlick (50640) and Lonza GelBond PAG Film for Acrylamide Gels (BMA54746) were purchased from Lonza.
Device fabrication
Devices for protein immunoblotting were fabricated using SU-8 microposts patterned on silicon wafers to mold the PA gel microwells, as previously reported (55). Briefly, polyacrylamide precursor solution including acrylamide/bis-acrylamide (7 to 12%T) and 3 mM BPMAC was degassed with sonication for 9 min. APS (0.08%) and TEMED (0.08% ) were added to the precursor solution, and the solution was pipetted between the SU-8 wafer (rendered hydrophobic with Gel Slick solution) and either (i) a glass microscope slide functionalized with 3-(trimethoxylsilyl)propyl methacrylate (to ensure covalent grafting of PA gel to glass surface) for immunoblotting alone, or (ii) a GelBond polymer cut to the size of a standard glass slide for same-embryo immunoblotting and mRNA measurement devices. After chemical polymerization (20 min), devices (glass or GelBond polymer with grafted PA gel layer) were lifted from the wafer, rinsed with deionized water, and stored dry until use.
Microwell diameter and height were optimized for each sample, where microwell diameter approximates the average blastomere or embryo diameter (from 20 to 30 μm for dissociated blastocyst blastomeres to 150 μm for whole embryos), and the diameter-to-height ratio was kept at approximately 3:4 to prevent convection streamlines from dislodging settled cells during the pouring of lysis buffer (20). In devices for same-embryo immunoblotting and mRNA measurements, microwell diameter and height were 200 μm, to allow alignment of laser over the area containing the microwells.
Mouse embryo isolation and culture
Three- to five-week-old female C57BL/6J mice (000664, the Jackson laboratory) were superovulated by intraperitoneal (IP) injection of 5 IU of pregnant mare serum gonadotropin (PMSG; Calbiochem, 367222, Millipore), and 46 to 48 hours later, IP injection of 5 IU human chorion gonadotropin (hCG; Calbiochem, 230734, Millipore). Superovulated females were housed at a 1:1 ratio with 3- to 8-month-old C57BL/6J males to generate one-cell zygotes at 0.5 day after coitum. Using forceps under a stereomicroscope (Nikon SMZ-U or equivalent), the ampulla of the oviduct was nicked, releasing fertilized zygotes and oocytes associated with surrounding cumulus cells into 50 μl of M2 + BSA medium [M2 medium (MR-015-D, Millipore) supplemented with BSA (4 mg/ml; A3311, Sigma-Aldrich)]. Using a handheld pipette set to 50 μl, zygotes were dissociated from cumulus cells after the cumulus oocyte complexes were transferred into a 200-μl droplet of hyaluronidase/M2 solution (MR-051-F, Millipore), incubated for up to 2 min, and passed through five washes in the M2 + BSA medium to remove cumulus cells.
From this point on, embryos were manipulated using a mouth-controlled assembly consisting of a capillary pulled from glass capillary tubes (P0674, Sigma-Aldrich) over an open flame attached to a 15-inch aspirator tube (A5177, Sigma-Aldrich). Embryos were passed through five washes of M2 + BSA to remove cumulus cells. Embryos were then transferred to KSOM + BSA medium (KCl-enriched simplex optimization medium with amino acid supplement, ZEKS-050, Zenith Biotech) that was equilibrated to final culturing conditions at least 3 to 4 hours before incubation. Embryos were cultured in 20-μl droplets of KSOM + BSA overlaid with mineral oil (ES-005-C, Millipore) in 35 × 10–mm culture dishes (627160, CellStar Greiner Bio-One) in a water-jacketed CO2 incubator (5% CO2, 37°C, and 95% humidity).
Single-embryo RT-qPCR for DICER-1
All single-embryo cDNA was prepared using a modified version of the single cell–to–Ct RT-qPCR kit (4458236, Life Technologies). Whole embryos were isolated at the desired developmental stage. Using a mouth pipette, embryos were then passed through three washes of PBS. With a handheld pipette set to 1 μl, a single embryo was collected and transferred to one tube of an 8-well PCR strip. Presence of embryo was visually confirmed in each tube before complementary DNA (cDNA) synthesis. To account for the larger sample input, twice the protocol-recommended volume of lysis buffer/deoxyribonuclease (20 μl) was added to each embryo and allowed to incubate at room temperature (RT) for 15 min. Then, 2 μl of Stop Solution was added and incubated for 2 min. At this point, half of the reaction was stored in −80°C conditions as a technical replicate, and the remaining sample (11 μl) continued through the original single cell–to–Ct protocol. All RT-qPCRs were performed using SSO Universal SYBR Green SuperMix, as per the manufacturer’s instructions (1725275, Bio-Rad). Primer sequences used were Rfx1 (5′AGT GAG GCT CCA CCA CTG GCC G, 5′TGG GCA GCC GCT TCT C), Dicer-1 (5′GGA TGC GAT GTG CTA TCT GGA, 5′GCA CTG CTC CGT GTG CAA), and DICER-1 (5′CTC TTT CCT TTG AAT GTA CAG CTA C, 5′CAG TAA GCA GCG CCC CTC). All RT-qPCR analyses were performed on the StepOnePlus Real-Time PCR System (437660, Thermo Fisher Scientific).
Single-embryo and single-blastomere microfluidic immunoblotting
Once the desired developmental stage was reached, embryos were transferred to a ~50-μl droplet of acid Tyrode’s solution (T1788, Sigma-Aldrich) and incubated at 37°C for up to 2 min to remove the zona pellucida. If dissociation into blastomeres was required, embryos were incubated with a 1:1 solution of Accutase and 10× trypsin (15090046, Thermo Fisher Scientific) at 37°C (time varied with development stage, ranging from 5 min for two-cell embryos to up to 5 hours for blastocysts). Embryos were then mechanically disrupted by passing each embryo through a capillary repeatedly until dissociation. Single embryos or blastomeres were washed with PBS and deposited into microwells of the PA gel. Microwells were imaged by bright-field microscopy to collect data on size, morphology, and ensure occupancies of one embryo or blastomere per microwell.
Once isolated in each microwell, cell samples were chemically lysed. Lysis conditions, including buffer composition, temperature, and treatment time, were optimized for each developmental stage (table S1). To minimize diffusive losses during lysis, cylindrical microwells are designed to approximate the volume of our samples and, thus, maintain the high local protein concentrations that exist inside cells. Thus, as described previously, for each stage, we designed microwells with diameters that approximate the diameter of the individual embryo or blastomere we wish to isolate (20 to 150 μm). After lysis, an electric field (E = 40 V/cm) was applied to drive PAGE in a 3-mm-long separation lane abutting each lysate-containing microwell. Electrophoresis was performed at 40 V/cm for varying times (from 20 s to 2:17 min, depending on developmental stage and protein targets; table S1).
Immobilization of proteins by photoblotting was carried out by illumination with an ultraviolet (UV) light source (100% power, 45 s; Lightningcure LC5, Hamamatsu). Gels were washed in 1× TBST for at least 1 hour before probing with antibodies. Primary antibodies were incubated at 1:10 or 1:5 dilution (40 μl per gel, in 2% BSA in 1× TBST), while fluorophore-conjugated secondary antibodies were incubated at 1:10 or 1:20 dilution (40 μl per gel, in 2% BSA in TBST). To strip bound antibodies and reprobe for new targets, gels were treated with 2% SDS, 0.8% β-mercaptoethanol, and 62.5 mM tris base at 55°C for 1 to 3 hours, washed in TBST (1 hour) twice, and then reprobed.
In terms of throughput, we concurrently assay up to 40 samples (blastomeres or embryos) on one device, with the possibility of up to 100 samples per device if all microwells are used. Primary limitations to throughput include (i) sample availability, with ~20 embryos collected per mouse (25–27), (ii) and sample preparation, including serial microtransfer of one cell to each microwell.
Optimization of lysis and electrophoresis times depends on (i) target markers and (ii) starting sample. The molecular mass range of the target markers determines how long the lysate must be separated to resolve protein markers in a given gel composition (%T, or acrylamide monomer concentration). For the protein targets, the design of single-embryo PAGE aims to achieve needed separation resolution while maintaining sufficient analytical sensitivity. Here, these two critical performance metrics depend on (i) target marker characteristics and (ii) starting sample type. The molecular masses of the target markers determine the electrophoresis duration needed to resolve protein targets using a given gel composition (%T, or acrylamide monomer concentration). The starting sample type dictates available mass of protein available for analysis, where small-volume samples (e.g., blastocyst blastomeres) have lower starting mass than samples with larger volumes (e.g., oocytes). In the open microfluidic geometries used here, proteins diffuse out of the gel during the lysis and electrophoresis steps, thus diluting the lysate sample until the limit of detection is, eventually, passed (~27,000 copies of protein target) (20). Migration distances for the same protein may therefore also vary between different starting samples.
Same-embryo mRNA analysis and immunoblotting
Embryos were prepared as described above and transferred to same-embryo mRNA and immunoblotting devices (GelBondTM-grafted PA devices). Embryos were chemically lysed with fractionation lysis buffer [digitonin (0.125 mg/ml), 1% v/v Triton X-100, and 0.5× tris-glycine) at room temperature for 60 s. An electric field (E = 40 V/cm) was applied for 2 min and 17 s, followed by UV light illumination (100% power, 45 s; Lightningcure LC5, Hamamatsu). Devices were immediately placed in nuclei wash buffer (320 mM sucrose, 5 mM MgCl2, and 10 mM Hepes) at 4°C and kept over ice, with buffer exchanged three times.
A CO2 laser cutter (HL40-5G-110, Full Spectrum Laser) was used to excise 2 × 3–mm sections of the PA-polymer device encompassing single microwells, called gel pallets. Gel pallets containing the fractionated nuclei were placed in PCR tubes containing 20 μl of DNA/RNA shield buffer (R1100-50, Zymo Research) and stored at −80°C. Devices were washed with TBST and probed following the same protocol as described under the previous section.
The mRNA was isolated from gel pallets using Quick-DNA/RNA, Microprep Plus (D7005, Zymo Research). All of the extracted mRNA was used for cDNA synthesis (SuperScript4, 18091050, Thermo Fisher Scientific). cDNA was amplified with PerfeCTa PreAmp SuperMix (95146, QuantaBio), and RT-qPCRs were performed using SSO Universal SYBR Green SuperMix, as per the manufacturer’s instructions (1725275, Bio-Rad). Primer sequences used were as follows: β-actin F: GGCTGTATTCCCCTCCATCG, β-actin R: CCAGTTGGTAACAATGCCATGT. All RT-qPCR analyses were performed on the StepOnePlus Real-Time PCR System (437660, Thermo Fisher Scientific).
Antibody probes for immunoblotting
Antibodies used for analysis of embryos include rabbit anti–β-tubulin (Abcam, ab6046, polyclonal, lot: GR31927-5), mouse anti–DICER-1 (Santa Cruz Biotechnology, sc-136981, A-2, lot: I1817), mouse anti–CDX-2 (Abcam, ab157524, CDX2-88, lot: GR300552-6), anti-rabbit anti-CDX2 antibody (Abcam, ab76541, lot #GR300552-18), rabbit anti-SOX-2 (EMD Millipore, AB5603, polyclonal, lot: NG1863962 and 3254559), goat anti–glyceraldehyde-3-phosphate dehydrogenase (GAPDH) (Sigma-Aldrich, SAB2500450, polyclonal, lot: 6377C2), rabbit anti-GADD45a (Invitrogen, MA5-17014, D.81.E, lot: R12274975), Alexa Fluor 647 anti-mouse/human CD324 (E-cadherin) antibody (BioLegend catalog no. 147307, lot no. B254794), Alexa Fluor 594 FGFR-1 antibody (Santa Cruz Biotechnology, catalog no. sc-57132 AF594, lot no. J0218), Rhodamine anti–β-actin immunoglobulin G (Bio-Rad, 12004163, lot: 64219909), hFAB Rhodamine anti-tubulin primary antibody (Bio-Rad, 12004165, lot no. 64210670). Donkey secondary antibodies Alexa Fluor 647–conjugated anti-mouse (A31571, lot #1903516), Alexa Fluor 594–conjugated anti-mouse (A21203, lot #2066086), and Alexa Fluor 488-conjugated anti-rabbit (A21206) were purchased from Thermo Fisher Scientific, CA, USA. All bands migrated to approximate molecular masses stated by manufacturers or previously published studies (table S2).
Validation of SOX-2/CDX-2 expression by dissociated blastocyst blastomeres
Fluorescent microspheres (0.2 μm) (Polysciences cat. no. 17151, lot #671952) were provided by D. Fletcher’s laboratory at UC Berkeley. Selective fluorescence labeling of outer (TE) blastomeres was performed as previously described (43). Briefly, blastocysts (3.5 to 4 dpc) were incubated with a 1:100 dilution of 0.2 μm of fluorescently labeled microspheres for 1 min and then rinsed in medium before dissociation. Cells were then settled into microwells, imaged (bright-field and 488 nm), and assayed for β-tubulin, CDX-2, and SOX-2.
Conventional western blotting of pooled oocytes
Oocytes (N = 85) collected from five super ovulated C57BL/6J female mice were isolated and placed into 16 μl of harsh lysis buffer (table S1), heated to 55°C for 60 s to mimic immunoblotting lysis conditions, and stored at −80°C until required. To this sample, 4 ul of 5× Laemmli buffer was added and mixed by brief vortexing and centrifugation. The sample was loaded onto a 10% polyacrylamide gel and electrophoresed for 30 min at 50 V and 1 hour at 150 V. After transfer, the membrane was blocked with 5% milk in 1× TBST, and then probed overnight at 4°C with an antibody against DICER-1 (Santa Cruz Biotechnology, sc-136981; 1:500 dilution in blocking buffer). The membrane was washed three times with 1× TBST and then probed with goat–anti-mouse secondary antibody (Rockland, 18-8817-33; 1:5000 dilution) for 1 hour at room temperature. Three additional washes were made before detection using enhanced chemiluminesence (Millipore WBKLS0100) and imaged on a Bio-Rad GelDoc XR+. Given that sample preparation for single-embryo PAGE is not equivalent to that of bulk, slab-gel SDS-PAGE (i.e., amount of protein in both cases varies considerably), we do not expect equivalent protein sizing for all targets between the methods.
Determination of immunoblotting detection range, multiplexing, and separation resolution
We first sought to directly measure protein expression in cells ranging from single oocytes (~80 μm in diameter) to single blastomeres from dissociated blastocysts (<20 μm in diameter at 3.5 to 4.0 days after coitus, dpc) (fig. S1A). Single oocytes and single blastomeres from dissociated blastocysts were immunoblotted for the protein loading control β-tubulin (fig. S1A). By detecting β-tubulin band passing the quality control metrics of signal-to-noise (SNR) ratios above the threshold of 3 and Gaussian fit with R2 > 0.8 for both samples, we determined a dynamic detection range spanning femtomoles (10−15) to tens of attomoles (10−17), with the assumed starting protein target concentration in the micromolar range (38).
We next assayed single morula (3.0 dpc) for the loading control GAPDH and two transcription factors that are key regulators of pluripotency and differentiation (56, 57), SOX-2 and CDX-2. Multiplexing is granted by the four spectral channels available with our current microarray imaging system (Genepix 400A, Molecular Devices) in combination with availability of antibodies raised in four different species. With stripping and reprobing, up to nine rounds have been reported (20). By using a combination of (i) primary antibodies raised in different animals (goat–anti-GAPDH, rabbit–anti-SOX-2, and mouse–anti-CDX-2) and (ii) secondary antibodies conjugated to different fluorophores (donkey–anti-goat, rabbit, and mouse conjugated to Alexa Fluor 555, 488, and 594, respectively), the microfluidic immunoblot resolved the three targets, with molecular masses of 37, 38, and 39 kDa, from intact morula without chemical stripping and reprobing of the gel (fig. S1B). The observed log-linear relationship between molecular mass and migration distance distinguishes target protein bands from nonspecific antibody signal and demonstrates that single-morula PAGE resolves protein targets with molecular mass as close as 1 to 2 kDa. Electromigration of protein targets with known molecular mass displays an expected log-linear relationship across a wide molecular mass range (from 50 to 100 kDa; fig. S5). As with slab-gel SDS-PAGE, membrane proteins are known to be difficult to size accurately, and the same behavior is expected with single-cell protein electrophoresis (58).
Validation of biological variation detection in dissociated versus intact embryo immunoblotting
Given our ability to immunoblot dissociated blastomeres, we examined (i) if embryo dissociation artificially alters the protein abundance of the whole embryo and (ii) if we can reconstruct the expression profile of the whole embryo, even when constituent blastomeres are individually assayed. We first inquired if loading a predetermined increase in protein in the microfluidic immunoblot would yield a concomitant increase in protein signal. We, thus, performed titrations where we controlled loaded protein by using individual blastomeres from dissociated four-cell embryos (2.0 dpc) as discrete and easily manipulable loads of protein. We loaded either one or two blastomeres into microwells and assayed the microwell lysate for β-tubulin (fig. S1C). We observed an increase in β-tubulin expression [area under the curve signal (AUC)] from microwells loaded with two blastomeres as compared with microwells loaded with one blastomere (Mann-Whitney U Test, P = 6.28 × 10⁻⁵, with n = 7 and 11 microwells, respectively; fig. S1C). The observation corroborates the supposition that two blastomeres would contain twofold more protein than a single blastomere.
To assess if the protein profile of a whole embryo could be reconstructed from immunoblots of individual, dissociated blastomeres, to rule out the concern of material loss during disaggregation, lysis, or electrophoresis. To do so, we simultaneously assayed (i) intact four-cell embryos and (ii) blastomeres from dissociated four-cell embryos (each blastomere contained in a separate microwell) (fig. S1D). We observed that protein bands for whole embryos had larger peak dispersion than protein bands for dissociated blastomeres, where we attribute the larger peak dispersion from whole embryos to the four-fold larger starting sample mass than in dissociated blastomeres. All protein peaks passed the quality control metrics of SNRs above the threshold of 3 and Gaussian fit with R2 > 0.8. (fig. S1D). The resulting AUCs for β-tubulin were normalized to the summed immunoblot signal from the four dissociated blastomeres (fig. S1D). While the interembryonic variation showed an average embryo-to-embryo variation in total β-tubulin of 8%, we observed no significant difference between the sum of the contributions of dissociated blastomeres and signal obtained from a four-cell embryo (Wilcoxon matched-pairs signed rank test, P = 0.5, n = 3 independent experiments) (fig. S1D). For all dissociated four-cell embryos studied, the interblastomeric β-tubulin expression CV exceeded the technical variation threshold (CVs = 8.3, 19.6, and 11.3% for embryos; fig. S1D). We observed similar results with additional protein markers β-actin and GADD45a (fig. S1E). These results suggest that immunoblotting of individual blastomeres can reconstruct the protein profile of the originating intact four-cell embryo.
Determination of immunoblotting technical variation
To assess if the source of the observed interblastomeric variation in β-tubulin AUC was attributable to biological variation or confounding technical variation, we first sought to deconvolve sources of variation arising from preparatory steps (e.g., cell lysis) from those arising from analytical steps (e.g., PAGE, photoblotting, and immunoprobing). Variation in measured protein expression levels originates from biological sources, technical sources, or a combination. In the analytical steps, the sources of variation are predominantly technical. Consequently, to estimate the technical variation threshold for these downstream analytical steps, we used a well-characterized method using purified proteins (20, 21) (bead-based delivery of protein ladders is also possible (59)) that allows us to establish a technical variation threshold by quantifying immunoblots of microwells uniformly loaded with purified protein. Given that endogenous loading control protein targets (i) show significant cell-to-cell variation (60) or (ii) form dimers that are difficult to solubilize (61), we utilize purified protein to estimate technical variation as we have previously reported (62). Briefly, we partitioned a solution of purified bovine serum albumin (BSA) (1 μM in PBS) into the microwells by incubating PA gels in BSA solution for 30 min. We then performed the immunoblotting assay and quantified the AUC for each BSA protein band. We calculated the coefficient of variation in BSA AUC (CVAUC % = AUC SD/mean AUC × 100) and computed a technical variation threshold defined as >3 × SD of the mean CVAUC (CVthreshold = mean CVAUC + 3 SD = 7.4%, where mean CVAUC = 4.69% and SD = 0.92%; fig. S6) (62) .
In single-cell resolution assays, sources of variation in cell preparatory steps become nuanced. Cell lysis is the dominant preparatory step for the single-cell immunoblot, and lysis behavior is influenced by the biochemical (e.g., fluidity or membrane composition (63)) and biomechanical (e.g., changes in viscoelasticity (64)) properties of each cell, which can vary extensively in embryos (64). Consequently, given the established link between cellular properties and cellular lysis behavior, we primarily attribute variation in cell lysis behavior to biological sources. As such, including cell lysis variability in estimates of the technical variation threshold is likely to be overly conservative. Nevertheless, a more conservative technical variation threshold, at 11%, can be estimated when the impact of variable lysis behavior is included in protein expression variation of an enhanced green fluorescent protein–expressing cell line (62). When comparing the intraembryonic variation in β-tubulin expression to the conservative average coefficient of variation of 11% (includes variation from cell lysis, which is arguably biological in origin), we observe a majority of embryos having variation larger than the threshold value (two of three embryos, n = 4 blastomeres per embryo; fig. S1D).
Determination of mRNA technical variation threshold
mRNA was extracted from mouse embryonic stem (ES) cells using TRIzol reagent, as per the manufacturer’s instruction. mRNA was titrated to the expected mRNA content of embryos with low, medium, and high mRNA content (0.05, 0.4, and 1 ng per reaction, corresponding to two-cell embryos, oocytes, and blastocysts, respectively). Samples were processed as described and analyzed by RT-qPCR for β-actin, with 24 replicates per concentration. CT values were calculated from amplification curves. The technical variation threshold CVCT tech threshold was computed as the average CVCT plus three SDs for a 99% confidence interval (CVCT tech threshold = 0.77%; fig. S3).
Image processing, signal quantification, and statistical analysis
The datasets generated and analyzed during this study are available from the corresponding author on reasonable request. Statistical tests were performed using GraphPad Prism 7.0b and MATLAB (R2017a, MathWorks). Quantification of fluorescence signal of protein immunoblots used in-house scripts written in MATLAB (R2017a, MathWorks) (62). Briefly, Gaussian curves were fit to protein band fluorescence intensity profiles using MATLAB’s Curve Fitting Toolbox. Gaussian fit parameters of protein peak location and σ were used to compute AUC by integrating the fluorescence intensity profile for the peak width, defined as 4σ. We applied quality control metrics during quantification and identification of protein target peaks: (i) SNRs above the threshold of 3 and (ii) Gaussian fit with R2 > 0.7. For assays exhibiting immunoreactivity on the perimeter of the microwell, we classified lysis as sufficient, if we observed that (i) all antibodies probed showed the same immunoreactivity and that (ii) all protein peaks passed the aforementioned quality control metrics.
Fiji (ImageJ) was used to false color fluorescence micrographs and overlay channels to create composite images. ImageJ was used to compute cell volume (65). Briefly, cell boundaries were traced using the freehand selection tool. We first computed cell diameter (ϕ) from traced area, followed by cell volume from cell diameter. For figures requiring stringent single-cell microwell occupancies, given the spherical shape of dissociated blastomeres (8), we excluded area traces with circularity factor of <0.8.
Supplementary Material
Acknowledgments
We acknowledge members and alumni of the Herr Lab for discussions. Partial infrastructure support was provided by the QB3 Biomolecular Nanofabrication Center. This research was performed under a National Institutes of Health Training Grant awarded to the UCB/USCF Graduate Program in Bioengineering (5T32GM008155-29 to E.R.-C. and A.G.), a California Institute for Regenerative Medicine Predoctoral Fellowship (to E.R.-C.), an Obra Social “la Caixa” Fellowship (to E.R.-C.), a University of California, Berkeley Siebel Scholarship (to E.R.-C.), a National Defense Science and Engineering Graduate Fellowship (to A.G.), a National Science Foundation CAREER Award (CBET-1056035 to A.E.H.), National Institutes of Health grants (R01CA203018 to A.E.H.; R01GM114414, R01CA139067, and R21HD088885 to L.H.), a Howard Hughes Medical Institute (55108532 HHMI) Faculty Scholar Award (to L.H.), a Bakar Fellow Award at UC Berkeley (to L.H.), a Research Scholar Award from the American Cancer Society (to L.H.), an F32 Postdoctoral Fellowship from the National Institutes of Health (CA192636-03 to A.J.M.), and a K99 Career Transition Award from the National Institutes of Health (K99-HHD096108-01 to A.J.M.). Author contributions: E.R.-C. conceived the original idea for the development of the same-embryo mRNA and immunoblotting assay. E.R.C., A.J.M., A.G., A.E.H, and L.H. conceived experiments. E.R.-C. performed immunoblotting experiments and analyzed immunoblotting data. A.J.M. collected, cultured, and handled mouse embryos, performed RT-qPCR experiments, and analyzed RT-qPCR data. A.G. performed immunoblotting experiments and analyzed immunoblotting data for validation studies. All authors wrote the manuscript. Competing interests: The authors declare the following competing financial interest: authors are inventors on pending patents related to same-cell nucleic acid and immunoblotting assays. Data and materials availability: All data needed to evaluate the conclusions in the paper are present in the paper and/or the Supplementary Materials. Additional data related to this paper may be requested from the authors.
SUPPLEMENTARY MATERIALS
Supplementary material for this article is available at http://advances.sciencemag.org/cgi/content/full/6/17/eaay1751/DC1
REFERENCES AND NOTES
- 1.Motosugi N., Bauer T., Polanski Z., Solter D., Hiiragi T., Polarity of the mouse embryo is established at blastocyst and is not prepatterned. Genes Dev. 19, 1081–1092 (2005). [DOI] [PMC free article] [PubMed] [Google Scholar]
- 2.Fujimori T., Kurotaki Y., Miyazaki J.-I., Nabeshima Y.-I., Analysis of cell lineage in two- and four-cell mouse embryos. Development 130, 5113–5122 (2003). [DOI] [PubMed] [Google Scholar]
- 3.Biase F. H., Cao X., Zhong S., Cell fate inclination within 2-cell and 4-cell mouse embryos revealed by single-cell RNA sequencing. Genome Res. 24, 1787–1796 (2014). [DOI] [PMC free article] [PubMed] [Google Scholar]
- 4.Brown C. E., et al. , Genetic programs in human and mouse early embryos revealed by single-cell RNA sequencing. Nature 500, 4062–4072 (2016). [DOI] [PMC free article] [PubMed] [Google Scholar]
- 5.Torres-Padilla M.-E., Parfitt D.-E., Kouzarides T., Zernicka-Goetz M., Histone arginine methylation regulates pluripotency in the early mouse embryo. Nature 445, 214–218 (2007). [DOI] [PMC free article] [PubMed] [Google Scholar]
- 6.Bischoff M., Parfitt D.-E., Zernicka-Goetz M., Formation of the embryonic-abembryonic axis of the mouse blastocyst: Relationships between orientation of early cleavage divisions and pattern of symmetric/asymmetric divisions. Development 135, 953–962 (2008). [DOI] [PMC free article] [PubMed] [Google Scholar]
- 7.White M. D., Angiolini J. F., Alvarez Y. D., Kaur G., Zhao Z. W., Mocskos E., Bruno L., Bissiere S., Levi V., Plachta N., Long-lived binding of sox2 to DNA predicts cell fate in the four-cell mouse embryo. Cell 165, 75–87 (2016). [DOI] [PubMed] [Google Scholar]
- 8.Casser E., Israel S., Witten A., Schulte K., Schlatt S., Nordhoff V., Boiani M., Totipotency segregates between the sister blastomeres of two-cell stage mouse embryos. Sci. Rep. 7, 1–15 (2017). [DOI] [PMC free article] [PubMed] [Google Scholar]
- 9.Plachta N., Bollenbach T., Pease S., Fraser S. E., Pantazis P., Oct4 kinetics predict cell lineage patterning in the early mammalian embryo. Nat. Cell Biol. 13, 117–123 (2011). [DOI] [PubMed] [Google Scholar]
- 10.Shi J., Chen Q., Li X., Zheng X., Zhang Y., Qiao J., Tang F., Tao Y., Zhou Q., Duan E., Dynamic transcriptional symmetry-breaking in pre-implantation mammalian embryo development revealed by single-cell RNA-seq. Development 142, 3468–3477 (2015). [DOI] [PubMed] [Google Scholar]
- 11.Nothias J. Y., Miranda M., DePamphilis M. L., Uncoupling of transcription and translation during zygotic gene activation in the mouse. EMBO J. 15, 5715–5725 (1996). [PMC free article] [PubMed] [Google Scholar]
- 12.Bordeaux J., Welsh A. W., Agarwal S., Killiam E., Baquero M. T., Hanna J. A., Anagnostou V. K., Rimm D. L., Antibody validation. Biotechniques 48, 197–209 (2010). [DOI] [PMC free article] [PubMed] [Google Scholar]
- 13.Trenchevska O., Nelson R. W., Nedelkov D., Mass spectrometric immunoassays for discovery, screening and quantification of clinically relevant proteoforms. Bioanalysis 8, 1623–1633 (2016). [DOI] [PMC free article] [PubMed] [Google Scholar]
- 14.Schnell U., Dijk F., Sjollema K. A., Giepmans B. N. G., Immunolabeling artifacts and the need for live-cell imaging. Nat. Methods 9, 152–158 (2012). [DOI] [PubMed] [Google Scholar]
- 15.Teves S. S., An L., Hansen A. S., Xie L., Darzacq X., Tjian R., A dynamic mode of mitotic bookmarking by transcription factors. eLife 5, e22280 (2016). [DOI] [PMC free article] [PubMed] [Google Scholar]
- 16.Zhu Y., Piehowski P. D., Zhao R., Chen J., Shen Y., Moore R. J., Shukla A. K., Petyuk V. A., Campbell-Thompson M., Mathews C. E., Smith R. D., Qian W.-J., Kelly R. T., Nanodroplet processing platform for deep and quantitative proteome profiling of 10-100 mammalian cells. Nat. Commun. 9, 882 (2018). [DOI] [PMC free article] [PubMed] [Google Scholar]
- 17.Zhu Y., Clair G., Chrisler W. B., Shen Y., Zhao R., Shukla A. K., Moore R. J., Misra R. S., Pryhuber G. S., Smith R. D., Ansong C., Kelly R. T., Proteomic analysis of single mammalian cells enabled by microfluidic nanodroplet sample preparation and ultrasensitive nanoLC-MS. Angew. Chemie Int. Ed. Engl. 57, 12370–12374 (2018). [DOI] [PMC free article] [PubMed] [Google Scholar]
- 18.Budnik B., Levy E., Harmange G., Slavov N., SCoPE-MS: Mass-spectrometry of single mammalian cells quantifies proteome heterogeneity during cell differentiation. Genome Biol. 19, 161 (2018). [DOI] [PMC free article] [PubMed] [Google Scholar]
- 19.Specht H., Slavov N., Transformative opportunities for single-cell proteomics. J. Proteome Res. 17, 2562–2571 (2018). [DOI] [PMC free article] [PubMed] [Google Scholar]
- 20.Hughes A. J., Spelke D. P., Xu Z., Kang C.-C., Schaffer D. V., Herr A. E., Single-cell Western blotting. Nat. Methods 11, 749–755 (2014). [DOI] [PMC free article] [PubMed] [Google Scholar]
- 21.Kang C.-C., Yamauchi K. A., Vlassakis J., Sinkala E., Duncombe T. A., Herr A. E., Single cell–resolution Western blotting. Nat. Protoc. 11, 1508–1530 (2016). [DOI] [PMC free article] [PubMed] [Google Scholar]
- 22.Kang C.-C., Lin J.-M. G., Xu Z., Kumar S., Herr A. E., Single-cell western blotting after whole-cell imaging to assess cancer chemotherapeutic response. Anal. Chem. 86, 10429–10436 (2014). [DOI] [PMC free article] [PubMed] [Google Scholar]
- 23.Kim J. J., Sinkala E., Herr A. E., High-selectivity cytology via lab-on-a-disc Western blotting of individual cells. Lab Chip 17, 855–863 (2017). [DOI] [PMC free article] [PubMed] [Google Scholar]
- 24.Yamauchi K. A., Herr A. E., Subcellular Western blotting of single cells. Microsyst. Nanoeng. 3, 16079 (2017). [DOI] [PMC free article] [PubMed] [Google Scholar]
- 25.Tsichlaki E., Fitzharris G., Nucleus downscaling in mouse embryos is regulated by cooperative developmental and geometric programs. Sci. Rep. 6, 28040 (2016). [DOI] [PMC free article] [PubMed] [Google Scholar]
- 26.Epifano O., Liang L. F., Familari M., Moos Jr M. C., Dean J., Coordinate expression of the three zona pellucida genes during mouse oogenesis. Development 121, 1947–1956 (1995). [DOI] [PubMed] [Google Scholar]
- 27.Martín-Coello J., González R., Crespo C., Gomendio M., Roldan E. R. S., Superovulation and in vitro oocyte maturation in three species of mice (Mus musculus, Mus spretus, and Mus spicilegus). Theriogenology 70, 1004–1013 (2008). [DOI] [PubMed] [Google Scholar]
- 28.P. Marangos, Preparation of Cell Lysate from Mouse Oocytes for Western Blotting Analysis. in Oogenesis: Methods and Protocols, I. P. Nezis, Ed. (Springer New York, 2016), pp. 209–215. [DOI] [PubMed] [Google Scholar]
- 29.Tang F., Barbacioru C., Nordman E., Li B., Xu N., Bashkirov V. I., Lao K., Surani M. A., RNA-Seq analysis to capture the transcriptome landscape of a single cell. Nat. Protoc. 5, 516–535 (2010). [DOI] [PMC free article] [PubMed] [Google Scholar]
- 30.Darmanis S., Gallant C. J., Marinescu V. D., Niklasson M., Segerman A., Flamourakis G., Fredriksson S., Assarsson E., Lundberg M., Nelander S., Westermark B., Landegren U., Simultaneous multiplexed measurement of RNA and proteins in single cells. Cell Rep. 14, 380–389 (2016). [DOI] [PMC free article] [PubMed] [Google Scholar]
- 31.Nicolet B. P., Guislain A., Wolkers M. C., Combined single-cell measurement of cytokine mRNA and protein identifies T cells with persistent effector function. J. Immunol. 198, 962–970 (2017). [DOI] [PubMed] [Google Scholar]
- 32.Eliscovich C., Shenoy S., H. Singer R., Imaging mRNA and protein interactions within neurons. Proc. Natl. Acad. Sci. U.S.A. 114, E1875–E1884 (2017). [DOI] [PMC free article] [PubMed] [Google Scholar]
- 33.Frei A. P., Bava F.-A., Zunder E. R., Hsieh E. W. Y., Chen S.-Y., Nolan G. P., Gherardini P. F., Highly multiplexed simultaneous detection of RNAs and proteins in single cells. Nat. Methods 3, 269–275 (2016). [DOI] [PMC free article] [PubMed] [Google Scholar]
- 34.Peterson V. M., Zhang K. X., Kumar N., Wong J., Li L., Wilson D. C., Moore R., Clanahan T. K. M., Sadekova S., Klappenbach J. A., Multiplexed quantification of proteins and transcripts in single cells. Nat. Biotechnol. 35, 936–939 (2017). [DOI] [PubMed] [Google Scholar]
- 35.Zabzdyr J. L., Lillard S. J., Electrophoretic profiling of both RNA and protein from a single 250-pL sample. Anal. Chem. 74, 1857–1862 (2002). [DOI] [PubMed] [Google Scholar]
- 36.Tadros W., Lipshitz H. D., The maternal-to-zygotic transition: A play in two acts. Development 136, 3033–3042 (2009). [DOI] [PubMed] [Google Scholar]
- 37.Lee M. T., Bonneau A. R., Giraldez A. J., Zygotic genome activation during the maternal-to-zygotic transition. Annu. Rev. Cell Dev. Biol. 30, 581–613 (2014). [DOI] [PMC free article] [PubMed] [Google Scholar]
- 38.Mozziconacci J., Sandblad L., Wachsmuth M., Brunner D., Karsenti E., Tubulin dimers oligomerize before their incorporation into microtubules. PLOS ONE 3, e3821 (2008). [DOI] [PMC free article] [PubMed] [Google Scholar]
- 39.Morris S. A., Guo Y., Zernicka-Goetz M., Developmental plasticity is bound by pluripotency and the Fgf and Wnt signaling pathways. Cell Rep. 2, 756–765 (2012). [DOI] [PMC free article] [PubMed] [Google Scholar]
- 40.Wang E. T., Sandberg R., Luo S., Khrebtukova I., Zhang L., Mayr C., Kingsmore S. F., Schroth G. P., Burge C. B., Alternative isoform regulation in human tissue transcriptomes. Nature 456, 470–476 (2008). [DOI] [PMC free article] [PubMed] [Google Scholar]
- 41.Gao Y., Liu X., Tang B., Li C., Kou Z., Li L., Liu W., Wu Y., Kou X., Li J., Zhao Y., Yin J., Wang H., Chen S., Liao L., Gao S., Protein expression landscape of mouse embryos during preimplantation development. Cell Rep. 21, 3957–3969 (2017). [DOI] [PubMed] [Google Scholar]
- 42.Flemr M., Malik R., Franke V., Nejepinska J., Sedlacek R., Vlahovicek K., Svoboda P., A retrotransposon-driven dicer isoform directs endogenous small interfering rna production in mouse oocytes. Cell 155, 807–816 (2013). [DOI] [PubMed] [Google Scholar]
- 43.Suwińska A., Czołowska R., Ozdzeński W., Tarkowski A. K., Blastomeres of the mouse embryo lose totipotency after the fifth cleavage division: Expression of Cdx2 and Oct4 and developmental potential of inner and outer blastomeres of 16- and 32-cell embryos. Dev. Biol. 322, 133–144 (2008). [DOI] [PubMed] [Google Scholar]
- 44.Chazaud C., Yamanaka Y., Lineage specification in the mouse preimplantation embryo. Development 143, 1063–1074 (2016). [DOI] [PubMed] [Google Scholar]
- 45.Padovan-Merhar O., Nair G. P., Biaesch A. G., Mayer A., Scarfone S., Foley S. W., Wu A. R., Churchman L. S., Singh A., Raj A., Single mammalian cells compensate for differences in cellular volume and DNA copy number through independent global transcriptional mechanisms. Mol. Cell 58, 339–352 (2015). [DOI] [PMC free article] [PubMed] [Google Scholar]
- 46.Jeong J.-K., Kang M.-H., Gurunathan S., Cho S.-G., Park C., Seo H. G., Kim J.-H., Evaluation of reference genes in mouse preimplantation embryos for gene expression studies using real-time quantitative RT-PCR (RT-qPCR). BMC. Res. Notes 7, 675 (2014). [DOI] [PMC free article] [PubMed] [Google Scholar]
- 47.Wicklow E., Blij S., Frum T., Hirate Y., Lang R. A., Sasaki H., Ralston A., HIPPO pathway members restrict SOX2 to the inner cell mass where it promotes ICM fates in the mouse blastocyst. PLOS Genet. 10, e1004618 (2014). [DOI] [PMC free article] [PubMed] [Google Scholar]
- 48.Ziomek C. A., Johnson M. H., Handyside A. H., The developmental potential of mouse 16-cell blastomeres. J. Exp. Zool. 221, 345–355 (1982). [DOI] [PubMed] [Google Scholar]
- 49.Zhang J. Y., Diao Y. F., Kim H. R., Jin II D., Inhibition of endoplasmic reticulum stress improves mouse embryo development. PLOS ONE 7, e53502 (2012). [DOI] [PMC free article] [PubMed] [Google Scholar]
- 50.Grindberg R. V., Yee-Greenbaum J. L., McConnell M. J., Novotny M., O'Shaughnessy A. L., Lambert G. M., Araúzo-Bravo M. J., Lee J., Fishman M., Robbins G. E., Lin X., Venepally P., Badger J. H., Galbraith D. W., Gage F. H., Lasken R. S., RNA-sequencing from single nuclei. Proc. Natl. Acad. Sci. U.S.A. 110, 19802–19807 (2013). [DOI] [PMC free article] [PubMed] [Google Scholar]
- 51.Abdelmoez M. N., Iida K., Oguchi Y., Nishikii H., Yokokawa R., Kotera H., Uemura S., Santiago J. G., Shintaku H., SINC-seq: Correlation of transient gene expressions between nucleus and cytoplasm reflects single-cell physiology. Genome Biol. 19, 66 (2018). [DOI] [PMC free article] [PubMed] [Google Scholar]
- 52.Schultz R. M., Regulation of zygotic gene activation in the mouse. Bioessays 15, 531–538 (1993). [DOI] [PubMed] [Google Scholar]
- 53.Simon A., Laufer N., Assessment and treatment of repeated implantation failure (RIF). J. Assist. Reprod. Genet. 29, 1227–1239 (2012). [DOI] [PMC free article] [PubMed] [Google Scholar]
- 54.Lee H., Kim J.-S., Unexpected CRISPR on-target effects. Nat. Biotechnol. 36, 703–704 (2018). [DOI] [PubMed] [Google Scholar]
- 55.Hughes A. J., Lin R. K. C., Peehl D. M., Herr A. E., Microfluidic integration for automated targeted proteomic assays. Proc. Natl. Acad. Sci. U.S.A. 109, 5972–5977 (2012). [DOI] [PMC free article] [PubMed] [Google Scholar]
- 56.Strumpf D., Mao C.-A., Yamanaka Y., Ralston A., Chawengsaksophak K., Beck F., Rossant J., Cdx2 is required for correct cell fate specification and differentiation of trophectoderm in the mouse blastocyst. Development 132, 2093–2102 (2005). [DOI] [PubMed] [Google Scholar]
- 57.Zhang S., Cui W., Sox2, a key factor in the regulation of pluripotency and neural differentiation. World J. Stem Cells 6, 305–311 (2014). [DOI] [PMC free article] [PubMed] [Google Scholar]
- 58.Rath A., Glibowicka M., Nadeau V. G., Chen G., Deber C. M., Detergent binding explains anomalous SDS-PAGE migration of membrane proteins. Proc. Natl. Acad. Sci. U.S.A. 106, 1760–1765 (2009). [DOI] [PMC free article] [PubMed] [Google Scholar]
- 59.Kim J. J., Chan P. P. Y., Vlassakis J., Geldert A., Herr A. E., Microparticle delivery of protein markers for single-cell western blotting from microwells. Small 14, e1802865 (2018). [DOI] [PMC free article] [PubMed] [Google Scholar]
- 60.Eaton S. L., Roche S. L., Hurtado M. L., Oldknow K. J., Farquharson C., Gillingwater T. H., Wishart T. M., Total protein analysis as a reliable loading control for quantitative fluorescent western blotting. PLOS ONE 8, e72457 (2013). [DOI] [PMC free article] [PubMed] [Google Scholar]
- 61.Qvit N., Joshi A. U., Cunningham A. D., Ferreira J. C. B., Mochly-Rosen D., Glyceraldehyde-3-phosphate dehydrogenase (GAPDH) protein-protein interaction inhibitor reveals a non-catalytic role for GAPDH oligomerization in cell death. J. Biol. Chem. 291, 13608–13621 (2016). [DOI] [PMC free article] [PubMed] [Google Scholar]
- 62.Sinkala E., Sollier-Christen E., Renier C., Rosàs-Canyelles E., Che J., Heirich K., Duncombe T. A., Vlassakis J., Yamauchi K. A., Huang H., Jeffrey S. S., Herr A. E., Profiling protein expression in circulating tumour cells using microfluidic western blotting. Nat. Commun. 8, 14622 (2017). [DOI] [PMC free article] [PubMed] [Google Scholar]
- 63.Brown R. B., Audet J., Current techniques for single-cell lysis. J. R. Soc. Interface 5, S131–S138 (2008). [DOI] [PMC free article] [PubMed] [Google Scholar]
- 64.Kort J., Behr B., Biomechanics and developmental potential of oocytes and embryos. Fertil. Steril. 108, 738–741 (2017). [DOI] [PubMed] [Google Scholar]
- 65.Johnson D. E., Ostrowski P., Jaumouillé V., Grinstein S., The position of lysosomes within the cell determines their luminal pH. J. Cell Biol. 212, 677–692 (2016). [DOI] [PMC free article] [PubMed] [Google Scholar]
Associated Data
This section collects any data citations, data availability statements, or supplementary materials included in this article.
Supplementary Materials
Supplementary material for this article is available at http://advances.sciencemag.org/cgi/content/full/6/17/eaay1751/DC1