Abstract
Adrenocortical carcinoma (ACC), a rare malignant neoplasm originating from adrenal cortical cells, has high malignancy and few treatments. Therefore, it is necessary to explore the molecular mechanism of tumorigenesis, screen and verify potential biomarkers, which will provide new clues for the treatment and diagnosis of ACC. In this paper, three gene expression profiles (GSE10927, GSE12368 and GSE90713) were downloaded from the Gene Expression Omnibus (GEO) database. Differentially expressed genes (DEGs) were obtained using the Limma package. Gene ontology (GO) and Kyoto Encyclopedia of Genes and Genomes (KEGG) pathways were enriched by DAVID. Protein‐protein interaction (PPI) network was evaluated by STRING database, and PPI network was constructed by Cytoscape. Finally, GEPIA was used to validate hub genes’ expression. Compared with normal adrenal tissues, 74 up‐regulated DEGs and 126 down‐regulated DEGs were found in ACC samples; GO analysis showed that up‐regulated DEGs were enriched in organelle fission, nuclear division, spindle, et al, while down‐regulated DEGs were enriched in angiogenesis, proteinaceous extracellular matrix and growth factor activity; KEGG pathway analysis showed that up‐regulated DEGs were significantly enriched in cell cycle, cellular senescence and progesterone‐mediated oocyte maturation; Nine hub genes (CCNB1, CDK1, TOP2A, CCNA2, CDKN3, MAD2L1, RACGAP1, BUB1 and CCNB2) were identified by PPI network; ACC patients with high expression of 9 hub genes were all associated with worse overall survival (OS). These hub genes and pathways might be involved in the tumorigenesis, which will offer the opportunities to develop the new therapeutic targets of ACC.
Keywords: adrenocortical carcinoma, Gene Expression Omnibus, GEPIA, overall survival, prognostic
1. INTRODUCTION
Adrenal gland is an important endocrine organ of the human body and is also one of the most common organs with high tumour metastasis rate. According to the latest edition of pathological and genetic classification criteria of adrenal tumours published by World Health Organization (WHO), adrenal tumours can be divided into five categories: adrenocortical tumour, adrenal medullary tumour, extra‐adrenal paraganglioma, secondary tumour and other adrenal tumour.1 Adrenocortical tumour mainly includes adrenocortical adenoma (ACA) and adrenocortical carcinoma (ACC).2 ACC is a rare malignant tumour originating from adrenal cortical cells,3 and its incidence ranges from 0.7/10 00 000 to 2.0/10 00 000, which is under a high degree of malignancy, aggressiveness, high recurrence rate and poor prognosis. Most of the patients are found to have metastases and relapse easily after treatment, and the overall 5‐year survival rate was <35%.4 Early and accurate diagnosis is particularly important for the treatment and prognosis of ACC.5 At present, surgical resection is the only feasible method to cure ACC, but it is difficult to control its quality.6 Therefore, identifying new therapeutic targets or biomarkers for prognosis, diagnosis or prediction of ACC is urgently needed.
In recently years, many microarray profiling studies have been performed in ACC,7, 8 and hundreds of differentially expressed genes (DEGs) have been obtained. However, the results are limited or inconsistent due to molecular heterogeneity, and the results are usually generated from a single cohort study. Until now, no reliable biomarkers have been used in ACC clinics. Hence, the bioinformatics methods integrating multi‐cohorts analysed by gene microarray or RNAseq will be innovative and valuable for ACC research.
In this work, we downloaded three different Gene Expression Omnibus (GEO) datasets (GSE10927, GSE12368 and GSE90713) and screened differentially DEGs using the Limma package. Then, the PPI network in STRING database was constructed to screen the hub genes and pathways, and GEPIA database was used to verify hub genes and potential pathways. This study will offer the opportunities to develop the new therapeutic targets of ACC.
2. MATERIALS AND METHODS
The flow diagram of this study was shown in Figure 1. The raw expression data were operated through a series of databases and software. This study has been proved by the Henan University institutional committee.
Figure 1.
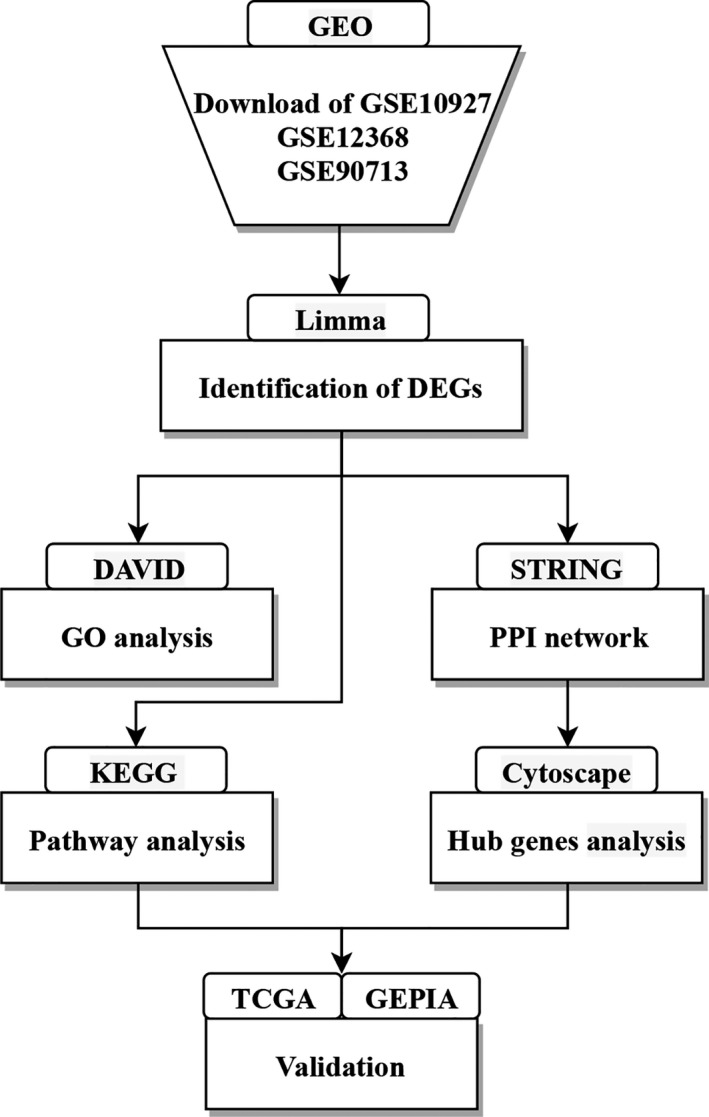
The flow diagram of this study
2.1. Data collection
Gene expression profiles of GSE10927,9 GSE1236810 and GSE9071311 were obtained from GEO database. The GSE10927 dataset includes 55 neoplastic samples and 10 non‐neoplastic samples (33 cases of ACC, 22 cases of ACA and 10 cases of normal adrenal cortex). The GSE12368 dataset is composed of 28 neoplastic samples and 6 non‐neoplastic samples (12 cases of ACC, 16 cases of ACA and 6 cases of normal adrenal cortex). The GSE90713 dataset includes 58 neoplastic samples and 5 non‐neoplastic samples (58 cases of ACC and 5 cases of normal adrenal cortex).
2.2. Screening differentially expressed genes
DEGs between ACC samples and non‐neoplastic samples were screened by using Limma package based on R language. DEGs were defined as representing differences with |log2FC| > 1, P < .05.12
2.3. Gene ontology and KEGG pathway enrichment analysis of DEGs
Gene ontology (GO) analysis annotates genes and gene products with functions of molecular function (MF), biological process (BP) and cellular component (CC).13, 14 Kyoto Encyclopedia of Genes and Genomes (KEGG) includes a series of genomics and enzymology methods and an online database of biochemical energy.15 The Database for Annotation, Visualization and Integrated Discovery (DAVID) (https://david.ncifcrf.gov/) is an online program providing a comprehensive set of functional annotation tools for investigators to understand biological meaning behind large list of genes.16 We performed GO terms and KEGG pathway analysis of DEGs by using DAVID database.
2.4. PPI network construction and hub module selection
Search Tool for the Retrieval of Interacting Genes (STRING) database (http://www.string-db.org/) was used to evaluate protein‐protein interaction (PPI).17 In addition, the database was used to quantify the relationships among the DEGs. Then, we used Cytoscape software to construct PPI network.18 The genes with the highest node score and the strongest connectivity were selected. P < .05 was considered to have statistical significance.
2.5. Hub genes validation
GEPIA (http://gepia.cancer-pku.cn/) is a powerful interactive web server that can analyse the RNA sequencing expression data of 9736 tumours and 8587 normal samples from the TCGA and the GTEx projects.19 GEPIA can be directly used for tumour/normal differential expression analysis according to cancer types, and the box plot will be shown to visualize the relationship. GEPIA was used to verify the hub genes and perform validation, P < .05 showed statistical significance.19
TCGA‐ACC RNA sequencing data with patient survival data were downloaded from the University of California, Santa Cruz (UCSC) Xena browser.20 Clinicopathological parameters of ACC patients with primary tumours, including age at diagnosis, gender, pathologic stage, living status, and overall survival (OS), were used for survival‐curve analysis.
2.6. Statistical analyses
Clinicopathologic parameter association analysis, and univariate and multivariate Cox regression analysis of 9 hub genes were performed with SPSS 22.0. Statistical significance was set at probability values of P < .05.
3. RESULTS
3.1. Identification of differentially expressed genes
Using P < .05 and |log2FC| > 1 as cut‐off, we identified 1040 up‐regulated and 1821 down‐regulated genes in ACCs compared with normal tissues from GSE10927 dataset (Figure S1A), 2295 up‐regulated and 3300 down‐regulated genes from GSE12368 dataset (Figure S1B), 487 up‐regulated and 1129 down‐regulated genes from GSE90713 dataset (Figure S1C). By intersecting the DEGs across three datasets, a total of 200 consistently differentially expressed genes including 74 up‐regulated and 126 down‐regulated genes were identified to be significant in all the three above gene expression profiles (Figure 2A and B). The heat map of top 20 down‐regulated genes and top 20 up‐regulated genes’ expression was shown in Figure 2C.
Figure 2.
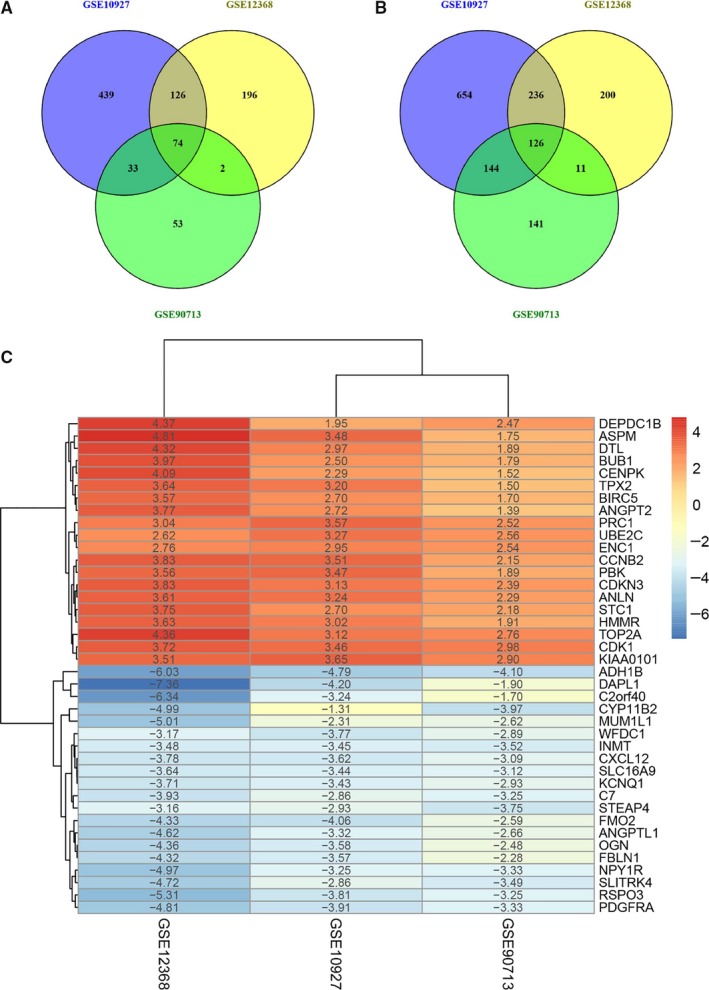
Venn diagram from intersection of differentially expressed genes (DEGs) in the three Gene Expression Omnibus (GEO) datasets and the heat map of top 40 DEGs. A, Up‐regulated genes in ACCs. B, Down‐regulated genes in ACCs. C, Heat map of top 40 representative DEGs. Blue represents a lower expression level, and red represents higher expression level
3.2. Gene ontology analysis of differentially expressed genes
Subsequently, GO analysis of up‐regulated and down‐regulated DEGs was carried out by using DAVID online analysis tool.16 In terms of biological process (BP), up‐regulated DEGs were significantly enriched organelle fission, nuclear division, mitotic nuclear division, chromosome segregation, regulation of cell cycle phase transition, regulation of mitotic cell cycle phase transition, nuclear chromosome segregation and sister chromatid segregation (Figure 3A). Down‐regulated DEGs were involved in angiogenesis, regulation of cell growth, fatty acid metabolic process, ageing, developmental maturation and protein kinase B signalling (Figure 3B). In terms of cellular component (CC), the up‐regulated DEGs were significantly enriched in spindle, condensed chromosome, chromosomal region, microtubule, chromosome and centromeric region (Figure 3C), while the down‐regulated DEGs were significantly enriched in proteinaceous extracellular matrix (Figure 3D). In terms of molecular function (MF), up‐regulated DEGs were significantly enriched in tubulin binding, microtubule binding, drug binding and cyclin‐dependent protein kinase activity (Figure 3E), while the down‐regulated DEGs were significantly enriched in growth factor activity, growth factor binding and hormone binding (Figure 3F).
Figure 3.
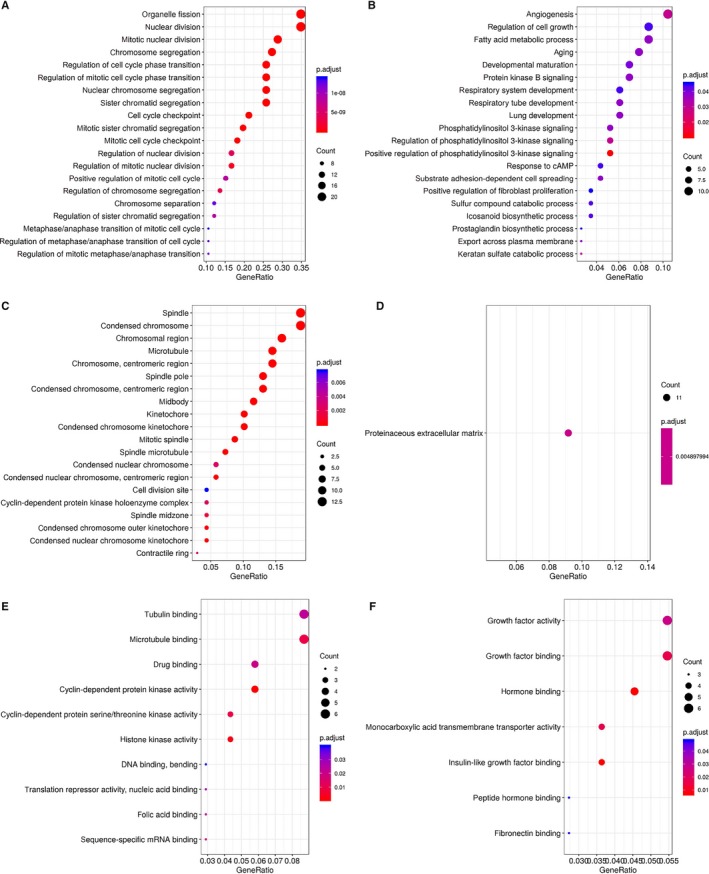
Gene ontology analysis of differentially expressed genes (DEGs) with |log2FC| > 1, P < .05. A, Biological process terms for up‐regulated DEGs. B, Biological process terms for down‐regulated DEGs. C, Cellular component terms for up‐regulated DEGs. D, Cellular component terms for down‐regulated DEGs. E, Molecular function terms for up‐regulated DEGs. F, Molecular function terms for down‐regulated DEGs
3.3. KEGG pathway enrichment analysis of differentially expressed genes
KEGG pathway analysis of all DEGs showed that most of up‐regulated DEGs were enriched in cell cycle, cell senescence, progesterone‐mediated oocyte maturation, oocyte, p53 signalling pathway and folic acid resistance (Figure 4), while down‐regulation of DEGs did not significantly enrich KEGG pathway.
Figure 4.
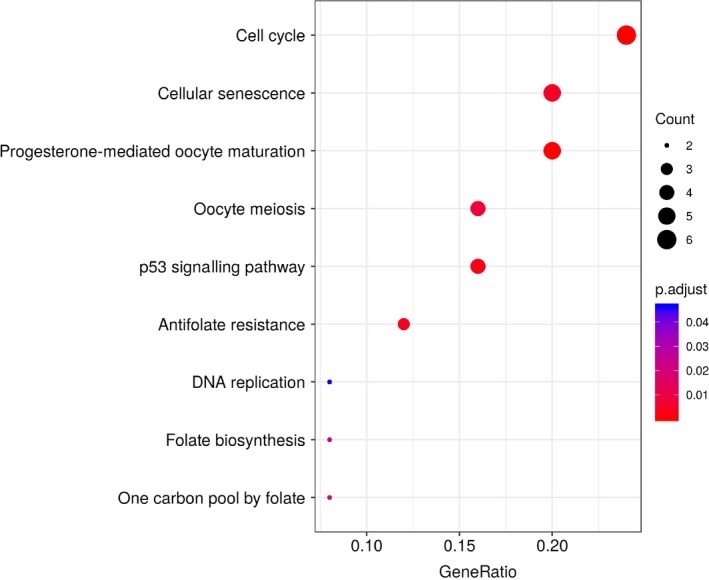
Significantly enriched pathway terms of up‐regulated differentially expressed genes in ACC
3.4. PPI network construction and hub gene selection
Through analysing STRING database17 and constructing PPI network by Cytoscape software,18 as shown in Figure 5, the PPI network of DEGs consists of 120 nodes and 1032 edges with the highest degree of 53, including 56 up‐regulated genes and 64 down‐regulated genes. It was considered that top nine DEGs with high degree of connectivity as the hub genes of ACC: CCNB1 (Cyclin B1), CDK1 (cyclin‐dependent kinase 1), TOP2A (topoisomerase IIα), CCNA2 (CyclinA2), CDKN3 (cyclin‐dependent kinase inhibitor 3), MAD2L1 (mitosis arrest‐deficient 2 like 1), RACGAP1 (Rac GTPase activating protein 1), BUB1 (benzimidazole 1 homolog beta) and CCNB2 (Cyclin B2). In terms of biological process, these hub genes are significantly enriched in mitotic spindle assembly checkpoint (Table S1). In terms of molecular function, these hub genes are significantly enriched in ATP binding (Table S1). KEGG pathway enrichment analysis showed that these hub genes are associated with progesterone‐mediated oocyte maturation, cell cycle, oocyte meiosis, p53 signalling pathway and progesterone‐mediated oocyte maturation (Table S1).
Figure 5.
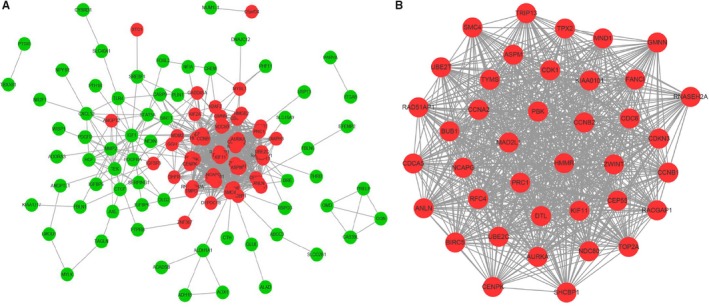
Protein‐protein interaction (PPI) network, module analysis and hub gene identification. Red nodes represent up‐regulated genes. Green nodes represent down‐regulated genes. A, PPI network of differentially expressed genes was constructed in STRING database. B, Top nine hub genes were selected by Cytoscape software based on the degree of each node
3.5. Evaluate the prognostic value of hub genes
TCGA‐ACC dataset was used to evaluate the prognostic value of nine hub genes by GEPIA. All patients with high hub gene expression were associated with worse OS (Figure 6). The additional univariate and multivariate Cox regression analysis showed that the hub gene BUB1 (budding uninhibited by benzimidazole 1) was an independent prognostic factor for ACC patients, and BUB1 was significantly associated with living status and clinical stage in TCGA data (Table 1 and Table 2). The analysis results of the remaining genes were shown in Tables S2‐S17. In addition, all nine hub genes were validated to be significantly up‐regulated in ACCs as they were in above three GEO datasets (Figure 7).
Figure 6.
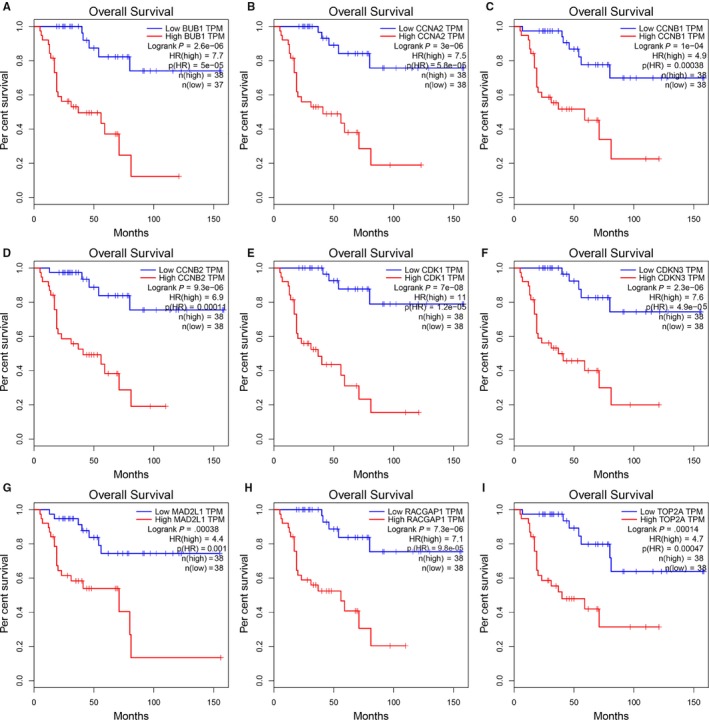
Prognostic value of 9 hub genes in ACCs by GEPIA. A, BUB1. B, CCNA2. C, CCNB1. D, CCNB2. E, CDK1. F, CDKN3. G, MAD2L1. H, RACGAP1. I, TOP2A P < .05 was as statistically significant
Table 1.
Clinicopathological parameters and BUB1 expression according to the TCGA database
| Parameters | Group | BUB1 mRNA expression | |||
|---|---|---|---|---|---|
| Low(n = 38) | High(n = 39) | X2 | P value | ||
| Age (Mean ± SD) | 46.63 ± 15.756 | 46.59 ± 16.106 | |||
| Gender | Female | 24 | 24 | 0.021 | 1.000 |
| Male | 14 | 15 | |||
| Clinical stage | Ⅰ/Ⅱ | 31 | 15 | 14.877 | .000 |
| Ⅲ/Ⅳ | 7 | 24 | |||
| Recurrence status | No | 29 | 11 | 2.363 | .188 |
| Yes | 7 | 7 | |||
| Null | 2 | 21 | |||
| Living status | Living | 34 | 16 | 19.841 | .000 |
| Dead | 4 | 23 | |||
Table 2.
Univariate and multivariate Cox regression analysis of BUB1 clinical pathologic features according to the TCGA database
|
Parameters OS |
Univariate analysis | Multivariate analysis | ||||||
|---|---|---|---|---|---|---|---|---|
| HR | 95% CI | P | HR | 95% CI | P | |||
|
Age ≥60 vs < 60 |
1.549 | 0.677 | 3.548 | .300 | 0.494 | 0.207 | 1.180 | .112 |
|
Gender Female vs Male |
0.986 | 0.451 | 2.154 | .971 | ||||
|
Clinical stage Ⅰ/Ⅱ vs Ⅲ/Ⅳ |
6.467 | 2.702 | 15.481 | .000 | 0.208 | 0.077 | 0.558 | .002 |
|
BUB1 expression Low vs High |
9.024 | 3.094 | 26.320 | .000 | 5.907 | 1.920 | 18.176 | .002 |
Figure 7.
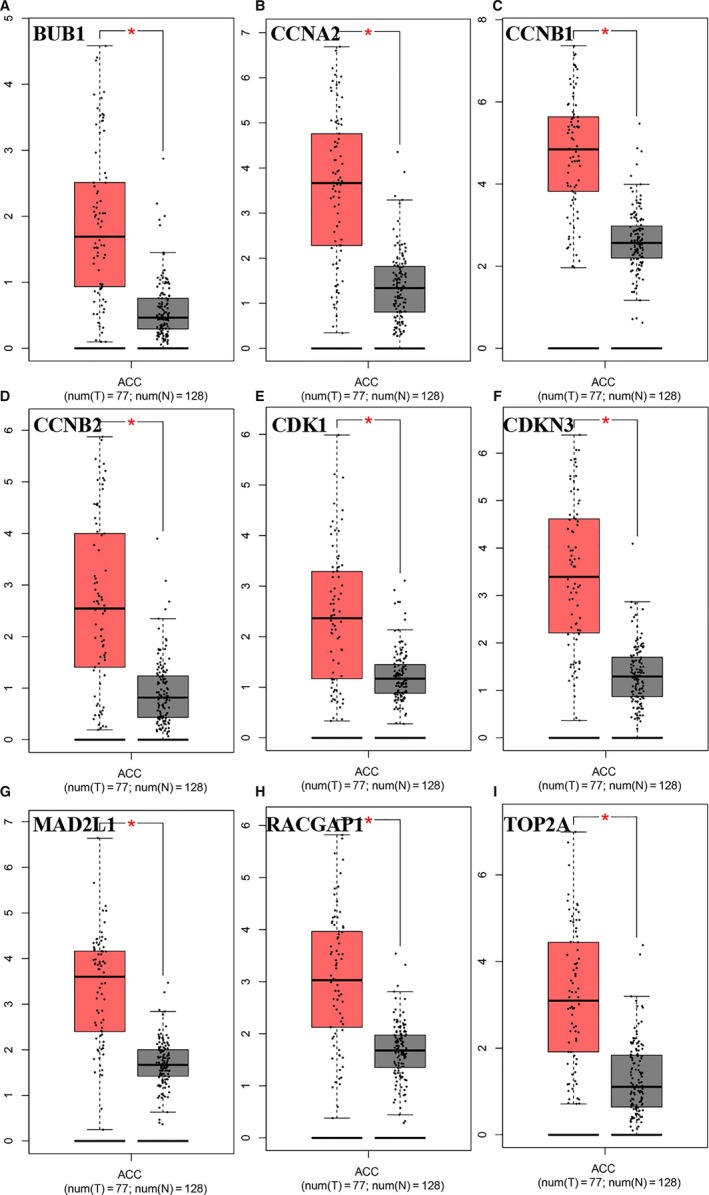
Nine hub genes are highly expressed in ACC tissues compared with normal tissues in GEPIA. The red and grey boxes represent cancer and normal tissues, respectively. A, BUB1. B, CCNA2. C, CCNB1. D, CCNB2. E, CDK1. F, CDKN3. G, MAD2L1. H, RACGAP1. I, TOP2A P < .05 was as statistically significant
4. DISCUSSION
In this study, by integrated three expression profiling datasets from GEO, we identified 200 commonly changed DEGs (74 up‐regulated and 126 down‐regulated) in ACCs. These DEGs were further analysed by GO analysis (molecular function, biological process and cellular component). In terms of biological process, the up‐regulated DEGs were mainly enriched in organelle fission and nuclear division, which were typical malignant indicators of histopathological examination. Down‐regulated DEGs were significantly enriched in angiogenesis. For example, Plk1 is closely related to a series of mitotic events such as centrosome replication, spindle formation, chromosome segregation and cytokinesis and is also related to chromosome stability.21 In addition, down‐regulated DEGs were significantly enriched in proteinaceous extracellular matrix. In terms of molecular function, up‐regulated DEGs were significantly enriched in tubulin binding and microtubule binding. It had been reported that STMN1 regulated microtubule dynamics and participates in the malignant phenotype of cancer cells.22 Down‐regulated DEGs were significantly enriched in growth factor activity and growth factor binding. Some studies have shown that the stimulation of growth factors such as insulin‐like growth factors may promote tumour proliferation.23 These results can help us to further understand the role of DEGs in the development and progress of ACC. The additional KEGG pathway analysis showed that up‐regulated DEGs were significantly enriched in cell cycle, cell senescence, progesterone‐mediated oocyte maturation, oocyte, p53 signalling pathway and folic acid resistance, further confirmed the important roles of p53 signalling pathway in ACC.24
By DEGs PPI network analysis, the hub genes with highest degree of communication were identified, and they are CCNB1, CDK1, TOP2A, CCNA2, CDKN3, MAD2L1, RACGAP1, BUB1 and CCNB2. CCNB1, a key molecule to initiate mitosis, was associated with tumorigenesis and development.25 CCNB2 can promote cell proliferation, migration and invasion in lung adenocarcinoma 26 and hepatocellular carcinoma.27 In addition, CCNB1 and CCNB2 promoted gastric cancer cell proliferation and tumour growth.28 CDK1 and TOP2A played an important role in the regulation of cell cycle and regulated the proliferation of tumours.29, 30 Glover et al found that CDK1 was up‐regulated in ACC tissues compared with normal tissues.31 TOP2A was a potential biomarker for the progression and prognosis of various tumours.32 CCNA2 was found to promote the proliferation of breast cancer.33 Xing et al found that the expression of CDKN3 was generally increased in hepatocellular carcinoma tissues and was positively correlated with the pathological stage and differentiation of the tumours.34 MAD2L1 and BUB1 were important components of mitotic checkpoint complex proteins. High expression of these two genes was related to the poor disease‐free survival of invasive tumours.35 RACGAP1 was found to be highly expressed in colorectal cancer36 and breast cancer.37
Finally, we evaluated the prognostic value of 9 hub genes by using GEPIA database and found ACC patients with high expression of 9 hub genes (CCNB1, CDK1, TOP2A, CCNA2, CDKN3, MAD2L1, RACGAP1, BUB1 and CCNB2) were significantly associated with worse OS.
In conclusion, using multiple cohort profiling datasets and integrated bioinformatics analysis, we identified hub genes and potential pathways that may be involved in the progress of ACC.
ETHICS APPROVAL AND CONSENT TO PARTICIPATE
This study has been proved by the Henan University institutional committee.
CONFLICT OF INTEREST
The authors declare that there is no conflict of interests. No animal or human studies were carried out by the authors for this article.
AUTHOR CONTRIBUTIONS
XG and LX involved in study concept and design; LX, JG, YG and XG involved in acquisition of data; JG, YG, XM, LZ, HL, ZY and YH involved in analysis and interpretation of data. LX, JG and XG drafted the manuscript; LX, JG and XG involved in critical revision of the manuscript for intellectual content.
Supporting information
Supplementary Material
ACKNOWLEDGEMENTS
This study was supported by Key Project of Science and Technology Research of Henan Provincial Department of Education (No.20A180001), National Natural Science Foundation of China (No.81602362), Supporting grants of Henan University (No.2015YBZR048; No.B2015151), Yellow River Scholar Program (No.H2016012) and Program for Innovative Talents of Science and Technology in Henan Province (No. 18HASTIT048), Projects for College Students in Henan University (No. 201819002), China Postdoctoral Science Foundation (No.2017M62237) and Henan Postdoctoral Foundation (No. 001702052), Program for Science and Technology Development in Henan Province (No.162102310391, No.172102210187), Program for Scientific and Technological Research of Henan Education Department (No.14B520022), Kaifeng Science and Technology Major Project (18ZD008) and Supporting grant of Bioinformatics Center of Henan University (No.2018YLJC01).
Guo J, Gu Y, Ma X, et al. Identification of hub genes and pathways in adrenocortical carcinoma by integrated bioinformatic analysis. J Cell Mol Med. 2020;24:4428–4438. 10.1111/jcmm.15102
Jinshuai Guo and Yingzhong Gu are Co‐first authors.
Contributor Information
Longxiang Xie, Email: xielongxiang123@126.com.
Xiangqian Guo, Email: xqguo@henu.edu.cn.
DATA AVAILABILITY STATEMENT
All data generated or analysed during this study are included in this article.
REFERENCES
- 1. Delellis RA. Pathology and genetics of tumours of endocrine organs. 2004.
- 2. NIH state‐of‐the‐science statement on management of the clinically inapparent adrenal mass ("incidentaloma"). NIH Consensus State Sci Statements. 2002;19:1. [PubMed] [Google Scholar]
- 3. Nakamura Y, Yamazaki Y, Felizola S, et al. Adrenocortical carcinoma: review of the pathologic features, production of adrenal steroids, and molecular pathogenesis. Endocrinol Metabo Clin North Am. 2015;44:399‐410. [DOI] [PubMed] [Google Scholar]
- 4. Bruno A, Martin F. Clinical review: adrenocortical carcinoma: clinical update. J Clin Endocrinol Metab. 2006;91:2027‐2037. [DOI] [PubMed] [Google Scholar]
- 5. Guillaume A, Eric L, Martin F, et al. Integrated genomic characterization of adrenocortical carcinoma. Nat Genet. 2014;46:607‐612. [DOI] [PubMed] [Google Scholar]
- 6. Tobias E, Kim AC, Aaron S, et al. Adrenocortical carcinoma. Endocr Rev. 2014;35:282‐326. [DOI] [PMC free article] [PubMed] [Google Scholar]
- 7. Gara SK, Lack J, Zhang L, Harris E, Cam M, Kebebew E. Metastatic adrenocortical carcinoma displays higher mutation rate and tumor heterogeneity than primary tumors. Nat Commun. 2018;9:4172. [DOI] [PMC free article] [PubMed] [Google Scholar]
- 8. Xie L, Wang Q, Nan F, et al. OSacc: Gene Expression‐Based Survival Analysis Web Tool For Adrenocortical Carcinoma. Cancer Manag Res. 2019;11:9145. [DOI] [PMC free article] [PubMed] [Google Scholar]
- 9. Giordano TJ, Kuick R, Else T, et al. Molecular classification and prognostication of adrenocortical tumors by transcriptome profiling. Clin Cancer Res. 2009;15(2):668‐676. [DOI] [PMC free article] [PubMed] [Google Scholar]
- 10. Soon PSH, Gill AJ, Benn DE, et al. Microarray gene expression and immunohistochemistry analyses of adrenocortical tumors identify IGF2 and Ki‐67 as useful in differentiating carcinomas from adenomas. Endocr Relat Cancer. 2009;16(2):573‐583. [DOI] [PubMed] [Google Scholar]
- 11. Weiss ID, Huff LM, Evbuomwan MO, et al. Correction: Screening of cancer tissue arrays identifies CXCR4 on adrenocortical carcinoma: correlates with expression and quantification on metastases using (64)Cu‐plerixafor PET. Oncotarget. 2018;8:73387‐73406. [DOI] [PMC free article] [PubMed] [Google Scholar]
- 12. Ward A, Balwierz A, Zhang JD, et al. Re‐expression of microRNA‐375 reverses both tamoxifen resistance and accompanying EMT‐like properties in breast cancer. Oncogene. 2013;32:1173‐1182. [DOI] [PubMed] [Google Scholar]
- 13. Consortium GO . The gene ontology (GO) project in 2006. Nucleic Acids Res. 2006;34:322‐326. [DOI] [PMC free article] [PubMed] [Google Scholar]
- 14. Han YJ, Wang XH, Chen WC, et al. Differential expression of carotenoid‐related genes determines diversified carotenoid coloration in flower petal of Osmanthus fragrans. Tree Genet Genomes. 2014;10:329‐338. [Google Scholar]
- 15. Ogata H, Goto S, Sato K, Fujibuchi W, Bono H, Kanehisa M. KEGG: Kyoto Encyclopedia of Genes and Genomes. Nucleic Acids Res. 2000;27:29‐34. [DOI] [PMC free article] [PubMed] [Google Scholar]
- 16. Dennis G, Sherman BT, Hosack DA, et al. DAVID: Database for Annotation, Visualization, and Integrated Discovery. Genome Biol. 2003;4:P3. [PubMed] [Google Scholar]
- 17. Damian S, Andrea F, Stefan W, et al. STRING v10: protein‐protein interaction networks, integrated over the tree of life. Nucleic Acids Res. 2015;43:D447. [DOI] [PMC free article] [PubMed] [Google Scholar]
- 18. Shannon P, Markiel A, Ozier O, et al. Cytoscape: a software environment for integrated models of biomolecular interaction networks. Genome Res. 2003;13:2498. [DOI] [PMC free article] [PubMed] [Google Scholar]
- 19. Tang Z, Li C, Kang B, Gao G, Li C, Zhang Z. GEPIA: a web server for cancer and normal gene expression profiling and interactive analyses. Nucleic Acids Res. 2017;45:W98‐W102. [DOI] [PMC free article] [PubMed] [Google Scholar]
- 20. Goldman M, Craft B, Zhu J, Haussler D. The UCSC Xena system for cancer genomics data visualization and interpretation. AACR. 2017;77:2584. [Google Scholar]
- 21. Klaus S, Axel U. Targeting polo‐like kinase 1 for cancer therapy. Nat Rev Cancer. 2006;6:321‐330. [DOI] [PubMed] [Google Scholar]
- 22. JoãO Agostinho MN, Saad STO, Fabiola T. Stathmin 1 in normal and malignant hematopoiesis. BMB Rep. 2014;47:660‐665. [DOI] [PMC free article] [PubMed] [Google Scholar]
- 23. Martino MCD, Koetsveld PMV, Pivonello R, Hofland LJ. Role of the mTOR Pathway in normal and tumoral adrenal cells. Neuroendocrinology. 2010;92:28‐34. [DOI] [PubMed] [Google Scholar]
- 24. Faillot S, Assie G. ENDOCRINE TUMOURS: The genomics of adrenocortical tumors. Eur J Endocrinol. 2016;174(6):R249‐R265. [DOI] [PubMed] [Google Scholar]
- 25. Ding K, Li W, Zou Z, Zou X, Wang C. CCNB1 is a prognostic biomarker for ER+ breast cancer. Med Hypotheses. 2014;83:359‐364. [DOI] [PubMed] [Google Scholar]
- 26. Stav D, Bar I, Sandbank J. Usefulness of CDK5RAP3, CCNB2, and RAGE genes for the diagnosis of lung adenocarcinoma. Int J Biol Markers. 2007;22:108‐113. [DOI] [PubMed] [Google Scholar]
- 27. Gao CL, Wang GW, Yang GQ, Yang H, Zhuang L. Karyopherin subunit‐α 2 expression accelerates cell cycle progression by upregulating CCNB2 and CDK1 in hepatocellular carcinoma. Oncol Lett. 2017;15:2815‐2820. [DOI] [PMC free article] [PubMed] [Google Scholar]
- 28. Shi Q, Wang W, Jia Z, Chen P, Ma K, Zhou C. ISL1, a novel regulator of CCNB1, CCNB2 and c‐MYC genes, promotes gastric cancer cell proliferation and tumor growth. Oncotarget. 2016;7:36489‐36500. [DOI] [PMC free article] [PubMed] [Google Scholar]
- 29. Xi Q, Huang M, Wang Y, et al. The expression of CDK1 is associated with proliferation and can be a prognostic factor in epithelial ovarian cancer. Tumour Biol. 2015;36:4939‐4948. [DOI] [PubMed] [Google Scholar]
- 30. Kang X, Song C, Du X. PTEN stabilizes TOP2A and regulates the DNA decatenation. Sci Rep. 2015;5:17873. [DOI] [PMC free article] [PubMed] [Google Scholar]
- 31. Glover AR, Ting ZJ, Gill AJ, et al. microRNA‐7 as a tumor suppressor and novel therapeutic for adrenocortical carcinoma. Oncotarget. 2015;6:36675‐36688. [DOI] [PMC free article] [PubMed] [Google Scholar]
- 32. Lee YE, He HL, Lee SW, et al. AMACR overexpression as a poor prognostic factor in patients with nasopharyngeal carcinoma. Tumour Biol. 2015;35:7983‐7991. [DOI] [PubMed] [Google Scholar]
- 33. Tian G, Yong H, Ling Y, Sheng A, Ziyu L, Jiafu J. CCNA2 is a prognostic biomarker for ER+ breast cancer and tamoxifen resistance. PLoS ONE. 2014;9:e91771. [DOI] [PMC free article] [PubMed] [Google Scholar]
- 34. Xing C, Xie H, Lin Z, et al. Cyclin‐dependent kinase inhibitor 3 is overexpressed in hepatocellular carcinoma and promotes tumor cell proliferation. Biochem Biophys Res Commun. 2012;420:29‐35. [DOI] [PubMed] [Google Scholar]
- 35. Zhanwei W, Dionyssios K, Yi S, et al. Biological and clinical significance of MAD2L1 and BUB1, genes frequently appearing in expression signatures for breast cancer prognosis. PLoS ONE. 2015;10:e0136246. [DOI] [PMC free article] [PubMed] [Google Scholar]
- 36. Hiroki I, Yuji T, Susumu S, et al. RacGAP1 expression, increasing tumor malignant potential, as a predictive biomarker for lymph node metastasis and poor prognosis in colorectal cancer. Carcinogenesis. 2015;36:346‐354. [DOI] [PubMed] [Google Scholar]
- 37. Pliarchopoulou K, Kalogeras KT, Kronenwett R, et al. Prognostic significance of RACGAP1 mRNA expression in high‐risk early breast cancer: a study in primary tumors of breast cancer patients participating in a randomized Hellenic Cooperative Oncology Group trial. Cancer Chemother Pharmacol. 2013;71:245‐255. [DOI] [PubMed] [Google Scholar]
Associated Data
This section collects any data citations, data availability statements, or supplementary materials included in this article.
Supplementary Materials
Supplementary Material
Data Availability Statement
All data generated or analysed during this study are included in this article.


