

Abstract
Motivation
Interactions between proteins and peptides or peptide-like intrinsically disordered regions are involved in many important biological processes, such as gene expression and cell life-cycle regulation. Experimentally determining the structure of such interactions is time-consuming and difficult because of the inherent flexibility of the peptide ligand. Although several prediction-methods exist, most are limited in performance or availability.
Results
InterPep2 is a freely available method for predicting the structure of peptide–protein interactions. Improved performance is obtained by using templates from both peptide–protein and regular protein–protein interactions, and by a random forest trained to predict the DockQ-score for a given template using sequence and structural features. When tested on 252 bound peptide–protein complexes from structures deposited after the complexes used in the construction of the training and templates sets of InterPep2, InterPep2-Refined correctly positioned 67 peptides within 4.0 Å LRMSD among top10, similar to another state-of-the-art template-based method which positioned 54 peptides correctly. However, InterPep2 displays a superior ability to evaluate the quality of its own predictions. On a previously established set of 27 non-redundant unbound-to-bound peptide–protein complexes, InterPep2 performs on-par with leading methods. The extended InterPep2-Refined protocol managed to correctly model 15 of these complexes within 4.0 Å LRMSD among top10, without using templates from homologs. In addition, combining the template-based predictions from InterPep2 with ab initio predictions from PIPER-FlexPepDock resulted in 22% more near-native predictions compared to the best single method (22 versus 18).
Availability and implementation
The program is available from: http://wallnerlab.org/InterPep2.
Supplementary information
Supplementary data are available at Bioinformatics online.
1 Introduction
Protein–protein interactions are vital in most biological processes, from metabolism to cell life-cycle (Midic et al., 2009; Tu et al., 2015). To understand these processes, it is important to know the structural details of the interactions. Structures of interacting proteins can be experimentally solved through a multitude of methods such as X-ray crystallography, NMR and cryo-EM (Rhodes, 2010; Topf et al., 2008; Wüthrich, 1986). However, because of the complexity, cost and time it takes to perform experiments, computational methods have been developed to support and supplement. Methods such as HADDOCK, PIPER and ZDOCK (Dominguez et al., 2003; Kozakov et al., 2006; Pierce et al., 2014) make predictions directly from sequence or energy function information, while others such as InterPred, PRISM and M-TASSER (Baspinar et al., 2014; Chen and Skolnick, 2008; Wallner and Mirabello, 2017) use already solved structures as templates for prediction. Among these methods, template-based approaches have shown great success in the past.
A significant fraction (15–40%) of protein–protein interactions are peptide-mediated interactions (Petsalaki and Russell, 2008), in which a short stretch of residues interact with a larger protein receptor (Mohan et al., 2006). These short stretches of residues or peptide regions are often disordered alone and only obtain structure upon binding. In many cases, the peptide region is located within intrinsically disordered proteins (Neduva et al., 2005; Petsalaki and Russell, 2008) or compromise flexible linkers or loops connecting domains (Vacic et al., 2007). The transient nature of these interactions makes them much harder to study experimentally compared to ordered protein–protein interactions. Thus, computational methods are crucial for guiding and designing experiments. Site prediction methods such as PepSite, ACCLUSTER, PeptiMap and InterPep are often capable of predicting areas of peptide-binding on a receptor surface, but does not model the actual peptide and interaction (Johansson-Åkhe et al., 2019; Lavi et al., 2013; Trabuco et al., 2012; Yan and Zou, 2015). Global peptide-docking prediction methods such as CABSdock, PIPER-FlexPepDock, pepATTRACT, SPOT-peptide and GalaxyPepDock have achieved high performances on individual benchmarks, but struggle to consistently produce reliable predictions (Alam et al., 2017; Kurcinski et al., 2015; Lee et al., 2015; Litfin et al., 2019; Schindler et al., 2015). Local refinement prediction methods such as Rosetta FlexPepDock, PEP-FOLD3 and DINC 2.0 have achieved high precision in the past, but require good starting positions (Antunes et al., 2017; Lamiable et al., 2016; Raveh et al., 2010). Rosetta FlexPepDock for example requires a starting position within 5.5 Å RMSD (root mean square deviation) of the correct structure to reliably produce near-native predictions (Raveh et al., 2010).
Previously we have developed InterPep (Johansson-Åkhe et al., 2019) for predicting peptide-binding sites on protein surfaces. In this study, we present the improved InterPep2, which predicts the complete peptide–protein interaction complex.
2 Materials and methods
2.1 Datasets
Three datasets of experimentally solved structures of peptide–protein interactions were used to train, evaluate and benchmark the method in this study.
2.1.1. Bound set
The bound set consists of 502 non-redundant bound peptide–protein complexes and was previously used in InterPep (Johansson-Åkhe et al., 2019). The peptides are 5–25 residues long, share at least 400Å2 of contact surface with their respective receptors, and the complexes were deposited in the PDB before May 19, 2016. The total set of 502 complexes was randomly divided into two sets of 251 complexes each; a test set for benchmarking and a training set for training and tuning of the method using 5-fold cross-validation. The set is available at http://wallnerlab.org/InterPep2.
2.1.2. PDB16–19 set
To allow for testing on new peptide–protein complexes deposited after the creation of the Bound set, an additional set, created by the same standards as the bound set, but from structures deposited between May 19, 2016 and October 15, 2019 was constructed. The PDB16–19 set consists of 252 non-redundant peptide–protein complexes and is available at http://wallnerlab.org/InterPep2.
2.1.3. Unbound set
To benchmark more realistic docking scenarios, a smaller set of 27 solved non-redundant structures of peptide–protein interaction complexes for which there also exists determined unbound structures of the receptors was used. As this set has previously been used for benchmarking (Alam et al., 2017), it is possible to compare against otherwise computationally heavier methods or methods which are only available through web-servers with limited programmatical access, such as PIPER-FlexPepDock (Alam et al., 2017), pepATTRACT (Schindler et al., 2015) and HADDOCK (Dominguez et al., 2003).
As some of the targets in this set are similar to targets in the training part of the bound set, when evaluating the performance of InterPep2 on the unbound set it was retrained for each new target, filtering training samples too similar to the target. Two complexes are considered too similar if the receptors match with a BLAST E-value of 0.05 or better.
2.2 Interaction template library
To describe possible interactions, an interaction template library was constructed from PDB (May 19, 2016) using protein–protein interactions in the defined biological units to prevent non-native interfaces from crystal packing (Carugo and Argos, 2008). The interaction template library comprised residues within 5.0 Å (all-atoms) from another chain in a multimer complexes, each described by the position of its Cα carbon. Note the set of residues do not need to be consecutive in sequence, as the interaction templates contain any interacting surface residues.
2.2.1. Trivial templates
During benchmarking against the bound and unbound sets, trivial templates were removed to ensure that the benchmarking measures the accuracy of the method, and not simply the difficulty of the test sets. Trivial templates are defined as templates from complexes which receptor matches the target receptor with BLAST (Altschul et al., 1997) at E-value at or below 0.05.
2.3 Performance measures
Three different criteria are used to determine if a docked conformation is successful:
A docked peptide is correct by LRMSD if the peptide is positioned within 4.0 Å LRMSD, i.e. the RMSD of the peptide when the complex is superimposed on the receptor is 4.0 Å.
A docked peptide is correct by fnat, i.e. fraction of correct native interchain contacts, if the complex has an fnat of at least 0.6. Native contacts are defined using 5.0 Å distance atom–atom cutoff.
A docked peptide is at the correct binding site of the receptor if the set of receptor residues interacting with the peptide overlaps with the at least 50% of the set of receptor residues interacting with the peptide in the native complex.
In addition, precision and recall at different score thresholds are used to evaluate the ability to correctly rank correct and incorrect predictions:
where TP is the number of true positives and FP is the number of false positives. Precision is also referred to as positive predictive value.
where TP is the number of true positives and P is the total number of positives in the set. Recall is also referred to as true positive rate. Precision and recall are calculated for varying score threshold and visualized for all thresholds in a receiver operating characteristic curve.
2.4 The InterPep2 protocol
InterPep2 takes a protein structure and a peptide sequence as input and produces several suggested docking poses describing the peptide–protein interaction. For each of these, InterPep2 also predicts the quality of the model as measured by DockQ-score (Basu and Wallner, 2016a). The DockQ-score is a continuous measure ranging from 0.0 to 1.0, describing the overall similarity in binding between a predicted model and the native structure, based on fnat (fraction of recovered native contacts), iRMSD (interface RMSD) and LRMSD (ligand RMSD), as by CAPRI (Lensink and Wodak, 2013) evaluation criteria.
The complete protocol consists of five steps, explained in detail below (Fig. 1):
Fig. 1.

Summary of the InterPep2 method
2.4.1. Template alignments
Every full chain with one or more interfaces included in the Interaction Template Library is aligned to the receptor protein structure using TM-Align (Zhang and Skolnick, 2005). For each alignment, the interfaces of the aligned chain are superimposed on the receptor by the same rotational matrix used for the full chain in the TM-Align alignment, creating templates for interaction.
2.4.2. Peptide conformations
The peptide conformational space is represented by 50 structural models of the peptide generated using structural fragments from known structures with similar sequence and secondary structure. In detail, PSI-BLAST (Altschul et al., 1997) is used to generate a sequence profile for the peptide, which is used in PSI-PRED (Jones, 1999) to predict secondary structure. The sequence profile and the secondary structure prediction are both used in the Rosetta Fragment Picker application (Gront et al., 2011), which selects 50 fragments from 2000 decoys by finding sequence and secondary structure matches in a representative set of monomeric protein structures. The 50 fragments are then extracted from their full structures, and sequence is changed to that of the query peptide using the Rosetta fixbb application (Kuhlman and Baker, 2000). This protocol for generating peptide fragments is similar to that of PIPER-FlexPepDock (Alam et al., 2017), and has been shown to reliably sample near-native peptide conformations.
2.4.3. Build interaction complex
Interaction complexes are constructed by combining the 2500 best template alignments (by TM-score) from the template alignment step with the 50 conformations of the peptide, resulting in 125 000 (2500 × 50) coarse interaction models. The models are created by, for each combination of receptor-to-interaction-template alignment and peptide conformation, aligning the peptide to the complementary side of the template interface using InterComp (Mirabello and Wallner, 2018). InterComp is used in favor of TM-Align as it can align with respect only to coordinates and amino acid identity, completely eschewing sequence order (Mirabello and Wallner, 2018). This means that even a composite interface surface formed from non-consecutive residues in any order can align to a short straight peptide.
2.4.4. Model scoring
Suggested models of the interaction complex are scored by a regression random forest trained to predict the DockQ-score of the complex, using features relevant to peptide–protein interactions (Table 1). During the development of InterPep2, additional features and target functions were considered, but only features which showed considerable contribution to performance were kept. The parameters of the random forest as well as the selection of features were optimized by 5-fold cross-validation on the training data, details in Supplementary information.
Table 1.
Features importance
| Feature | Importance (%) |
|---|---|
| Length of peptide template | 22.73 ± 12.32 |
| IS-score of interface | 12.18 ± 7.43 |
| Amino acid composition difference peptide | 7.43 ± 3.75 |
| Interface area | 7.35 ± 5.63 |
| InterComp total score | 5.58 ± 6.31 |
| Link density | 4.75 ± 4.40 |
| Aligned region sequence identity (receptor) | 3.86 ± 2.03 |
| Length of receptor | 3.20 ± 0.98 |
| Length of receptor template | 3.10 ± 1.23 |
| InterComp sequence score | 3.02 ± 1.57 |
| TM-score normalized by receptor length | 3.01 ± 1.51 |
| Receptor template interface size | 2.94 ± 1.48 |
| InterComp negative logarithm of P-value | 2.91 ± 2.52 |
| TM-Align RMSD | 2.67 ± 1.76 |
| TM-score normalized by template length | 2.16 ± 1.09 |
| Number aligned residues of receptor | 2.16 ± 0.65 |
| Conservation of receptor surface | 2.11 ± 1.43 |
| Fraction of interface which was aligned | 2.05 ± 1.80 |
| Propensity Pr(aa|burial) of interface | 1.93 ± 0.23 |
| Predicted fraction random coil of peptide | 1.72 ± 0.37 |
| Amino acid composition difference receptor | 1.61 ± 1.33 |
| Clashes | 1.52 ± 0.83 |
Note: Features used by the random forest, and their relative importance as measured by reduction in Gini Impurity. Note that the features regarding TM-Align refers to the alignment between the receptor and its template, and the features regarding InterComp refers to the alignment between the peptide and its template.
The random forest of InterPep2 is implemented using the scikit-learn Python package (Pedregosa et al., 2011).
2.4.5. Predictions
The final predictions are ranked by the predicted DockQ-score and filtered to ensure no two predictions are within 4.0 Å LRMSD.
2.4.6. Refinement (optional last step)
InterPep2 generates unrefined coarse interaction models that could benefit from refinement. To analyze the usefulness of refinement, the option to refine the coarse models using the Rosetta FlexPepDock refinement protocol (Raveh et al., 2010) was added (InterPep2-Refined). Using this option, up to 12 500 of the best ranking predictions with a predicted DockQ-score above 0.2 are refined, and the top 1% (top 125) models with best Rosetta reweighted scores are clustered at 2 Å LRMSD, the clusters are ranked by the mean predicted DockQ-score of the models in the cluster, and the cluster centers are given as final predictions.
3 Results and discussion
3.1 Database coverage
To get an estimate on the upper bound of prediction performance, the available templates for the 251 complexes in the bound set were analyzed. Using different subsets of the available templates, the performance was assessed on four levels: high quality (LRMSD4.0 Å), at least medium quality (LRMSD5.5 Å), high quality by fnat (fnat0.6) and at least correct site on the receptor, see Table 2. In all cases, templates from closely related structures are removed (BLAST E0.05).
Table 2.
Database coverage
| Template set | 4.0 Å | 5.5 Å | fnat 0.6 | Correct site |
|---|---|---|---|---|
| All interchain templates | 89 | 164 | 92 | 194 |
| Peptide–protein templates | 70 | 109 | 74 | 140 |
| Protein–protein templates | 59 | 136 | 58 | 168 |
Note: Coverage of templates for the 251 complexes in the bound set, i.e. the upper bound on the performance; 4.0 Å and 5.5 Å describe for how many complexes that can be modeled within 4.0 or 5.5 Å LRMSD, respectively. fnat 0.6 describes how many complexes can be modeled with an fnat of at least 60%, filtering out possible complexes which would have 10 steric clashes or more to avoid including unrealistic models. Correct Site refers to how many complexes have at least one template that positions the peptide in the correct site on the receptor.
Looking at Table 2, we can see that by using only peptide–protein templates, it is possible to model 70 of the 251 test complexes at high quality, while adding protein–protein templates increases this number to 89/251. In 22 of these 89 cases (24%), it is optimal to use a protein–protein rather than a peptide–protein interaction as a basis for the template, although it is possible to produce correct models for 59 targets using only protein–protein templates. Given that a considerable fraction of the high-quality models originate from protein–protein templates, there is a substantial gain by extending the database to cover both protein–protein and peptide–protein templates, and not limiting the search-space to peptide–protein interactions only.
Notably, there are more high-quality templates from peptide–protein templates compared to protein–protein templates, both when considering LRMSD and fnat, while the opposite is true for medium quality or correct site templates. This implies that peptide–protein templates are generally better templates for other peptide–protein interactions, while it is still viable to predict peptide–protein interactions with protein–protein templates. The fact that there are far more protein–protein templates than peptide–protein templates in the template set certainly increase the chances of finding potential useful templates.
3.2 Benchmark: bound set
The performance of InterPep2 and InterPep2-Refined was compared to two other available established methods: GalaxyPepDock (Lee et al., 2015) and CABSdock (Kurcinski et al., 2015), on the bound set. Many other methods for global peptide to protein receptor docking exist, but most are not readily available to be run in large-scale tests, having either no standalone version or are only available through web-servers with limited programmatical access. Since InterPep2, InterPep2-Refined and GalaxyPepDock are template-based, trivial templates were not allowed, to emulate a real-world situation.
First the ability of each method to accurately model the proteins in the bound set at three quality levels, correct at top1, correct among top10 and correct site modeling at top1, were assessed (Fig. 2). When using LRMSD as the metric for successful docking, InterPep2 has more correct models at top1 compared to GalaxyPepDock, and CABSdock, it has also more models with the peptide at the correct site; and applying FlexPepDock refinement in InterPep2-Refined starting from InterPep2 models consistently improves the results. Using fnat as the metric of success rather than LRMSD resulted in minor decreases in performance for InterPep2, but increases in performance for GalaxyPepDock, which achieves superior performance when looking at top10, albeit still with similar performance to InterPep2 when looking at top1, indicating a better sampling of side-chain conformations among the ensemble of structures.
Fig. 2.

The number of the 251 complexes in the bound test set that was correctly modeled using different performance measures. From bottom to top (dark to lighter shades), number of correct models at top1, number of correct models for best of top10 and number of top1 models with the peptide at the correct site. The two columns for top1 and top10 denote LRMSD (left) and fnat (right) as a criteria for docking success, respectively
Both InterPep2 and GalaxyPepDock provide model scores, InterPep2 in the form of the predicted DockQ-score and GalaxyPepDock as a predicted accuracy. The ability of these scores to separate correct from incorrect predictions were investigated in a precision–recall curve (Fig. 3). Shown here, InterPep2 has also a higher precision over all recall levels.
Fig. 3.

Precision–recall curve showing the capability of InterPep2 and GalaxyPepDock to correctly rank their own predictions, calculated using the top1 prediction for each target in the bound test set
In addition, to test the initial hypothesis that templates from structured proteins can be used to predict the binding of regions originating from natively disordered proteins, peptides in the bound set were classified as disordered or ordered. A peptide was considered disordered if it matched an annotated disordered region from DISPROT (Piovesan et al., 2017) with a BLAST E-value of 0.05 or less, otherwise it was classified as ordered. The difference in loss in DockQ-score when predicting complexes including disordered and ordered peptides was analyzed (Supplementary Fig. S5). Based on Kolmogorov–Smirnov and two-sided t-tests it could be concluded that there was no difference between predictions made for disordered compared to ordered peptides (P > 0.5 for the null hypothesis that there is a difference).
3.3 Benchmark: unbound set
The performance of InterPep2 was also benchmarked together with methods available as web-servers against the unbound set. Since this set consists of unbound conformation receptors with bound conformations to compare against, it is more indicative of a real-world scenario than the test against the bound set.
As can be seen from Figure 4, most methods perform similarly to each other. However, PIPER-FlexPepDock produces the most correct structures among the top10, 18 out of 27 using LRMSD or 15/27 using fnat as the metric of success, compared to InterPep2-Refined with 15/27 or 13/27, and InterPep2 with 10/27 or 9/27. It might come as a surprise that an ab initio method like PIPER-FlexPepDock performs better than template-based methods like InterPep2 and GalaxyPepDock. However, it should be noted that for the template-based methods, trivial templates were not allowed to be used. Indeed, by allowing all templates (except self-hits) the performance of InterPep2 and GalaxyPepDock increases from 10 to 21 and from 13 to 20 correctly predicted targets, respectively, when using LRMSD as the metric of success (Supplementary Table S4).
Fig. 4.

Comparison of the ability of different methods to produce correctly docked peptide structures on the unbound set among top10 [data for HADDOCK, pepATTRACT and PIPER-FlexPepDock from (Alam et al., 2017)]
The relative difference in performance between InterPep2-Refined and InterPep2 is much larger on the unbound set compared to the bound set: 50% better on the unbound (Fig. 4), compared to only 9% on the bound (Fig. 2) using top10 and LRMSD as metric. This indicates that the refinement protocol in InterPep2-Refined, though useful on the bound set, is even more important on the unbound set, where there is also conformational changes in the receptor.
3.3.1. Combo method
Even though PIPER-FlexPepDock and InterPep2-Refined produce the highest numbers of correct structures, we found that the target overlap between correct predictions is surprisingly small, i.e. where InterPep2-Refined is correct, PIPER-FlexPepDock is wrong and vice versa (see Supplementary Fig. S7). When using LRMSD as the metric of success, only 9 of the 15 correctly modeled targets by InterPep2-Refined are also correctly modeled by PIPER-FlexPepDock, leaving a potential improvement of 6 correctly modeled targets if the methods are combined in an optimal way. A simple combo method was derived, by selecting InterPep2-Refined models if the InterPep2 predicted DockQ-score is above a threshold X (X = 0.412 ± 0.009, optimized using leave-one-out cross-validation see Supplementary information), otherwise a PIPER-FlexPepDock prediction is selected. The combo method gained 4 more correct targets compared to PIPER-FlexPepDock and is superior to both methods alone with 22 correct targets in total (Fig. 4, LRMSD). Other combinations of methods were explored, but since there were considerable overlap in correct predictions they did not reach the performance of the InterPep2-PIPER-FlexPepDock combo method (see Supplementary Fig. S9).
3.4 Generalizability
3.4.1. Generalizability of random forest regressor
Above, we discussed that InterPep2 performed relatively worse on the unbound compared to the bound set, and that the refinement protocol in InterPep2-Refined could rescue many of these cases. Still, a remaining question is if the worse performance on the unbound set is related to the fact that the random forest regressor in InterPep2 is trained only on bound conformations? Which, if the forest is not able to generalize, could result in suboptimal performance when presented with unbound starting points. To investigate this, we need to compare the ability of the random forest to rank predictions starting from a bound and unbound conformation of the same target, i.e. we cannot simply compare performance between the bound and unbound set. To this end, InterPep2 was run on the targets from the unbound set, but starting from the bound conformation of the receptor. Indeed, since bound docking is a simpler problem, the models generated in this way were significantly (P < 0.019) better compared to the unbound case (Supplementary Fig. S3). However, more importantly, the ability to correctly rank the prediction, as measured by the target-wise Spearman correlation between true and predicted DockQ-score and the difference in LRMSD between top1 and best model, are not significantly (P > 0.7) different between bound and unbound starting points (Supplementary Fig. S2). Thus, the random forest in InterPep2 is able to generalize to unbound starting points even though it was trained on only bound conformations.
3.4.2. Generalizability on new data
To further validate the performance and viability of InterPep2, the performance of the method compared to GalaxyPepDock and CABSdock was also investigated on the PDB16–19 set, which consists solely of structures which were determined after the newest structures in the InterPep2 training and template sets.
As can be seen in Figure 5, the performance of the methods relative each other are roughly the same as in Figure 2, implying the level of generalizability is roughly the same for all methods tested, and the overall performance for InterPep2 and GalaxyPepDock is slightly better, implying the methods tested can generalize to new data.
Fig. 5.

The number of the 252 complexes in the PDB16–19 set that was correctly modeled by the different methods using different performance measures. From bottom to top (dark to lighter shades), number of correct models at top1, number of correct models choosing the best of top10 for each target and number of top1 models with the peptide at the correct site. In the cases of correct at top1 and top10, the left columns denote using LRMSD as a criteria for docking success, whereas the right columns denote using fnat
3.5 Features of a good template
In the previous section, we showed that the random forest can perform well on data not used for training, and can therefore be assumed generalizable. As such, the features of high importance in Table 1 should represent generally important features for the similarity of one peptide–protein interaction interface to another interchain interface. Four features stand out as the most important:
The feature with highest importance is the length of the chain representing the peptide in the template. This is unsurprising, as we have previously concluded that for acquiring correct predictions it is often better to use peptide–protein interactions as templates, rather than protein–protein interactions (see Table 2 and Supplementary Fig. S6). Among all predictions made by InterPep2 on the bound set, 179 of the 251 (71.3%) top ranking predictions are derived from peptide–protein template interactions. The second-most important feature is the IS-score of the suggested interface, representing the conservation of the interaction surface. Sequence conservation is used as part of many machine-learning-based approaches to modeling and can sometimes alone be enough for the identification of binding-sites (Mayrose et al., 2004). Finally, the similarity in amino acid composition between the peptide and its template, and the total surface area covered by the peptide, both have large importance. In summary, features that describe the similarity of the peptide to its template, and features that identify the sequence conservation and size of the binding area of the receptor seem to be the most important.
More detailed features such as the residue packing or shape complementarity that previously have been proven important when ranking refined protein–protein models (Basu and Wallner, 2016b), do not impact the result at all when ranking unrefined coarse models as is the case here (see Supplementary information). The number of clashes do have an effect on prediction accuracy, but the importance is small (Table 1).
3.6 Prediction example
An example of a successful InterPep2 prediction is shown in Figure 6. This example is of the ADD domain binding to a H3 peptide tail. Note how in Figure 6A, predictions 7–10 suggest an alternate binding site. The templates which suggest this site are all from the polycomb protein EED, which has also shown to bind to the H3 peptide in previous studies (Li et al., 2014). In addition, analyzing the general areas of interaction of all predictions with ConSurf (Ashkenazy et al., 2016; Landau et al., 2005) showed both binding sites to be considerably more conserved than the rest of the protein surface. Both predicted binding sites had relative evolutionary rate scores with a mean of −0.56, implying conservation, compared to −0.89 for the center of the receptor (heavily conserved), and contrasting the mean of 0.87 on the rest of the surface (little to no conservation), indicating a possible alternate interaction-site. In another structure of the domain, 3QL9, the protein is shown with its C-terminal helix in this groove, and in 2PVN this site is where the ADD domain interfaces with the other domains of the full DNMT3L structure.
Fig. 6.

An example of a successful InterPep2 prediction on the complex of DNMT3a ADD domain binding to H3 peptide [PDB: 4QBQ (Noh et al., 2015)]. (A) The top10 predictions made by InterPep2, peptides in green, as well as the native structure, peptide in pink. The receptor is blue and its surface a semitransparent gray. (B) A closer look at the top1 prediction from InterPep2, in green, together with the native peptide, in pink. The predicted peptide is positioned 2.1 Å RMSD from the native peptide conformation, counting backbone positions. The images were constructed through PyMOL (Schrödinger, 2015). (Color version of this figure is available at Bioinformatics online.)
This example shows that even though some of the top predictions might not be at the correct peptide binding site, they might indicate other areas of biological importance. To test this hypothesis, we analyzed all top10 predictions for all bound set test targets (2510 predictions in total), for which a total of 1614 predictions position the peptide at the correct binding sites. By comparing to binding sites of closely related structures within the PDB (BLAST E1e−20), 401 of the remaining 896 predictions position the peptide at another binding site, which is either for another peptide or another protein–protein interaction, sometimes dimerization. A histogram over the distributions of the predicted score for the different types of predicted sites, Figure 7, shows that, although nonsense-predictions and predictions of other sites (sites which are not the peptide–protein site we test for) are difficult to tell apart, they follow different distributions. In general, at a low predicted score of circa 0.15–0.25, it is roughly equally likely that a prediction is of the correct site as that it would be of another binding site or a nonsense-prediction altogether, while at higher predicted scores the majority of predictions are clearly most often positioned at the correct binding site.
Fig. 7.
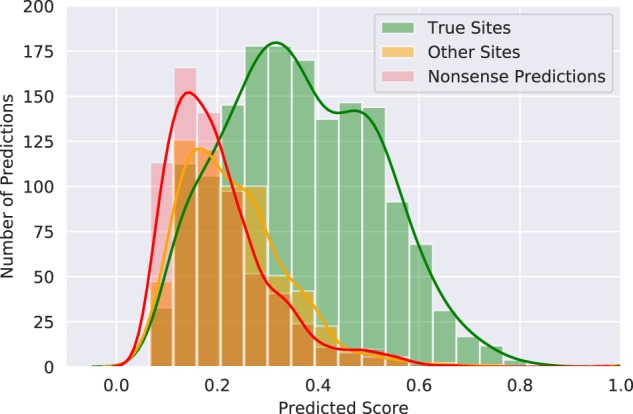
Histogram for the predicted DockQ scores of the top10 predictions for every target, separated by if the prediction found the correct site, another kind of binding site or an incorrect site. All three distributions are significantly different, with P < 0.0001 using d by two-sided Kolmogorov–Smirnov test
3.7 Runtime analysis
InterPep2 runtime scales linearly with the size of the receptor. Running on 32 CPU cores of Intel Xeon Gold 6130 on CentOS 7, InterPep2 takes circa 4 h when the receptor is 100 residues long, 6 h when the receptor is 300 residues long, or 8 h if the receptor is 500 residues long.
4 Conclusions
InterPep2 applies structural templates for docking peptide fragments, using a random forest regressor to score plausible interaction models. Because InterPep2 is using a residue-order-independent structural alignment for positioning the peptide, it is not limited to use peptide–protein interaction templates, but can use any protein–protein interaction surface as template to model peptide–protein interaction complexes.
InterPep2-Refined achieves state-of-the-art performance on a large set of 251 bound peptide–protein complexes with up to 25 residues long peptides, placing the peptide within 4.0 Å LRMSD of its native conformation in 50 structures considering top10 predictions, and with the highest precision across all recall levels, for example at 50% recall the precision is 61.5% compared to 47.8% precision for the second best method. This performance is maintained when testing on a new set (PDB16–19) of 252 complexes from structures deposited after the complexes used in the construction of the InterPep2 training and template sets, for which 67 peptides were placed in the correct conformation.
On a frequently used dataset of 27 unbound-to-bound complexes InterPep2-Refined performed second-best, successfully placing the peptide within 4.0 Å LRMSD in 15 of 27 peptide conformations, and modeling it with an fnat of at least 0.6 in 13 of the 27, without the use of templates with similar sequence to the target. More interesting however, is that a method combining the template-based InterPep2-Refined with the ab initio method PIPER-FlexPepDock vastly outperformed both methods it was derived from, successfully generating models with the peptide within 4.0 Å LRMSD of its native position for 22 of the 27 complexes, with an fnat of at least 0.6 in 19 of the 27.
Funding
This work was supported by a Swedish Research Council [2016-05369] the Swedish e-Science Research Center and the Foundation Blanceflor Boncompagni Ludovisi, née Bildt. The computations were performed on resources provided by the Swedish National Infrastructure for Computing (SNIC) at the National Supercomputer Centre (NSC) in Linköping.
Conflict of Interest: none declared.
Supplementary Material
References
- Alam N. et al. (2017) High-resolution global peptide–protein docking using fragments-based PIPER-FlexPepDock. PLoS Comput. Biol., 13, e1005905. [DOI] [PMC free article] [PubMed] [Google Scholar]
- Altschul S.F. et al. (1997) Gapped BLAST and PSI-BLAST: a new generation of protein database search programs. Nucleic Acids Res., 25, 3389–3402. [DOI] [PMC free article] [PubMed] [Google Scholar]
- Antunes D.A. et al. (2017) DINC 2.0: a new protein–peptide docking webserver using an incremental approach. Cancer Res., 77, e55–57. [DOI] [PMC free article] [PubMed] [Google Scholar]
- Ashkenazy H. et al. (2016) ConSurf 2016: an improved methodology to estimate and visualize evolutionary conservation in macromolecules. Nucleic Acids Res., 44, W344–350. [DOI] [PMC free article] [PubMed] [Google Scholar]
- Baspinar A. et al. (2014) Prism: a web server and repository for prediction of protein–protein interactions and modeling their 3D complexes. Nucleic Acids Res., 42, W285–289. [DOI] [PMC free article] [PubMed] [Google Scholar]
- Basu S., Wallner B. (2016a) DockQ: a quality measure for protein–protein docking models. PLoS One, 11, e0161879. [DOI] [PMC free article] [PubMed] [Google Scholar]
- Basu S., Wallner B. (2016b) Finding correct protein–protein docking models using proQDock. Bioinformatics, 32, i262–270. [DOI] [PMC free article] [PubMed] [Google Scholar]
- Carugo O., Argos P. (2008) Protein–protein crystal-packing contacts. Protein Sci., 6, 2261–2263. [DOI] [PMC free article] [PubMed] [Google Scholar]
- Chen H., Skolnick J. (2008) M-TASSER: an algorithm for protein quaternary structure prediction. Biophys. J., 94, 918–928. [DOI] [PMC free article] [PubMed] [Google Scholar]
- Dominguez C. et al. (2003) HADDOCK: a protein–protein docking approach based on biochemical or biophysical information. J. Am. Chem. Soc., 125, 1731–1737. [DOI] [PubMed] [Google Scholar]
- Gront D. et al. (2011) Generalized fragment picking in ROSETTA: design, protocols and applications. PLoS One, 6, e23294. [DOI] [PMC free article] [PubMed] [Google Scholar]
- Johansson-Åkhe I. et al. (2019) Predicting protein–peptide interaction sites using distant protein complexes as structural templates. Sci. Rep., 9, 4267. [DOI] [PMC free article] [PubMed] [Google Scholar]
- Jones D.T. (1999) Protein secondary structure prediction based on position-specific scoring matrices. J. Mol. Biol., 292, 195–202. [DOI] [PubMed] [Google Scholar]
- Kozakov D. et al. (2006) PIPER: an FFT-based protein docking program with pairwise potentials. Proteins, 65, 392–406. [DOI] [PubMed] [Google Scholar]
- Kuhlman B., Baker D. (2000) Native protein sequences are close to optimal for their structures. Proc. Natl. Acad. Sci. USA, 97, 10383–10388. [DOI] [PMC free article] [PubMed] [Google Scholar]
- Kurcinski M. et al. (2015) CABS-dock web server for the flexible docking of peptides to proteins without prior knowledge of the binding site. Nucleic Acids Res., 43, W419–424. [DOI] [PMC free article] [PubMed] [Google Scholar]
- Lamiable A. et al. (2016) PEP-FOLD3: faster de novo structure prediction for linear peptides in solution and in complex. Nucleic Acids Res., 44, W449–454. [DOI] [PMC free article] [PubMed] [Google Scholar]
- Landau M. et al. (2005) ConSurf 2005: the projection of evolutionary conservation scores of residues on protein structures. Nucleic Acids Res., 33, W299–302. [DOI] [PMC free article] [PubMed] [Google Scholar]
- Lavi A. et al. (2013) Detection of peptide-binding sites on protein surfaces: the first step toward the modeling and targeting of peptide-mediated interactions. Proteins, 81, 2096–2105. [DOI] [PMC free article] [PubMed] [Google Scholar]
- Lee H. et al. (2015) GalaxyPepDock: a protein–peptide docking tool based on interaction similarity and energy optimization. Nucleic Acids Res., 43, W431–435. [DOI] [PMC free article] [PubMed] [Google Scholar]
- Lensink M.F., Wodak S.J. (2013) Docking, scoring, and affinity prediction in CAPRI. Proteins, 81, 2082–2095. [DOI] [PubMed] [Google Scholar]
- Li Y. et al. (2014) Hat2p recognizes the histone H3 tail to specify the acetylation of the newly synthesized H3/H4 heterodimer by the Hat1p/Hat2p complex. Genes Dev., 28, 1217–1227. [DOI] [PMC free article] [PubMed] [Google Scholar]
- Litfin T. et al. (2019) Spot-peptide: template-based prediction of peptide-binding proteins and peptide-binding sites. J. Chem. Inf. Model., 59, 924–930. [DOI] [PubMed] [Google Scholar]
- Mayrose I. et al. (2004) Comparison of site-specific rate-inference methods for protein sequences: empirical Bayesian methods are superior. Mol. Biol. Evol., 21, 1781–1791. [DOI] [PubMed] [Google Scholar]
- Midic U. et al. (2009) Protein disorder in the human diseasome: unfoldomics of human genetic diseases. BMC Genomics, 10, S12. [DOI] [PMC free article] [PubMed] [Google Scholar]
- Mirabello C., Wallner B. (2018) Topology independent structural matching discovers novel templates for protein interfaces. Bioinformatics, 34, i787–794. [DOI] [PubMed] [Google Scholar]
- Mohan A. et al. (2006) Analysis of molecular recognition features (MoRFs). J. Mol. Biol., 362, 1043–1059. [DOI] [PubMed] [Google Scholar]
- Neduva V. et al. (2005) Systematic discovery of new recognition peptides mediating protein interaction networks. PLoS Biol., 3, e405. [DOI] [PMC free article] [PubMed] [Google Scholar]
- Noh K.-M. et al. (2015) Engineering of a histone-recognition domain in Dnmt3a alters the epigenetic landscape and phenotypic features of mouse ESCs. Mol. Cell, 59, 89–103. [DOI] [PMC free article] [PubMed] [Google Scholar]
- Pedregosa F. et al. (2011) Scikit-learn: machine learning in Python. J. Mach. Learn. Res., 12, 2825–2830. [Google Scholar]
- Petsalaki E., Russell R.B. (2008) Peptide-mediated interactions in biological systems: new discoveries and applications. Curr. Opin. Biotechnol., 19, 344–350. [DOI] [PubMed] [Google Scholar]
- Pierce B.G. et al. (2014) ZDOCK server: interactive docking prediction of protein–protein complexes and symmetric multimers. Bioinformatics, 30, 1771–1773. [DOI] [PMC free article] [PubMed] [Google Scholar]
- Piovesan D. et al. (2017) DisProt 7.0: a major update of the database of disordered proteins. Nucleic Acids Res., 45, D219–227. [DOI] [PMC free article] [PubMed] [Google Scholar]
- Raveh B. et al. (2010) Sub-angstrom modeling of complexes between flexible peptides and globular proteins. Proteins, 78, 2029–2040. [DOI] [PubMed] [Google Scholar]
- Rhodes G. (2010) Crystallography Made Crystal Clear: A Guide for Users of Macromolecular Models. Academic Press, Amsterdam. [Google Scholar]
- Schindler C.E. et al. (2015) Fully blind peptide–protein docking with pepATTRACT. Structure, 23, 1507–1515. [DOI] [PubMed] [Google Scholar]
- Schrödinger L.L.C. (2015) The PyMOL Molecular Graphics System, Version 1.8.
- Topf M. et al. (2008) Protein structure fitting and refinement guided by cryo-EM density. Structure, 16, 295–307. [DOI] [PMC free article] [PubMed] [Google Scholar]
- Trabuco L.G. et al. (2012) PepSite: prediction of peptide-binding sites from protein surfaces. Nucleic Acids Res., 40, W423–427. [DOI] [PMC free article] [PubMed] [Google Scholar]
- Tu W.B. et al. (2015) Myc and its interactors take shape. Biochim. Biophys. Acta, 1849, 469–483. [DOI] [PubMed] [Google Scholar]
- Vacic V. et al. (2007) Characterization of molecular recognition features, MoRFs, and their binding partners. J. Proteome Res., 6, 2351–2366. [DOI] [PMC free article] [PubMed] [Google Scholar]
- Wallner B., Mirabello C. (2017) InterPred: a pipeline to identify and model protein–protein interactions. Proteins, 85, 1159–1170. [DOI] [PubMed] [Google Scholar]
- Wüthrich K. (1986) NMR with proteins and nucleic acids. Europhys. News, 17, 11–13. [Google Scholar]
- Yan C., Zou X. (2015) Predicting peptide binding sites on protein surfaces by clustering chemical interactions. J. Comput. Chem., 36, 49–61. [DOI] [PubMed] [Google Scholar]
- Zhang Y., Skolnick J. (2005) TM-Align: a protein structure alignment algorithm based on the TM-score. Nucleic Acids Res., 33, 2302–2309. [DOI] [PMC free article] [PubMed] [Google Scholar]
Associated Data
This section collects any data citations, data availability statements, or supplementary materials included in this article.