

Summary
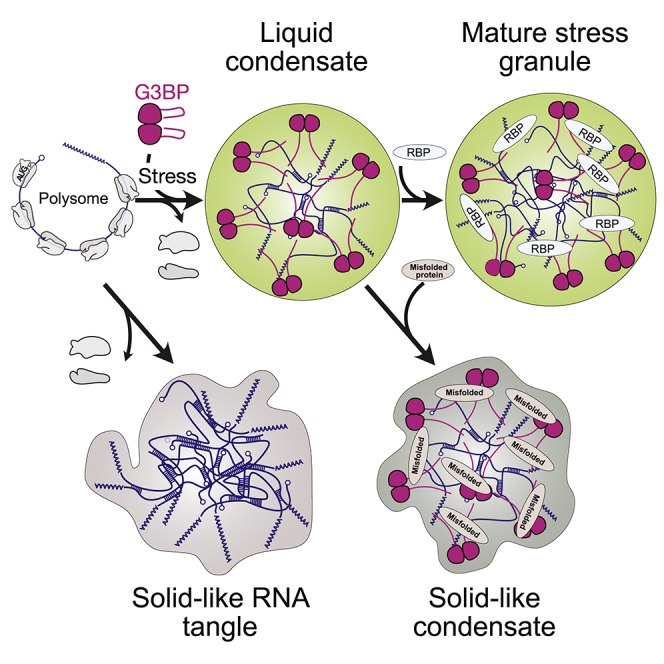
Stressed cells shut down translation, release mRNA molecules from polysomes, and form stress granules (SGs) via a network of interactions that involve G3BP. Here we focus on the mechanistic underpinnings of SG assembly. We show that, under non-stress conditions, G3BP adopts a compact auto-inhibited state stabilized by electrostatic intramolecular interactions between the intrinsically disordered acidic tracts and the positively charged arginine-rich region. Upon release from polysomes, unfolded mRNAs outcompete G3BP auto-inhibitory interactions, engendering a conformational transition that facilitates clustering of G3BP through protein-RNA interactions. Subsequent physical crosslinking of G3BP clusters drives RNA molecules into networked RNA/protein condensates. We show that G3BP condensates impede RNA entanglement and recruit additional client proteins that promote SG maturation or induce a liquid-to-solid transition that may underlie disease. We propose that condensation coupled to conformational rearrangements and heterotypic multivalent interactions may be a general principle underlying RNP granule assembly.
Keywords: stress granules, RNP granules, G3BP, phase separation, liquid-to-solid transition, Neurodegenerative disease, stress response
Graphical Abstract
Highlights
-
•
Under non-stressed conditions, G3BP adopts a compact auto-inhibited state
-
•
Conformational expansion of G3BP increases the interaction valences
-
•
G3BP clusters crosslink RNA to assemble stress granules upon cellular stress
-
•
G3BP condensates prevent RNA entanglement
Reconstitution of stress granule assembly reveals an autoinhibitory conformation of G3BP that is alleviated by RNA binding, demonstrating how this central node of the stress granule network phase-separates in response to rising cellular RNA concentrations.
Introduction
Assembly of membraneless compartments by phase separation is emerging as a principle of organizing the cytoplasm and nucleoplasm of cells (Banani et al., 2017, Shin and Brangwynne, 2017). Phase separation is a cooperative process by which a homogeneous solution of components separates into two or more coexisting phases: a dilute phase and a dense phase rich in macromolecules (or biomolecular condensate). These condensates can serve as selective membraneless compartments that regulate biochemical reactions (Alberti et al., 2019, Banani et al., 2017).
Growing evidence points to intrinsically disordered regions (IDRs) as regulators of condensates (Alberti et al., 2019, Posey et al., 2018). IDRs have a wide variety of physical properties (Das et al., 2015, Franzmann and Alberti, 2019a, Franzmann and Alberti, 2019b). Accordingly, different IDRs may play different roles as drivers or inhibitors of phase separation. One view is that IDRs drive assembly through multiple weakly interacting motifs or stickers that are separated by flexible spacer regions (Harmon et al., 2017b, Wang et al., 2018). Another view is that IDRs undergo sequence-specific, reversible, amyloid-like interactions (Kato et al., 2012, Kato and McKnight, 2018). Much work remains to understand how IDRs regulate condensate assembly in cells. Of importance is the question of how IDRs contribute to the specificity and selectivity required for condensate assembly in the crowded cell environment.
Stress granules (SGs) are inducible condensates that enrich messenger RNA (mRNA), RNA-binding proteins (RBPs), and small ribosomal subunits in the cytoplasm of stressed eukaryotic cells. SG assembly is triggered by, e.g. oxidative stress, heat shock, or osmotic stress (Aulas et al., 2017, Khong et al., 2017, Namkoong et al., 2018, Panas et al., 2016, Protter and Parker, 2016) and is often preceded by inactivation of the translation initiation factor eIF2α, which causes polysome runoff and release of free mRNAs (Anderson and Kedersha, 2002, Kedersha et al., 2002, Pavitt, 2005). Inhibiting polysome disassembly blocks SG assembly (Brengues et al., 2005, Kedersha et al., 2000, Mazroui et al., 2006), suggesting that a sudden increase in cytoplasmic mRNA concentration is the key event triggering SG assembly. SGs have been proposed to be sites of translation repression or stabilization of mRNAs and to have a pro-survival function during stress (Kedersha et al., 2002, Kimball et al., 2003, Panas et al., 2016, Protter and Parker, 2016). SGs have also been related to human disease (Alberti and Carra, 2018, Taylor et al., 2016). The molecular mechanisms underlying SG assembly and disease-related changes remain unclear, and mutually inconsistent models have been proposed.
One proposal is that SGs assemble by phase separation (Kroschwald et al., 2015, Molliex et al., 2015, Patel et al., 2015). Several IDR-containing proteins that localize to SGs, such as FUS and hnRNPA1, have been shown to undergo phase separation in vitro (Molliex et al., 2015, Patel et al., 2015). However, FUS and hnRNPA1 are genetically dispensable for SG assembly. Hence, the phase separation model of SG assembly has been challenged (Wheeler et al., 2016). One study proposed that SG assembly involves formation of solid core particles that recruit additional RBPs and RNAs (Jain et al., 2016). This model was recently modified by the suggestion that intermolecular base-pairing among RNA molecules drives their aggregation into ribonucleoprotein (RNP) granules (Jain and Vale, 2017, Van Treeck et al., 2018, Van Treeck and Parker, 2018). Another model proposed that SG assembly requires a solid-like seed composed of the SG protein G3BP1 and the small ribosomal subunit 40S (Kedersha et al., 2016, Panas et al., 2016). Although all of these models converge on the idea that SG assembly is driven by a combination of homotypic and heterotypic interactions involving IDRs (Fang et al., 2019, Kato and McKnight, 2018, Lin et al., 2015, Molliex et al., 2015, Patel et al., 2015, Protter et al., 2018), it has not been possible to synthesize a coherent framework. Testing the various ideas requires a defined system in which SG assembly can be followed step by step.
Here we use reconstitution approaches and cell experiments to demonstrate that SGs form by RNA-mediated condensation of the RBPs G3BP1 and G3BP2. We show that G3BP1 adopts an autoinhibitory compact state under non-stress conditions that is stabilized by electrostatic interactions between the positively charged RG-rich region and a disordered acidic region. RNA binding outcompetes this autoinhibitory interaction to liberate the RG-rich region and promote cooperative protein-RNA interactions. This results in assembly of G3BP1 clusters that physically crosslink RNA molecules to form inhomogeneous G3BP1-RNA condensates of low protein density. In summary, we propose a molecular mechanism for how complex assemblies such as SGs emerge through regulated density transitions that involve combinations of conformational rearrangements and heterotypic multivalent interactions, leading to hierarchical assembly.
Results
G3BP1 Condensates Exhibit Liquid-like Properties in Living Cells
G3BP1 and its homolog G3BP2 (collectively referred to as G3BP) are required for SG assembly under a variety of stress conditions, as opposed to other SG components whose deletion only affects the size or the number of SGs (Kedersha et al., 2016, Matsuki et al., 2013; see also the related papers from Yang et al., 2020, and Sanders et al., 2020, in this issue of Cell). To gain insight into SG assembly, we employed lattice light-sheet microscopy (LLSM) (Chen et al., 2014) to film HeLa cells expressing G3BP1-mCherry from a bacterial artificial chromosome. G3BP1 was diffusely distributed in the cytoplasm during growth and assembled into SGs upon oxidative stress (Figure S1A). Although G3BP1 structures were observed by conventional microscopy ∼20 min after stress (Figure S1A; Video S1), with LLSM small G3BP1 structures were detected within ∼5 min of treatment (Figures 1A and S1A; Video S2).
Figure S1.

Related to Figure 1
A: Fluorescence images from live-cell time-lapse movies of HeLa cells expressing G3BP1-mCherry filmed with lattice light sheet microscopy (LLSM, bottom) and conventional widefield microscopy (Convent., top). White arrows: intracellular G3BP1 foci. B: Fluorescence images of a LLSM movie of oxidatively stressed HeLa cells expressing G3BP1-mCherry. Time series starts 26 min after exposure to 1 mM sodium arsenate. Inset focuses on late G3BP1-positive SGs. Upon encounter, SGs coalesce with one another. C: Quantification of the number, volume and intensity of G3BP1-positive SGs as a function of time. Quantifications are shown for the mean averages of four time-lapse movies. Standard deviation is shown in gray. D: Fluorescence images of a partial photobleaching experiment of G3BP1-positive SGs in HeLa cells. Images show one granule before, the first frame and 120 s after photobleaching. Quantification shows the normalized mean fluorescence recovery curve (black dots), fit to the data (cyan) and SD (gray), n = 10. E: Still fluorescence images of a photobleaching experiment used to evaluate the internal diffusion of G3BP1 within SGs in HeLa cells (top). Kymograph of the signal intensity of the bleached G3BP1-positive SG as a function of time (x axis) along the SG distance (cyan bar indicated in the still images on top). Recovery of fluorescence occurs from the inside of the SG. F: Fluorescence images of an oxidatively stressed HeLa cell with G3BP1-mCherry SGs. The intact cell was permeabilized and treated with buffer (w/o RNase) or RNase A (w/ RNase). Scale bar 10 μm, except in D where it is 2 μm.
Figure 1.

Liquid-like G3BP1 SGs Form by Heterotypic Phase Separation in Cells
(A) Fluorescence images from a LLSM time-lapse movie of an oxidatively stressed HeLa cell expressing G3BP1-mCherry. Inset: G3BP1 foci. Scale bar, 10 μm.
(B) Analysis of the mean averages of G3BP1 foci within an individual cell as a function of time.
(C) Left: normalized number of G3BP1-positive SGs in individual cells as a function of time (every 100th data point is shown). Center: correlation of SG assembly onset as a function of G3BP1 mean fluorescence intensity. Right: correlation of G3BP1-positive SG number as a function of G3BP1 mean fluorescence intensity. Dashed lines are linear regression as a guide.
Cells were exposed to 1 mM sodium arsenate and imaged with conventional wide-field microscopy.
Cells were exposed to 1 mM sodium arsenate and imaged with lattice light sheet microscopy.
Analysis of G3BP1 foci over time in individual cells revealed an early apparent growth phase in which the number, size, and intensity of foci increased (∼5 to ∼10 min) and a late phase (starting ∼10 min after stress) in which the foci remained relatively stable (Figure 1B). Early and late G3BP1 foci coalesced with one another and underwent shape changes (Figures 1A, S1B, and S1C; Video S2). G3BP1 molecules within the same SG rapidly rearranged (determined by partial fluorescence recovery after photobleaching [FRAP]) (Figures S1D–S1E) and exchanged with the cytoplasm and neighboring SGs (determined by full FRAP, data not shown).
Figure S3.

Related to Figure 3
A: Phase separated fraction of G3BP1(WT) in the presence of 5-Loop and polyadenylated 5-Loop RNAs (n = 8 FOV). B: Fluorescence images of GFP-G3BP1(WT)-RNA condensates formed with polyadenylated and Cy5-labeled 5-Loop RNA. Scale bar, 5 μm. Condensates in A-B were formed in the presence of 1% PEG-20K and 75 ng/μl RNA. C: Quantification of the soluble fraction of RNA remaining after tangle formation (mean and SD from three independent measurements). D: Fluorescence immunostaining of oxidatively stressed U2OS wild-type cells and U2OS G3BP1/2 KO cells. G3BP1 (green) and eIF3η (magenta) are shown. Scale bars, 10 μm. E: Quantification of the number of eIF3η-positive SGs per cell in U2OS wild-type and in U2OS G3BP1/2 KO cells (mean and SD, n = 184 - 259 cells). F: Translation levels in U2OS cells (WT or G3BP1/2 KO) upon oxidative stress and recovery from stress. Translation levels were assessed by puromycin incorporation. Immunoblots against puromycin, p-eIF2a (to follow stress kinetics) and eIF2a (loading control) are shown. Harringtonine (Harr.) was used to prove specific incorporation of puromycin into nascent polypeptide chains. On the right, the normalized translation levels upon stress and recovery are shown (mean and SD from three independent experiments). G: EMSA to determine the apparent binding affinity of G3BP1(WT), G3BP1(ΔRG) and G3BP1(ΔNTF2) to A(60)-Cy5 RNA. Black arrow points toward free A(60)-Cy5 RNA. ∗ indicates shifted RNA species due to G3BP1 binding. H: EMSA testing for the competition of unlabeled A(60) and poly(A) (500-4000 nt) RNAs for G3BP1(WT) binding to the A(60)-Cy5 probe. From left to right: Lane1: without G3BP1, Lane 2: without competitor, Lane 3: with unlabeled A(60) RNA as competitor, Lane 4: with unlabeled poly(A) as competitor. Black arrow points toward free A(60)-Cy5 RNA. ∗ indicates shifted RNA species due to G3BP1 binding.
The onset of visible G3BP1 foci in individual cells was heterogeneous and marginally dependent on G3BP1 expression levels, whereas the overall number of early SGs correlated with expression of G3BP1 (Figure 1C). This behavior suggests that the onset of SG assembly is determined by an upstream process, such as release of mRNA from polysomes (Bounedjah et al., 2014). To examine the importance of RNA for SG assembly, we permeabilized stressed cells in the presence of RNase A, which led to SG dissolution (Figure S1F).
Taken together, our data suggest that G3BP1-mediated SGs assemble by heterotypic phase separation of G3BP1 and RNA, as opposed to a mechanism driven exclusively by interactions among G3BP molecules.
SG-like Condensates Can Be Reconstituted from Purified G3BP1 and RNA
G3BP1 is a multi-domain RBP with two folded domains, an N-terminal nuclear transport factor-like domain (NTF2), and an RNA recognition motif (RRM) close to its C terminus. These domains are connected by IDRs enriched in net-negative (acidic) and proline residues (PxxP). In addition, G3BP1 has an arginine- and glycine-rich C-terminal IDR (RG) (Figures 2A and 4A). We purified GFP-G3BP1 (hereafter referred to as G3BP1) from insect cells. We diluted the purified protein, from 0.1 to 10 μM (the cellular concentration of G3BP1 is 624 nM; Hein et al., 2015), into a physiological buffer and observed the protein solution by fluorescence microscopy. G3BP1 was diffusely distributed (Figures 2B and S2A). However, condensates assembled in the presence of total RNA from HeLa cells and 1% polyethylene glycol (PEG) (Figure 2B). Assembly of G3BP1-RNA condensates was dependent on protein and RNA concentration and sensitive to changes in salt concentration (Figures 2B and S2B). Raising the salt concentration caused condensate dissolution (Figure S2C), demonstrating reversibility. G3BP1 molecules within G3BP1-RNA condensates rearranged rapidly (Figure 2C) and, upon encounter, two condensates fused with one another (Figure 2D), demonstrating that protein and RNA can reorganize within condensates. Together, these results recapitulate the SG dynamics observed in cells (Figures 1A and S1D) and support a model of heterotypic interactions among G3BP1 and RNA molecules driving SG assembly.
Figure 2.

In Vitro Reconstituted G3BP1 Condensates Recapitulate Cellular SG Properties
(A) Schematic domain structure of G3BP1.
(B) Phase diagram of G3BP1(WT) as a function of protein and RNA concentration. Right: fluorescence images of G3BP1(WT) with and without RNA.
(C) Analysis of in vitro partial FRAP of G3BP1(WT)-RNA condensates. Mean average data (gray dots), fit (black), SD (light gray), n = 20.
(D) Fluorescence images from a time-lapse video of G3BP1(WT)-RNA condensate fusion.
(E) Fluorescence images of G3BP1 variants with RNA.
(F) Partition coefficient of GFP-tagged RBPs in preformed SNAP (Alexa 546)-labeled G3BP1-RNA condensates. PSPC, SFPQ, and GFP served as negative controls (n = 150 fields of view [FOVs]) (Figure S2H).
(G) G3BP1(WT) saturation concentration (Csat) with and without mCherry-Caprin-1 (mean, SD, fit, n = 20 FOVs).
(H) Coalescence of G3BP1(WT)-RNA condensates with or without equimolar Cy3-labeled Ubc9(WT) or Ubc9(ts), measured with dual-trap optical tweezers.
(I) Diffusion time of Ubc9(WT) and Ubc9(ts) within G3BP1-RNA condensates, determined by FCS. Significance levels: ∗ < 0.05, ∗∗ < 0.01, ∗∗∗ < 0.001.
(J) Mean average immobile fraction of Ubc9(WT) and Ubc9(ts) within G3BP1-RNA condensates as a function of time, determined by FRAP (SD, n = 5). Condensates formed with 1% PEG-20K and, when specified, 75 ng/μL of total RNA.
Scale bars, 10 μm, except 1 μm in (D).
Figure 4.

The Acidic IDR of G3BP1 Is a Negative Regulator of Phase Separation
(A) Top: schematic G3BP1 domain structure. Phosphosites S149 and S232 are depicted. IUPred, prediction of intrinsic disorder; FOLD, folding prediction using the foldindex (gray), PAPA (black), and PLAAC (magenta) algorithms; NCPR, net charge per residue with a sliding window of 10 residues; Net positive (cyan), net negative (magenta). Acidic clusters E1 and E2 are shown.
(B) G3BP1(WT) phase-separated fraction as a function of pH (mean, SD, fit, n = 20–40 FOVs). Top: fluorescence images of G3BP1(WT) at the indicated pH (scale bar, 5 μm).
(C) Fraction phase-separated of G3BP1 variants as a function of protein concentration under the specified conditions (mean, SD, fit, n = 20 FOVs).
(D) Fraction phase-separated of G3BP1, WT or variants, under the specified conditions (n = 10 FOVs).
(E) Csat of mCherry-G3BP1, WT (n = 414 cells), and ΔE1ΔE2 (n = 378 cells) overexpressed in U2OS G3BP1/2 KO cells.
(F) G3BP1 assembly kinetics upon oxidative stress in U2OS G3BP1/2 KO cells expressing mCherry-G3BP1 variants (WT, n > 20; ΔRG, n > 10; ΔE1ΔE2, n > 20 cells), assessed by the number of SGs per cell as a function of time. SEM is depicted in a light color.
Figure S2.

Related to Figure 2
A: Coomassie stained, non-native 4%–12% NuPage Bis-Tris gel showing ~1 μg of heterologous expressed and purified proteins. B: Phase diagram of G3BP1(WT) with control parameters KCl and protein concentration. Phase separation was scored by the absence or presence of G3BP1 condensates. C: Fluorescence images of G3BP1(WT)-RNA condensates before (top) and after (bottom) increasing the NaCl concentration from 30 mM to 280 mM. Scale bar, 10 μm. D: Phase diagram of G3BP1(ΔRG) as a function of protein and RNA concentration. (x) represent tested conditions and depicts that no condensates were present. E: Phase separated fraction of G3BP1(WT), G3BP1(ΔRG) and G3BP1(ΔNTF) as a function of PEG-20K concentration, in the absence of RNA (mean, SD, fit, n = 10 FOV). F: Fluorescence images of mCherry-Caprin-1 in the absence and presence of GFP-G3BP1. Scale bar, 10 μm. Right panel shows the quantification of the mCherry-Caprin-1 partition coefficient into G3BP1-RNA condensates as a function of G3BP1(WT) concentration. Caprin-1 concentration was 2.5 μM. G: EMSA to determine the apparent binding affinity of G3BP1 in the absence (gray) or presence of 1 μM mCherry-Caprin-1 (magenta). Quantification of one representative experiment is shown. H: Fluorescence images of indicated GFP-labeled client proteins partitioning into reconstituted SNAP(Alexa546)-labeled G3BP1-RNA condensates. Client proteins were added to preformed G3BP1-RNA condensates. As control, client proteins were tested in the absence of G3BP1-RNA condensates, showing that none of them phase separates (top panel) (scale bar, 10 μm). I: Fluorescent images of preformed FUS-GFP condensates (10 μM) in the presence of SNAP(Alexa546)-labeled G3BP1 (6 μM), in the absence of RNA. J: Fluorescence images of G3BP1(WT)-RNA condensates in presence of Cy3-labeled Ubc9(ts) and Ubc9(WT) (scale bar, 5 μm). Quantification of the mean average Cy3-Ubc9 fluorescence in G3BP1-RNA condensates is shown. K: Quantification of the diffusion times of Cy3-labeled Ubc9(ts) and Ubc9(WT) in solution, determined by FCS. Except for panels E and I, G3BP1-RNA condensates were formed in the presence of 75 ng/μl of total RNA (isolated from HeLa cells) and 1% PEG-20K.
Multivalent Interactions Are Critical for Phase Separation
The NTF2 domain dimerizes (Bullock et al., 1996, Kent et al., 1996) and is necessary for G3BP1 recruitment to SGs (Tourrière et al., 2003). Likewise, the RG-rich region is required for G3BP1 assembly upon stress (Bley et al., 2015, Tourrière et al., 2003). To test the roles of the NTF2 and the RG-rich region in phase separation, we purified GFP-G3BP1(ΔNTF) and GFP-G3BP1(ΔRG) (Figure S2A). Using a set of biophysical methods, we determined that G3BP1(ΔNTF) is monomeric, even at high micromolar concentrations, whereas G3BP1(wild-type [WT]) and G3BP1(ΔRG) formed stable dimers, even at nanomolar concentrations (Table S1). Unlike G3BP1(WT), G3BP1(ΔNTF) and G3BP1(ΔRG) did not assemble into condensates in the presence of RNA and 1% PEG (Figures 2E and S2D). This indicates that the RG-rich region is indispensable for assembly and that dimerization per se is insufficient but necessary for RNA-mediated condensate assembly in vitro.
Excess of RNA did not induce condensate dissolution (Figure 2B), indicating that G3BP1-RNA condensates may be stabilized by protein-RNA and protein-protein interactions. To test for protein-protein interactions, we induced G3BP1 phase separation in the absence of RNA by increasing PEG concentration. RNA-independent phase separation of G3BP1(WT) occurred at PEG concentrations of 4% or higher (Figure S2E). No phase separation was observed for G3BP1(ΔNTF), demonstrating that G3BP1 dimerization is also critical for RNA-independent assembly, presumably by doubling the valence of motifs that drive phase separation. In contrast to the WT, G3BP1(ΔRG) assembled at higher PEG concentrations (≥6%) (Figure S2E). These data indicate that the RG-rich region contributes relevant motifs involved in high-order protein-protein interactions that stabilize multivalent interactions necessary for RNA-dependent phase separation of G3BP1 dimers.
G3BP1-RNA Condensates Can Enrich Additional RBPs
To test whether reconstituted G3BP1-RNA condensates recruit other RBPs known to localize to SGs, we combined Alexa 546-labeled SNAP-G3BP1(WT) condensates with various purified GFP-tagged proteins. The concentration of the client proteins was kept below their saturation concentration (Figure S2H). Many SG clients partitioned into pre-formed G3BP1-RNA condensates, but GFP and the paraspeckle proteins PSPC and SFPQ did not enrich (Figures 2F and S2H). Partitioning of some RBPs into G3BP1-RNA condensates depended on the RNA type (total HeLa RNA versus poly(A) RNA) (data not shown), suggesting that client recruitment is at least partially determined by the RNA binding preference of the client. G3BP1 did not partition into pre-formed FUS condensates in the absence of RNA (Figure S2I), demonstrating that G3BP1 and FUS do not readily interact. This suggests that FUS recruitment to G3BP1-RNA condensates is a consequence of FUS binding to RNA. In the context of the stress response, our data suggest that G3BP1-RNA condensates act as a scaffold to which other RBPs are recruited.
Caprin-1 Promotes Phase Separation by Lowering the Saturation Concentration of G3BP1
The RBP Caprin-1 interacts with G3BP1 (Reineke et al., 2017, Youn et al., 2018) and is essential for SG assembly (Kedersha et al., 2016). Purified mCherry-Caprin-1 did not phase separate in the presence of RNA (Figures S2A and S2F) even though it contains RGG repeats (Solomon et al., 2007). Caprin-1 weakly enriched in pre-formed G3BP1-RNA condensates (Figure S2F) and reduced the threshold for RNA-driven phase separation (Figure 2G). The decreased saturation concentration of G3BP1 may be explained by Caprin-1 increasing the RNA-binding affinity of G3BP1 (Figure S2G) (for technical details, refer to G3BP1 Condensates Inhibit RNA Entanglement). We propose that Caprin-1 potentiates SG assembly by a process known as polyphasic linkage (Wyman and Gill, 1980), where the preference of the ligand Caprin-1 for partitioning into G3BP1-RNA condensates reduces the saturation concentration of G3BP1.
Reconstituted G3BP1-RNA Condensates Recapitulate Aspects of Disease
Accumulation of misfolded proteins within SGs can trigger a transition from a fluid- to a solid-like state that is associated with disease (Alberti and Hyman, 2016, Ganassi et al., 2016, Mackenzie et al., 2017, Mateju et al., 2017, Molliex et al., 2015, Patel et al., 2015). To reconstitute the liquid-to-solid transition of condensates in vitro, we added Ubc9(ts) (Figure S2A), a protein carrying a destabilizing temperature-sensitive mutation, to G3BP1-RNA condensates at permissive temperatures. Ubc9(ts) was slightly more enriched in G3BP1-RNA condensates compared to Ubc9(WT) (Figure S2J). G3BP1-RNA condensates in the absence or presence of equimolar Ubc9(WT) exhibited comparable fusion times, whereas the fusion times increased in the presence of Ubc9(ts) (Figure 2H; Video S3). The diffusion of Ubc9(ts) inside of G3BP1-RNA condensates was slower compared to Ubc9(WT) and the immobile fraction of Ubc9(ts) increased with time (Figures 2I and 2J). Importantly, Ubc9(ts) did not aggregate in solution (Figure S2K). These results suggest that the destabilized form of Ubc9 interacts more strongly with G3BP1-RNA condensates, subsequently solidifies, and inhibits condensate coalescence. Thus, aberrant interactions with misfolding-prone proteins inside condensates serve as nucleation sites for off-pathway aggregation that can ultimately change the material properties of the condensates.
Taken together, our reconstituted condensates recapitulate key features of G3BP1-positive SGs in cells. Hence, we used reconstituted G3BP1 condensates to study the molecular mechanisms driving SG assembly.
Unfolded RNA Drives Assembly of G3BP1 Condensates
We next focused on the mechanism by which mRNA is specifically deposited in SGs. This specificity could be achieved through intermolecular base-pairing of RNA (Van Treeck et al., 2018, Van Treeck and Parker, 2018) or by specific protein factors, with G3BP1 being a good candidate.
First we investigated whether in vitro phase separation of G3BP1 depends on specific types of RNAs. Total RNA and mRNA from human spinal cord induced phase separation of G3BP1, whereas ribosomal RNA (rRNA), the non-coding RNA NEAT1 (Clemson et al., 2009, Lin et al., 2018), and a synthetic 5-Loop RNA (Hoell et al., 2011) were not efficient in inducing G3BP1 assemblies (Figures 3A and S3A). To test whether the poly(A) tail of mRNAs is necessary to drive G3BP1 phase separation, we polyadenylated the 5-Loop RNA. Phase separation of G3BP1 was more efficient with polyadenylated 5-Loop RNA (Figures S3A and S3B). This result could be explained by G3BP1 specifically binding to long adenine-rich polynucleotides or to long unfolded regions in the RNA. Indeed, rRNA, NEAT1, and 5-Loop RNAs are highly structured. To distinguish sequence specificity from structural determinants, we compared the effects of poly(A), poly(C), poly(G), and poly(U) RNAs on G3BP1 phase separation (the homopolymeric RNAs were polydisperse in length; STAR Methods). All homopolynucleotides induced phase separation of G3BP1 (Figure 3B), demonstrating that G3BP1 does not interact exclusively with poly(A). A shorter poly(A) RNA (A60) did not induce phase separation of G3BP1 (Figure 3B), suggesting that the valence of nucleobases is important for establishing a network of interactions among RNA and G3BP1 molecules. We hypothesized that long unfolded RNA molecules are recognized by G3BP1. In agreement, G3BP1 formed condensates with unfolded rRNA, whereas minimal phase separation was observed with natively folded rRNA (Figure 3C). Moreover, entangled total RNA, in which extensive RNA-RNA interactions had already been established, did not induce G3BP1 phase separation (Figures 3D and S3C; Jain and Vale, 2017). We conclude that the specific binding of G3BP1 to long unfolded RNA regions drives SG assembly. Long unfolded regions are likely to be present in mRNAs that are released from polysomes upon stress (Adivarahan et al., 2018, Chen et al., 2013, Khong and Parker, 2018, Mao et al., 2014, Qu et al., 2011).
Figure 3.

G3BP1 Condensate Assembly Requires Long Unfolded RNA and Prevents RNA Entanglement
(A) Fluorescence images and quantification of the phase-separated fraction of G3BP1(WT) with total RNA, mRNA, ribosomal RNA (rRNA), or NEAT1 RNA (n = 10 FOVs).
(B) Fluorescence images of G3BP1(WT) with synthetic homopolymeric RNAs (STAR Methods).
(C) Fluorescence images and quantification of the phase-separated fraction of G3BP1(WT) with folded and temperature-unfolded rRNA (n = 35 FOVs).
(D) G3BP1(WT) phase separation with native total RNA or entangled RNA as a function of protein concentration (mean, SD, fit, n = 25 FOVs).
(E) PEG-induced poly(G) RNA tangles with or without G3BP1 variants. Bright field (BF), RNA stained with F22.
(F) Fusion of G3BP1-poly(G) condensates (magenta) at different time points after formation, assessed with dual-trap optical tweezers. Poly(G) tangles (dashed line) did not fuse.
(G) Analysis of the A(60)-Cy5 RNA fraction bound to G3BP1 variants as a function of protein concentration, determined by EMSA.
Scale bars, 10 μm, except 3 μm in (F).
See also Figure S3.
G3BP1 Condensates Inhibit RNA Entanglement
SGs were initially proposed to shut down translation upon stress. More recent studies, however, suggest that stressed cells arrest translation independent of SGs (Bley et al., 2015, Kedersha et al., 2016, Mollet et al., 2008). We found that the kinetics and degree of translational shutdown and recovery upon transient oxidative stress were indistinguishable between cells expressing G3BPs and cells in which G3BPs were deleted (Figures S3D–S3F). SG assembly is triggered by a sudden release of protein-free and unfolded mRNAs from polysomes, which is unusual considering that mRNAs are coated with RBPs (Mitchell and Parker, 2014, Müller-McNicoll and Neugebauer, 2013). We hypothesized that high amounts of free and unfolded mRNA could lead to RNA entanglement through aberrant RNA-RNA interactions and that G3BP1-RNA condensation could prevent it. We induced poly(G) RNA entanglement with high PEG concentrations (Van Treeck et al., 2018) in the absence and presence of G3BP1. Poly(G) RNA adopted an amorphous tangled state (Figure 3E). When poly(G) RNA was premixed with G3BP1(WT), spherical G3BP1-poly(G) condensates formed (Figure 3E). Although poly(G) tangles stuck to each other, G3BP1-poly(G) condensates coalesced when brought together with optical tweezers (Figure 3F), demonstrating that G3BP1 facilitates a liquid-like assembly that inhibits RNA entanglement. The fusion time of the condensates increased monotonically with time (Figure 3F), suggesting that G3BP1 dynamically interacts with the RNA and that strong RNA-RNA interactions are established over time.
Considering the critical role of the NTF2 domain and the RG-rich region for G3BP1 condensate assembly, we compared the ability of these variants to bind RNA and prevent RNA entanglement. First, we determined the apparent KD of G3BP1 variants for A(60) RNA. A(60) RNA was chosen to prevent G3BP1 phase separation. G3BP1(WT) exhibited a high KD (∼2.0 μM) for A(60) RNA and bound the RNA cooperatively (apparent Hill coefficient, ∼4.5) (Figures 3G and S3G). Long poly(A) RNA efficiently competed at ∼5-fold sub-stoichiometric molarities with the binding of A(60) RNA to G3BP1 (Figure S3H). Thus, G3BP1 is likely to bind cellular RNAs with greater affinity than the one determined with A(60). RNA binding did not depend on dimerization, as monomeric G3BP1(ΔNTF) bound RNA with an affinity (apparent KD, ∼1.7 μM) comparable with that of G3BP1(WT) (Figures 3G and S3G). G3BP1(ΔRG) bound RNA with a slightly decreased affinity (apparent KD, ∼3.8 μM) and less cooperatively (apparent Hill coefficient, ∼2.3) compared with G3BP1(WT) (Figures 3G and S3G). This suggests that G3BP1(ΔRG) binds RNA via the RRM and that the RG-rich region enhances cooperative binding.
Despite the ability of G3BP1(ΔNTF) to bind RNA efficiently (Figures 3G and S3G), it did not prevent RNA entanglement, indicating that binding of G3BP1 to RNA is insufficient to prevent aberrant RNA-RNA interactions (Figure 3E). Next we asked whether the presence of condensates is sufficient to prevent RNA entanglement. G3BP1(ΔRG) condensates formed in the presence of PEG (Figure S2E) enriched poly(G) RNA and inhibited RNA entanglement, although the condensed phase was less than for G3BP1(WT) (Figure 3E). This indicates that the already high concentration of RNA binding sites within the condensate inhibits strong RNA-RNA interactions. We propose that G3BP1 condensates recruit RNA into fluid structures to inhibit strong, and most likely irreversible, RNA-RNA interactions.
The Central Acidic Disordered Region of G3BP1 Is a Negative Regulator for Phase Separation
G3BP1 contains a negatively charged, glutamate-rich (E-rich) region that is predicted to be intrinsically disordered (Tourrière et al., 2003, Tsai et al., 2016; Figure 4A). Despite almost no sequence conservation, the presence of an acidic glutamate-rich IDR is highly conserved (Figures S7B and S7C). We hypothesized that this IDR could be involved in setting the saturation concentration of G3BP1.
Figure S7.

A: Schematic representation of G3BP1 and G3BP2 domains, with the content of Arginine residues within the RG-rich region highlighted. Below, a sequence alignment of G3BP1 and G3BP2 RG-rich region. Arginine residues depicted in cyan. B: The sequence conservation of 339 G3BP1/2 orthologs was determined. The two folded domains are highly conserved, while the IDRs show virtually no absolute sequence conservation, except for a highly conserved binding motif in the PxxP domain which we speculate mediates recruitment of other key component(s). C: Despite having almost no sequence conservation, the region that would correspond to the acidic IDR (magenta) is almost uniformly highly acidic across all orthologous G3BP1/2 sequences.
The carboxyl group of the glutamate side chain has an intrinsic pKa of 4.25, but glutamate side chains embedded in acidic clusters can have upshifted pKa that can be as high as 6.5 (Fossat and Pappu, 2019, Franzmann et al., 2018, Harris and Turner, 2002, Ruggeri et al., 2017). We examined the phase separation of G3BP1(WT) as a function of pH in the presence of RNA but in the absence of PEG. Although phase separation of G3BP1(WT) was minimal at neutral pH, the fraction of phase-separated protein increased as the pH was lowered below 7.0 (Figure 4B). We hypothesized that the acidic IDR inhibits G3BP1 phase separation and that pH-dependent protonation of the clustered glutamates relieves this inhibition.
To provide evidence of a regulatory role of the acidic IDR, we designed two deletion variants (G3BP1(ΔE1) and G3BP1(ΔE2)) in which two conspicuous clusters of glutamates were removed (Figure 4A; Table S1). Although G3BP1(WT) did not undergo phase separation at neutral pH in the presence of RNA and absence of PEG, both deletion variants formed condensates even at low protein concentrations (Figure 4C). Lowering the pH further decreased the saturation concentration of the deletion variants and promoted phase separation even in the absence of RNA (Figures S4A and S4B). To test whether the two glutamate clusters act in concert to inhibit G3BP1 phase separation, we generated the G3BP1(ΔE1ΔE2) variant. All three E-deletion variants phase-separated more efficiently than G3BP1(WT) following an increase in the fraction phase-separated as a function of the charge depletion (Figure 4D). G3BP1(ΔE1ΔE2) formed condensates at neutral pH independent of RNA and PEG (Figure 4D), highlighting that the acidic region exerts an autoinhibitory role that ensures RNA-dependent G3BP1 phase separation. We confirmed this finding in U2OS G3BP1/G3BP2 knockout (KO) cells by taking advantage of the stochasticity of transient transfection. In non-stressed cells, overexpression of G3BP1(WT) yielded SGs in a concentration-dependent manner (Figure 4E). Compared with the WT, the saturation concentration of the ΔE1ΔE2 variant was reduced (Figure 4E), demonstrating that the E-stretch exerts its autoinhibitory effect in living cells. The onset of sodium arsenate-induced SG assembly was decreased for cells expressing G3BP1(ΔE1ΔE2) compared with G3BP1(WT) (Figure 4F), but the differences in the kinetics were small. We interpret this result to reflect the fact that, under stress conditions, the mRNA release from polysomes is the main driver of SG assembly (Figure 1C). Although the number of SGs formed by G3BP1(WT) decreased after the initial growth phase, the number of SGs formed by G3BP1(ΔE1ΔE2) remained high (Figure 4F), suggesting an impairment of coalescence. In agreement with the acidic IDR also being a determinant of the viscoelastic properties of G3BP1 in the condensed phase, the average size of SGs formed by G3BP1(ΔE1ΔE2) was smaller (Figures S4C and S4D). We conclude that the acidic IDR is a negative regulator of G3BP1 phase behavior that locks G3BP1 in a state that disfavors phase separation.
Figure S4.

Related to Figure 4
A: Phase separated fraction of G3BP1(WT) in comparison to G3BP1(ΔE1) and G3BP1(ΔE2) variants. Phase separation was probed at pH 6 with 75 ng/μl HeLa total RNA and without PEG-20K (mean, SD, fit, n = 20 FOV). B: Quantification of the phase separated fraction of G3BP1 variants in the absence of RNA and PEG-20K, at pH 6 or 7 (mean, SD, fit, n = 20 FOV). C: Left: Quantification of the SG size in live U2O2 G3BP1/2 KO cells transfected with plasmids for expression of mCherry-G3BP1, WT (n = 1013 cells) or ΔE1ΔE2 (n = 1061 cells). Right: representative images of U2OS G3BP1/2 KO cells expressing mCherry-tagged G3BP1(ΔE1ΔE2) or G3BP1(WT), before and 60 min after addition of 1 mM sodium arsenate. Scale bar, 10 μm. D: Immunoblot for expression levels of mCherry-G3BP1 variants in G3BP1/2 KO cells. Tubulin was used as loading control. E: Left: Coomassie (CBB) stained non-native SDS-PAGE showing ~1 μg of purified GFP-labeled G3BP1(WT), G3BP1(S149A), G3BP1(S149E) and G3BP1(S149A/S232A). Right: Immunoblot (IB) against G3BP1 phospho-serine residue 149. From left to right: G3BP1(WT), G3BP1(S149A), dephosphorylated G3BP1(WT) (+PPase). Sample loading was controlled with antibodies against GFP. F: Left, phase separated fraction of G3BP1(WT) phosphorylated (gray) or dephosphorylated (green) with Lambda-phosphatase as a function of pH (mean, SD, fit, n = 16 FOV). Right, phase separated fraction of G3BP1(WT) (gray), G3BP1(S149A) (blue), G3BP1(S149E) (cyan) and G3BP1(S149A/S232A) (green) as a function of pH (mean, SD, fit, n = 25 FOV). Phase separation was tested in the presence of 75 ng/μl of poly(A) RNA and absence of PEG-20K.
The acidic IDR is flanked by residues S149 and S232, both of which can be phosphorylated (Hornbeck et al., 2015; Figure 4A). The role of these phosphosites in SG assembly is still under debate (Panas et al., 2019, Sahoo et al., 2018). We hypothesized that phosphorylation of G3BP1 could be a mechanism to tune the saturation concentration by altering the net negative charge of the acidic IDR. G3BP1(WT) purified from insect cells was phosphorylated on both sites (Figure S4E and mass spectrometry analysis, data not shown). Dephosphorylation of G3BP1(WT) reduced the saturation concentration (Figure S4F). Compared with phosphorylated G3BP1(WT), G3BP1(S149A) had a reduced saturation concentration, which was even lower for G3BP1(S149A/S232A) (Figure S4F). Conversely, the phosphomimetic G3BP1(S149E) showed intermediate behavior, phase-separating less efficiently than G3BP1(S149A) but more efficiently than G3BP1(WT) (Figure S4F). All phospho-variants formed stable dimers, as opposed to previous reports suggesting that phosphorylation induces monomerization of G3BP1 (Figure S4E; Table S1; Tourrière et al., 2003).
Taken together our data demonstrate that the net charge of the acidic IDR is a determinant of the saturation concentration of G3BP1. Reversible phosphorylation may be one mechanism that cells employ to tune the sensitivity of G3BP1 toward RNA-mediated phase separation, likely as part of a more complex regulatory system.
Intramolecular Interactions between the RG-Rich Region and the Autoinhibitory Acidic Region Regulate G3BP1 Phase Separation
At least two non-mutually exclusive mechanisms exist by which the acidic IDR could influence the saturation concentration of G3BP1: (1) the net-negative charge of the IDR could increase the solubility of G3BP1, and/or (2) the acidic IDR could interact with the positively charged RG-rich region and compete for RNA-protein and/or protein-protein interactions. All-atom simulations identified long-range electrostatic interactions between the RG-rich region and the acidic IDR in a G3BP1(ΔNTF) monomeric construct (Figures 5A and 5B; S5A and S5B). These electrostatic interactions drive global chain compaction. We measured the dimensions of G3BP1 using dynamic light scattering (DLS) and fluorescence correlation spectroscopy (FCS). G3BP1(WT) diffused as a dimer with an apparent hydrodynamic radius (RH) of 5.9 nm (±0.3 nm) (Figure 5C; Table S1). For reference, simulations of dimeric G3BP1, based on a self-avoiding representation for the disordered regions, yielded a RH of ∼10 nm (Figure 5C), demonstrating that the dimer in solution is more compact. The compaction decreased as a function of increased salt concentration (Figure 5D), implying that screening of the electrostatic interactions causes chain expansion. Accordingly, the RH of G3BP1(ΔRG) increased by ∼13% compared with WT and deletion of the E1 or E2 clusters led to a broader distribution for the RH (Figure 5E), supporting the idea of a heterogeneous conformational ensemble that includes expanded and compact states that exchange with one another.
Figure 5.

Interactions between RG-Rich and Autoinhibitory Acidic IDRs Regulate G3BP1 Phase Separation
(A) Conformational snapshot of G3BP1 from an excluded volume (EV) simulation (instantaneous RH, ∼11 nm).
(B) Normalized distance between any pair of residues in G3BP1(ΔNTF2) simulations. Cooler colors are closer together, and warmer colors are farther apart. Dashed lines delineate domains.
(C) RH for G3BP1 dimers, inferred from FCS measurements and EV simulations of full-length dimeric G3BP1 with generic, self-avoiding descriptions for the IDRs.
(D) RH of G3BP1(WT) as a function of KCl concentration, determined by DLS. Fit shown with a dashed line.
(E) RH of G3BP1 variants, determined by FCS.
(F) RH of G3BP1(WT) at pH 6 and pH 7.5, determined by DLS.
(G) Oligomeric species of G3BP1(WT) at pH 6 or pH 7.5, detected by DLS. Shown is the mean average (n = 30).
(H) Analytical gel filtration of G3BP1(WT) and G3BP1(ΔRG) on A(60) RNA as a function of RNA concentration.
Significance levels: ∗ < 0.05, ∗∗ < 0.01, ∗∗∗ < 0.001. See also Figure S5.
Figure S5.

Related to Figure 5
A: Homology model sequence alignment for G3BP1-RRM. Model parameters are robust, and the resulting homology model is structurally reasonable and high-confidence. B: The intramolecular distances between the acidic tract and the RG-rich region are substantially lower in full Hamiltonian simulations (Full) than would be expected based on a generic self-avoiding description of the IDR (Excluded Volume, EV). This result highlights the importance of intramolecular attractions between the acidic tract and the RG-rich region. C: Left, comparison of the hydrodynamic radius (RH) of phosphorylated G3BP1(WT) (indicated with ‘P’) and dephosphorylated G3BP1(WT). Right, RH of phosphorylated G3BP1(WT) and G3BP1(S149A/S232A). RH was determined by FCS. D: Right, EMSA to determine the apparent binding affinity of G3BP1(WT), G3BP1(ΔE1), G3BP1(ΔE2) and G3BP1(S149A) to A(60)-Cy5 RNA. Black arrow points toward free A(60)-Cy5 RNA. ∗ indicates shifted RNA species due to G3BP1 binding. The quantification of the EMSAs is shown on the left (G3BP1(WT): KD ~2.0 μM; G3BP1(S149A): KD ~1.9 μM; G3BP1(ΔE1): KD ~1.9 μM; G3BP1(ΔE2): KD ~1.7 μM). E: RH of G3BP1(WT) at pH 6 and 85 mM KCl and after increasing the KCl concentration to 400 mM, determined by DLS (mean average of 6 measurements). On the left, the increase of RH of the G3BP1(WT) dimer upon increasing KCl concentration is shown. On the right, the oligomeric species of G3BP1(WT) are depicted. Note that the intensity of the oligomer decreases at 400 mM KCl.
Dephosphorylated G3BP1(WT) as well as G3BP1(S149A/S232A) adopted more expanded conformations in solution compared with phosphorylated G3BP1(WT) (Figure S5C), demonstrating that the net charge of G3BP1 determines its compactness. Consistent with this idea, G3BP1 adopted a more expanded state at pH 6.0 compared with pH 7.5 (Figure 5F). Importantly, the saturation concentration of RNA-mediated G3BP1 phase separation was reduced at pH 6.0 (Figures 4B, 4C, and S4A). Taken together, our data support a coupled conformational equilibrium in which the compact state of G3BP1 is stabilized by intramolecular electrostatic interactions between the acidic IDR and the RG-rich region. Destabilization of these interactions causes G3BP1 expansion, facilitating intermolecular protein-RNA and/or protein-protein interactions that drive condensation.
The conformational dynamics of G3BP1 could regulate the RNA-binding affinity or the affinity between G3BP1 molecules. Both E cluster deletion variants as well as the S149A phospho-null variant, exhibited RNA-binding affinities comparable with G3BP1(WT) (Figure S5D). This suggests that the acidic IDR does not regulate the RNA-binding affinity of G3BP1 but, instead, modulates the interplay between intra- and intermolecular protein-protein interactions.
G3BP1 Forms Reversible Oligomers in an RG-Rich Region-Dependent Manner
DLS revealed a small oligomeric fraction of G3BP1 at neutral pH. This oligomeric fraction increased at pH 6.0 and was reduced by increasing the salt concentration (Figures 5G and S5E), demonstrating that G3BP1 oligomers are in reversible equilibrium with dimers. Additionally, electrophoretic mobility shift assay (EMSA) experiments identified an RNA-bound oligomeric species for G3BP1(WT), G3BP1(S149A), and the E cluster deletion variants, suggesting that these variants associate into larger oligomeric species when bound to RNA (Figure S5D). The oligomeric species was not detected for the G3BP1(ΔRG) variant (Figure S3G). Presumably, the RG-rich region engages in protein-protein interactions when bound to RNA, stabilizing an oligomeric state of RNA-bound G3BP1. We analyzed G3BP1(WT) and G3BP1(ΔRG) at increasing concentrations of A(60) RNA by analytical size exclusion chromatography. G3BP1(WT) in the absence of RNA eluted as a dimer with a retention volume of ∼10.5 mL (Figure 5H). The elution peak shifted toward smaller retention volumes in the presence of RNA, indicating formation of higher-molecular-weight complexes (Figure 5H). G3BP1(ΔRG) did not assemble into larger oligomeric complexes and eluted as a dimer irrespective of A(60) (Figure 5H). These results show that the RG-rich region of G3BP1 increases the RNA-binding affinity and mediates protein-protein interactions that stabilize G3BP1 molecules in complex with RNA.
Clusters of G3BP1 Crosslink Unfolded RNA Molecules to Form Condensates
We generated an ultra-coarse-grained computational model (Figure 6A) to predict emergent structures that result from the interplay among protein-protein and protein-RNA interactions involving distinct modules of G3BP1. For simplicity, our model was designed to describe homopolymeric RNAs (as in Figure 3B). Although our model did not encode RNA-RNA interactions, such interactions most likely do occur for non-homopolymeric RNAs and provide an additional layer of intra-condensate interactions. We first examined the effects of G3BP1-RNA interactions with a short (∼60-nt) RNA. For a model in which weak RG-mediated protein-protein interactions were allowed, the simulations indicated that G3BP1 oligomerizes on short RNA molecules without driving phase separation (Figures 6B and 6C). Larger numbers of higher valence oligomers were formed as the RNA concentration was increased. When RG-RG interactions were ablated, neither RNA binding nor oligomerization was observed (Figure 6B).
Figure 6.

Ultra-coarse-grained Simulations Reveal RNA-Dependent Clusters of G3BP1
(A) A G3BP1 dimer is coarse-grained into a two-bead model, with one bead capturing the NTF2 domain and central IDRs and the other bead capturing the RRM and RG-rich region. The RNA is coarse-grained so that each “bead” represents 8–10 nt. The interaction strength between distinct beads is shown.
(B) Analysis of RNA-mediated G3BP1 oligomerization for simulations of G3BP1, WT or ΔRG, with short RNA.
(C) Simulation snapshots illustrate the cooperative nature of oligomerization, demonstrating the coexistence of fully decorated short RNA molecules and predominantly unbound RNA molecules.
(D) Simulations with long RNA yield clusters that form on the RNA and act as crosslinkers between RNA-RNA interactions.
(E) Schematic highlighting the clusters as physical crosslinks.
(F) X-Y cross-sectional slice of a refractive index tomogram of G3BP1-RNA condensates. Scale bar, 10 μm.
(G) Refractive index and total concentration inside G3BP1-RNA condensates (n = 187 condensates).
(H) Concentration of G3BP1 inside versus outside the condensate (n = 437 condensates).
G3BP1-RNA condensates in F-H were formed with 50 ng/μl poly(A) RNA. See also Figure S6 and Video S4.
Our simulations indicated that some RNA molecules were coated with G3BP1, whereas others lacked bound protein (Figure 6C). This pearl necklace architecture is a hallmark of cooperative binding (Dubiel et al., 2019, Lohman and Ferrari, 1994). In our simulations, RNA-bound G3BP1 exchanged with a soluble pool of dimers, pointing to dynamic oligomers. These results suggest that RNA provides a surface upon which protein-protein interactions can occur.
We next considered systems with longer RNAs (800–1,000 nt). G3BP1 formed dynamic clusters of ∼50–100 G3BP1 dimers that decorated the long RNA molecules (Figure 6D). These clusters interacted with one another (and with RNA) to physically crosslink RNA molecules, forming an expanded meshwork that gave rise to higher-order assembly. We predicted that protein-protein interactions drive two distinct layers of cooperativity: cluster formation and inter-cluster crosslinking. Thus, our results suggest that G3BP1-RNA condensates are not a uniformly dense environment. Instead, clusters accumulate at distinct foci along the RNA, acting as emergent “stickers” (Figure 6E) (Choi et al., 2020 ). Overall, G3BP1-RNA condensates are predicted to have mesh-like structures with inhomogeneous distributions of crosslinks.
Based on the simulations, the concentration of G3BP1 in the condensates will be low because G3BP1 is mainly a physical crosslinker among RNA molecules. Thus, we used optical diffraction tomography to determine the total concentration of G3BP1-RNA condensates from refractive index measurements. G3BP1-RNA condensates had a refractive index of ∼1.35 (Figures 6F and 6G); thus, the total mass concentration in G3BP1-RNA condensates averaged ∼65 mg/mL (Figure 6G). This was substantially lower than estimates for protein-only condensates, which can reach ∼400 mg/mL (Brady et al., 2017, Burke et al., 2015). G3BP1 was enriched ∼7-fold within G3BP1-RNA condensates (Figures S6A and S6B), reaching a total concentration of ∼1 mg/mL (∼15 μM) (Figure 6H). This effective low concentration of G3BP1 supports our notion that G3BP1 acts as a cross-linker of long unfolded RNA molecules and demonstrates that reconstituted G3BP1-RNA condensates consist predominantly of RNA (∼64 mg/mL poly(A) RNA). We further tested our predictions using cryoelectron microscopy (cryo-EM) (Figures S6C–S6F; Video S4), which revealed that G3BP1-RNA condensates are indeed inhomogeneous and suggested that G3BP1 forms clusters that are spaced apart (presumably by RNA-mediated crosslinks that are too thin to be resolved).
Figure S6.

Related to Figure 6
A: Calibration curve of GFP fluorescence as a function of GFP concentration. B: Quantification of GFP-G3BP1 enrichment within G3BP1-RNA condensates, as determined by fluorescence intensity inside/outside condensates. C: Cryo-EM image of G3BP1-RNA droplets deposited post fixation on a holey film EM grid. Arrowheads point to droplets partially deposited in the holes of the film that are amenable for tomographic tilt series acquisition. D: Tomographic slice, 4 nm in thickness, of a G3BP1-RNA droplet. Putative naked RNA molecules are observed outside the droplet. Multiple ‘beads on a string’ are observed inside the droplet and may be interpreted as G3BP1 molecules bound to RNA. The dense beads are 3-4 nm in diameter, and regularly appear in pairs. Occasionally, larger clusters (30-40 nm diameter) of beads are observed. E: Zoom into cluster in D. For the full tomographic volume, see Video S4. F: Additional examples of clustering and pairs of ‘beads on a string’ from a different tomographic slice of the same droplet.
and S6 Scale: 40 nm; each slice is 4 nm.
Our simulations predicted that G3BP1 clusters engender a multivalence of RG-rich regions. This should give rise to a multivalence of arginine motifs, which are known to serve as stickers that enable physical crosslinks (Harmon et al., 2017b, Posey et al., 2018, Wang et al., 2018). The extent of crosslinking and condensate assembly should be controlled by the valence of arginine residues within RG-rich regions. G3BP2 is a G3BP1 homolog with more arginine residues within the RG-rich region (Figure S7A). Indeed, the phase-separated fraction was higher for G3BP2 compared with G3BP1 in protein-only systems (Figure 7A) and in RNA-dependent phase separation (Figure 7B). Like G3BP1, G3BP2 also adopted a compact state that was stabilized by electrostatic interactions (Figure 7C). DLS measurements also revealed that G3BP2 formed reversible oligomers at pH 7 (Figure 7D), as opposed to G3BP1, for which oligomers were only evident when the intramolecular interactions were weakened at pH 6 (Figure 5G). Although G3BP2 formed oligomers at pH 7, it still required RNA to phase-separate at low PEG concentrations (Figures 7A and 7B). We conclude that the higher valence of arginine residues within the RG-rich region renders G3BP2 more prone to oligomerize and, consequently, more efficient to form condensates together with RNA.
Figure 7.

The Valence of Arginine Residues within the RG-Rich Region Determines the Efficiency of G3BP Phase Separation
(A) Phase separated fraction of 5 μM G3BP1 or G3BP2 as a function of PEG-20K concentration without RNA (mean, SD, fit, n = 16 FOVs).
(B) Phase-separated fraction of G3BP1 and G3BP2 as a function of G3BP concentration with poly(A) RNA and 1% PEG-20K (mean, SD, fit, n = 16 FOVs).
(C) RH of G3BP2 at pH 7 and 85 mM KCl (solid line) or after increasing the KCl to 400 mM (dashed line), as determined by DLS (mean average of 6 measurements).
(D) DLS measurement of the oligomeric species of G3BP2 at pH 7 and 85 mM KCl or after increasing the KCl to 400 mM (mean average of 6 measurements).
(E) Model depicting an RNA-mediated conformational transition of G3BP into a phase-separation competent state (top panel). Under physiological conditions, G3BP adopts a compact state (left) that is stabilized by intramolecular interactions between the RG-rich region and the acidic region. The compact state inhibits G3BP phase separation. Upon stress, polysomes disassemble, and mRNAs are released in an unfolded protein-free state. Binding of unfolded mRNA to G3BP outcompetes the intramolecular interactions between the RG-rich and the acidic regions. RNA-bound G3BP adopts an expanded conformation in which the RG-rich region becomes exposed to engage in protein-protein and protein-RNA interactions. These new interactions among RG-rich regions stabilize clusters of G3BP1 bound to RNA (bottom panel). RNA-mediated G3BP clusters allow physical crosslinking of RNA molecules to form inhomogeneous protein-RNA condensates.
See also Figure S7.
Discussion
A prevailing challenge in the condensate field is to understand how nanoscale conformational transitions and interactions drive the assembly of micron-sized cellular structures with high spatial and temporal precision. Here we focused on the molecular mechanisms underlying SG assembly. We demonstrate that SGs form by phase separation and provide a mechanistic understanding of how interactions between G3BP and unfolded, protein-free RNA molecules that are released during stress from polysomes drive SG assembly. Our data support a model in which RNA-induced conformational switching of G3BP promotes condensate assembly with specificity for unfolded RNA to inhibit strong RNA-RNA interactions, hinting at a potential role of G3BP as an RNA chaperone.
Phase separation requires establishment of a network of multivalent interactions (Banani et al., 2017). For RNA-driven G3BP1 phase separation, the increase in valence is partly contributed by the RNA and by the ability of G3BP1 to dimerize. The molecular mechanism underlying regulation of available valences for phase separation is the ability of G3BP to undergo an RNA-induced conformational rearrangement. Under non-stress conditions, G3BP dimers adopt an autoinhibited compact state that sequesters the RG-rich region through electrostatic interactions with the central acidic IDR. Upon stress, released mRNA outcompetes this intramolecular interaction and induces expansion of G3BP, releasing the RG-rich region to engage in multivalent heterotypic protein-RNA and homotypic intermolecular protein-protein interactions, which allow cooperative binding of RNA and condensate assembly (Figure 7E). Indeed, multivalent intermolecular interactions among G3BP dimers can be established independent of RNA and are facilitated by the RG-rich region. However, these interactions require either high local protein concentrations or removal of the inhibitory acidic IDR. The sequence-encoded arginine content in the RG-rich region of G3BPs provides control over the driving forces for condensation. The transition from a compact to an expanded state is the crucial molecular event that switches G3BP from an auto-inhibited state defined by intramolecular interactions to a multivalent state in which intermolecular interactions dominate. This mechanism of conformationally controlled multivalence may be a more general feature of scaffold proteins that drive condensate assembly via phase separation. In fact, many RBPs have similar architectures as G3BP and, thus, could use a comparable mechanism for conformationally regulated, RNA-dependent RNP granule assembly.
How can cells tune the sensitivity of RNA-dependent conformational switching? We propose that the conformational transition and the phase behavior of G3BP are regulated by site-specific phosphorylation at S149 and S232. These phosphorylation sites are conserved between G3BP1 and G3BP2 and flank the acidic IDR. Changes in S149 phosphorylation state were thought to affect SG assembly (Kedersha et al., 2016, Reineke et al., 2017, Tourrière et al., 2003). However, a recent study has called the effect of the used phosphomimetic G3BP variants into question (Panas et al., 2019). Together with (Yang et al., 2020) and (Sanders et al., 2020), we reinvestigated the role of G3BP phosphorylation and found that phosphorylation of S149 and S232 diminishes the driving force of phase separation, presumably by tuning the strength of the auto-inhibitory interaction between the acidic and the RG-rich IDRs. This provides a first example of how post-translational modifications could regulate the transition of a molecule into a multivalent state to promote condensate assembly.
The reconstituted condensates primarily consist of RNA crosslinked by clustered G3BP molecules. The amount of clustered G3BP is small in these condensates, and not all binding sites on the RNA molecules appear to be saturated. Indeed, a wide range of RBPs that are known clients of SGs in cells enrich within reconstituted condensates, likely through specific RNA binding. Many of these RBPs are nuclear and must leave the nucleus before they accumulate in cytoplasmic SGs. Our data suggest that G3BP-RNA condensates act as recruiting centers and assembly platforms for various RBPs because of the high RNA concentration within the condensates and the specific RNA-binding preferences of the client RBPs.
One special RBP we tested is the G3BP-interacting protein Caprin-1 (Solomon et al., 2007). Caprin-1 is a cytoplasmic protein that only weakly partitions into G3BP1-RNA condensates but shifts the saturation concentration by an order of magnitude. The effect of Caprin-1 is explained by the concept of polyphasic linkage (Wyman and Gill, 1980). In this scenario, preferential binding of a ligand to scaffold molecules in the condensate will lead to a downshift in saturation concentrations. Our results point to a three-way linkage phenomenon involving G3BP1, RNA, and Caprin-1, which is supported by the finding that the affinity of G3BP1 for RNA increases in the presence of Caprin-1. This is likely to be a more general phenomenon that might extend to other SG proteins such as UBAP2L, CSDE1, and PRRC2C (Markmiller et al., 2018, Youn et al., 2018). Thus, regulation of scaffold molecules through polyphasic linkage could be an important mechanism of adapting the saturation concentrations of phase-separating protein systems in response to environmental stimuli.
In agreement with previous work (Bley et al., 2015, Kedersha et al., 2016, Mollet et al., 2008), we find that SG assembly is not required for translational arrest upon stress. Our data instead suggest an important role of G3BP1 in regulating the physical properties of RNA assemblies. Recent work has highlighted the ability of RNA to aggregate via RNA-RNA interactions (Jain and Vale, 2017, Van Treeck et al., 2018). The aggregation of RNA may be particularly likely during stress because stress causes a sudden release of unfolded and protein-free mRNAs from polysomes. We show that sequestration of unfolded RNA into G3BP1 condensates inhibits aggregation of RNA. Based on this, we speculate that G3BP condensates could function as RNA chaperones that assist with RNA homeostasis. Further, the inhomogeneous nature of G3BP-RNA condensates points to a strategy for minimizing RNA-RNA interactions by engaging RNA molecules in physical crosslinks that keep them apart. The degree to which this strategy is employed by other RBPs remains to be determined. However, recent studies emphasized recruitment of RNA helicases to G3BP-RNA condensates in cells (Jain et al., 2016, Tauber et al., 2020). Although G3BPs play a central role in condensate assembly and inhibition of initial RNA aggregation, it seems likely that helicases assist with this process to support RNA homeostasis.
Several studies have highlighted the inhomogeneous distribution of RBPs within RNP granules (Fang et al., 2019, Jain et al., 2016, Niewidok et al., 2018, Wang et al., 2014, Wheeler et al., 2016). This led to the proposal that RNP granules contain core-like structures in which specific proteins are concentrated and protein mobility is reduced. A recent study used single-molecule fluorescence microscopy to follow the diffusion of individual G3BP1 molecules in SGs (Niewidok et al., 2018). The authors reported the presence of distributed hotspots within SGs in which G3BP1 molecules were relatively immobile. We propose that these structures are analogous to the clusters we report here. Indeed, our modeling and cryo-EM data support the notion that G3BP forms multivalent clusters on RNA that crosslink RNA molecules into an inhomogeneous network. This raises the possibility that the observed inhomogeneous distribution of RBPs within RNP granules could be the result of a condensation process in which protein clusters generate the emergent valence that enables reversible physical crosslinks that network long RNA molecules.
In summary, we describe an essential role of the scaffold proteins G3BPs in the assembly of RNP granules. G3BP harnesses the criticality of phase separation to form liquid condensates in response to local changes in RNA concentration. In effect, G3BPs are cellular sensors of protein-free unfolded RNA, a feature that may also be of critical importance for recognition of foreign DNA or RNA. At the heart of this mechanism is a conformational switch that couples RNA binding to a dramatic increase in multivalence. This promotes formation of G3BP clusters that drive condensation by crosslinking RNA. We predict that such phase-separating and crosslinking scaffolds are widespread molecular devices because of their ability to detect sudden changes in physical-chemical conditions and mount stimulus-specific physiological responses.
STAR★Methods
Key Resources Table
| REAGENT or RESOURCE | SOURCE | IDENTIFIER |
|---|---|---|
| Antibodies | ||
| Rabbit anti-G3BP1 | Thermo Fisher Scientific | Cat#PA5-29455; RRID:AB_2546931 |
| Goat anti-eIF3η | Santa Cruz Biotechnology | Cat#N-20; RRID:AB_671941 |
| Donkey anti-goat 647 | Invitrogen | Cat#A21447; RRID:AB_141844 |
| Donkey anti-rabbit 488 | Invitrogen | Cat#A21206; RRID:AB_2535792 |
| Rabbit anti-phospho-G3BP1 (pS149) | Sigma Aldrich | Cat#G8046; RRID:AB_1840867 |
| Mouse anti-puromycin (clone 12D10) | Merck Millipore | Cat#MABE343; RRID:AB_2566826 |
| Rabbit anti-eIF2a(Ser52) | Thermo Fisher Scientific | Cat#44-728G; RRID:AB_2533736 |
| Mouse anti-eIF2a | Santa Cruz Biotechnology | Cat#sc-133132; RRID:AB_1562699 |
| Goat anti-EGFP | In house | N/A |
| Bacterial and Virus Strains | ||
| BL21-AI One Shot Chemically Competent E. coli | Thermo Fisher Scientific | Cat#607003 |
| Chemicals, Peptides and Recombinant Proteins | ||
| Ubc9WT-6xHis | Mateju et al., 2017 | O-3299 |
| Ubc9ts-6xHis | Mateju et al., 2017 | O-3298 |
| GFP-G3BP1(WT) | This paper | L-515 |
| GFP-G3BP1(ΔNTF2) | This paper | TH1321 |
| GFP-G3BP1(ΔRG) | This paper | TH0999 |
| GFP-G3BP1(ΔE1) | This paper | L-663 |
| GFP-G3BP1(ΔE2) | This paper | L-664 |
| GFP-G3BP1(ΔE1ΔE2) | This paper | L-667 |
| GFP-G3BP1(S149A) | This paper | L-548 |
| GFP-G3BP1(S149E) | This paper | L-549 |
| GFP-G3BP1(S149A/S232A) | This paper | L-686 |
| SNAP-G3BP1(WT) | This paper | L-587 |
| mCherry-Caprin1 | This paper | TH1232 |
| GFP-G3BP2(WT) | This paper | TH1434 |
| GFP | This paper | D292 |
| GFP-hnRNPA1L | Wang et al., 2018 | TH1261 |
| GFP-hnRNPA2B1 | Wang et al., 2018 | TH1252 |
| FUS-GFP | Wang et al., 2018 | TH1204 |
| TDP43-GFP | Wang et al., 2018 | TH1083 |
| GFP-hnRNPA1L2 | Wang et al., 2018 | TH1275 |
| GFP-hnRNPA0 | Wang et al., 2018 | TH1250 |
| GFP-hnRNPAB | Wang et al., 2018 | TH1251 |
| GFP-hnRNPA1S | Wang et al., 2018 | TH1164 |
| GFP-hnRNPDL | Wang et al., 2018 | TH1254 |
| GFP-hnRNPA3 | Wang et al., 2018 | TH1202 |
| GFP-TIAL1 | Wang et al., 2018 | TH1257 |
| GFP-TIA1 | Wang et al., 2018 | TH1256 |
| GFP-PSPC | This paper | TH1255 |
| SFPQ-GFP | This paper | TH1263 |
| RNaseOUT | Invitrogen | Cat#10777019 |
| Nucleotides: ATP, CTP, GTP, and UTP | Roche | Cat#11277057001 |
| DNase I | New England Biolabs | Cat#M0303S |
| E. coli PolyA Polymerase | Thermo Fisher Scientific | Cat#AM1350 |
| HCS CellMask Blue Stain | Invitrogen | Cat#H32720 |
| Hoechst 33342, Trihydrochloride, Trihydrate – 10 mg/ml solution in water | Invitrogen | Cat#H3570 |
| Blasticidin S HCl | Invitrogen | Cat#R21001 |
| Lipofectamine 2000 | Life Technology | Cat#11668-019 |
| Opti-MEM | GIBCO | Cat#31985062 |
| DMEM, high glucose, GlutaMAX Supplement, pyruvate | GIBCO | Cat#31966021 |
| DMEM, high glucose, no glutamine, no phenol red | GIBCO | Cat#31053028 |
| cOmplete Protease Inhibitor Cocktail | Roche | Cat#11836145001 |
| cOmplete, EDTA-free Protease Inhibitor Cocktail | Roche | Cat#05056489001 |
| RNase A | PanReac AppliChem | Cat#A2760 |
| Polyethylene glycol 20000 | Merck | Cat#817018 |
| SNAP-Surface Alexa Fluor 546 | New England Biolabs | Cat#S9132S |
| T4 RNA ligase 1 | New England Biolabs | Cat#M0204S |
| pCp-Cy5 | Jena Bioscience | Cat#NU-1706-CY5 |
| Lambda Protein Phosphatase | New England Biolabs | Cat#P0753S |
| Nonidet P 40 | Sigma-Aldrich | Cat#74385 |
| 2-[Methoxy(polyethyleneoxy)propyl]trimethoxysilane; 90% 6-9 PE-units | Abcr GmbH | Cat#AB111226 |
| Sodium hydrogen arsenate heptahydrate, ASC, 98.0-102.0% | Alfa Aesar | Cat#33373 |
| Critical Commercial Assays | ||
| RNeasy Mini Kit (50) | QIAGEN | Cat#74104 |
| mMESSAGE mMACHINE T7 Transcription Kit | ThermoFisher | Cat#AM1344 |
| Poly(A) Tailing Kit | ThermoFisher | Cat#AM1350 |
| Microspin G-25 Columns | GE Healthcare | Cat#GE27-5325-01 |
| Pierce™ Polyacrylamide Spin Desalting Columns, 7K MWCO | ThermoFisher | Cat#89849 |
| Experimental Models: Cell Lines | ||
| G3BP1(WT) BAC in HeLa Kyoto cell line | Mateju et al., 2017 | MCB_ky_7510 (C-terminal mCherry tag; FACS sorted) |
| U2OS | Kedersha et al., 2016; Laboratory of Paul Anderson | N/A |
| U2OS G3BP1/2 knock out cell line | Kedersha et al., 2016; Laboratory of Paul Anderson | N/A |
| Sf9 cells | Expression Systems | Cat#94-001F |
| Oligonucleotides | ||
| polyA(60) RNA | This paper; Eurofins Genomics | N/A |
| Poly(A) | Sigma-Aldrich | Cat#10108626001 |
| Poly(C) | Sigma-Aldrich | Cat#P4903 |
| Poly(G) | Sigma-Aldrich | Cat#P4404 |
| Poly(U) | Sigma-Aldrich | Cat#P9528 |
| Human spinal cord poly(A)+ RNA | Clontech | Cat#636142 |
| NEAT1 RNA | This paper | N/A |
| 5-loop RNA | This paper | N/A |
| Ribosomal RNA | Bioworld | Cat#11020001-2 |
| Recombinant DNA | ||
| pCRII-TOPO-hNEAT1 | Clemson et al., 2009; Laboratory of Archa Fox | Addgene Plasmid #61518 |
| pSCA-5loopPlus5 | This paper | L-480 |
| Software and Algorithms | ||
| Fiji | NIH | https://fiji.sc/ |
| NCPR | Alan Bleasby European Bioinformatics Institute, Wellcome Trust Genome Campus, Hinxton, Cambridge CB10 1SD, UK | http://www.bioinformatics.nl/cgi-bin/emboss/charge |
| PLAAC | Lancaster et al., 2014 | http://plaac.wi.mit.edu/ |
| IUPred | Dosztányi et al., 2005 | https://iupred2a.elte.hu |
| KNIME | KNIME.com AG | https://www.knime.com |
| R / RStudio | R Core Team |
https://www.r-project.org/ https://www.rstudio.com/ |
Lead Contact and Materials Availability
Further information and requests for resources and reagents should be directed to and will be fulfilled by the Lead Contact, Prof. Dr. Simon Alberti (simon.alberti@tu-dresden.de).
All unique/stable reagents generated in this study are available from the Lead Contact with a completed Materials Transfer Agreement.
Experimental Model and Subject Details
Cell lines
In this study, we used HeLa Kyoto (female) and U2OS (female) cell lines. Wild-type cells or genetically modified cells were used. Parental cell lines (HeLa Kyoto and U2OS) have been authenticated. HeLa G3BP1(WT)-mCherry BAC stable cell line was described elsewhere (Mateju et al., 2017, Patel et al., 2015). U2OS G3BP1/2 knockout cells were a gift from Nancy Kedersha.
HeLa and U2OS cells were cultured in 4500 mg/l glucose GlutaMAX DMEM media supplemented with 10% fetal bovine serum and penicillin/streptomycin antibiotics (GIBCO). Cells were incubated at 37°C and 5% CO2. HeLa G3BP1(WT)-mCherry BAC cells were grown in the presence of 5 μg/ml Blasticidin (GIBCO).
Method Details
Pegylated coverslips
Passivated glass coverslips were prepared according to Alberti et al. (2018). In short: coverslips were incubated with PEG-silane solution (0.4% (v/v) PEG-silane (1 g/ml) and 0.16% (v/v) HCl (37%) in toluene) overnight. Coverslips were then washed with toluene, followed by two washes with 100% ethanol and two washes with distilled water. Coverslips were then dried with compressed air.
Plasmids
Please refer to the plasmid summary table (Table S2).
Cell transfection and stress treatment
Cells were transfected using Lipofectamine 2000 transfection reagent (Invitrogen) according to the manufacturer’s instructions. Oxidative stress was induced by treating cells with 1 mM sodium arsenate in regular cell culture conditions.
Live-cell 3D imaging with lattice light-sheet microscopy
HeLa G3BP1(WT)-mCherry cells were grown and treated as previously stated. Imaging was performed at 37°C with a lattice light-sheet microscope with a voxel size of 104 nm in XY and 250 nm in Z. Imaging of early G3BP1 foci started 6 min after arsenate stress. 1000 time points (frame time interval 0.895 s), each one consisting of 61 z-planes, were acquired. For late SGs, imaging started 24 min after arsenate stress. 850 time points (frame time interval 1.430 s) were recorded, each time point consisting of 61 z-planes. Fluorescence excitation was with a 589 nm laser (MBP Communications) with a dithered square lattice (NAin = 0.325, NAout = 0.4) using a custom objective (Special Optics, 28.6X NA = 0.7). Fluorescence emission was recorded with a sCMOS camera (Hamamatsu ORCA4) using a 25x NA = 1.1 objective (Nikon 25x Nikon CFI APO LWD) through a bandpass filter, centered on the mCherry emission (Semrock FF01-629/53-25). Prior imaging, the correction collar of the detection objective was adjusted to match the refractive index of the imaging medium. Deconvolution was performed on a graphics processing unit, using a point spread function measured before each experiment and an iterative Richardson-Lucy algorithm.
Microscopy of live cells
Live cells were imaged at 37°C and 5% CO2 using either a DeltaVision Core (Applied Precision) or a DeltaVision Elite microscope (GE Healthcare) with a 60x/1.42 NA/UPlanSA oil immersion objective mounted on an inverted Olympus IX71 stand. Cells were imaged in 35-mm glass bottom dishes (MatTek Coop.) or in 8-well slides (80826, Ibidi) in 4500 mg/l glucose DMEM without phenol red (GIBCO), supplemented with 10% fetal bovine serum, 2 mM L-glutamine (GIBCO) and penicillin/streptomycin (GIBCO).
Immunofluorescence for automated quantification of SGs
U2OS cells (WT or G3BP1/2 KO cells) were seeded with a Thermo MultiDrop dispenser into a Greiner μClear 384 well plate (Greiner Cat #781092) and treated as described in the previous sections. Cells were fixed with 3.7% formaldehyde diluted in PBS for 10 min, washed with PBS and subsequently permeabilized with 0.2% Triton X-100 in PBS for 10 min. Cells were then blocked with 3% BSA in PBS for 1 hr and incubated overnight with primary antibodies (goat anti-eIF3η (Santa Cruz Biotechnology, sc-16377) diluted 1:2000 and rabbit anti-G3BP1 (Thermo Fisher, PA5-29455) diluted 1:500 in blocking solution). After washing with PBS, cells were incubated for 1 h with secondary antibodies (donkey anti-goat Alexa-647 and donkey anti-rabbit Alexa 488 diluted 1:1000 in blocking solution). The cytoplasm was stained with CellMaskBlue (Invitrogen) and the nuclei were stained with Hoechst (Invitrogen). Images were acquired on an automated confocal microscope Yokogawa cv7000 with a 40x 0.95 NA air lens.
Stress granule dissolution by RNase treatment
HeLa G3BP1(WT)-mCherry cells were grown in cell culture dishes (MatTek Coop.) and treated with sodium arsenate as previously stated. After SGs had formed, cells were permeabilized and SGs were stabilized with 10 mM Tris/HCl, pH 7.5, 0.5% Nonidet P40, 5% (w/v) PEG-20K. SGs were dissolved by adding 2.5 mg/ml RNase A.
Translation kinetics in cells
U2OS cells (WT or G3BP1/2 KO) were grown and treated as described previously. Cells were stressed with 1 mM sodium arsenate and allowed to recover in fresh media for the indicated times. Before collection, cells were treated with 91 μM of Puromycin for 5 min at 37°C. As control for specific puromycin incorporation into nascent polypeptide chains, cells were pre-treated with 2 μg/ml Harringtonine for 15 min before puromycin addition. After treatment, cells were washed with PBS and lysed with RIPA buffer (25 mM Tris/HCl pH 7.5, 150 mM NaCl, 1% NP-40, 0.1% SDS, EDTA-free protease inhibitors (Roche Applied Sciences)). Cell extracts were centrifuged 5 min at maximum speed and 4°C and the supernatant was recovered. 10 μg of protein extracts were loaded into SDS-PAGE and analyzed by immunoblot. Antibodies against Puromycin (Merck Millipore), p(S52)-eIF2a (Thermo Fisher Scientific) and eIF2a (Santa Cruz Biotechnology) were used to assess translation levels and follow stress kinetics. Relative translation levels (Puromycin signal) were quantified using Fiji and Excel.
Protein purification
Ubc9WT-6xHis and Ubc9ts-6xHis were purified as described previously (Mateju et al., 2017). In short: Ubc9WT-6xHis and Ubc9TS-6xHis were expressed in E. coli One Shot BL21 (Thermo Fisher Scientific). Cell lysis was in 50 mM HEPES, pH 7.4, 350 mM KCl, 20 mM imidazole, 2 mM DTT, and 1 × EDTA-free protease inhibitor cocktail (Roche Applied Science) using an EmulsiFlex-C5 (Avestin). The cleared lysate was applied to Ni-NTA resin (QIAGEN) and the resin was washed with lysis buffer. Elution of the bound protein was with 50 mM HEPES, pH 7.4, 350 mM KCl, 2 mM DTT, 250 mM imidazole. Fractions were pooled and applied to a HiLoad 16/600 Superdex 75 pg (GE Life Sciences) equilibrated with 50 mM HEPES, pH 7.4, 50 mM KCl, 2 mM EDTA, 2 mM DTT. Elution fractions were then applied to HiTrap SP Sepharose (GE Life Sciences) and eluted with a ten-fold linear salt gradient from 50 mM to 500 mM KCl. The protein was dialyzed against 50 mM HEPES, pH 7.4, 50 mM KCl, 2 mM EDTA, 2 mM DTT, flash-frozen, and stored at −80°C.
Recombinant 6xHis-GFP-G3BP1-MBP (WT and variants), 6xHis-MBP-SNAP-G3BP1(WT), 6xHis-GFP-G3BP2(WT)-MBP and 6xHis-MBP-mCherry-Caprin-1 were expressed in and purified from insect cells using a baculovirus expression system (Hoell et al., 2011; Jarvis, 2014). Cells were lysed using EmulsiFlex-C5 (Avestin) in lysis buffer containing 50 mM Tris/HCl, pH 7.5, 1 M KCl, 2 mM EDTA, 2 mM DTT and 1x EDTA-containing protease inhibitor cocktail (Roche Applied Sciences). The lysate soluble fraction was collected after centrifugation for 30 min at maximum speed and 10°C. Amylose resin (New England Biolabs) was used to capture the protein of interest via the MBP tag from the supernatant of the cell lysate. The protein was eluted from the amylose column with lysis buffer containing 10 mM maltose. The samples were then applied to Ni-NTA resin (QIAGEN) via 6xHis tag. The column was washed with an EDTA-free lysis buffer containing 20 mM imidazole. The protein was subsequently eluted from Ni-NTA column with 250 mM imidazole. His and MBP tags were cleaved off with GST-tagged Prescission protease during an overnight dialysis against 5 l lysis buffer. Caprin-1 was purified only by affinity purification using Ni-NTA, following the same procedure as for G3BP1. Samples were applied to size exclusion chromatography using a HiLoad 16/600 Superdex 200 pg (GE Life Sciences) on an Akta Ettan FPLC system, in 50 mM Tris/HCl, pH 7.5, 300 mM KCl, 1 mM DTT buffer. Proteins were concentrated to 80-160 μM using Amicon Ultra centrifugal filters (Merck Millipore). Aliquots were flash-frozen and stored at −80°C.
RNA purification, in vitro transcription and polyA tailing
Total RNA was isolated from HeLa cells using the RNeasy Mini Kit (QIAGEN) and following the manufacturer’s instructions. NEAT1 and 5-Loop RNAs were transcribed from the corresponding linearized plasmids. In vitro transcription was carried out with 25 U/μl T7 polymerase (Protein expression and purification facility, Max Planck Institute of Molecular Cell Biology and Genetics) and 5 μM of linearized plasmid DNA, in 40 mM Tris/HCl, pH 7.5, 6 mM MgCl2, 2 mM Spermidine, 10 mM freshly added DTT, 5 U/μl of RNaseOUT (Invitrogen) and 2 mM of each ATP, CTP, GTP and UTP (Roche), at 42°C for 90 min. After transcription, 0.5 U/μl DNase I (NEB) were added and the sample was incubated at 37°C for 60 min. DNase I was heat-inactivated at 75°C for 10 min and 5 mM EDTA were added. The RNA was then purified using the RNAeasy Mini Kit, eluted in RNase free water and stored at −20°C. Alternatively, RNAs were transcribed with mMESSAGE T7 Transcription Kit (ThermoFisher) and polyadenylated with Poly(A) Tailing Kit (ThermoFisher), following the manufacturer’s instructions.
Unfolding of rRNA and total RNA entanglement
When specified, rRNA was unfolded by heating 5 min at 95°C and cooling on ice. In order to form RNA tangles, 0.5 μg/μl of total RNA isolated from HeLa cells was diluted in 10 mM Tris/HCl, pH 7.5, 10 mM MgCl2 and heated 3 min at 95°C. Following heating, the RNA was cooled down to 20°C in a thermocycler (cooling speed was 20°C/min) (adapted from Jain and Vale (2017)). RNA entanglement was confirmed by fluorescence microscopy after staining with the F22 dye (Li and Chang, 2006). The fraction of entanglement was determined by UV/Vis quantification of the soluble RNA after entanglement followed by 15 min centrifugation at 4°C and maximum speed.
Formation of G3BP1 condensates
For G3BP1-RNA condensate formation, unless specified, 5 μM of GFP-G3BP1 were incubated with RNA (either total RNA, mRNA, ribosomal RNA, NEAT1, 5-Loop, 5-Loop-poly(A), A(60), poly(A), poly(G), poly(C) or poly(U)) in 20 mM PIPES/KOH (pH 6.0 - 7.5), 85 mM KCl, 1 mM MgCl2 and, when stated, 1% PEG-20K (w/v). Typically, 75 ng/μl RNA were used. Homopolymeric RNAs were heterogeneous in length, Bioanalyzer analysis revealed the following distributions: poly(A), 500-4000 nucleotides; poly(C), 1-2000 nucleotides; poly(G), 50-500 nucleotides; poly(U), 200-2000 nucleotides. For determining the phase behavior of GFP-G3BP1, the protein concentration, the RNA concentration, and the KCl concentration were titrated. For protein only condensates, GFP-G3BP1 was tested in 20 mM PIPES/KOH, pH 7.5, 85 mM KCl and increasing PEG-20K (Merck) concentrations (0%–8% w/v)
Microscopy of in vitro G3BP1 condensates
Samples were placed onto PEG-passivated coverslips and mounted on microscopy slides using double-sided sticky tape (Alberti et al., 2018). The samples were imaged immediately after preparation using Olympus IX81 Inverted Spinning Disc Microscope equipped with Andor iXON 897 EMCCD camera and UPlanSApo 100x oil immersion objective (Olympus). Alternatively, condensates were prepared in non-binding 384-well plates (Greiner bio-one) and imaged with a DeltaVision Elite (GE Healthcare) microscope using a 20x/0.75 UPlanSApo objective. For quantification, condensates were allowed to settle on the surface.
Fluorescence recovery after photobleaching of cellular SGs and in vitro condensates
In vitro samples were mounted on pegylated glass slides (Alberti et al., 2018). Cells were grown in 35 mm glass bottom dishes (MatTek Coop.). Fluorescence bleaching experiments were carried out using Olympus IX81 Inverted Spinning Disc Microscope equipped with Andor iXON 897 EMCCD camera and a FRAPPA unit (Andor). Imaging was carried out using an UPlanSApo 100x (NA 1.4) oil immersion objective (Olympus). Fluorescence excitation was with 1% of a 50 mW 488 nm (Coherent Sapphire) and 5% of a 50 mW 561 nm laser (Cobolt Jive) for GFP and mCherry or Cy3 labeled proteins, respectively. Exposure time was typically 50 ms. A region of 10x10 pixels (∼0.82 μm x 0.82 μm) was selected within a droplet and bleached with 100% of a 100 mW 405 nm diode laser (Cairn OptoLED lite) and a 50 ms dwell time. The fluorescence intensity was recorded for 10 frames prior to the bleach and the recovery of fluorescence was recorded at 2 frames/s for 120 s or 240 frames.
Client partitioning assay
SNAP-tagged G3BP1 was mixed with SNAP-Surface Alexa Fluor 546 (NEB) at a ratio of 20:1 at RT for 5 min. To remove free dye, the protein was buffer exchanged using Protein Desalting Spin Columns (ThermoFisher) into 50 mM Tris/HCl, pH 7.5, 300 mM KCl and 1 mM DTT. SNAP(546)-G3BP1-RNA condensates were formed at a concentration of 5 μM G3BP1(WT) and 25 ng/μl total RNA in 20 mM PIPES, pH 7.0, 85 mM KCl, 1 mM MgCl2 and 1% (w/v) PEG-20K. Thereafter, 150 nM GFP-tagged client proteins were added. Samples were mounted on pegylated glass slides and imaged after 20 min. Client enrichment in G3BP1 droplets (ratio of client mean fluorescence intensity inside of G3BP1 droplets over client mean fluorescence intensity outside of droplets) was quantified using the FIJI software and subsequently plotted using RStudio software package. For Caprin-1 partitioning assays, 2.5 μM mCherry-Caprin-1 were added to preformed GFP-G3BP1(WT)-RNA condensates.
Fluorescence labeling of Ubc9
Purified Ubc9 samples were dialyzed against 50 mM HEPES/KOH, pH 7.4, 50 mM KCl, and 2 mM EDTA for 3 h at 4°C. Samples were then mixed with Cy3 (Invitrogen) at equimolar concentrations and incubated for 2 h at 25°C. The Ubc9/Cy3 mixture was then dialyzed against 50 mM HEPES/KOH, pH 7.4, 50 mM KCl, 2 mM EDTA, and 1 mM DTT overnight.
G3BP1 condensate coalescence using dual-trap optical tweezers
Controlled coalescence of phase separated GFP-G3BP1-RNA condensates with and without Ubc9WT or Ubc9ts, as well as GFP-G3BP1-poly(G) condensates, were performed using a custom-built dual-trap optical tweezer microscope (Jahnel et al., 2011). Condensates were trapped with two optical traps and brought into contact to induce fusion. Normalization of the coalescence times was carried out by scaling of the apparent coalescence time with the characteristic condensate size, which was calculated as the geometric mean between the two condensate radii before fusion. Condensate radii were determined by image analysis using FIJI. The laser signal of the coalescence process was normalized to the plateau value of a stretched exponential fit and data were plotted using the RStudio software package ((Wang et al., 2018) for details about the stretched exponential growth model).
Dynamic light scattering
Dynamic light scattering of 5 μM GFP-G3BP was measured at 25°C with a Zetasizer Nano ZSP (Malvern) using 173° forward scattering. Measurements were recorded with a precision quartz cuvette (Hellma) recording ten 10 s autocorrelations. Each experiment was repeated at least three times. Hydrodynamic radius and apparent molecular weight estimates were analyzed with the manufacturer software. Typically, GFP-G3BP was tested in 20 mM PIPES/KOH pH 7.5 and 85 mM KCl. When indicated, pH and KCl concentration were modified.
Static light scattering and analytical HPLC
Molecular weight determination of GFP-G3BP1 and variants was performed using the Viscotek GPC max system and TDA 305 triple detector array (Malvern) in-line with a Superdex 200 10/300 column (GE Healthcare), at a protein concentration of 15 μM, in 25 mM Tris/HCl, pH 7.5, 150 mM KCl and 0.5 mM DTT buffer. When specified, A(60) RNA was added at the indicated concentration. Data collected by the refractive index detector and the static light scattering monitor (90- and 7-degree angles) were analyzed with OmniSec software (Malvern), using bovine serum albumin as standard.
Fluorescence correlation spectroscopy
GFP-labeled G3BP1 WT and variants were diluted from stock solutions to a final concentration of 50 nM in 25 mM Tris/HCl, pH 7.5, 150 mM KCl, 0.5 mM DTT. The protein samples were filtered using centrifugal filter units with a 100 nm cut off size (Ultrafree -MC-VV, Durapore PVDF 0.1 μm, Merck Millipore). 200 μl were placed into 96-well glass bottom dishes (Greiner bio-one) and fluorescence correlation spectra were recorded at a depth of 20 μm into the sample, with respect to the glass surface. G3BP1-RNA condensates were formed from SNAP-tagged G3BP1, as described in the methods section “Formation of G3BP1 condensates”, yet the filtration of the suspension was omitted. Droplets were spiked with 15 nM GFP-labeled G3BP1 in the presence or absence of 3 μM unlabelled Ubc9WT and Ubc9ts, respectively. Diffusion of Cy3-labeled Ubc9 was measured at 500 nM in the presence and absence of G3BP1 droplets. Fluorescence correlation was recorded in the mid-plane of the droplet. Fluorescence correlation spectroscopy was carried out with a 60X 1.2NA water immersion objective (Olympus) mounted onto an Abberior Instruments confocal microscope. GFP was excited with a 490 nm, 40 mHz pulsed laser using 10 μW in the back focal plane. Photon traces were recorded for 20 s with 600 ns resolution directly using the Abberior FPGA and correlated using a multiple-tau correlator in MATLAB. The correlation data were fitted assuming 3D diffusion with a single triplet component in MATLAB. Single point fluorescence correlations were recorded for diffuse samples. Circle scanning FCS (Maraspini et al., 2018) was used to determine G3BP1 and Ubc9 mobility inside droplets. We scanned circular trajectories with a diameter of 3 μm and frequency of 3 kHz through the midplane of droplets. Each pixel of the trajectory was auto-correlated in time and fitted assuming single component 3D diffusion using MATLAB.
Electrophoretic mobility shift assay
A(60) RNA was 3′ labeled with pCp-Cy5 (Jena Bioscience), using T4 RNA ligase 1 (NEB) and following the manufacturer’s instructions. Following ligation, unincorporated pCp-Cy5 were removed with Illustra MicroSpin G-25 columns (GE Healthcare). The resulting A(60)-Cy5 RNA was quantified and used to assess G3BP1 RNA-binding affinity by EMSA, using the following conditions: 20 mM PIPES/KOH, pH 7.0, 85 mM KCl, 1 mM MgCl2, 6% Glycerol, 10 μg/ml BSA, 8 μg/ml rRNA, 200 nM A(60)-Cy5, 0.5-4 μM GFP-G3BP1 (WT or mutants). When specified, 300 ng of unlabeled competitor RNA (A(60) or poly(A)) or 1 μM mCherry-Caprin-1 were added. RNA binding reactions (15 μl) were incubated for 1 hr at RT. 10 μl of sample were resolved in Novex TBE 4%–20% gels (Thermo Fisher) and visualized with Odyssey Infrared Imaging System (LI-COR). EMSA quantification was carried out with the FIJI software and the data were analyzed and plotted with the RStudio software package.
Lambda protein phosphatase assay
Dephosphorylation of GFP-G3BP1 was performed with Lambda Protein Phosphatase (New England Biolabs) for 2 hr at RT, following manufacturer’s indications. Typically, 1.6 nmol of GFP-G3BP1 and 800 U of Lambda Protein Phosphatase were used. After the reaction, the buffer was exchanged with Pierce™ Polyacrylamide Spin Desalting Columns (Thermo Fisher) to 50 mM Tris/HCl, pH 7.5, 300 mM KCl, 1 mM DTT. The efficiency of dephosphorylation was determined by immunoblotting using rabbit anti-pS149-G3BP1 antibody (Sigma Aldrich, 1:1000 dilution).
RNA aggregation assay
RNA tangles of poly(G) RNA were formed in 20 mM Tris-HCl, pH 7.5, 250 mM KCl, 1 mM MgCl2 and 5% PEG (Jain and Vale, 2017, Van Treeck et al., 2018). In short, poly(G) RNA was heated for 5 min at 75°C and immediately cooled in ice. The denatured RNA was then premixed with GFP-G3BP1 (WT or variants) and added to the final buffer at a final concentration of 200 ng/ul of RNA and 7.5 μM of protein. poly(G) RNA was stained with 50 μM of F22 dye when indicated (Li and Chang, 2006). Samples were directly prepared in 384-well plates (Greiner bio-one) and immediately imaged. Alternatively, samples were placed onto PEG-passivated coverslips for coalescence experiments with a dual-trap optical tweezer.
Optical diffraction tomography
Condensates formed from 5 μM GFP-G3BP1(WT) with 50 ng/μl polyA RNA were prepared as described above and mounted between PEG-passivated glass slides (Alberti et al., 2018), with double-sided 50 μm thick sticky tape as spacer. Three-dimensional (3D) refractive index (RI) distribution of samples were measured with a slightly adjusted custom-built optical diffraction tomography microscope as described in Abuhattum et al. (2018). The complex optical fields of light scattered by the samples were retrieved from the recorded holograms by applying a Fourier transform-based field retrieval algorithm as previously published (Cuche et al., 2000, Takeda et al., 1982). The 3D RI tomogram was reconstructed from retrieved complex optical fields according to Fourier diffraction theorem. A more detailed description of tomogram reconstruction can be found elsewhere (Kim et al., 2014, Sung et al., 2009, Wolf, 1969). Segmentation and determination of the mean RI values of the condensates (RIcondensate) was with FIJI. The refractive index is directly proportional to the change in mass concentration across a phase boundary. The mass concentration was calculated using the mean RIcondensate value, the RI value of the buffer (RIbuffer = 1.336 at λ = 532 nm) and the RI increment (dn/dc) for protein and RNA (dn/dc = 0.185 mL/g) (Zhao et al., 2011).
Specimen vitrification and Cryo-electron tomography (Cryo-EM)
5 μM GFP-G3BP1 with 50 ng/μl polyA RNA were incubated on glass cover slide for 30 s. Glutaraldehyde was added to yield a final concentration of 0.05% and incubated for 30 s. 4 μL of the droplet suspension was deposited onto 45 s glow-discharged holey SiO2-coated 200 mesh copper R 2/2 grids (Quantifoil Micro Tools, Jena, Germany). Grids were blotted from both sides for 2 s with blot force 0, followed by drain time of 2 s and immediately plunged into liquid ethane at liquid nitrogen temperature using a Vitrobot Mark 4 (FEI Company, Eindhoven, Netherlands) set to 22°C, 90% humidity. The frozen grids were stored in sealed boxes in liquid nitrogen until further processing. Cryo-electron tomography data were collected on a Titan Krios microscope operated at 300 kV (ThermoFisher Scientific, Eindhoven, Netherlands) equipped with a field-emission gun, a Quantum post-column energy filter (Gatan, Pleasanton, CA, USA), a K3 direct detector camera (Gatan) and a Volta phase plate (ThermoFisher Scientific, Eindhoven, Netherlands). Data were recorded in dose-fractionation mode using acquisition procedures in SerialEM software v3.7.2 (Mastronarde, 2005). Prior to the acquisition of tilt-series, montages of the grid squares were acquired at ∼7.8 nm/pixel. Tilt-series were collected using a dose symmetric scheme (Hagen et al., 2017) and a Volta phase plate (Danev et al., 2014) in nano-probe mode, pixel size at the specimen level of 2.075 Å, 3 μm defocus, tilt increment 2° with constant dose of 2.2 e−/Å2 for all tilts. Prior to tilt-series alignment and tomographic reconstructions in the IMOD software package, version 4.9.4 (Kremer et al., 1996), the projection movies were corrected for beam induced drift in the SerialEM plugin. Alignment of tilt-series images was performed with patch-tracking. Final alignment of the tilt-series images was performed using the linear interpolation option in IMOD without contrast transfer function correction. Aligned images were binned to the final pixel size of 8.3 Å. For tomographic reconstruction by back-projection, the radial filter options were left at their default values (cut off, 0.35; fall off, 0.05). The reconstructed volume was filtered with a Gaussian filter of 3 pixels radius.
All-atom simulation methods
All-atom Monte Carlo simulations were performed using the CAMPARI simulation engine (http://campari.sourceforge.net/) using the ABSINTH implicit solvent model and forcefield paradigm implemented in the abs_opls3.2.prm parameter set (Vitalis and Pappu, 2009a). The ABINSTH model and simulation tools implemented in CAMPARI have been used extensively for the simulation of intrinsically disordered proteins and disordered regions tethered to folded domains (Das et al., 2016, Martin et al., 2016, Mittal et al., 2018). For all simulations, the backbone dihedral angles for residues within the folded domains were held fixed. All other degrees of freedom (including sidechain dihedral angles within the folded domains as well as backbone and sidechain dihedral angles within disordered segments) were allowed to vary in the simulations.
We constructed a de novo all-atom model of monomeric and dimeric G3BP1 to ensure that the coordinates are interoperable with the bond lengths and bond angles of the ABSINTH forcefield. The crystal structure of monomeric NTF2 (PDB: 4IIA) was used as a starting structure of the NTF2 domain (Vognsen et al., 2013). The starting configurations for the acidic domain, PxxP domain and RG-rich region were all extracted at random from ensembles of self-avoiding conformations. A structural model for the folded RRM within G3BP1 is unavailable. Accordingly, we leveraged the significant sequence homology to many RRMs from the hnRNP class of proteins. In particular, the first RRM from hnRNPD0 shows strong sequence homology and a structural model (PDB:1HD1) has been generated using data from nuclear magnetic resonance (NMR) (Figure S5A; Nagata et al., 1999). We used this structural model to generate a homology model using the G3BP1 RRM sequence and hnRNPAD0 RRM-1 structure, yielding a model with 99% confidence (Kelley et al., 2015). The five distinct components (NTF2, acidic domain, PxxP domain, RRM and RG-rich region) were assembled together into a single full-length monomer structure. To generate “mutant” constructs, regions were omitted from the starting structure – i.e., for the ΔNTF2 the NTF2 domain was removed from the monomeric G3BP1 construct. Figure 5A shows a single simulation snapshot of the dimeric structure. To generate a model for the G3BP1 dimer, we aligned our full-length monomeric G3BP1 using the model for the dimer from PDB:4FCJ to define the NTF2 dimer interface. The relative position of the two NTF2 domains was then held fixed during simulations. We performed two distinct types of all-atom Metropolis Monte Carlo simulations (Vitalis and Pappu, 2009b). In order to assess the robustness of our conclusions, multiple independent simulations starting from different configurations are run.
Full Hamiltonian simulations
Simulations using the full ABSINTH Hamiltonian describe atomistic interactions using a complete description of different types of interactions (electrostatics, Van der Waals, solvation effects, etc.). The computational cost needed to compute these interactions is significant, and these simulations take on the order of weeks-to-months to complete for the sized systems examined here.
Excluded volume (EV) simulations
For simulations performed using the excluded volume (EV) Hamiltonian electrostatics, solvation effects, and attractive Lennard-Jones interactions are turned off such that while the folded domains remain fixed the IDRs behave as self-avoiding random-coil polymers. These simulations take on the order of hours-to-days to complete for the sized systems examined here.
Simulation analysis
Simulations were analyzed using the CTraj analysis suite (https://camparitraj.readthedocs.io) built on the MDTraj backend (McGibbon et al., 2015). The ensemble-average hydrodynamic radius (RH) was calculated using the HullRad package (http://52.14.70.9/; Fleming and Fleming, 2018).
The inter-domain distance between the acidic domain and the RG-rich region was calculated using the point-to-point center of mass distance between the two regions. Specifically, for each simulation frame the center of mass associated with all the residues in each of the two domains in question was first calculated, and the distance between those two points was determined.
The normalized distance map (Figure 5B) was calculated by first determining the ensemble-average distance between the Cα atom of every pair of residues. Each distance was then normalized by the expected distance for a sequence-matched polypeptide behaving as a Gaussian chain (given the intrinsic dimensions of the peptide unit)
Ultra-coarse-grained simulations
Ultra-coarse-grained simulations were performed using Monte Carlo simulations performed over a simple lattice model in a manner analogous to as has been described previously (Boeynaems et al., 2018, Fei et al., 2017, Feric et al., 2016, Harmon et al., 2017a). The molecular evolution of the system is driven by a variety of Monte Carlo moves that include chain pivot/re-arrangement moves and molecular translation/rotation moves of both individual molecules and clusters of molecules. The intrinsically simple nature of our model allows rapid convergence of simulations.
Bead-bead interactions extend only between nearest neighbor components. As described in Figure 6A, G3BP1 molecules consist of two beads (an N-terminal bead, NTB and C-terminal bead, CTB) while RNA is a polymer of either 6 (∼50-60 nt RNA) or 100 (∼800-1000 nt RNA) RNA beads (RBs). Interaction strengths between beads are as follows:
| Bead 1 | Bead 2 | Strength (kT) | Comment |
|---|---|---|---|
| NTB | NTB | +0.2 | We assume no attractive interactions between the N-terminal half of the dimer. |
| NTB | CTB | −0.6 | Weakly attractive interaction between the C- and N-terminal halves of the dimer (i.e., RG-acidic IDR interaction) |
| NTB | RB | +0.4 | We assume no attractive interactions between the N-terminal half of the dimer and RNA |
| CTB | CTB | −0.8 | Weakly attractive interaction between the C-terminal parts of the dimmer (i.e., RG-RG interaction) |
| CTB | RB | −4.0 | Strong attraction between the C-terminal parts of the dimer and RNA (i.e., RRM-RNA interaction) |
| RB | RB | +10.0 | Strong repulsion between RNA beads (RNA does not intrinsically want to self-associate) |
The conclusions from our model are relatively insensitive to the specific parameters chosen here. The key aspects of the interaction model that are required to observe clustering on RNA are strongly attractive CTB-RNA interaction, weakly attractive CTB-CTB interaction, weakly repulsive NTB-NTB interactions, and strongly repulsive RNA-RNA interactions.
We wish to emphasize unequivocally that this model is not capturing anything unique regarding G3BP1/2 interaction with RNA, but instead describing an entire class of systems in which a small molecular species (G3BP1) has a high affinity for a polymer (RNA) and engages in weakly multivalent and attractive interactions with itself. With this in mind, we see no reason to expect the formation of microclusters in an RNA-dependent manner to be unique to G3BP1, nor indeed to RNA (or even nucleic-acid) binding.
In the ΔRG version (Figure 6B) the only change to our model is (1) no attractive CTB-CTB interaction and (2) no attractive CTB-NTB interaction. We did not alter the strength of CTB-RNA interaction.
Simulations were performed in a cubic box of [100 × 100 × 100]. The total number of Monte Carlo steps performed per simulation varies but is typically on the order of 1-3 x10⁹.
Sequence conservation analysis
Sequence conservation was calculated by computing the global alignment across 339 orthologous G3BP1/2 sequences identified using the EggNog server (Huerta-Cepas et al., 2016). Alignment was performed using Clustal Omega, and conservation determined using the default analysis for conservation in JalView (Madeira et al., 2019). The net charge per residue is calculated using the localCIDER analysis package (Holehouse et al., 2017).
Quantification and Statistical Analysis
Lattice light-sheet image analysis
FIJI (Schindelin et al., 2012) and in-house written macro (Data S1) were used for segmenting SGs. First, image sequences were normalized using a reference image sequence such that minimum and maximum intensities among different experiments were comparable for analysis. The normalized image series was then rescaled for photobleaching correction using the 5th and 95th percentile of the gray-level histogram. SGs were then segmented using watershed methods (Lotufo and Falcao, 2000, Vincent and Soille, 1991; https://imagej.net/Interactive_Watershed). Objects were segmented, maximum was determined and Watershadding was applied with 25%–100% from spot max. Objects smaller than 200 nm in diameter were rejected. The number, size, and mean intensity of SGs were measured in the segmented regions. Data analysis and plotting was with R/RStudio.
Image analysis
Images were analyzed with custom semi-automated workflows in Fiji, except for automated high content imaging of fixed cells, where a custom pipeline in CellProfiler was used (see next section). In short: for threshold-based segmentation of cells and condensates, the image was illumination corrected by normalizing the image to its own blurred image using a Gaussian blur with 50 pixels. Objects with intensities larger than 5% of the mean intensity of the normalized image were thresholded and selected. The selection was applied to the original image for measurement. Segmentations were manually spot checked by eye and then applied for the entire dataset. Calculation of the apparent phase separated fraction was with (ICondensate ∗ ACondensate / (ITotal ∗ ATotal) where ICondensate is the mean condensate fluorescence intensity, ACondensate the condensate area, ITotal the mean fluorescence intensity of the image and ATotal the size of the image. For binary analysis, an area covered with condensates larger 1% and smaller 90% was considered phase separated. Data analysis and plotting was with the R/RStudio software package.
Image analysis and quantification of immunofluorescence labeled SGs
Image analysis was carried out with the open source software CellProfiler. First, nuclei were segmented with Otsu and fused objects split with a watershed algorithm. The surrounding cytoplasm was detected with a propagation algorithm. Next, SGs were segmented using a white top hat filter to enhance structures and the Otsu with a watershed to detect individual SGs. Intensity and shape parameters were then extracted from the segmented images. Statistical analysis was carried out with the open source software KNIME.
General data analysis
Quantification and statistical analysis were performed using R/Rstudio. p values were calculated and plotted with the R ggsignif package. Significance levels: ∗ < 0.05, ∗∗ < 0.01, ∗∗∗ < 0.001. Boxplots: horizontal line depicts the median, the box is the 25 and 75 percentile and the whiskers denote the min. and max. values considered for analysis. Further statistical details can be found in the figure legends and STAR Methods.
Estimation of apparent condensate assembly
The onsets of condensate assembly (in cells and in vitro) were estimated by non-least square fitting of the data to the general equation
where y is the measured signal at the given control value x, A1 is the lower and A2 the upper plateau baseline, x0 the x axis value of the inflection point of the sigmoid and dx the slope within the inflection point. The Onset was estimated by regression with
For apparent cellular saturation concentration estimates, cells with four and more condensates were scored positive for SGs and assigned the value 1. The datasets per variant was binned based on the mean fluorescence intensity and median was formed. Iterative datasets were formed with bin sizes 10, 15, 20, 30, 40, 50, 75 and 100. Medians were plotted as a function of the mean fluorescence intensity of the bin and fitted as described above.
FRAP analysis
Analysis of FRAP measurements was with the FIJI software, in which the selected condensate was drift corrected using the rigid body method of the StackReg module (Thévenaz et al., 1998), followed by calculating the normalized condensate intensity by normalizing the fluorescence intensity of the bleach region (IFRAP) by the starting fluorescence (IFRAPt0) and the total condensate fluorescence intensity (Itotal) normalized by the start fluorescence (Itotalt0) of the condensate.
Statistical analysis, curve fitting and plotting was carried out with R/Rstudio. To this end, FRAP data for each condition were averaged and the standard deviation was calculated from the mean of the normalized intensity data. The recovery was fitted by non-least square analysis, fitting the mean fluorescence data as a function of time to the single or double exponential equations
where y0 is the recovery plateau, A, as well as A1 and A2, respectively, the amplitude of the fluorescence change and k, as well as k1 and k2, respectively, the apparent recovery rates. The half-life (t1/2) of the reaction was calculated from the equation
and the mobile and immobile fractions were calculated from the equations
Analysis of the RNA binding isotherms
Analysis of the RNA binding isotherms was carried out by non-least square fitting of the fraction RNA bound (F) as a function of the protein concentration (P) to a cooperative Hill binding model
in which KD is the apparent affinity and n the cooperativity term of the binding reaction.
Data and Code Availability
The published article includes all datasets generated and analyzed during this study. Code for lattice light sheet microscopy analysis is provided in Data S1. Other analysis procedures are described in the methods, as well as the quantification and statistical analysis sections.
Acknowledgments
We thank the Services and Facilities of the MPI-CBG for their support: Protein Expression Purification and Characterization, Light Microscopy, Advanced Imaging, Technology Development Studio, and Scientific Computing Facility. We thank the MPI-CBG staff for helpful discussions, A. Pozniakovsky for help with cloning, and N. Kedersha for wild-type and G3BP1/2 KO U2OS cell lines. We acknowledge funding by the Max-Planck Society; the Technische Universität Dresden; the MaxSynBio Consortium; the European Research Council (PhaseAge, 725836); the Bundesministerium für Bildung und Forschung (BMBF; 01ED1601A and 031A359A); the Volkswagen Foundation (92847); EU Joint Program – Neurodegenerative Disease Research (JPND; CureALS); and the European Union Horizon 2020 Research and Innovation Program (Marie Sklodowska-Curie grant agreement 791147). Further support was from the Human Frontier Science Program (RGP0034/2017 to S.A. and R.V.P.), the National Science Foundation (MCB-1614766 to R.V.P.), and St. Jude Children's Research Hospital (to R.V.P.). J.G.-B. and S.W. were supported by EMBO long-term fellowships (ALTF 406-2017 and 708-2017).
Authors Contributions
This paper is the result of the PhD project of A.K., who performed experiments under the supervision of S.A. and T.M.F, and a postdoctoral project led by J. G.-B. Analysis and interpretation of the data were performed mainly by A.S.H., R.V.P., T.M.F., J.G.-B., and S.A. S.M. helped with RNA-binding experiments. I.P. generated HeLa lines. S.W. and J.W. performed co-partitioning experiments. M.R.-G. helped with protein purification. M.J. helped with and analyzed tweezer experiments. D.R. helped with generating constructs. A.H. helped with FCS experiments. X.Z. helped with condensate acquisition of cryo-EM tomography. J.M. reconstructed tomograms and helped with data interpretation. Y.-T.C. provided F22 RNA-staining dye. D.M. helped with translation assays in U2OS cells. I.R.E.A.T assisted with RNA aggregation experiments. R.S., K.K., and J.G. assisted with optical diffraction tomography measurements. A.S.H. and R.V.P. performed simulations and generated predictions regarding the overall phase behavior of G3BP. T.M.F., J.G.-B., and S.A. conceived the project. T.M.F., A.K., J.G.-B., and S.A. drafted the manuscript. R.V.P., A.S.H., T.M.F., J.G.-B., A.A.H., and S.A. worked together to write and edit the manuscript. Funding was acquired by R.V.P., A.A.H., and S.A.
Declaration of Interests
S.A. and R.V.P. are advisors on the scientific advisory board of Dewpoint Therapeutics. A.A.H. is a co-founder of Dewpoint Therapeutics.
Published: April 16, 2020
Footnotes
Supplemental Information can be found online at https://doi.org/10.1016/j.cell.2020.03.049.
Supplemental Information
References
- Abuhattum S., Kim K., Franzmann T.M., Eßlinger A., Midtvedt D., Schlüßler R., Möllmert S., Kuan H.-S., Alberti S., Zaburdaev V., Guck J. Intracellular Mass Density Increase Is Accompanying but Not Sufficient for Stiffening and Growth Arrest of Yeast Cells. Front. Phys. 2018;6:131. [Google Scholar]
- Adivarahan S., Livingston N., Nicholson B., Rahman S., Wu B., Rissland O.S., Zenklusen D. Spatial Organization of Single mRNPs at Different Stages of the Gene Expression Pathway. Mol. Cell. 2018;72:727–738.e5. doi: 10.1016/j.molcel.2018.10.010. [DOI] [PMC free article] [PubMed] [Google Scholar]
- Alberti S., Carra S. Quality Control of Membraneless Organelles. J. Mol. Biol. 2018;430:4711–4729. doi: 10.1016/j.jmb.2018.05.013. [DOI] [PubMed] [Google Scholar]
- Alberti S., Hyman A.A. Are aberrant phase transitions a driver of cellular aging? BioEssays. 2016;38:959–968. doi: 10.1002/bies.201600042. [DOI] [PMC free article] [PubMed] [Google Scholar]
- Alberti S., Saha S., Woodruff J.B., Franzmann T.M., Wang J., Hyman A.A. A user’s guide for phase separation assays with purified proteins. J. Mol. Biol. 2018;430:4806–4820. doi: 10.1016/j.jmb.2018.06.038. [DOI] [PMC free article] [PubMed] [Google Scholar]
- Alberti S., Gladfelter A., Mittag T. Considerations and Challenges in Studying Liquid-Liquid Phase Separation and Biomolecular Condensates. Cell. 2019;176:419–434. doi: 10.1016/j.cell.2018.12.035. [DOI] [PMC free article] [PubMed] [Google Scholar]
- Anderson P., Kedersha N. Visibly stressed: the role of eIF2, TIA-1, and stress granules in protein translation. Cell Stress Chaperones. 2002;7:213–221. doi: 10.1379/1466-1268(2002)007<0213:vstroe>2.0.co;2. [DOI] [PMC free article] [PubMed] [Google Scholar]
- Aulas A., Fay M.M., Lyons S.M., Achorn C.A., Kedersha N., Anderson P., Ivanov P. Stress-specific differences in assembly and composition of stress granules and related foci. J. Cell Sci. 2017;130:927–937. doi: 10.1242/jcs.199240. [DOI] [PMC free article] [PubMed] [Google Scholar]
- Banani S.F., Lee H.O., Hyman A.A., Rosen M.K. Biomolecular condensates: organizers of cellular biochemistry. Nat. Rev. Mol. Cell Biol. 2017;18:285–298. doi: 10.1038/nrm.2017.7. [DOI] [PMC free article] [PubMed] [Google Scholar]
- Bley N., Lederer M., Pfalz B., Reinke C., Fuchs T., Glaß M., Möller B., Hüttelmaier S. Stress granules are dispensable for mRNA stabilization during cellular stress. Nucleic Acids Res. 2015;43:e26. doi: 10.1093/nar/gku1275. [DOI] [PMC free article] [PubMed] [Google Scholar]
- Boeynaems S., Alberti S., Fawzi N.L., Mittag T., Polymenidou M., Rousseau F., Schymkowitz J., Shorter J., Wolozin B., Van Den Bosch L. Protein Phase Separation: A New Phase in Cell Biology. Trends Cell Biol. 2018;28:420–435. doi: 10.1016/j.tcb.2018.02.004. [DOI] [PMC free article] [PubMed] [Google Scholar]
- Bounedjah O., Desforges B., Wu T.-D., Pioche-Durieu C., Marco S., Hamon L., Curmi P.A., Guerquin-Kern J.-L., Piétrement O., Pastré D. Free mRNA in excess upon polysome dissociation is a scaffold for protein multimerization to form stress granules. Nucleic Acids Res. 2014;42:8678–8691. doi: 10.1093/nar/gku582. [DOI] [PMC free article] [PubMed] [Google Scholar]
- Brady J.P., Farber P.J., Sekhar A., Lin Y.-H., Huang R., Bah A., Nott T.J., Chan H.S., Baldwin A.J., Forman-Kay J.D., Kay L.E. Structural and hydrodynamic properties of an intrinsically disordered region of a germ cell-specific protein on phase separation. Proc. Natl. Acad. Sci. USA. 2017;114:E8194–E8203. doi: 10.1073/pnas.1706197114. [DOI] [PMC free article] [PubMed] [Google Scholar]
- Brengues M., Teixeira D., Parker R. Movement of eukaryotic mRNAs between polysomes and cytoplasmic processing bodies. Science. 2005;310:486–489. doi: 10.1126/science.1115791. [DOI] [PMC free article] [PubMed] [Google Scholar]
- Bullock T.L., Clarkson W.D., Kent H.M., Stewart M. The 1.6 angstroms resolution crystal structure of nuclear transport factor 2 (NTF2) J. Mol. Biol. 1996;260:422–431. doi: 10.1006/jmbi.1996.0411. [DOI] [PubMed] [Google Scholar]
- Burke K.A., Janke A.M., Rhine C.L., Fawzi N.L. Residue-by-Residue View of In Vitro FUS Granules that Bind the C-Terminal Domain of RNA Polymerase II. Mol. Cell. 2015;60:231–241. doi: 10.1016/j.molcel.2015.09.006. [DOI] [PMC free article] [PubMed] [Google Scholar]
- Chen C., Zhang H., Broitman S.L., Reiche M., Farrell I., Cooperman B.S., Goldman Y.E. Dynamics of translation by single ribosomes through mRNA secondary structures. Nat. Struct. Mol. Biol. 2013;20:582–588. doi: 10.1038/nsmb.2544. [DOI] [PMC free article] [PubMed] [Google Scholar]
- Chen B.-C., Legant W.R., Wang K., Shao L., Milkie D.E., Davidson M.W., Janetopoulos C., Wu X.S., Hammer J.A., 3rd, Liu Z. Lattice light-sheet microscopy: imaging molecules to embryos at high spatiotemporal resolution. Science. 2014;346:1257998. doi: 10.1126/science.1257998. [DOI] [PMC free article] [PubMed] [Google Scholar]
- Choi J.-M., Holehouse A.M., Pappu R.V. Physical Principles Underlying the Complex Biology of Intracellular Phase Transitions. Annu. Rev. Biophys. 2020;49 doi: 10.1146/annurev-biophys-121219-081629. [DOI] [PMC free article] [PubMed] [Google Scholar]
- Clemson C.M., Hutchinson J.N., Sara S.A., Ensminger A.W., Fox A.H., Chess A., Lawrence J.B. An architectural role for a nuclear noncoding RNA: NEAT1 RNA is essential for the structure of paraspeckles. Mol. Cell. 2009;33:717–726. doi: 10.1016/j.molcel.2009.01.026. [DOI] [PMC free article] [PubMed] [Google Scholar]
- Cuche E., Marquet P., Depeursinge C. Spatial filtering for zero-order and twin-image elimination in digital off-axis holography. Appl. Opt. 2000;39:4070–4075. doi: 10.1364/ao.39.004070. [DOI] [PubMed] [Google Scholar]
- Das R.K., Ruff K.M., Pappu R.V. Relating sequence encoded information to form and function of intrinsically disordered proteins. Curr. Opin. Struct. Biol. 2015;32:102–112. doi: 10.1016/j.sbi.2015.03.008. [DOI] [PMC free article] [PubMed] [Google Scholar]
- Danev R., Buijsse B., Khoshouei M., Plitzko J.M., Baumeister W. Volta potential phase plate for in-focus phase contrast transmission electron microscopy. Proc Natl Acad Sci U S A. 2014;111:15635–15640. doi: 10.1073/pnas.1418377111. [DOI] [PMC free article] [PubMed] [Google Scholar]
- Das R.K., Huang Y., Phillips A.H., Kriwacki R.W., Pappu R.V. Cryptic sequence features within the disordered protein p27Kip1 regulate cell cycle signaling. Proc. Natl. Acad. Sci. USA. 2016;113:5616–5621. doi: 10.1073/pnas.1516277113. [DOI] [PMC free article] [PubMed] [Google Scholar]
- Dosztányi Z., Csizmók V., Tompa P., Simon I. The pairwise energy content estimated from amino acid composition discriminates between folded and intrinsically unstructured proteins. J Mol Biol. 2005;347:827–839. doi: 10.1016/j.jmb.2005.01.071. [DOI] [PubMed] [Google Scholar]
- Dubiel K., Myers A.R., Kozlov A.G., Yang O., Zhang J., Ha T., Lohman T.M., Keck J.L. Structural Mechanisms of Cooperative DNA Binding by Bacterial Single-Stranded DNA-Binding Proteins. J. Mol. Biol. 2019;431:178–195. doi: 10.1016/j.jmb.2018.11.019. [DOI] [PMC free article] [PubMed] [Google Scholar]
- Fang M.Y., Markmiller S., Vu A.Q., Javaherian A., Dowdle W.E., Jolivet P., Bushway P.J., Castello N.A., Baral A., Chan M.Y. Small-Molecule Modulation of TDP-43 Recruitment to Stress Granules Prevents Persistent TDP-43 Accumulation in ALS/FTD. Neuron. 2019;103:802–819.e11. doi: 10.1016/j.neuron.2019.05.048. [DOI] [PMC free article] [PubMed] [Google Scholar]
- Fei J., Jadaliha M., Harmon T.S., Li I.T.S., Hua B., Hao Q., Holehouse A.S., Reyer M., Sun Q., Freier S.M. Quantitative analysis of multilayer organization of proteins and RNA in nuclear speckles at super resolution. J. Cell Sci. 2017;130:4180–4192. doi: 10.1242/jcs.206854. [DOI] [PMC free article] [PubMed] [Google Scholar]
- Feric M., Vaidya N., Harmon T.S., Mitrea D.M., Zhu L., Richardson T.M., Kriwacki R.W., Pappu R.V., Brangwynne C.P. Coexisting Liquid Phases Underlie Nucleolar Subcompartments. Cell. 2016;165:1686–1697. doi: 10.1016/j.cell.2016.04.047. [DOI] [PMC free article] [PubMed] [Google Scholar]
- Fleming P.J., Fleming K.G. HullRad: Fast Calculations of Folded and Disordered Protein and Nucleic Acid Hydrodynamic Properties. Biophys. J. 2018;114:856–869. doi: 10.1016/j.bpj.2018.01.002. [DOI] [PMC free article] [PubMed] [Google Scholar]
- Fossat M.J., Pappu R.V. q-Canonical Monte Carlo Sampling for Modeling the Linkage between Charge Regulation and Conformational Equilibria of Peptides. J. Phys. Chem. B. 2019;123:6952–6967. doi: 10.1021/acs.jpcb.9b05206. [DOI] [PMC free article] [PubMed] [Google Scholar]
- Franzmann T.M., Alberti S. Prion-like low-complexity sequences: Key regulators of protein solubility and phase behavior. J. Biol. Chem. 2019;294:7128–7136. doi: 10.1074/jbc.TM118.001190. [DOI] [PMC free article] [PubMed] [Google Scholar]
- Franzmann T.M., Alberti S. Protein Phase Separation as a Stress Survival Strategy. Cold Spring Harb. Perspect. Biol. 2019;11 doi: 10.1101/cshperspect.a034058. [DOI] [PMC free article] [PubMed] [Google Scholar]
- Franzmann T.M., Jahnel M., Pozniakovsky A., Mahamid J., Holehouse A.S., Nüske E., Richter D., Baumeister W., Grill S.W., Pappu R.V. Phase separation of a yeast prion protein promotes cellular fitness. Science. 2018;359 doi: 10.1126/science.aao5654. [DOI] [PubMed] [Google Scholar]
- Ganassi M., Mateju D., Bigi I., Mediani L., Poser I., Lee H.O., Seguin S.J., Morelli F.F., Vinet J., Leo G. A Surveillance Function of the HSPB8-BAG3-HSP70 Chaperone Complex Ensures Stress Granule Integrity and Dynamism. Mol. Cell. 2016;63:796–810. doi: 10.1016/j.molcel.2016.07.021. [DOI] [PubMed] [Google Scholar]
- Hagen W.J.H., Wan W., Briggs J.A.G. Implementation of a cryo-electron tomography tilt-scheme optimized for high resolution subtomogram averaging. J. Struct. Biol. 2017;197:191–198. doi: 10.1016/j.jsb.2016.06.007. [DOI] [PMC free article] [PubMed] [Google Scholar]
- Harmon T.S., Holehouse A.S., Pappu R.V. To Mix, or To Demix, That Is the Question. Biophys. J. 2017;112:565–567. doi: 10.1016/j.bpj.2016.12.031. [DOI] [PMC free article] [PubMed] [Google Scholar]
- Harmon T.S., Holehouse A.S., Rosen M.K., Pappu R.V. Intrinsically disordered linkers determine the interplay between phase separation and gelation in multivalent proteins. eLife. 2017;6:e30294. doi: 10.7554/eLife.30294. [DOI] [PMC free article] [PubMed] [Google Scholar]
- Harris T.K., Turner G.J. Structural basis of perturbed pKa values of catalytic groups in enzyme active sites. IUBMB Life. 2002;53:85–98. doi: 10.1080/15216540211468. [DOI] [PubMed] [Google Scholar]
- Hein M.Y., Hubner N.C., Poser I., Cox J., Nagaraj N., Toyoda Y., Gak I.A., Weisswange I., Mansfeld J., Buchholz F. A human interactome in three quantitative dimensions organized by stoichiometries and abundances. Cell. 2015;163:712–723. doi: 10.1016/j.cell.2015.09.053. [DOI] [PubMed] [Google Scholar]
- Hoell J.I., Larsson E., Runge S., Nusbaum J.D., Duggimpudi S., Farazi T.A., Hafner M., Borkhardt A., Sander C., Tuschl T. RNA targets of wild-type and mutant FET family proteins. Nat. Struct. Mol. Biol. 2011;18:1428–1431. doi: 10.1038/nsmb.2163. [DOI] [PMC free article] [PubMed] [Google Scholar]
- Holehouse A.S., Das R.K., Ahad J.N., Richardson M.O.G., Pappu R.V. CIDER: Resources to Analyze Sequence-Ensemble Relationships of Intrinsically Disordered Proteins. Biophys. J. 2017;112:16–21. doi: 10.1016/j.bpj.2016.11.3200. [DOI] [PMC free article] [PubMed] [Google Scholar]
- Hornbeck P.V., Zhang B., Murray B., Kornhauser J.M., Latham V., Skrzypek E. PhosphoSitePlus, 2014: mutations, PTMs and recalibrations. Nucleic Acids Res. 2015;43:D512–D520. doi: 10.1093/nar/gku1267. [DOI] [PMC free article] [PubMed] [Google Scholar]
- Huerta-Cepas J., Szklarczyk D., Forslund K., Cook H., Heller D., Walter M.C., Rattei T., Mende D.R., Sunagawa S., Kuhn M. eggNOG 4.5: a hierarchical orthology framework with improved functional annotations for eukaryotic, prokaryotic and viral sequences. Nucleic Acids Res. 2016;44(D1):D286–D293. doi: 10.1093/nar/gkv1248. [DOI] [PMC free article] [PubMed] [Google Scholar]
- Jahnel M., Behrndt M., Jannasch A., Schäffer E., Grill S.W. Measuring the complete force field of an optical trap. Optics Letters. 2011;36:1260–1262. doi: 10.1364/OL.36.001260. [DOI] [PubMed] [Google Scholar]
- Jain A., Vale R.D. RNA phase transitions in repeat expansion disorders. Nature. 2017;546:243–247. doi: 10.1038/nature22386. [DOI] [PMC free article] [PubMed] [Google Scholar]
- Jain S., Wheeler J.R., Walters R.W., Agrawal A., Barsic A., Parker R. ATPase-Modulated Stress Granules Contain a Diverse Proteome and Substructure. Cell. 2016;164:487–498. doi: 10.1016/j.cell.2015.12.038. [DOI] [PMC free article] [PubMed] [Google Scholar]
- Kato M., McKnight S.L. A Solid-State Conceptualization of Information Transfer from Gene to Message to Protein. Annu. Rev. Biochem. 2018;87:351–390. doi: 10.1146/annurev-biochem-061516-044700. [DOI] [PubMed] [Google Scholar]
- Jarvis D.L. Recombinant protein expression in baculovirus-infected insect cells. Methods in Enzymology. 2014;536:149–163. doi: 10.1016/B978-0-12-420070-8.00013-1. [DOI] [PMC free article] [PubMed] [Google Scholar]
- Kato M., Han T.W., Xie S., Shi K., Du X., Wu L.C., Mirzaei H., Goldsmith E.J., Longgood J., Pei J. Cell-free formation of RNA granules: low complexity sequence domains form dynamic fibers within hydrogels. Cell. 2012;149:753–767. doi: 10.1016/j.cell.2012.04.017. [DOI] [PMC free article] [PubMed] [Google Scholar]
- Kedersha N., Cho M.R., Li W., Yacono P.W., Chen S., Gilks N., Golan D.E., Anderson P. Dynamic shuttling of TIA-1 accompanies the recruitment of mRNA to mammalian stress granules. J. Cell Biol. 2000;151:1257–1268. doi: 10.1083/jcb.151.6.1257. [DOI] [PMC free article] [PubMed] [Google Scholar]
- Kedersha N., Chen S., Gilks N., Li W., Miller I.J., Stahl J., Anderson P. Evidence that ternary complex (eIF2-GTP-tRNA(i)(Met))-deficient preinitiation complexes are core constituents of mammalian stress granules. Mol. Biol. Cell. 2002;13:195–210. doi: 10.1091/mbc.01-05-0221. [DOI] [PMC free article] [PubMed] [Google Scholar]
- Kedersha N., Panas M.D., Achorn C.A., Lyons S., Tisdale S., Hickman T., Thomas M., Lieberman J., McInerney G.M., Ivanov P., Anderson P. G3BP-Caprin1-USP10 complexes mediate stress granule condensation and associate with 40S subunits. J. Cell Biol. 2016;212:845–860. doi: 10.1083/jcb.201508028. [DOI] [PMC free article] [PubMed] [Google Scholar]
- Kelley L.A., Mezulis S., Yates C.M., Wass M.N., Sternberg M.J.E. The Phyre2 web portal for protein modeling, prediction and analysis. Nat. Protoc. 2015;10:845–858. doi: 10.1038/nprot.2015.053. [DOI] [PMC free article] [PubMed] [Google Scholar]
- Kent H.M., Clarkson W.D., Bullock T.L., Stewart M. Crystallization and preliminary X-ray diffraction analysis of nuclear transport factor 2. J. Struct. Biol. 1996;116:326–329. doi: 10.1006/jsbi.1996.0049. [DOI] [PubMed] [Google Scholar]
- Khong A., Parker R. mRNP architecture in translating and stress conditions reveals an ordered pathway of mRNP compaction. J. Cell Biol. 2018;217:4124–4140. doi: 10.1083/jcb.201806183. [DOI] [PMC free article] [PubMed] [Google Scholar]
- Khong A., Matheny T., Jain S., Mitchell S.F., Wheeler J.R., Parker R. The Stress Granule Transcriptome Reveals Principles of mRNA Accumulation in Stress Granules. Mol. Cell. 2017;68:808–820.e5. doi: 10.1016/j.molcel.2017.10.015. [DOI] [PMC free article] [PubMed] [Google Scholar]
- Kim K., Yoon H., Diez-Silva M., Dao M., Dasari R.R., Park Y. High-resolution three-dimensional imaging of red blood cells parasitized by Plasmodium falciparum and in situ hemozoin crystals using optical diffraction tomography. J. Biomed. Opt. 2014;19:011005. doi: 10.1117/1.JBO.19.1.011005. [DOI] [PMC free article] [PubMed] [Google Scholar]
- Kimball S.R., Horetsky R.L., Ron D., Jefferson L.S., Harding H.P. Mammalian stress granules represent sites of accumulation of stalled translation initiation complexes. Am. J. Physiol. Cell Physiol. 2003;284:C273–C284. doi: 10.1152/ajpcell.00314.2002. [DOI] [PubMed] [Google Scholar]
- Kremer J.R., Mastronarde D.N., McIntosh J.R. Computer visualization of three-dimensional image data using IMOD. Journal of Structural Biology. 1996;116:71–76. doi: 10.1006/jsbi.1996.0013. [DOI] [PubMed] [Google Scholar]
- Kroschwald S., Maharana S., Mateju D., Malinovska L., Nüske E., Poser I., Richter D., Alberti S. Promiscuous interactions and protein disaggregases determine the material state of stress-inducible RNP granules. eLife. 2015;4:e06807. doi: 10.7554/eLife.06807. [DOI] [PMC free article] [PubMed] [Google Scholar]
- Lancaster L.K., Nutter-Upham A., Lindquist S., King O.D. PLAAC: a web and command-line application to identify proteins with prion-like amino acid. Bioinformatics. 2014;30:2501–2502. doi: 10.1093/bioinformatics/btu310. [DOI] [PMC free article] [PubMed] [Google Scholar]
- Li Q., Chang Y.-T. A protocol for preparing, characterizing and using three RNA-specific, live cell imaging probes: E36, E144 and F22. Nat. Protoc. 2006;1:2922–2932. doi: 10.1038/nprot.2006.484. [DOI] [PubMed] [Google Scholar]
- Lin Y., Protter D.S.W., Rosen M.K., Parker R. Formation and Maturation of Phase-Separated Liquid Droplets by RNA-Binding Proteins. Mol. Cell. 2015;60:208–219. doi: 10.1016/j.molcel.2015.08.018. [DOI] [PMC free article] [PubMed] [Google Scholar]
- Lin Y., Schmidt B.F., Bruchez M.P., McManus C.J. Structural analyses of NEAT1 lncRNAs suggest long-range RNA interactions that may contribute to paraspeckle architecture. Nucleic Acids Res. 2018;46:3742–3752. doi: 10.1093/nar/gky046. [DOI] [PMC free article] [PubMed] [Google Scholar]
- Lohman T.M., Ferrari M.E. Escherichia coli single-stranded DNA-binding protein: multiple DNA-binding modes and cooperativities. Annu. Rev. Biochem. 1994;63:527–570. doi: 10.1146/annurev.bi.63.070194.002523. [DOI] [PubMed] [Google Scholar]
- Lotufo R., Falcao A. The ordered queue and the optimality of the watershed approaches. In: Goutsias J., Vincent L., Bloomberg D.S., editors. Mathematical Morphology and Its Applications to Image and Signal Processing. Springer US; 2000. pp. 341–350. [Google Scholar]
- Mackenzie I.R., Nicholson A.M., Sarkar M., Messing J., Purice M.D., Pottier C., Annu K., Baker M., Perkerson R.B., Kurti A. TIA1 Mutations in Amyotrophic Lateral Sclerosis and Frontotemporal Dementia Promote Phase Separation and Alter Stress Granule Dynamics. Neuron. 2017;95:808–816.e9. doi: 10.1016/j.neuron.2017.07.025. [DOI] [PMC free article] [PubMed] [Google Scholar]
- Madeira F., Park Y.M., Lee J., Buso N., Gur T., Madhusoodanan N., Basutkar P., Tivey A.R.N., Potter S.C., Finn R.D., Lopez R. The EMBL-EBI search and sequence analysis tools APIs in 2019. Nucleic Acids Res. 2019;47(W1):W636–W641. doi: 10.1093/nar/gkz268. [DOI] [PMC free article] [PubMed] [Google Scholar]
- Mao Y., Liu H., Liu Y., Tao S. Deciphering the rules by which dynamics of mRNA secondary structure affect translation efficiency in Saccharomyces cerevisiae. Nucleic Acids Res. 2014;42:4813–4822. doi: 10.1093/nar/gku159. [DOI] [PMC free article] [PubMed] [Google Scholar]
- Maraspini R., Beutel O., Honigmann A. Circle scanning STED fluorescence correlation spectroscopy to quantify membrane dynamics and compartmentalization. Methods. 2018;140-141:188–197. doi: 10.1016/j.ymeth.2017.12.005. [DOI] [PubMed] [Google Scholar]
- Markmiller S., Soltanieh S., Server K.L., Mak R., Jin W., Fang M.Y., Luo E.-C., Krach F., Yang D., Sen A. Context-Dependent and Disease-Specific Diversity in Protein Interactions within Stress Granules. Cell. 2018;172:590–604.e13. doi: 10.1016/j.cell.2017.12.032. [DOI] [PMC free article] [PubMed] [Google Scholar]
- Martin E.W., Holehouse A.S., Grace C.R., Hughes A., Pappu R.V., Mittag T. Sequence Determinants of the Conformational Properties of an Intrinsically Disordered Protein Prior to and Upon Multisite Phosphorylation. J. Am. Chem. Soc. 2016;138:15323–15335. doi: 10.1021/jacs.6b10272. [DOI] [PMC free article] [PubMed] [Google Scholar]
- Mastronarde D.N. Automated electron microscope tomography using robust prediction of specimen movements. J. Struct. Biol. 2005;152:36–51. doi: 10.1016/j.jsb.2005.07.007. [DOI] [PubMed] [Google Scholar]
- Mateju D., Franzmann T.M., Patel A., Kopach A., Boczek E.E., Maharana S., Lee H.O., Carra S., Hyman A.A., Alberti S. An aberrant phase transition of stress granules triggered by misfolded protein and prevented by chaperone function. EMBO J. 2017;36:1669–1687. doi: 10.15252/embj.201695957. [DOI] [PMC free article] [PubMed] [Google Scholar]
- Matsuki H., Takahashi M., Higuchi M., Makokha G.N., Oie M., Fujii M. Both G3BP1 and G3BP2 contribute to stress granule formation. Genes Cells. 2013;18:135–146. doi: 10.1111/gtc.12023. [DOI] [PubMed] [Google Scholar]
- Mazroui R., Sukarieh R., Bordeleau M.-E., Kaufman R.J., Northcote P., Tanaka J., Gallouzi I., Pelletier J. Inhibition of ribosome recruitment induces stress granule formation independently of eukaryotic initiation factor 2α phosphorylation. Mol. Biol. Cell. 2006;17:4212–4219. doi: 10.1091/mbc.E06-04-0318. [DOI] [PMC free article] [PubMed] [Google Scholar]
- McGibbon R.T., Beauchamp K.A., Harrigan M.P., Klein C., Swails J.M., Hernández C.X., Schwantes C.R., Wang L.-P., Lane T.J., Pande V.S. MDTraj: A Modern Open Library for the Analysis of Molecular Dynamics Trajectories. Biophys. J. 2015;109:1528–1532. doi: 10.1016/j.bpj.2015.08.015. [DOI] [PMC free article] [PubMed] [Google Scholar]
- Mitchell S.F., Parker R. Principles and properties of eukaryotic mRNPs. Mol. Cell. 2014;54:547–558. doi: 10.1016/j.molcel.2014.04.033. [DOI] [PubMed] [Google Scholar]
- Mittal A., Holehouse A.S., Cohan M.C., Pappu R.V. Sequence-to-Conformation Relationships of Disordered Regions Tethered to Folded Domains of Proteins. J. Mol. Biol. 2018;430:2403–2421. doi: 10.1016/j.jmb.2018.05.012. [DOI] [PubMed] [Google Scholar]
- Mollet S., Cougot N., Wilczynska A., Dautry F., Kress M., Bertrand E., Weil D. Translationally repressed mRNA transiently cycles through stress granules during stress. Mol. Biol. Cell. 2008;19:4469–4479. doi: 10.1091/mbc.E08-05-0499. [DOI] [PMC free article] [PubMed] [Google Scholar]
- Molliex A., Temirov J., Lee J., Coughlin M., Kanagaraj A.P., Kim H.J., Mittag T., Taylor J.P. Phase separation by low complexity domains promotes stress granule assembly and drives pathological fibrillization. Cell. 2015;163:123–133. doi: 10.1016/j.cell.2015.09.015. [DOI] [PMC free article] [PubMed] [Google Scholar]
- Müller-McNicoll M., Neugebauer K.M. How cells get the message: dynamic assembly and function of mRNA-protein complexes. Nat. Rev. Genet. 2013;14:275–287. doi: 10.1038/nrg3434. [DOI] [PubMed] [Google Scholar]
- Nagata T., Kurihara Y., Matsuda G., Saeki J.-I., Kohno T., Yanagida Y., Ishikawa F., Uesugi S., Katahira M. Structure and interactions with RNA of the N-terminal UUAG-specific RNA-binding domain of hnRNP Do. J. Mol. Biol. 1999;287:221–237. doi: 10.1006/jmbi.1999.2616. [DOI] [PubMed] [Google Scholar]
- Namkoong S., Ho A., Woo Y.M., Kwak H., Lee J.H. Systematic Characterization of Stress-Induced RNA Granulation. Mol. Cell. 2018;70:175–187.e8. doi: 10.1016/j.molcel.2018.02.025. [DOI] [PMC free article] [PubMed] [Google Scholar]
- Niewidok B., Igaev M., Pereira da Graca A., Strassner A., Lenzen C., Richter C.P., Piehler J., Kurre R., Brandt R. Single-molecule imaging reveals dynamic biphasic partition of RNA-binding proteins in stress granules. J. Cell Biol. 2018;217:1303–1318. doi: 10.1083/jcb.201709007. [DOI] [PMC free article] [PubMed] [Google Scholar]
- Panas M.D., Ivanov P., Anderson P. Mechanistic insights into mammalian stress granule dynamics. J. Cell Biol. 2016;215:313–323. doi: 10.1083/jcb.201609081. [DOI] [PMC free article] [PubMed] [Google Scholar]
- Panas M.D., Kedersha N., Schulte T., Branca R.M., Ivanov P., Anderson P. Phosphorylation of G3BP1-S149 does not influence stress granule assembly. J. Cell Biol. 2019;218:2425–2432. doi: 10.1083/jcb.201801214. [DOI] [PMC free article] [PubMed] [Google Scholar]
- Patel A., Lee H.O., Jawerth L., Maharana S., Jahnel M., Hein M.Y., Stoynov S., Mahamid J., Saha S., Franzmann T.M. A Liquid-to-Solid Phase Transition of the ALS Protein FUS Accelerated by Disease Mutation. Cell. 2015;162:1066–1077. doi: 10.1016/j.cell.2015.07.047. [DOI] [PubMed] [Google Scholar]
- Pavitt G.D. eIF2B, a mediator of general and gene-specific translational control. Biochem. Soc. Trans. 2005;33:1487–1492. doi: 10.1042/BST0331487. [DOI] [PubMed] [Google Scholar]
- Posey A.E., Holehouse A.S., Pappu R.V. Phase Separation of Intrinsically Disordered Proteins. Methods Enzymol. 2018;611:1–30. doi: 10.1016/bs.mie.2018.09.035. [DOI] [PubMed] [Google Scholar]
- Protter D.S.W., Parker R. Principles and Properties of Stress Granules. Trends Cell Biol. 2016;26:668–679. doi: 10.1016/j.tcb.2016.05.004. [DOI] [PMC free article] [PubMed] [Google Scholar]
- Protter D.S.W., Rao B.S., Van Treeck B., Lin Y., Mizoue L., Rosen M.K., Parker R. Intrinsically Disordered Regions Can Contribute Promiscuous Interactions to RNP Granule Assembly. Cell Rep. 2018;22:1401–1412. doi: 10.1016/j.celrep.2018.01.036. [DOI] [PMC free article] [PubMed] [Google Scholar]
- Qu X., Wen J.-D., Lancaster L., Noller H.F., Bustamante C., Tinoco I., Jr. The ribosome uses two active mechanisms to unwind messenger RNA during translation. Nature. 2011;475:118–121. doi: 10.1038/nature10126. [DOI] [PMC free article] [PubMed] [Google Scholar]
- Reineke L.C., Tsai W.-C., Jain A., Kaelber J.T., Jung S.Y., Lloyd R.E. Casein Kinase 2 Is Linked to Stress Granule Dynamics through Phosphorylation of the Stress Granule Nucleating Protein G3BP1. Mol. Cell. Biol. 2017;37 doi: 10.1128/MCB.00596-16. [DOI] [PMC free article] [PubMed] [Google Scholar]
- Ruggeri F., Zosel F., Mutter N., Różycka M., Wojtas M., Ożyhar A., Schuler B., Krishnan M. Single-molecule electrometry. Nat. Nanotechnol. 2017;12:488–495. doi: 10.1038/nnano.2017.26. [DOI] [PubMed] [Google Scholar]
- Sahoo P.K., Lee S.J., Jaiswal P.B., Alber S., Kar A.N., Miller-Randolph S., Taylor E.E., Smith T., Singh B., Ho T.S.-Y. Axonal G3BP1 stress granule protein limits axonal mRNA translation and nerve regeneration. Nat. Commun. 2018;9:3358. doi: 10.1038/s41467-018-05647-x. [DOI] [PMC free article] [PubMed] [Google Scholar]
- Sanders D.W., Kedersha N., Lee D.S.W., Strom A.R., Drake V., Riback J.A., Bracha D., Eeftens J.M., Iwanicki A., Wang A. Competing Protein-RNA Interaction Networks Control Multiphase Intracellular Organization. Cell. 2020;181:306–324. doi: 10.1016/j.cell.2020.03.050. this issue. [DOI] [PMC free article] [PubMed] [Google Scholar]
- Schindelin J., Arganda-Carreras I., Frise E., Kaynig V., Longair M., Pietzsch T., Preibisch S., Rueden C., Saalfeld S., Schmid B. Fiji: an open-source platform for biological-image analysis. Nat. Methods. 2012;9:676–682. doi: 10.1038/nmeth.2019. [DOI] [PMC free article] [PubMed] [Google Scholar]
- Shin Y., Brangwynne C.P. Liquid phase condensation in cell physiology and disease. Science. 2017;357:eaaf4382. doi: 10.1126/science.aaf4382. [DOI] [PubMed] [Google Scholar]
- Solomon S., Xu Y., Wang B., David M.D., Schubert P., Kennedy D., Schrader J.W. Distinct structural features of caprin-1 mediate its interaction with G3BP-1 and its induction of phosphorylation of eukaryotic translation initiation factor 2alpha, entry to cytoplasmic stress granules, and selective interaction with a subset of mRNAs. Mol. Cell. Biol. 2007;27:2324–2342. doi: 10.1128/MCB.02300-06. [DOI] [PMC free article] [PubMed] [Google Scholar]
- Sung Y., Choi W., Fang-Yen C., Badizadegan K., Dasari R.R., Feld M.S. Optical diffraction tomography for high resolution live cell imaging. Opt. Express. 2009;17:266–277. doi: 10.1364/oe.17.000266. [DOI] [PMC free article] [PubMed] [Google Scholar]
- Takeda M., Ina H., Kobayashi S. Fourier-transform method of fringe-pattern analysis for computer-based topography and interferometry. J. Opt. Soc. Am. JOSA. 1982;72:156–160. [Google Scholar]
- Tauber D., Tauber G., Khong A., Van Treeck B., Pelletier J., Parker R. Modulation of RNA Condensation by the DEAD-Box Protein eIF4A. Cell. 2020;180:411–426.e16. doi: 10.1016/j.cell.2019.12.031. [DOI] [PMC free article] [PubMed] [Google Scholar]
- Taylor J.P., Brown R.H., Jr., Cleveland D.W. Decoding ALS: from genes to mechanism. Nature. 2016;539:197–206. doi: 10.1038/nature20413. [DOI] [PMC free article] [PubMed] [Google Scholar]
- Thévenaz P., Ruttimann U.E., Unser M. A pyramid approach to subpixel registration based on intensity. IEEE Trans. Image Process. 1998;7:27–41. doi: 10.1109/83.650848. [DOI] [PubMed] [Google Scholar]
- Tourrière H., Chebli K., Zekri L., Courselaud B., Blanchard J.M., Bertrand E., Tazi J. The RasGAP-associated endoribonuclease G3BP assembles stress granules. J. Cell Biol. 2003;160:823–831. doi: 10.1083/jcb.200212128. [DOI] [PMC free article] [PubMed] [Google Scholar] [Retracted]
- Tsai W.-C., Gayatri S., Reineke L.C., Sbardella G., Bedford M.T., Lloyd R.E. Arginine Demethylation of G3BP1 Promotes Stress Granule Assembly. J. Biol. Chem. 2016;291:22671–22685. doi: 10.1074/jbc.M116.739573. [DOI] [PMC free article] [PubMed] [Google Scholar]
- Van Treeck B., Parker R. Emerging Roles for Intermolecular RNA-RNA Interactions in RNP Assemblies. Cell. 2018;174:791–802. doi: 10.1016/j.cell.2018.07.023. [DOI] [PMC free article] [PubMed] [Google Scholar]
- Van Treeck B., Protter D.S.W., Matheny T., Khong A., Link C.D., Parker R. RNA self-assembly contributes to stress granule formation and defining the stress granule transcriptome. Proc. Natl. Acad. Sci. USA. 2018;115:2734–2739. doi: 10.1073/pnas.1800038115. [DOI] [PMC free article] [PubMed] [Google Scholar]
- Vincent L., Soille P. Watersheds in digital spaces: an efficient algorithm based on immersion simulations. IEEE Trans. Pattern Anal. Mach. Intell. 1991;13:583–598. [Google Scholar]
- Vitalis A., Pappu R.V. ABSINTH: a new continuum solvation model for simulations of polypeptides in aqueous solutions. J. Comput. Chem. 2009;30:673–699. doi: 10.1002/jcc.21005. [DOI] [PMC free article] [PubMed] [Google Scholar]
- Vitalis A., Pappu R.V. Methods for Monte Carlo simulations of biomacromolecules. Annu. Rep. Comput. Chem. 2009;5:49–76. doi: 10.1016/S1574-1400(09)00503-9. [DOI] [PMC free article] [PubMed] [Google Scholar]
- Vognsen T., Møller I.R., Kristensen O. Crystal structures of the human G3BP1 NTF2-like domain visualize FxFG Nup repeat specificity. PLoS ONE. 2013;8:e80947. doi: 10.1371/journal.pone.0080947. [DOI] [PMC free article] [PubMed] [Google Scholar]
- Wang J.T., Smith J., Chen B.-C., Schmidt H., Rasoloson D., Paix A., Lambrus B.G., Calidas D., Betzig E., Seydoux G. Regulation of RNA granule dynamics by phosphorylation of serine-rich, intrinsically disordered proteins in C. elegans. eLife. 2014;3:e04591. doi: 10.7554/eLife.04591. [DOI] [PMC free article] [PubMed] [Google Scholar]
- Wang J., Choi J.-M., Holehouse A.S., Lee H.O., Zhang X., Jahnel M., Maharana S., Lemaitre R., Pozniakovsky A., Drechsel D. A Molecular Grammar Governing the Driving Forces for Phase Separation of Prion-like RNA Binding Proteins. Cell. 2018;174:688–699.e16. doi: 10.1016/j.cell.2018.06.006. [DOI] [PMC free article] [PubMed] [Google Scholar]
- Wheeler J.R., Matheny T., Jain S., Abrisch R., Parker R. Distinct stages in stress granule assembly and disassembly. eLife. 2016;5 doi: 10.7554/eLife.18413. [DOI] [PMC free article] [PubMed] [Google Scholar]
- Wolf E. Three-dimensional structure determination of semi-transparent objects from holographic data. Opt. Commun. 1969;1:153–156. [Google Scholar]
- Wyman J., Gill S.J. Ligand-linked phase changes in a biological system: applications to sickle cell hemoglobin. Proc. Natl. Acad. Sci. USA. 1980;77:5239–5242. doi: 10.1073/pnas.77.9.5239. [DOI] [PMC free article] [PubMed] [Google Scholar]
- Yang P., Mathieu C., Kolaitis R.M., Zhang P., Messing J., Yurtsever U., Yang Z., Wu J., Li Y., Pan Q. G3BP1 Is a Tunable Switch that Triggers Phase Separation to Assemble Stress Granules. Cell. 2020;181:325–345. doi: 10.1016/j.cell.2020.03.046. this issue. [DOI] [PMC free article] [PubMed] [Google Scholar]
- Youn J.-Y., Dunham W.H., Hong S.J., Knight J.D.R., Bashkurov M., Chen G.I., Bagci H., Rathod B., MacLeod G., Eng S.W.M. High-Density Proximity Mapping Reveals the Subcellular Organization of mRNA-Associated Granules and Bodies. Mol. Cell. 2018;69:517–532.e11. doi: 10.1016/j.molcel.2017.12.020. [DOI] [PubMed] [Google Scholar]
- Zhao H., Brown P.H., Schuck P. On the distribution of protein refractive index increments. Biophys. J. 2011;100:2309–2317. doi: 10.1016/j.bpj.2011.03.004. [DOI] [PMC free article] [PubMed] [Google Scholar]
Associated Data
This section collects any data citations, data availability statements, or supplementary materials included in this article.
Supplementary Materials
Cells were exposed to 1 mM sodium arsenate and imaged with conventional wide-field microscopy.
Cells were exposed to 1 mM sodium arsenate and imaged with lattice light sheet microscopy.
and S6 Scale: 40 nm; each slice is 4 nm.
Data Availability Statement
The published article includes all datasets generated and analyzed during this study. Code for lattice light sheet microscopy analysis is provided in Data S1. Other analysis procedures are described in the methods, as well as the quantification and statistical analysis sections.