Abstract
Virtual rehabilitation yields outcomes that are at least as good as traditional care for improving upper limb function and the capacity to carry out activities of daily living. Due to the advent of low-cost gaming systems and patient preference for game-based therapies, video game technology will likely be increasingly utilized in physical therapy practice in the coming years. Gaming systems that incorporate low-cost motion capture technology often generate large datasets of therapeutic movements performed over the course of rehabilitation. An infrastructure has yet to be established, however, to enable efficient processing of large quantities of movement data that are collected outside of a controlled laboratory setting. In this paper, a methodology is presented for extracting and evaluating therapeutic movements from game-based rehabilitation that occurs in uncontrolled and unmonitored settings. By overcoming these challenges, meaningful kinematic analysis of rehabilitation trajectory within an individual becomes feasible. Moreover, this methodological approach provides a vehicle for analyzing large datasets generated in uncontrolled clinical settings to enable better predictions of rehabilitation potential and dose-response relationships for personalized medicine.
Keywords: Stroke, Telerehabilitation, Serious games, Kinect, Motion capture, Motor rehabilitation, Hemiparesis, Signal processing, Clustering algorithm, Probability density function
Introduction
Virtual rehabilitation yields outcomes that are at least as good as traditional care for improving upper limb function and the capacity to carry out activities of daily living [1, 2]. Furthermore, games are more motivating than conventional therapy [3, 4]. In all likelihood, video game technology will be utilized increasingly in physical therapy practice in the coming years given the recent national investment in technologies enabling telerehabilitation, and patient preference for game-based therapies.
Many of these game-based therapies utilize natural user interfaces that incorporate low-cost marker-less motion capture (where movements are inferred based on images of the body captured via infrared depth sensors and/or video cameras, without LED/retro-reflective markers or other sensors mounted on the person). When movements of the body drive game play, it is possible to obtain large datasets of therapeutic movements performed over the course of rehabilitation. It has been established that the kinematics of reaching that occur when interacting with virtual environments mirror those performed when interacting with actual objects [5]. This creates an opportunity to leverage large datasets that are collected outside of a controlled experimental setup (i.e., in the home and clinic) to elucidate the time course and mechanisms underlying therapeutic improvement. An infrastructure has yet to be established, however, to enable efficient processing of large quantities of movement data that are collected outside of a controlled laboratory setting. The objective of this research is thus to develop computational models that can efficiently process large volumes of motion capture data collected in uncontrolled settings for subsequent kinematic analysis.
Motion capture systems advantages and potential
Consumer-based motion capture offers several advantages. It is affordable for clinics and can thus be widely adopted. Additionally, user-friendly gaming platforms have been developed to enable clinicians/patients with very little technological expertise to acquire motion capture data during therapeutic practice, with less than one minute of set-up time [6]. A motion capture system such as Microsoft Kinect™ is small and portable, and can thus be utilized in the home [7]. These advantages allow for motion capture data to be amassed continuously during rehabilitation (with or without direct therapist supervision) for every patient. The sheer quantity of data from each individual enables within-patient analysis of improvements over time, which can aid in identifying the particular elements of therapy that yield the greatest motor improvement. The data could also be examined across individuals to yield insights into dose-response relationships, and which elements of motor practice are most suited to individual motor presentations. To this end, data mining, machine learning [8–11], and computational intelligence approaches [12–14] can be employed to serve as lower-cost alternatives to traditional randomized controlled trials that cost millions of dollars and potentially isolate the effects of just one or two treatment variables [15].
Though consumer-based systems cannot be expected to yield motion capture performance as reliably as professional motion capture (e.g., the Vicon MX [16]), prior work in controlled laboratory settings has found it to be sufficient for many applications. For example, comparable accuracy (correlation coefficient r values >0.9) of joint angle measurement was shown between the Microsoft Kinect™ and professional motion capture systems [17]. Joint positions obtained from the Kinect™ version 1 sensor were within 2–6 cm of those obtained using marker-based motion capture systems (where LED or retro-refractive sensors are mounted to known parts of the body) [18]. The Kinect™ version 2 fared even better compared with Vicon MX, with discrepancies of 1–2 cm [19]. In sum, compared with professional motion capture systems, low-cost consumer-based motion capture is more accessible and easier to use in healthcare settings without greatly sacrificing accuracy; therefore, it provides a more practical solution for quantifying therapy-induced improvements in motor performance.
Motion capture systems challenges
There are two substantial challenges to obtaining meaningful motion capture from consumer-based motion capture systems, such as Microsoft Kinect™, in clinical settings. The first is the relatively low temporal resolution compared with marker-based systems. For example, the Microsoft Kinect™ advertises temporal resolution of up to 30 Hz, but 15 Hz or less is sometimes observed while users interact naturally with computer games [20, 21]. Second, within a naturalistic (i.e., uncontrolled and unmonitored) data capture setting, such as a home or clinic, movement data is captured continuously irrespective of whether patients are performing the desired therapeutic activities or extraneous movements. For example, data is recorded when individuals are walking to/from their seat after turning the game on/off or gesturing with their hands while talking. Moreover, other individuals (e.g., caregivers, therapists, other patients in an in-home or open-bay therapy setting) may be accidentally captured by the software program. Finally, for camera-based motion capture systems, inanimate objects like the arm of a chair may be occasionally perceived by the system as part of the body. Existing kinematics research has been conducted mostly in controlled laboratory settings where these scenarios can be avoided.
Current study
In this paper, a comprehensive methodology is proposed to retrieve and evaluate relevant movements from continuous therapeutic game play using consumer-based motion capture. The methodology is based on the adroit integration of several technologies: signal processing, kinematic analysis, a clustering algorithm, and a probability density function to extract and evaluate the task-relevant movements across time. Though developed using Microsoft Kinect™ data, the proposed methodology could work for any motion capture system producing a time series of either joint angles (e.g., from wearable sensor systems) or 3D coordinates of joints’ positions, also referred to as skeleton data. The validity of the proposed method is illustrated using data collected from 24 individuals employing the Microsoft Kinect™ and Recovery Rapids™ gaming system. Recovery Rapids™ is a custom video game that captures body movements via the Microsoft Kinect™ version 2 sensor. Convergent validity is assessed by relating kinematic composite scores to established laboratory-based measures of motor function.
Methodology
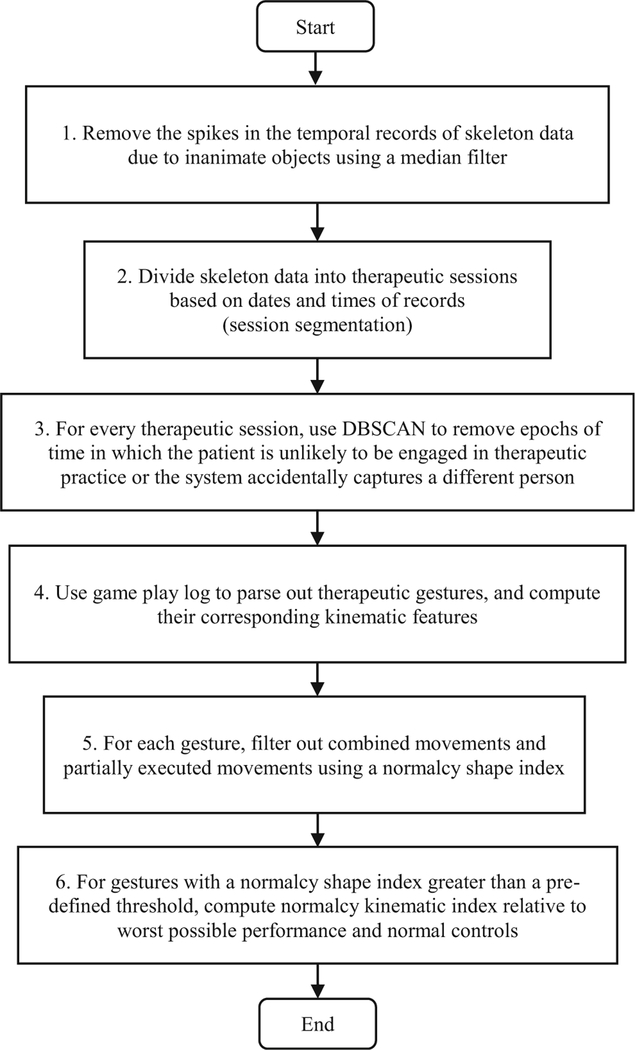
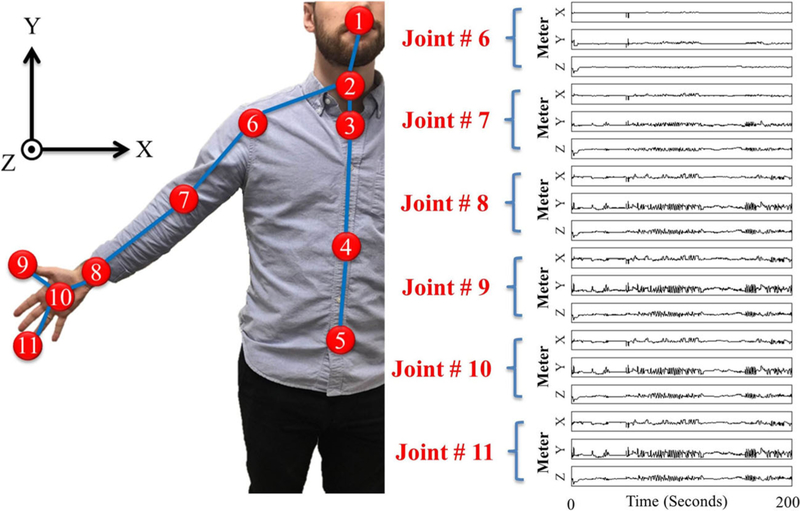
Figure 1 presents a flowchart of the 6 main steps of the proposed methodology. The input is motion capture data collected by the sensor. It consists of a time-series of joint angles and/or the 3D positions of joints (i.e., skeleton data). Figure 2 presents the eleven upper body skeleton joints for whom motion data are collected via the Microsoft Kinect™ sensor. Sample captured motions for six of these joints are displayed on the right-hand side of Fig. 2.
Fig. 1.
Macro-flowchart of the proposed methodology
Fig. 2.
Eleven upper body skeleton joints captured by Microsoft Kinect™ optical motion capture system: 1) head, 2) neck, 3) spine-shoulder, 4) spine-mid, 5) spine-base, 6) shoulder, 7) elbow, 8) wrist, 9) thumb, 10) hand, and 11) hand-tip
Step 1: Denoising time-series of motion capture data
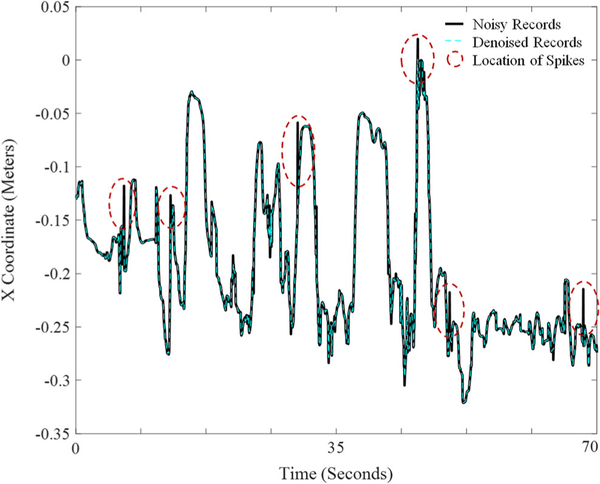
During preprocessing, duplicate motion capture data are first removed by automatically filtering out records that are exact duplicates of prior records. Recordings with missing data points (e.g., due to loss of power during recording) are also removed automatically. In Step 1, a median filter is then used to remove the spikes that represent extraneous records or noise in the data (typically less than 1% of total data). A median filter replaces each value with the median of neighboring values. To avoid flattening all peaks in the data, the median filter is only applied to data in which the difference between the raw data and median filtered time-series exceeds a set threshold obtained by trial and error. Figure 3 shows an example of denoising of the more affected elbow skeletal joint using the median filter for a 70s epoch of the game play. A threshold of 0.1 m removes the majority of spikes in the data without flattening the peaks that occur during natural movement. Lower thresholds can have the advantage of a slightly smoother data stream at the cost of artificially reducing the magnitude of movement excursion when movements are performed quickly. A median filter was selected because of its simplicity, efficiency, and potential for use in real-time applications. One can also use a more advanced signal processing algorithm, such as synchrosqueezed wavelet transform [22–24] if computational efficiency is not a concern.
Fig. 3.
Denoising of the more affected elbow skeletal joint via median filter for a 70 s epoch of game play. The solid black line reflects the raw X skeletal coordinates obtained via the Microsoft Kinect™ sensor from the elbow joint (joint 7 in Figure 2). The reference point for the X coordinate is the Kinect device. The dashed blue line reflects the denoised record that is included in subsequent analysis. The solid and dashed lines coincide except at some peaks identified by dashed ovals highlighting the locations of spikes in the noisy records
Step 2: Session segmentation
In order to remove extraneous data not related to the game play (Step 3), isolated sessions of consecutive game play must first be identified. This is because the features used to detect extraneous data can change in different sessions of game play. For example, the patient may be positioned in a different place when returning to game play after an extended absence. An isolated session of consecutive game play is defined by the authors as a period in which there is no more than a 5-min lapse in therapeutic movements captured by the gaming system. The outcome of this step is a series of consecutive therapeutic game sessions.
Step 3: Remove extraneous data within each session employing a clustering algorithm
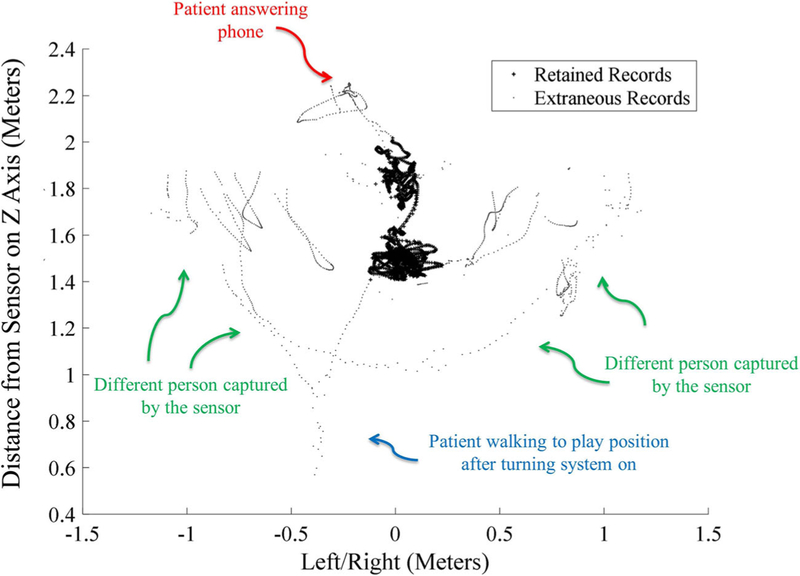
In uncontrolled data capture settings, consumer-based optical motion capture systems may record data from other individuals and inanimate objects such as furniture. Data that is not task-related (e.g., gesturing with one’s hands while talking) may also contaminate the recording in uncontrolled settings, irrespective of sensor type. For example, users’ movements are captured by a therapeutic gaming system when they walk towards/away from the system after turning it on/off or perform other activities (e.g., answering the phone) without first pausing the game. During this time, everyday activity may trigger game actions and be mistaken for therapy participation.
Clues as to the task-relevance of the data can be obtained from select kinematic features. Kinematic features can include joint angles, length of body segments, and speed of movement. For example, six kinematic features (such as trunk angles) are known to have different profiles for task-relevant and extraneous data captured by the Kinect™ motion capture system, and thus are useful features for classifying whether a person is participating in therapy or not. Large angles of the trunk relative to the vertical y-axis (i.e., non-upright posture) represent epochs of time in which the Kinect™ either mistakenly records inanimate objects for body representations or the patient is reclining (and therefore not engaged in therapeutic activity). An individual’s torso position in the XZ plane (top-down view) and the rate of change in the X and Z position of the torso are useful features for identifying when the participant is unlikely to be engaged in deliberate game-based upper extremity practice because upper extremity practice does not involve moving around the room. Finally, various body segment lengths (e.g., trunk length and hip width) identify epochs of time in which a different person appears to be captured by the sensor or in which the patient is no longer directly facing the sensor (smaller X component of hip width).
To remove extraneous data based on several different kinematic features concurrently, a clustering algorithm known as DBSCAN (for Density-based spatial clustering of applications with noise) is employed in this research [25]. This algorithm clusters data points based on their local density and their Euclidean distances to one another. DBSCAN is known to be efficient in dealing with big data [26, 27]. However, clustering algorithms such as kernel-, quantum theory-, graph theory-, density-based clustering algorithms, and unsupervised learning techniques such as deep Boltzmann machine, or other deep neural networks [8, 28–30] can also be explored. Figure 4 illustrates data that was retrained for further analysis versus data that was tagged as extraneous during an 18-min session of game play comprised of about 32,100 skeletal records.
Fig. 4.
Top-down view of the Spine Base skeletal coordinates (XZ plane) for joint 5 in Figure 2 for an 18-min session of game play comprised of about 32,100 skeletal records. The small black dots show the extraneous data not related to game play. Data represented by the larger plus (+) signs represent therapeutic game play (rehabilitation-related movement) records retained for subsequent analysis. The figure is tagged with extraneous events that were manually logged by an observer
Step 4: Gesture retrieval
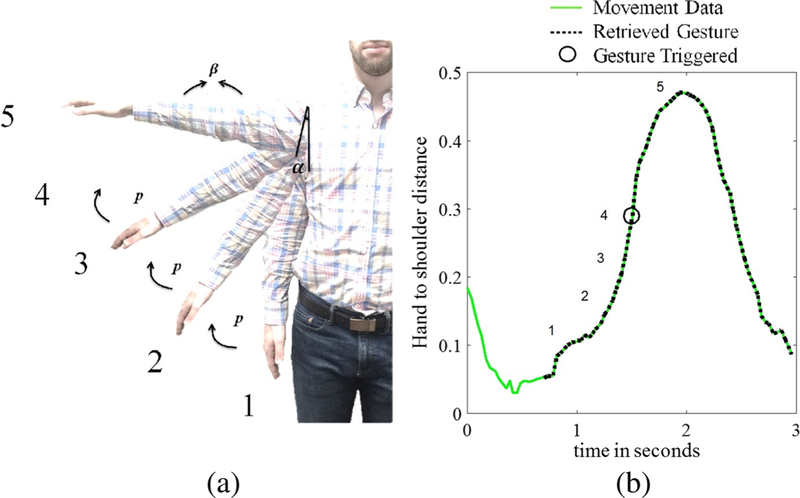
For therapeutic game play employing natural user interfaces, a person’s movement triggers game actions (e.g., collecting game objects). Specific movement patterns, referred to here as therapeutic gestures, are mapped to each game action [31], and may consist of either simple (e.g., elbow flexion) or more complex therapeutic movements (e.g., shoulder abduction with elbow extension and forearm supination). For instance, the Recovery Rapids™ game involves steering a boat down a river and avoiding obstacles. To steer the boat towards the hemiparetic side of the body, the patient performs shoulder abduction with elbow extension. The gesture recognition framework within Recovery Rapids™ requires that the patient achieve several postures in sequence to trigger a game action. Figure 5a presents the game action of steering the boat towards the hemiparetic side of the body. The gesture is triggered when the patient first produces α degrees of shoulder flexion (measured from the vertical) with β degrees of elbow extension (state 1 in the Fig. 5 example), followed by α + p degrees of shoulder flexion (p is the increment angle between two consecutive states), with β degrees of elbow extension (state 2 in the Fig. 5 example), then finally α + 3p degrees of shoulder flexion with β degrees of elbow extension within 2 s (state 4 in the Fig. 5 example). To ensure appropriate challenge and to enable progression of the rehabilitation program, the values of α, p, and β are automatically adjusted within the game based on the patient’s ability (the joint angles the patient is able to produce 70% of the time). When this sequence of joint angles is detected, the shoulder abduction movement is logged as completed within the game log, a text file of movements performed along with their time of completion is created, and the patient receives visual feedback of the boat moving to the side. Additional details about therapeutic movement recognition can be found in this paper [6]. Figure 5b shows that though the game action triggers at α + 3p degrees of shoulder flexion, the patient may produce a movement that is larger than this (because the difficulty level of the game is set at the 30th percentile for the patient’s movement). Hence the timestamps in the game log can only serve as approximations of the end point of the therapeutic gesture.
Fig. 5.
a In the case of shoulder abduction for a person with near normal ability; the angle between the shoulder and torso must increase from position 1 through position 4 while the elbow angle is at least 170 degrees. Though the movement is recorded as completed within the Game Log at position 4, position 5 represents the range of motion that the person actually displays when performing the movement; this recorded range of motion is utilized by Recovery Rapids™ to appropriately establish the difficulty level for each patient. b The distance (m) between the hand and shoulder in the x plane is utilized to determine the actual start and end points of the movement for subsequent kinematic analysis. Gesture states (positions) 1–4 are indicated on the plot, the trigger occurs at gesture state 4, illustrated by a black circle. Position 5 reflects the maximum range of motion exerted by the participant
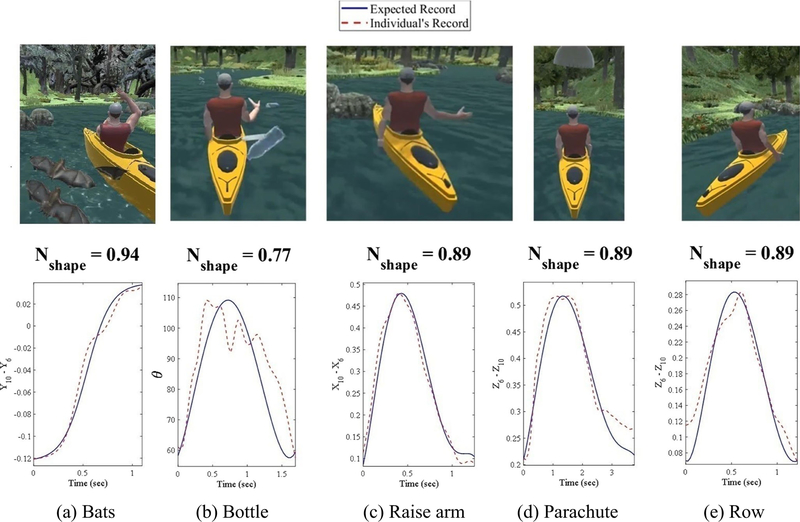
Various therapeutic gestures from Recovery Rapids™ are shown in Fig. 6. Table 1 presents therapeutic gestures utilized by Recovery Rapids™ and the corresponding kinematic features that are robust in identifying the start and end points of each movement. For example, to detect shoulder abduction, the hand minus shoulder distance along the X-axis can be utilized to identify the local minima on either side of the gesture trigger, which represent the actual start and end of each gesture (Fig. 5b and Fig. 6c).
Fig. 6.
Graphical depiction of how the normalcy shape index is determined for the 5 different movements described in Table 1. The red dashed lines represent the relevant kinematic metric (Table 1) extracted from individual movements over time. The solid blue lines represent ideal movement traces
Table 1.
Game actions with the Recovery Rapids™ gaming system, accompanying therapeutic gestures, and relevant kinematic metric for identifying the start and end points of each gesture
| Game Action |
Therapeutic Gesture | Kinematic metric for identifying the start and end point | |
|---|---|---|---|
| Description | Abbreviated Term | ||
| Row boat forward | Row | Shoulder flexion/extension with elbow extension | Z6− Z10 |
| Steer boat toward hemiparetic side | Raise-Arm | Shoulder abduction with elbow extension | X10 − X6 when the affected side is right and X6 − X10 when the affected side is left |
| Pick up bottle | Bottle | Elbow flexion/extension and grasp/release | −β* |
| Capture parachute | Parachute | Shoulder flexion with elbow extension and forearm supination | Z6 − Z10 |
| Swat away bats | Bats | Overhead reaching | Y10 − Y6 |
elbow angle β = atan2[||L1 × L2||, (L1. L2)], atan2 is the four-quadrant inverse tangent function, L1 = [X6 − X7 Y6 − Y7 Z6 − Z7], L2 = [X7−X8 Y7−Y8 Z7−Z8 , L1 × L2 and L1. L2 are the cross and dot operations, respectively, and ||.|| is the norm operator.
The parameters X, Y, and Z refer to the joint locations along the X, Y, and Z axes (Figure 2), respectively
Though conceptually simple, identifying the correct local minima that precede and follow the relevant peaks is quite challenging on a patient population with abnormal movement patterns. For example, a person may have difficulty lifting the arm against gravity and may produce a movement that is not fluid and punctuated by local minima (e.g., involuntary extension of the elbow with gravity during elbow flexion, as shown in Fig. 6b).
To address this concern, two strategies are employed. To remove local minima near the relevant peak, thresholds are established such that local minima above a predefined percentage of the maximum range (e.g., above 50% of the height of the peak) are excluded. To remove local minima that occur below 50% of the height of the peak (near the correct minima), preceding/subsequent minima are also examined. If the slope between the minimum nearest to the peak and the next nearest minimum is above a certain threshold, it is concluded that the minimum nearest to the peak is actually a local minimum and is thus excluded as a potential start/end point (Fig. 5b). There are also records in which the onset of a gesture does not co-occur with a local minimum. For example, as shown in Fig. 5b, there is relatively little vertical displacement of the hand relative to the shoulder at the start of the gesture; thus, the start of the gesture was determined to be the point at which the slope exceeded a threshold. In order to find flat (minimal slope) regions within the relevant kinematic feature, the average of the absolute values of the slope between consecutive recordings within a sliding window (e.g., 0.4 s) is calculated. If the magnitude of the mean slope is below a certain threshold when a local minimum occurs, the “location” of the local minimum within the time-series is concluded to be the subthreshold value that is nearest to the peak.
The proposed strategies are robust in the majority of cases; however, partial movements are still sometimes captured (e.g., the algorithm gets “stuck” in a local minimum) or combined movements are detected. For example, in the case of Recovery Rapids™ upper extremity game play, movements are sometimes performed in such rapid successions that the patient doesn’t fully return to the resting position of their arm at their side, creating a scenario where two movements may blend together. To avoid including improperly parsed or combined movements in the analysis, the shape of the parsed movement is referenced against an ideal/expected movement trajectory, explained further in Step 5, and movements of an unexpected shape are excluded. Fig. 6 presents an example of actual movements performed versus the ideal trajectories of 5 different gestures (Table 1) within Recovery Rapids™.
Step 5: Normalcy shape index
In order to evaluate how well each therapeutic movement matches the expected reference, an ideal movement trajectory for each movement is first generated. Ideal trajectories are obtained by fitting an exponential function to data from control participants without motor impairment (an exponential function was determined to be superior to a polynomial function). The ideal movement corresponding to the overhead reaching gesture (bats in Table 1, top image in Fig. 6a) follows a sigmoidal function with the same time duration as the feature vector of the produced movement (the ideal curve in the bottom part of Fig. 6a). For the other therapeutic gestures, the ideal movement mirrors a symmetrical function over time with the peak close to the peak of the recorded curve (dashed curves in Fig. 6b to e), but within 30% horizontal distance of the start and end points. In this research, the ideal curve is modeled using a 5th degree polynomial function that best fits 7 points: start, peak, end, 2 points equidistant between start/end and the peak, and 2 points at 5% horizontal distance from the start and end points.
To measure the goodness of fit between a produced movement and the ideal movement, a normalcy index is proposed that calculates the Euclidian distances between the movement that is produced relative to a) an ideal movement shape and b) the least compatible movement shape. To accomplish this, a vector of residuals, M, is computed as the absolute difference between the relevant recorded kinematic metric (the dashed line in Fig. 6) from Table 1 and the ideal curve (the solid line in Fig. 6). Next, two vectors, B and W, each with the same dimension as M, are defined for residuals vector M that represent the best possible correspondence (zero residuals when solid and dashed lines in Fig. 6 are superimposed) and maximum residuals, respectively. A normalcy index for the shape of the kinematic metric is defined as follows:
| (1) |
where ‖.‖ is the norm operator and the ith element of W is computed as follows:
| (2) |
where Si is the ith element of the vector of ideal movement S. The movement approaches the ideal shape when Nshape approaches 1. Conversely, as Nshape approaches 0, the movement approaches the worst shape in terms of usefulness for rehabilitation.
Movements with a normalcy shape index less than a predefined threshold value are assumed to be improperly parsed or have been executed in combination with another movement without returning to the rest position between subsequent gestures. Using Microsoft Kinect™ skeletal data captured through Recovery Rapids™, an Nshape threshold of 0.73, 0.77, 0.70, 0.72, and 0.67 were found to work well for bats, bottle, raise-arm, parachute, and row movements, respectively (Table 1). These values were obtained by random visual inspection of the graphical depiction of hundreds of movements for each of the 5 different therapeutic gestures described in Table 1 and portrayed in Fig. 6.
Step 6: Kinematic normalcy indices
In step 6, the quality of movement is calculated for those movements whose Nshape is greater than the predefined threshold. The normalcy index is utilized in this step for a second time, but vectors M, B, and W now consist of features relevant to movement quality. For this application of the normalcy index, M consists of the relevant kinematic features described in the first column of Table 2. The vectors B and W are the best and worst possible values of the relevant features summarized in Table 2, respectively. The theoretical best performance in Table 2 was validated by examining kinematic records from 5 control participants without motor impairment.
Table 2.
Kinematic features relevant to each therapeutic gesture (Table 1)
| Kinematic Features | Game Action (Abbreviated Terms) in Table 1. The values in () and [] are the worst and best possible values, respectively. N/A means that the metric is not relevant for the particular gesture. |
||||
|---|---|---|---|---|---|
| Bats | Bottle | Raise-Arm | Parachute | Row | |
| Angular Elbow Speed | (N/A)[N/A] | (0)[400] | (N/A)[N/A] | (N/A)[N/A] | (N/A)[N/A] |
| Overhead Reach a (Table 1) | (−0.5)[0.7] | (N/A)[N/A] | (N/A)[N/A] | (N/A)[N/A] | (N/A)[N/A] |
| Maximum Elbow Extension b | (11X180] | (11)[180] | (11)[180] | (11)[180] | (11)[180] |
| Range of Motion Elbow (change in 3, Table 1) | (N/A)[N/A] | (0)[170] | (N/A)[N/A] | (N/A)[N/A] | (N/A)[N/A] |
| Range of Motion for Shoulder in XY plane | (N/A)[N/A] | (N/A)[N/A] | (N/A)[N/A] | (0)[90] | (N/A)[N/A] |
| Range of Motion for Shoulder in YZ plane | (0)[180] | (0)[90] | (0)[90] | (N/A)[N/A] | (0)[90] |
| Range of Motion for Trunk in XY plane a | (30)[0] | (30)[0] | (30)[0] | (30)[0] | (30)[0] |
| Range of Motion Trunk in YZ plane a | (45)[0] | (45)[0] | (45)[0] | (45)[0] | (45)[0] |
| Shoulder Abduction Speed | (N/A)[N/A] | (N/A)[N/A] | (N/A)[N/A] | (0)[400] | (N/A)[N/A] |
| Shoulder Abduction Synergy [38] | (N/A)[N/A] | (N/A)[N/A] | (N/A)[N/A] | (0) [3] | (N/A)[N/A] |
| Shoulder Flexion Speed | (0)[500] | (N/A)[N/A] | (0)[500] | (N/A)[N/A] | (0)[500] |
| Shoulder Flexion Synergy | (0) [3] | (N/A)[N/A] | (0) [3] | (N/A)[N/A] | (0) [3] |
| Angular Trunk Speed in XY plane a | (45)[0] | (45)[0] | (45)[0] | (45)[0] | (45)[0] |
| Angular Trunk Speed in YZ plane a | (45)[0] | (45)[0] | (45)[0] | (45)[0] | (45)[0] |
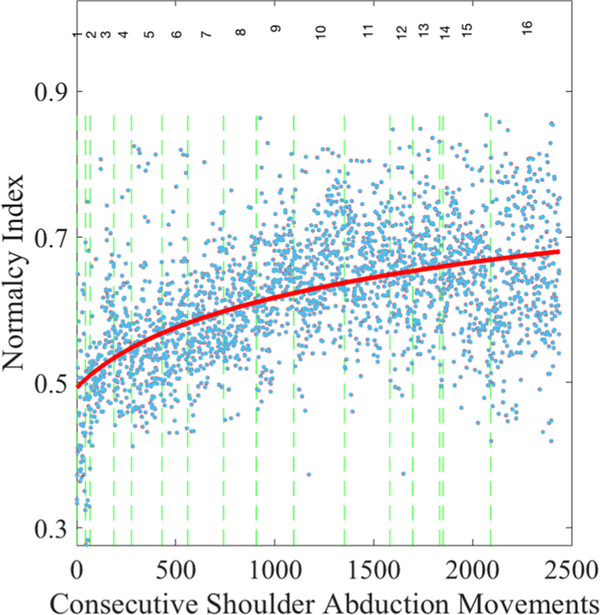
The proposed normalcy index is a more powerful tool and superior to physically examining kinematic features individually because it incorporates the multidimensional nature of movement quality (i.e., speed, range of motion, compensatory movement, etc). The normalcy index encapsulates all relevant metrics into a single index of overall movement quality, Nquality of movement. Figure 7 presents the values of Nquality of movement for consecutive shoulder abduction (raise-arm) gestures, as an example.
Fig. 7.
Plot of the kinematic normalcy index across about 2500 consecutive gestures enables calculation of dose-response curves for each movement for each individual. Blue dots represent the normalcy index for consecutive shoulder abduction (raise-arm) gestures. The vertical dashed lines demarcate each session of the game play. The solid red line is the negative exponential best fit across all gestures
Validation of methodology
Data collection
The performance of the proposed methodology is illustrated utilizing a retrospective database of skeletal data obtained from 24 individuals with chronic stroke and mild to moderate upper extremity impairment (Table 3 presents the minimum motor criteria). Participants were enrolled in a clinical trial utilizing the Recovery Rapids™ upper extremity rehabilitation game in their homes [7]; it can be played either seated or standing. Participants had agreed to play Recovery Rapids™ independently at home for 15 h over a period of 3 weeks between periodic in-person therapist consultations. Informed consent was obtained from all participants prior to study participation; the study was approved by The Ohio State University’s Institutional Review Board. Table 4 presents the demographic information of the cohort.
Table 3.
Minimum active and passive Range of Motion (ROM) required for participation [7]
| ROM status | Limb |
||||
|---|---|---|---|---|---|
| Shoulder | Elbow | Wrist | Fingers | Thumb | |
| Minimum passive ROM | Flexion ≥90° Abduction ≥90° External rotation ≥45° | Extension to ≥150° | Extension ≥0° Forearm supination/pronation ≥45° | MCP extension to ≥145° | Extension or abduction of thumb ≥10° |
| Minimum active ROM | Flexion ≥45° and Abduction ≥45° | Extension ≥20° from a 90° flexed starting position | Extension ≥10° from fully flexed starting position | Extension MCP and (PIP or DIP) joints of at least 2 fingers ≥10° | Extension or abduction of thumb ≥10° |
MCP: Metacarpophalangeal, PIP: Proximal interphalangeal, DIP: Distal interphalangeal
Table 4.
Demographic and baseline clinical characteristics of stroke
| Participant # | Age (Years) | Gender | Affected Side | Chronicity (Years)* |
|---|---|---|---|---|
| 1 | 44.4 | Female | Right | 6.4 |
| 2 | 64.2 | Male | Right | 1.6 |
| 3 | 42.4 | Female | Right | 2.3 |
| 4 | 23.6 | Female | Right | 3.4 |
| 5 | 34.2 | Female | Right | 2.7 |
| 6 | 81.4 | Female | Right | 8.3 |
| 7 | 47.1 | Male | Left | 5.0 |
| 8 | 74.6 | Female | Right | 3.5 |
| 9 | 56.9 | Male | Left | 2.2 |
| 10 | 79.8 | Male | Left | 2.1 |
| 11 | 53.8 | Male | Left | 1.9 |
| 12 | 59.9 | Female | Right | 1.9 |
| 13 | 73.5 | Female | Right | 1.9 |
| 14 | 66.6 | Male | Left | 0.6 |
| 15 | 64.1 | Female | Right | 0.8 |
| 16 | 65.2 | Female | Right | 2.0 |
| 17 | 71.3 | Female | Right | 0.5 |
| 18 | 62.0 | Male | Left | 3.2 |
| 19 | 25.6 | Male | Left | 1.8 |
| 20 | 29.7 | Male | Left | 28.0 |
| 21 | 51.9 | Male | Left | 9.9 |
| 22 | 63.5 | Male | Left | 11.3 |
| 23 | 67.7 | Male | Left | 2.3 |
| 24 | 73.7 | Male | Left | 7.8 |
Number of years post-stroke at study participation
Recovery Rapids™ requires users to perform movements (gestures) to control an Avatar to accomplish game objectives (Table 1). It was designed to trigger game actions after detecting a series of body positions that make up each therapeutic gesture [6]. The data log from Recovery Rapids™ consists of the skeletal data with millisecond-precision timestamps as well as a log of completed gestures with their associated timestamps. The data were stored locally in an SQL database on the gaming system located within the person’s home. Data were transferred to researchers upon completion of the study via a HIPAA-compliant USB drive. Though real-time transfer of the motion capture data to a cloud-based database is feasible for individuals with high-speed internet connections, the majority of participants did not have sufficient high-speed internet in their homes to transfer upwards of 40,000 data-points per minute of game play. More details about Recovery Rapids™ can be found in prior publications [6, 7, 32]. It should be noted that, unlike in-laboratory motion capture experiments usually based on reinforcing maximal effort over relatively few repetitions, Recovery Rapids™ captures spontaneous movements made during sustained practice. It can thus be assumed that movements performed do not necessarily represent a person’s maximal level of ability, but rather how a person spontaneously performs during sustained use. All steps of the proposed methodology have been implemented using the skeleton data collected from all 24 individuals.
Establishing convergent and divergent validity
To determine the convergent validity of the normalcy index, Nquality of movement was compared to scores on established measures of motor function (Wolf Motor Function Test [WMFT]) and arm use (Motor Activity Log [MAL]). Divergent validity was established by correlating Nquality of movement with the Montreal Cognitive Assessment.
Given that performance during initial game play is influenced by the process of learning the correct motions, and therefore not likely representative of a person’s true motor ability, only the post-treatment time period was utilized for the assessment of convergent validity. Nquality of movement for a particular movement was assumed to be the final Y value of the negative exponential best-fit line when plotting Nquality of movement versus consecutive movements of the same type (e.g., shoulder abduction with elbow extension; Figure 8). The negative exponential fit was the most ideal for capturing rehabilitation-related improvements because it accounts for the relatively rapid rate of improvement during earlier sessions and allows for an eventual plateau in recovery potential. Nquality of movement was averaged across all 5 movements to create a mean normalcy index score at post-treatment.
Fig. 8.
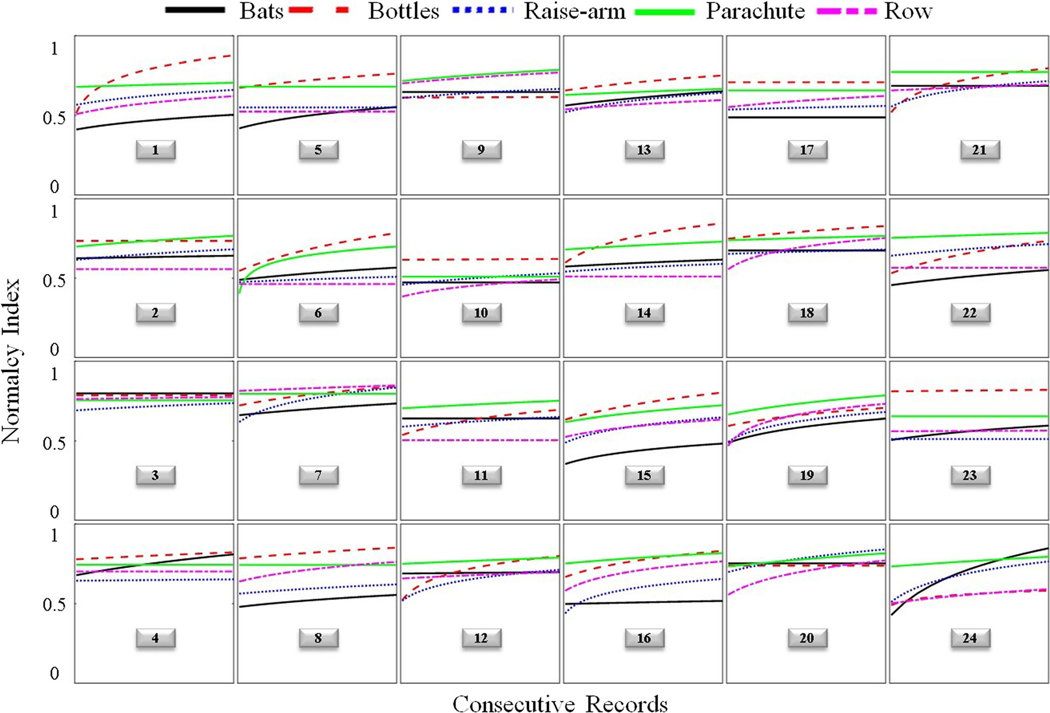
Trajectories of normalcy indices of 5 therapeutic gestures for 24 individuals. “Bats” corresponds to overhead reaching, “Bottles” to elbow flexion/extension, “Raise arm” to shoulder abduction, “Parachute” to shoulder flexion with elbow extension/supination, and “Row” to shoulder flexion (see Table 1 for more detail). Each trajectory (colored curve) represents the nonlinear (negative exponential) best fit line across consecutive gestures, as shown in Figure 7. The numbers in the boxes refer to the participants described in Table 4
The WMFT measures how fast an individual can perform 15 standardized tasks/movements; its validity has been established [33, 34]. The WMFT performance time scale measures a slightly different construct than the normalcy index. Its focus is on speed of single movements irrespective of how the movement is performed, whereas the normalcy index takes into account speed, range of motion, and use of compensatory movement patterns concurrently over the course of hundreds of movement repetitions. To increase the functional similarity between the normalcy index and the WMFT validation measure, only gross motor items from the WMFT were examined (gross motor items shared the most similarity in movement patterns compared with the movements prompted by Recovery Rapids). A gross motor composite score for the WMFT was calculated by averaging the natural log transformed performance times of the 7 items that loaded to a gross motor factor following Factor Analysis of the WMFT (extend elbow, extend elbow with weight, forearm to box, forearm to table, hand to box, hand to table, and reach/retrieve).
The Motor Activity Log Quality of Movement scale (MAL) assesses a person’s perceived quality of arm use for 28 tasks of daily living; its reliability and validity have been established [35–37]. Whereas the WMFT captures maximal performance in a laboratory-based setting, the MAL measures spontaneous use of the hemiparetic arm for daily activities [35]. The MAL does not necessarily reflect patients’ motor ability, but rather captures the patient’s perception of movement quality for several tasks of daily living. A key difference between Nquality of movement and the MAL is that the former is an objective measure which is sensitive to kinematic performance, whereas the MAL scores reflect both use of the hemiparetic arm and its perceived utility during daily tasks.
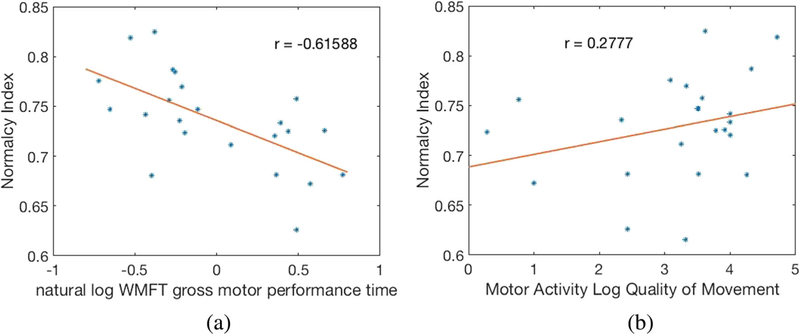
The convergent validity of the normalcy index with both the MAL and the WMFT was established using linear regression. Figure 9a and b show WMFT gross motor composite score and MAL score versus Nquality of movement, respectively.
Fig. 9.
a WMFT gross motor composite score and b) MAL versus Normalcy Index (Nquality of movement)
Establishing reliability
The test-retest reliability of the mean Nquality of movement for each movement class between sessions was calculated using intraclass correlation. To remove confounding treatment effect from reliability calculations, only those treatment sessions that followed a plateau in performance were utilized in the reliability calculation.
Results
Table 5 presents the percentages of the retained data after steps 1–5 of the proposed algorithm for every individual. Between 46% and 92% of the original raw data were retained for final analysis, with an average of about 71%. This shows the feasibility of capturing ample data suitable for analysis, given the large volume of data being generated by the system. The relative quantity of data retained appeared to be most influenced by the play style (i.e., some participants completed more partial or combined movements than others). Some participants with higher data loss following processing also had more contamination within the data capture itself (e.g., they appeared to have left the system on when performing other non-therapeutic activities).
Table 5.
Percentage of retained data after different steps of the proposed algorithm
| Participant # | Denoising (step 1) | DBSCAN (step 3) | Gesture retrieval (step 4) | Normalcy shape index (step 5) | Percent of Raw Data Retained |
|---|---|---|---|---|---|
| 1 | 72.6 | 97.5 | 85.6 | 91.8 | 55.6 |
| 2 | 99.9 | 97.9 | 94.5 | 94.1 | 87.0 |
| 3 | 99.8 | 99.0 | 61.2 | 88.4 | 53.5 |
| 4 | 98.8 | 94.8 | 83 | 88.2 | 50.4 |
| 5 | 99.5 | 98.1 | 87.9 | 86.7 | 74.7 |
| 6 | 99.8 | 98.2 | 77.8 | 86.9 | 66.3 |
| 7 | 99.8 | 98.5 | 97.8 | 96.8 | 92.1 |
| 8 | 99.7 | 99.5 | 86.2 | 83.9 | 71.6 |
| 9 | 99.9 | 99.4 | 90.6 | 89.9 | 80.8 |
| 10 | 99.7 | 96.3 | 60.8 | 77.9 | 45.5 |
| 11 | 99.8 | 98.7 | 75.3 | 85.6 | 63.4 |
| 12 | 99.8 | 98.4 | 95.3 | 92.5 | 86.7 |
| 13 | 99.8 | 99.8 | 90.7 | 82.7 | 74.6 |
| 14 | 99.8 | 99.1 | 90.3 | 93.4 | 83.4 |
| 15 | 99.9 | 99.3 | 92.8 | 95.2 | 87.6 |
| 16 | 99.7 | 97.2 | 81.3 | 85.9 | 67.7 |
| 17 | 99.6 | 95.8 | 89.7 | 85.9 | 73.7 |
| 18 | 99.8 | 99.4 | 91.3 | 91.6 | 83.0 |
| 19 | 99.8 | 98.9 | 92.3 | 89.5 | 81.5 |
| 20 | 99.3 | 98.0 | 84.9 | 87.1 | 72.2 |
| 21 | 99.5 | 97.0 | 72.0 | 85.0 | 59.2 |
| 22 | 98.8 | 96.0 | 81.3 | 83.9 | 65.4 |
| 23 | 99.8 | 99.3 | 82.7 | 87.2 | 70.8 |
| 24 | 99.7 | 97.3 | 71.9 | 85.3 | 59.4 |
| Average | 98.5 | 98.1 | 84.1 | 88.1 | 71.1 |
Referring to Figure 9, significant correlations were observed between Nquality of movement and established motor measures (r = − .62 for WMFT and r = 0.27 for MAL), suggesting that they measure at least partially overlapping constructs. Conversely, the absence of a significant relationship between Nquality of movement and cognition established divergent validity. Cronbach’s alpha was .82, supporting good test-retest reliability of Nquality of movement.
Figure 8 presents the Nquality of movement dose-response trajectories of 5 therapeutic gestures for every individual. Examination of dose-response plots (which illustrate the best-fit curve for Nquality of movement over consecutive movements; see Figure 7) yields two important observations. First, the majority of patients continued to show improvement on at least one movement through the end of treatment, suggesting that existing rehabilitation trials may be under-dosing participants, capturing only a fraction of potential recovery. Second, patterns of recovery appear to be specific to each individual, demonstrating the value of this data-driven approach to inform personalized treatment planning.
Discussion
Arguably the greatest barrier for collecting and utilizing large datasets of low-cost motion capture data, such as those collected by the Microsoft Kinect™, is a framework to remove the substantial error that occurs during capture in uncontrolled settings, such as a home or clinic. This paper provides the first ever framework for addressing the major challenges in analyzing kinematic data captured in a home or clinic setting. As such, it will facilitate analysis of very large datasets captured during rehabilitation, yielding data-driven insights that will accelerate understanding of motor recovery.
This approach to analyzing movement data that is captured in naturally occurring settings can generalize to all rehabilitation applications, though the particular metrics selected for determining task-relevant practice and optimal performance may differ. Additionally, with improved sensor systems on the horizon, these computational techniques could be useful in the future for quantifying athletic performance. The normalcy index is a particularly useful construct because it allows any combination of relevant performance metrics to be tracked concurrently across time. By fitting a negative exponential function to consecutively calculated normalcy index data points, the precise time at which performance plateaus can also be calculated. This has particular relevance for informing personalized adjustments to rehabilitation/training programs and capturing dose-response to motor interventions.
Conclusions
In this paper, a methodology was presented for isolating the relevant movements and removing extraneous movements from motion capture data obtained via a consumer-based motion capture system such as Microsoft Kinect™ during therapeutic game play. It overcomes the challenges of low temporal resolution in an uncontrolled data capture environment. The resulting kinematic data can be utilized to quantify individual dose-response for each movement trained. This research provides the foundation to generate personalized data-driven insights from game play data obtained from any individual engaging in therapeutic game play within home and community settings.
Limitations
The methods presented here may not be sufficient for measuring a person’s maximal motor ability over time. This is because it is unlikely that a person will continue to exert maximal effort over the sustained period of rehabilitation being captured, particularly when unprompted to do so in an unsupervised setting. This limitation is supported by only a moderate correlation between WMFT performance time and the recorded kinematic metrics. Rather, the element of motor ability that appears to be captured by the game-based kinematic metrics is spontaneous and sustained motor performance during an engaging task.
Highlights.
Method for extracting and evaluating therapeutic movements from rehabilitation gaming
Convergent validity with other metrics of motor ability is established.
Treatment customization can be achieved by quantifying individual’s dose-response.
Acknowledgements
This work was supported by the National Multiple Sclerosis Society, Participant-Centered Outcomes Research Institute (PCORI), Rudi Schulte Foundation, Santa Barbara, CA, and the National Center for Advancing Translational Sciences (Grant #8UL1TR000090-05). The content is solely the responsibility of the authors and does not necessarily represent the official views of the funding institutes. Mostapha Kalami Heris, a member of Yarpiz programming team (www.yarpiz.com), developed the DBSCAN code used in this study to illustrate the proposed model.
Footnotes
Compliance with Ethical Standards
Conflict of Interests LVG is a cofounder of Games That Move You, the Public Benefit Company that commercialized the Recovery Rapids™ software utilized in this research.
References
- 1.Darekar A, McFadyen BJ, Lamontagne A, and Fung J, Efficacy of virtual reality-based intervention on balance and mobility disorders post-stroke: A scoping review. J. Neuroeng. Rehab 12:46, 2015. [DOI] [PMC free article] [PubMed] [Google Scholar]
- 2.Laver K, George S, Thomas S, Deutsch JE, and Crotty M, Virtual reality for stroke rehabilitation. Stroke 43:e20–e21, 2012. [PubMed] [Google Scholar]
- 3.Levin MF, Snir O, Liebermann DG, Weingarden H, and Weiss PL, Virtual reality versus conventional treatment of reaching ability in chronic stroke: Clinical feasibility study. Neurol. Ther 1:3–012, 2012. 10.1007/s40120-0120003-9. [DOI] [PMC free article] [PubMed] [Google Scholar]
- 4.Saposnik G, and Levin M, Outcome research Canada (SORCan) working group. Virtual reality in stroke rehabilitation: A meta-analysis and implications for clinicians. Stroke 42:1380–1386, 2011. 10.1161/STROKEAHA.110.605451. [DOI] [PubMed] [Google Scholar]
- 5.Viau A, Feldman AG, McFadyen BJ, and Levin MF, Reaching in reality and virtual reality: A comparison of movement kinematics in healthy subjects and in adults with hemiparesis. J. Neuroeng. Rehab 1:11, 2004. [DOI] [PMC free article] [PubMed] [Google Scholar]
- 6.Maung D, Crawfis R, Gauthier LV, Worthen-Chaudhari L, Lowes LP, Borstad A, McPherson RJ, Grealy J, and Adams J, Development of Recovery Rapids-A game for cost effective stroke therapy. 2014. [Google Scholar]
- 7.Gauthier LV, Kane C, Borstad A, Strahl N, Uswatte G, Taub E, Morris D, Hall A, Arakelian M, and Mark V, Video game rehabilitation for outpatient stroke (VIGoROUS): Protocol for a multi-center comparative effectiveness trial of in-home gamified constraint-induced movement therapy for rehabilitation of chronic upper extremity hemiparesis. BMC Neurol. 17:109, 2017. [DOI] [PMC free article] [PubMed] [Google Scholar]
- 8.Morabito FC, Campolo M, Mammone N, Versaci M, Franceschetti S, Tagliavini F, Sofia V, Fatuzzo D, Gambardella A, and Labate A, Deep learning representation from electroencephalography of early-stage Creutzfeldt-Jakob disease and features for differentiation from rapidly progressive dementia. Int. J. Neural. Syst 27:1650039, 2017. [DOI] [PubMed] [Google Scholar]
- 9.Zhang Y, Wang Y, Jin J, and Wang X, Sparse Bayesian learning for obtaining sparsity of EEG frequency bands based feature vectors in motor imagery classification. Int. J. Neural. Syst 27: 1650032, 2017. [DOI] [PubMed] [Google Scholar]
- 10.Rafiei MH, Adeli H. a new neural dynamic classification algorithm. IEEE Trans. Neural Netw. Learn. Syst 28:3074–3083, 2017. [DOI] [PubMed] [Google Scholar]
- 11.Adeli H, and Hung S, Machine Learning: Neural networks, genetic algorithms, and fuzzy systems. John Wiley & Sons, Inc, 1994. [Google Scholar]
- 12.Siddique N, and Adeli H, Computational Intelligence: Synergies of fuzzy logic, neural networks and evolutionary computing.: John Wiley & Sons, 2013. [Google Scholar]
- 13.Guo L, Wang Z, Cabrerizo M, and Adjouadi M, A cross-correlated delay shift supervised learning method for spiking neurons with application to interictal spike detection in epilepsy. Int. J. Neural. Syst 27:1750002, 2017. [DOI] [PubMed] [Google Scholar]
- 14.Abbasi H, Bennet L, Gunn AJ, and Unsworth CP, Robust wavelet stabilized ‘footprints of Uncertainty’for fuzzy system classifiers to automatically detect sharp waves in the EEG after hypoxia ischemia. Int. J. Neural Syst 27:1650051, 2017. [DOI] [PubMed] [Google Scholar]
- 15.Wolf SL, Winstein CJ, Miller JP, Taub E, Uswatte G, Morris D, Giuliani C, Light KE, Nichols-Larsen D, Excite Investigators. Effect of constraint-induced movement therapy on upper extremity function 3 to 9 months after stroke: The EXCITE randomized clinical trial. JAMA, 2006;296:2095–2104. [DOI] [PubMed] [Google Scholar]
- 16.Najafi B, Aminian K, Paraschiv-Ionescu A, Loew F, Bula CJ, and Robert P, Ambulatory system for human motion analysis using a kinematic sensor: Monitoring of daily physical activity in the elderly. IEEE Trans. Biomed. Eng 50:711–723, 2003. [DOI] [PubMed] [Google Scholar]
- 17.Clark RA, Pua YH, Fortin K, Ritchie C, Webster KE, Denehy L, and Bryant AL, Validity of the Microsoft Kinect for assessment of postural control. Gait Post. 36:372–377, 2012. 10.1016/j.gaitpost.2012.03.033. [DOI] [PubMed] [Google Scholar]
- 18.Obdržálek Š, Kurillo G, Ofli F, Bajcsy R, Seto E, Jimison H, and Pavel M, Accuracy and robustness of Kinect pose estimation in the context of coaching of elderly population, 1188–1193, 2012. [DOI] [PubMed] [Google Scholar]
- 19.Otte K, Kayser B, Mansow-Model S, Verrel J, Paul F, Brandt AU, and Schmitz-Hübsch T, Accuracy and reliability of the kinect version 2 for clinical measurement of motor function. PloS one 11:e0166532, 2016. [DOI] [PMC free article] [PubMed] [Google Scholar]
- 20.Support xbox com. Kinect for windows V2 sensor known issues. 2017. [Google Scholar]
- 21.Kinect O, Protocol documentation. 2018. [Google Scholar]
- 22.Daubechies I, and Lu J, Wu H. Synchrosqueezed wavelet transforms: An empirical mode decomposition-like tool. Appl. Comput. Harmon. Anal 30:243–261, 2011. [Google Scholar]
- 23.Amezquita-Sanchez JP, and Adeli H, Synchrosqueezed wavelet transform-fractality model for locating, detecting, and quantifying damage in smart highrise building structures. Smart Mater. Struct 24:065034, 2015. [Google Scholar]
- 24.Rafiei MH, and Adeli H, A novel unsupervised deep learning model for global and local health condition assessment of structures. Eng. Struct 156:598–607, 2018. [Google Scholar]
- 25.Ester M, Kriegel H, Sander J, and Xu X, A density-based algorithm for discovering clusters in large spatial databases with noise., 1996;96:226–231. [Google Scholar]
- 26.Borah B, and Bhattacharyya D, An improved sampling-based DBSCAN for large spatial databases.:92–96, 2004. [Google Scholar]
- 27.Birant D, and ST-DBSCAN KA, An algorithm for clustering spatial–temporal data. Data Knowl. Eng 60:208–221, 2007. [Google Scholar]
- 28.Rafiei MH, and Adeli H, A novel machine learning model for estimation of sale prices of real estate units. J. Constr. Eng. Manag 142:04015066, 2015. [Google Scholar]
- 29.Koziarski M, and Cyganek B, Image recognition with deep neural networks in presence of noise–dealing with and taking advantage of distortions. Integrat. Comput. Aided Eng 24:337–349, 2017. [Google Scholar]
- 30.Ortega-Zamorano F, Jerez JM, Gómez I, and Franco L, Layer multiplexing FPGA implementation for deep back-propagation learning. Integrat. Comput.-Aided Eng 24:171–185, 2017. [Google Scholar]
- 31.Maung D, Crawfis R, Gauthier LV, Worthen-Chaudhari L, Lowes LP, Borstad A, and McPherson RJ,. Games for therapy: Defining a grammar and implementation for the recognition of therapeutic gestures. 314–321, 2013. [Google Scholar]
- 32.Liang J, Fuhry D, Maung D, Borstad A, Crawfis R, Gauthier L, Nandi A, and Parthasarathy S, Data analytics framework for a game-based rehabilitation system. 67–76, 2016. [Google Scholar]
- 33.Whitall J, Savin DN, Harris-Love M, and Waller SM, Psychometric properties of a modified Wolf Motor function test for people with mild and moderate upper-extremity hemiparesis. Arch. Phys. Med. Rehab 87:656–660, 2006. [DOI] [PubMed] [Google Scholar]
- 34.Wolf SL, Catlin PA, Ellis M, Archer AL, Morgan B, and Piacentino A, Assessing wolf motor function test as outcome measure for research in patients after stroke. Stroke 32:1635–1639, 2001. [DOI] [PubMed] [Google Scholar]
- 35.Uswatte G, Taub E, Morris D, Light K, and Thompson PA, The motor activity Log-28: Assessing daily use of the hemiparetic arm after stroke. Neurology 67:1189–1194, 2006. doi: 67/7/1189. [DOI] [PubMed] [Google Scholar]
- 36.Lang CE, Edwards DF, Birkenmeier RL, and Dromerick AW, Estimating minimal clinically important differences of upper-extremity measures early after stroke. Arch. Phys. Med. Rehab 89: 1693–1700, 2008. [DOI] [PMC free article] [PubMed] [Google Scholar]
- 37.Taub E, Uswatte G, Mark VW, Morris DM, Barman J, Bowman MH, Bryson C, Delgado A, and Bishop-McKay S, Method for enhancing real-world use of a more affected arm in chronic stroke: Transfer package of constraint-induced movement therapy. Stroke 44:1383–1388, 2013. 10.1161/STROKEAHA.111.000559. [DOI] [PMC free article] [PubMed] [Google Scholar]
- 38.Guidali M, Schmiedeskamp M, Klamroth V, and Riener R, Assessment and training of synergies with an arm rehabilitation robot. 772–776, 2009. [Google Scholar]


