

Abstract
Background/Aims:
Sarcopenia and frailty are commonly encountered in patients with end stage liver disease and are associated with adverse clinical outcomes including decompensation and waitlist mortality. The impact of these entities in patients with differing disease etiologies has not been elucidated. We aim to ascertain the change in their prevalence over time on the waitlist and determine their impact on hospitalization, delisting, and waitlist survival specifically for patients with non-alcoholic steatohepatitis (NASH) and alcoholic liver disease (ALD).
Methods:
Adult patients who were evaluated for their first liver transplant from 2014 to 2016 with a primary diagnosis of NASH (n=136) or ALD (n=129) were included. CT scans were used to determine the presence of sarcopenia and myosteatosis. Frailty was diagnosed using the Rockwood frailty index.
Results:
Patients with NASH had a significantly lower prevalence of sarcopenia (22% vs. 47%; p<0.001), but a significantly higher prevalence of frailty (49% vs. 34%; p=0.026) when compared to patients with ALD at the time of listing. In patients with NASH, sarcopenia was not associated with adverse events, but a higher frailty score was associated with an increased length of hospitalization (p=0.051) and an increased risk of delisting (p=0.021). In patients with ALD, univariate analysis showed the presence of sarcopenia was associated with an increased risk of delisting (p=0.011).
Conclusion:
Sarcopenia and frailty occur with differing prevalence, with variable impact on outcomes in waitlisted patients with NASH and ALD.
Keywords: muscle-wasting, debility, cirrhosis
BACKGROUND
Sarcopenia is a major component of malnutrition in end stage liver disease (ESLD) and is defined as a generalized loss of skeletal muscle mass, strength and function (1). Sarcopenia is linked but not equivalent with frailty, defined as an increased vulnerability to stressors due to a decline in physiological reserve (2). Both entities have been associated with adverse clinical outcomes, including increased risk of decompensation, and increased waitlist mortality when analyzed in all waitlisted patients (2). Sarcopenia has also been associated with a longer hospitalization, longer ICU stay, and an increased risk of mortality after liver transplantation (LT) (3).
Thus far, studies have not evaluated the differences in prevalence and impact of sarcopenia or frailty in patients with varying etiologies for ESLD. Evidence suggests an overlap in the pathophysiology of non-alcoholic steatohepatitis (NASH) and sarcopenia with insulin resistance and increased inflammation playing a key role in both processes (4). As a result, the presence of one increases the risk for the other. For example, patients with sarcopenia have a 3-fold increased risk of having NAFLD (5), and patients with NAFLD have a 6-fold increased risk of having sarcopenic obesity (6). Studies have also suggested that patients with alcoholic liver disease (ALD) may have an increased prevalence of sarcopenia (7). In these patients both advanced liver disease and direct effects of alcohol contribute to sarcopenia. For instance, alcohol leads to a state of anabolic resistance whereby there is inadequate stimulation of protein synthesis in the presence of adequate nutrient or protein intake (8). Alcohol also impairs skeletal muscle mitochondrial function leading to impaired protein synthesis (9), as well as leading to hypogonadism and its effects on muscle (10). Finally, alcohol inhibits mammalian target of rapamycin complex 1 (mTORC1), which suppresses autophagy and stimulates protein synthesis (8). All of these effects combine to affect muscle size and function. Other comorbidities that may contribute to frailty, include age, metabolic, cardiovascular or renal disease, amongst others. Thus, it is likely the prevalence and impact of both sarcopenia and frailty may differ in populations of patients with ESLD. Analyzing these entities in specific populations is needed to better understand the risk and management of sarcopenia and frailty specific to those individuals.
We aim to ascertain the prevalence of sarcopenia and frailty in two leading indications for transplantation, NASH and ALD, and determine their impact on decompensation, hospital length of stay (LOS) prior to transplant, delisting, and waitlist survival.
METHODS
Subjects
This retrospective study included 265 adult patients evaluated and listed for their first LT from 2014 to 2016 at Mayo Clinic in Rochester, Minnesota. All adults over 18 years with a primary diagnosis of NASH (n=136) or ALD (n=129) were included. Patients who had LT assessment for other etiologies, acute liver failure, or for multi-visceral transplant were excluded.
Using an institutional review board approved protocol, data on demographics, ICU stay, hospitalizations including cause and cumulative length of stay (LOS) for these hospitalizations, decompensation (encephalopathy, ascites, spontaneous bacterial peritonitis, variceal bleed, hepatorenal syndrome), immunosuppression, renal function, date of LT, date of delisting, cause of delisting, last follow up and cause of and date of death were collected from patient charts. LOS was defined as mean of length of all hospitalizations on the waitlist.
Sarcopenia and myosteatosis assessment
CT scans of the abdomen ordered at the time of transplant evaluation and then at the discretion of the clinician, for hepatocellular carcinoma screening, were obtained. CT images were read by a single reviewer (RAB), blinded to outcome, using the software BodyCompSlicer (developed at Mayo Clinic, Rochester, USA), which is comparable to sliceOmatic (TomoVision, Montreal, Canada) (11). The reviewer selected the CT slice at the third lumbar (L3) region. BodyCompSlicer automatically placed three boundary lines between external air and subcutaneous fat, between subcutaneous fat and abdominal wall/ paraspinal muscles, and between abdominal wall/paraspinal muscles and visceral fat (Supplemental Fig. 1A). The reviewer carefully inspected each boundary, and made necessary corrections (Supplemental Fig. 1B). The following muscles were outlined: psoas, paraspinal, and abdominal wall (including rectus abdominis, transverse abdominis, and internal and external oblique) muscles. The software then calculated the skeletal muscle area, as area containing pixels between boundary 2 and 3, excluding the spine, and having CT attenuation value of −30 to 150 Hounsfield units (HU). The L3 skeletal muscle area was then normalized to height to calculate the skeletal muscle index (L3SMI). Sarcopenia was defined as SMI < 50 cm2/m2 in men and < 39 cm2/m2 in women (12). The same method was used for the repeat CT scans, thus allowing the L3SMI to be compared at differing time points, to determine what changes occur in body composition while awaiting LT.
Myosteatosis or fat infiltration of the muscles was indirectly measured by muscle attenuation. Mean muscle attenuation in HU was reported for the entire muscle area at the L3 vertebra. We defined myosteatosis as <41 HU in patients with a BMI up to 24.9, and <33 in those with a BMI ≥25. These cut-off values have been shown to be associated with mortality in both oncology and cirrhotic patients (13, 14).
Frailty assessment
Frailty was defined as a score of 0.25 or greater using the deficit index, as previously described by Rockwood et al (15). A similar cut-off was used when assessing the impact of frailty on survival in lung transplant patients (16). Due to its continuous nature, the deficit index is better able to discriminate between moderate and severe frailty (17) and it may be more sensitive to modifications and thus a useful tool for monitoring responses to intervention in comparison to the Fried frailty index, which is on a categorical scale. Both indices assess for weight loss, physical stamina and function and have significant overlap in identifying frailty and have statistical convergence (17). This score is calculated by dividing the total number of deficits present by the total number of deficits possible (32 deficits). The frailty score ranges from 0 to1, or from no deficits (score=0) to all (32/32; score=1) possible deficits present (Appendix 1).
Questionnaires completed by patients during their pre-LT visit were used to determine the items representing activities of daily living (14). Items representing comorbidities (18) were collected using a manual chart review. If more than 1 question was unanswered, or if the questionnaire was not within 1 year of LT evaluation, the deficit index was not calculated. In cases where one of the items from the questionnaire was missing the denominator was adjusted to 31. Only the pre-LT deficit index was calculated; this was not measured over time.
Definitions of comorbidities
A patient was classified as being underweight if their BMI was less than 18.5 kg/m2, overweight if their BMI was between 25 and 29.9 kg/m2, and obese if their BMI was 30 kg/m2 or more. Anemia was defined as a hemoglobin concentration of < 12.0 g/dl in women and < 13.0 g/dl in men. Moderate and severe renal insufficiency was defined as an estimated glomerular filtration rate of 30–60 ml/min and < 30 ml/min, respectively. Other comorbidities were defined based on documentation of diagnosis in the patient chart.
Statistical analysis
Continuous variables are presented as mean ± standard deviation (SD) or median (interquartile range [IQR]), and categorical variables are presented as percentages. Comparisons between groups for variables known at time of transplant evaluation were made using Student’s t-tests or Wilcoxon rank sum tests for continuous variables; and chi square tests for categorical variables. Pre and post CT scans for each patient were compared using paired t-tests or McNemar’s tests.
Waitlist survival time was defined from the date of the LT evaluation to the date of death on waitlist (event), LT (censored), delisting for reason other than death (censored; only 3.6% (4/111) of patients were delisted for improvement in clinical condition), or last date still known to be alive on the waitlist (censored), whichever occurred first. Time to delisting was defined from the date of LT evaluation to time of removal from UNOS (event), date of LT (censored), or last date still known to be alive on waitlist (censored). Competing risks analyses were used to estimate waitlist death (competing risks of transplant and delisting for other reasons) and delisting rates (competing risk of transplant). Cox proportional hazards regression was used to look for potential risk factors for waitlist death and delisting. Multivariable linear regression was used to determine the association between skeletal muscle index (SMI), mean muscle attenuation, frailty and LOS. For waitlist mortality, backward elimination was used to select the variables in the models, due to small number of events.
All p values were two-sided and determined to be statistically significant at p≤0.05. All statistical analyses were performed using SAS version 9.4 (SAS Institute Inc., Cary, NC) and R version 3.4.2 (R Core Team, R Foundation for Statistical Computing, Vienna, Austria).
RESULTS
Patient characteristics
Patients with NASH were older, less frequently male, had a higher BMI and lower MELD score at the time of listing than their counterparts (Table 1). NASH patients were less likely to be hospitalized pre-LT, but overall LOS, despite fewer hospitalizations, was similar compared to the ALD cohort. Decompensation was similar between groups, but NASH patients were less likely to have ascites than patients with ALD (Table 1). NASH patients were more commonly obese with metabolic comorbidities and had significantly lower HU (indicating myosteatosis; 31.0 ± 8.6 vs. 34.3 ± 8.4; p=0.003), and higher muscle mass (SMI) (51.6 cm2/m2 ± 10.4 vs. 48.3 cm2/m2 ± 8.9; p=0.008) on their transplant evaluation CT scans.
Table 1:
Patient demographics and clinical outcomes
| NASH (n=136) | ALD (n=129) | p-value | |
|---|---|---|---|
| Age in years (SD) | 60.2 (7.8) | 53.7 (10.1) | <0.001 |
| Male (%) | 70 (52%) | 89 (69%) | 0.004 |
| BMI, Kg/m2 (SD) | 34.9 (8.0) | 27.6 (5.1) | 0.001 |
| MELD (SD) | 15 (6.8) | 17.6 (6.2) | <0.001 |
| Hepatorenal syndrome | 12 (9%) | 9 (7%) | 0.58 |
| Hospitalization pre-LT | 56 (41%) | 78 (61%) | 0.002 |
| LOS (days) (SD) | 11.0 (10.7) | 13.3 (13.6) | 0.24 |
| Delisted 1-year cumulative incidence (% [95% CI]) | 13.6% [7.9, 19.0] | 28.3% [19.9, 35.8] | 0.32 |
| Frail (%) | 51 (49%) | 37 (34%) | 0.026 |
| Sarcopenia (%) | 30 (22%) | 60 (47%) | <0.001 |
| Myosteatosis (%) | 83 (62%) | 74 (58%) | 0.50 |
| Muscle mass, cm2/m2 (SD) | 51.6 (10.4) | 48.3 (8.9) | 0.008 |
p-value from a Cox-proportional hazards model; LOS- length of stay
Prevalence of sarcopenia and frailty
Patients with NASH had a significantly lower prevalence of sarcopenia when compared to patients with ALD (22% vs. 47%; p<0.001). This difference was maintained even after adjusting for gender (NASH vs ALD odds ratio (OR)=0.37, 95% confidence interval (CI) [0.21–0.64]; p<0.001; adjusted for gender). Sarcopenic patients had a significantly lower BMI in both NASH (28.0 Kg/m2 ± 6.4 vs. 37.0 Kg/m2 ± 7.3; p < 0.001) and ALD (25.5 Kg/m2 ± 3.7 vs. 29.5 Kg/m2 ± 5.4; p=<0.001) (Table 2). Gender differences in sarcopenia versus no sarcopenia were noted in both NASH (sarcopenic: 70% male vs. non-sarcopenic: 45% male; p=0.02) and ALD patients (sarcopenic: 78% male vs. non-sarcopenic: 62% male; p=0.04). Finally, there was no age difference in NASH patients with and without sarcopenia (61.7 yrs ± 9.4 vs. 59.7 yrs ± 7.3; p = 0.06). However, ALD patients with sarcopenia were older (56.4 yrs ± 9.0 vs. 51.4 yrs ± 10.9; p=0.005).
Table 2:
Characteristics of patients with and without sarcopenia
| Sarcopenia | Normal muscle mass | p-value | |
|---|---|---|---|
| NASH | (n= 30) | (n= 104) | |
| Age in years (SD) | 61.7 (9.4) | 59.7 (7.3) | 0.06 |
| Male (%) | 21 (70%) | 47 (45%) | 0.017 |
| BMI (Kg/m2) (SD) | 28.0 (6.4) | 37.0 (7.3) | <0.001 |
| MELD (SD) | 15.3 (7.0) | 15.0 (6.8) | 0.80 |
| Hepatorenal syndrome | 4 (13%) | 8 (8%) | 0.34 |
| Frail (%) | 10 (36%) | 43 (50%) | 0.19 |
| Myosteatosis (%) | 30 (79%) | 72 (60%) | 0.035 |
| Hospitalization pre-LT (%) | 10 (33%) | 46 (44%) | 0.29 |
| LOS (days) (SD) | 11.5 (9.8) | 10.9 (10.9) | 0.56 |
| Delisted 1-year cumulative incidence (% [95% CI]) | 20.8% [5.8, 33.4] | 12.2% [5.8, 18.2] | 0.28† |
| Death 1-year cumulative incidence (% [95% CI]) | 14.9% [1.9, 26.1] | 5.5% [1.1, 9.7] | 0.12† |
| ALD | (n= 60) | (n= 68) | |
| Age in years (SD) | 56.4 (9.0) | 51.4 (10.5) | 0.005 |
| Male(SD) | 47 (78%) | 42 (62%) | 0.042 |
| BMI (Kg/m2) (%) | 25.5 (3.7) | 29.5 (5.4) | <0.001 |
| MELD(SD) | 17.6 (6.1) | 17.6 (6.4) | 0.94 |
| Hepatorenal syndrome | 4 (7%) | 5 (7%) | 0.88 |
| Frail (%) | 15 (31%) | 21 (35%) | 0.63 |
| Myosteatosis (%) | 40 (68%) | 34 (49%) | 0.03 |
| Hospitalization pre-LT (%) | 36 (60%) | 41 (60%) | 0.97 |
| LOS (days) (SD) | 15.3 (14.7) | 11.3 (12.6) | 0.15 |
| Delisted 1-year cumulative incidence (% [95% CI]) | 37.8% [24.0, 49.1] | 18.7% [8.5, 27.6] | 0.011† |
| Death 1-year cumulative incidence (% [95% CI]) | 29.2% [16.5, 40.0] | 12.4% [4.0, 20.1] | 0.056† |
p-value from a Cox-proportional hazards model; LOS- length of stay
Patients with NASH had a significantly higher prevalence of frailty when compared to patients with ALD (49% vs. 34%; p=0.03). There were no significant differences in age, BMI, or sex when comparing frail patients to non-frail patients in either subgroup (Table 3).
Table 3:
Characteristics of patients with and without frailty
| Frail | Non-frail | p-value | |
|---|---|---|---|
| NASH | (n=51) | (n=54) | |
| Age in years, mean (SD) | 60.1 (7.2) | 58.9 (8.8) | 0.64 |
| Male (%) | 28 (54.9) | 23 (42.6) | 0.21 |
| BMI (Kg/m2), mean (SD) | 36.0 (8.3) | 33.8 (8.8) | 0.21 |
| MELD, mean (SD) | 16.8 (7.3) | 14.6 (5.6) | 0.18 |
| Hepatorenal syndrome | 8 (15.7) | 4 (7.4) | 0.18 |
| Sarcopenia (%) | 9 (18.4) | 14 (25.9) | 0.36 |
| Myosteatosis (%) | 33 (67.3) | 38 (70.4) | 0.74 |
| Hospitalization pre-LT (%) | 28 (54.9) | 22 (40.7) | 0.15 |
| LOS (days), mean (SD) | 13.3 (12.6) | 8.9 (7.4) | 0.36 |
| Delisted 1-year cumulative incidence (% [95% CI]) | 14.6% [4.7, 23.4] | 13.2% [4.2, 21.3] | 0.23† |
| Death 1-year cumulative incidence (% [95% CI]) | 7.3% [0.1, 13.9] | 11.5% [3.1, 19.2] | 0.83† |
| ALD | (n=37) | (n=73) | |
| Age in years, mean (SD) | 55.2 (8.5) | 52.0 (10.6) | 0.12 |
| Male (%) | 27 (73.0) | 46 (63.0) | 0.30 |
| BMI (Kg/m2) (%) | 28.3 (5.0) | 27.2 (5.0) | 0.20 |
| MELD, mean (SD) | 17.8 (5.8) | 18.7 (6.4) | 0.63 |
| Hepatorenal syndrome | 3 (8.1) | 6 (8.2) | 0.98 |
| Sarcopenia (%) | 15 (41.7) | 34 (46.6) | 0.63 |
| Myosteatosis (%) | 20 (55.6) | 41 (56.2) | 0.95 |
| Hospitalization pre-LT (%) | 26 (70.3) | 46 (63.0) | 0.45 |
| LOS (days), mean (SD) | 14.8 (16.8) | 12.6 (11.0) | 0.66 |
| Delisted 1-year cumulative incidence (% [95% CI]) | 34.6% [16.6, 48.7] | 27.1% [15.9, 36.8] | 0.46† |
| Death 1-year cumulative incidence (% [95% CI]) | 22.9% [7.6, 35.7] | 21.4% [11.2, 30.4] | 0.93† |
p-value from a Cox-proportional hazards model; LOS- length of stay
Trajectory of body composition changes on the waitlist
Seventy-three patients had a repeat CT while awaiting transplant (NASH (39) and ALD (34)) at a median time of 1 year (IQR 0.74–1.32 years). When comparing muscle quality and quantity between these CTs, there was no significant change in muscle mass (SMI) in either the NASH (median 0.3 cm2/m2; IQR −1.8, 4.9, p=0.28) or the ALD (median −0.2 cm2/m2; IQR −3.0, 4.3, p=0.94) patients. There was no significant difference in the change in mean HU (myosteatosis) between the NASH (median −0.7 HU; IQR −6.8, 5.4) and the ALD patients (median 2.7 HU; IQR −2.3, 7.9) (p=0.08) (Fig. 1). However, when looking at the change in mean HU (myosteatosis) in the ALD patients there was a significant change (median −0.7 HU; IQR −6.8, 5.4; p=0.04), but this was not seen in the NASH group (median 2.7 HU; IQR −2.3, 7.9; p=0.86).
Figure 1.
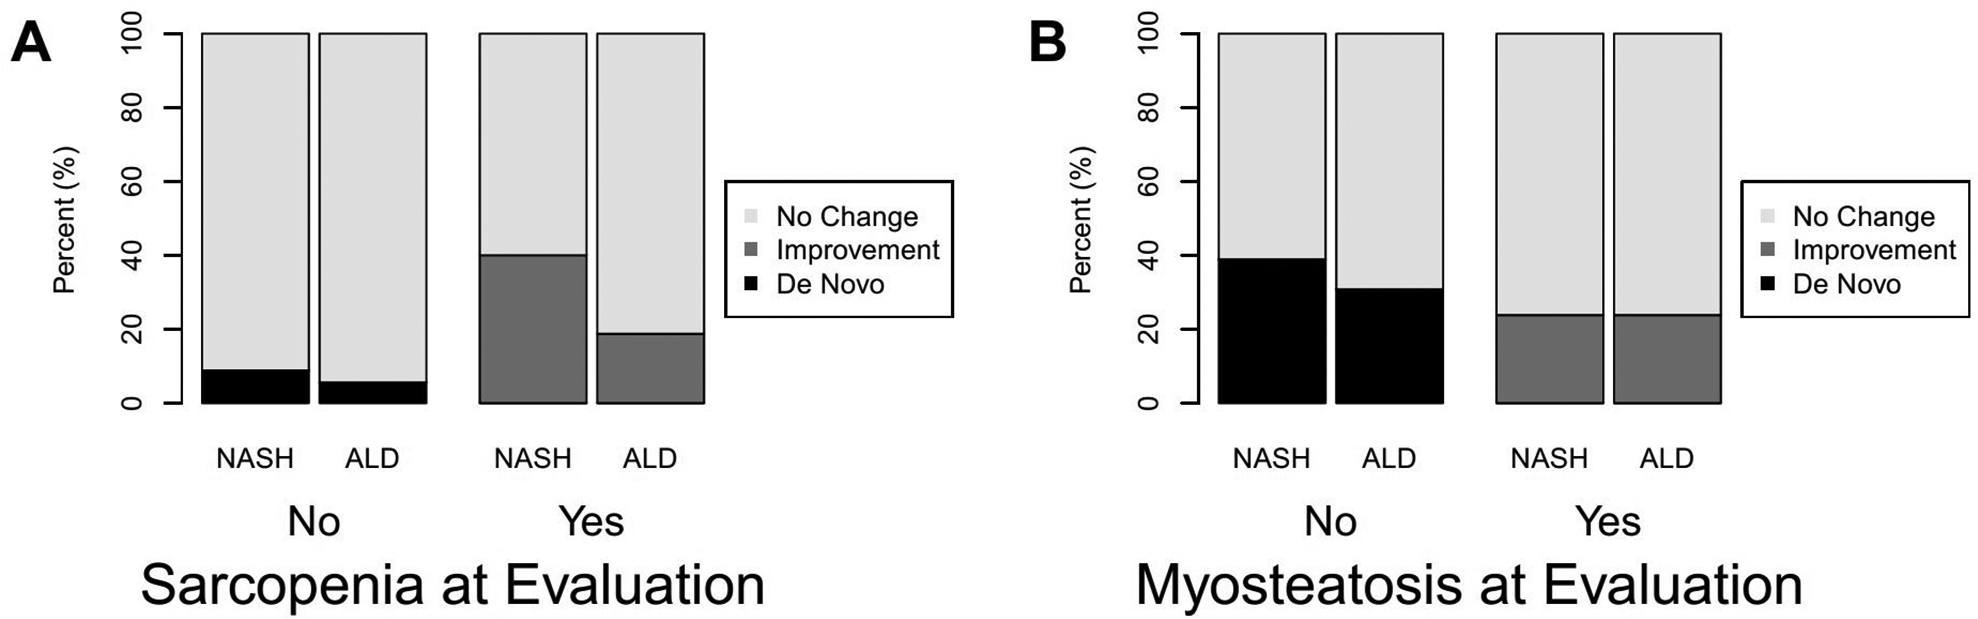
Change in muscle measures from initial evaluation on the wait list: (A) sarcopenia and (B) myosteatosis.
As the timing of the second CT was variable for each patient we also looked at percentage (%) change per 100 days to enable comparison between patients. Again, there was no significant difference in percentage (%) change in muscle mass (SMI) per 100 days in either the NASH (mean 0.8% (4.0), p=0.39) or the ALD (mean −0.4% (4.2), p=0.80) patients. There was no significant difference in percentage (%) change in mean HU (myosteatosis) per 100 days in the NASH (mean −1.6% (16.2), p=0.66) or the ALD (mean 2% (8.4), p=0.07) groups.
Impact of sarcopenia and frailty on pre-LT hospitalization LOS
Although ALD patients were more frequently hospitalized (60.5% vs 41.2%; p=0.002), the average LOS for all hospitalizations was similar between patients with NASH and ALD (11.0 days ± 10.7 vs. 13.3 days ± 13.6; p=0.24, respectively). The majority (53% (204/388)) of the hospitalizations were for decompensated liver disease, followed by other causes (39% (151/388)), which included acute kidney injury, infection, hernia repair, GI bleed, and chest pain. Causes for hospitalization were multifactorial and the main cause was unclear in a minority of patients (9% (33/388)). The presence of sarcopenia did not have an impact on the LOS in patients with either ALD or NASH. In multivariable linear regression neither MELD, muscle mass (SMI), nor mean HU (myosteatosis) were significantly associated with the pre-LT LOS in the ALD or NASH population (Table 4).
Table 4:
Multivariable models for LOS in NASH and ALD cohorts
| NASH | Change in average LOS* | 95% CI | p-value |
|---|---|---|---|
| Age (per 10 yrs) | 2.85 | (−1.17, 6.86) | 0.16 |
| Sex (F vs M) | −1.41 | (−8.67, 5.86) | 0.70 |
| MELD Score (per 1 point) | 0.19 | (−0.29, 0.68) | 0.42 |
| BMI (per 1 kg/m2) | 0.46 | (−0.09, 1.01) | 0.10 |
| Muscle mass (per 1 cm2/m2) | −0.28 | (−0.78, 0.21) | 0.25 |
| Myosteatosis (per HU) | 0.10 | (−0.32, 0.52) | 0.65 |
| Frailty deficit index (per 0.1 unit) | 2.72 | (−0.01, 5.45) | 0.05 |
| ALD | Change in average LOS* | 95% CI | p-value |
| Age (per 10 yrs) | 1.43 | (−2.23, 5.09) | 0.44 |
| Sex (F vs M) | −3.90 | (−11.19, 3.40) | 0.29 |
| MELD Score (per 1 point) | 0.31 | (−0.29, 0.91) | 0.31 |
| BMI (per 1 kg/m2) | −0.79 | (−1.62, 0.04) | 0.06 |
| Muscle mass (per 1 cm2/m2) | 0.21 | (−0.28, 0.69) | 0.40 |
| Myosteatosis (per HU) | −0.35 | (−0.77, 0.07) | 0.10 |
| Frailty deficit index (per 0.1 unit) | 1.76 | (−1.18, 4.70) | 0.24 |
The estimated difference in LOS (i.e. for age: For every 10-year increase in age the average LOS increases by 2.85 days and 1.43 days in patients with NASH and ALD, respectively); LOS- length of stay
However, in NASH patients, multivariable linear regression showed for every 0.1 unit increase in frailty deficit index, LOS increased by 2.7 days (95% CI [−0.01, 5.45]; p=0.05). No such associations were seen in the ALD patients.
Impact of sarcopenia and frailty on delisting
There was no significant difference in the risk of delisting in the NASH group when compared to the ALD group (1-year cumulative incidence 13.6%, 95% CI [7.9, 19.0] vs. 28.3%, 95% CI [19.9, 35.8]; hazard ratio (HR)=0.82, 95% CI [0.56–1.21]; p= 0.32). There was no difference in causes for delisting (for reasons other than transplant) in the two groups (Data not shown). Death was the most common cause for delisting in both groups (N=14, 33% (NASH) and N=29, 42% (ALD)), followed by debility (N=9, 21% (NASH) and N=10, 14% (ALD)). De listing due to other causes occurred in 46% of patients with NASH and 44% of patients with ALD.
In NASH patients, multivariable analysis showed neither muscle mass (SMI) (p=0.25) nor mean HU (myosteatosis) (p=0.20) had an impact on delisting. In patients with ALD, muscle mass (SMI) was associated with an increased risk of delisting (HR 1.9; 95% CI [1.2, 3.1]; p=0.01) in univariate analysis (Fig. 2). However, in multivariable analysis neither MELD, muscle mass (SMI), nor mean HU (myosteatosis) were significantly associated with delisting (Table 5).
Figure 2.
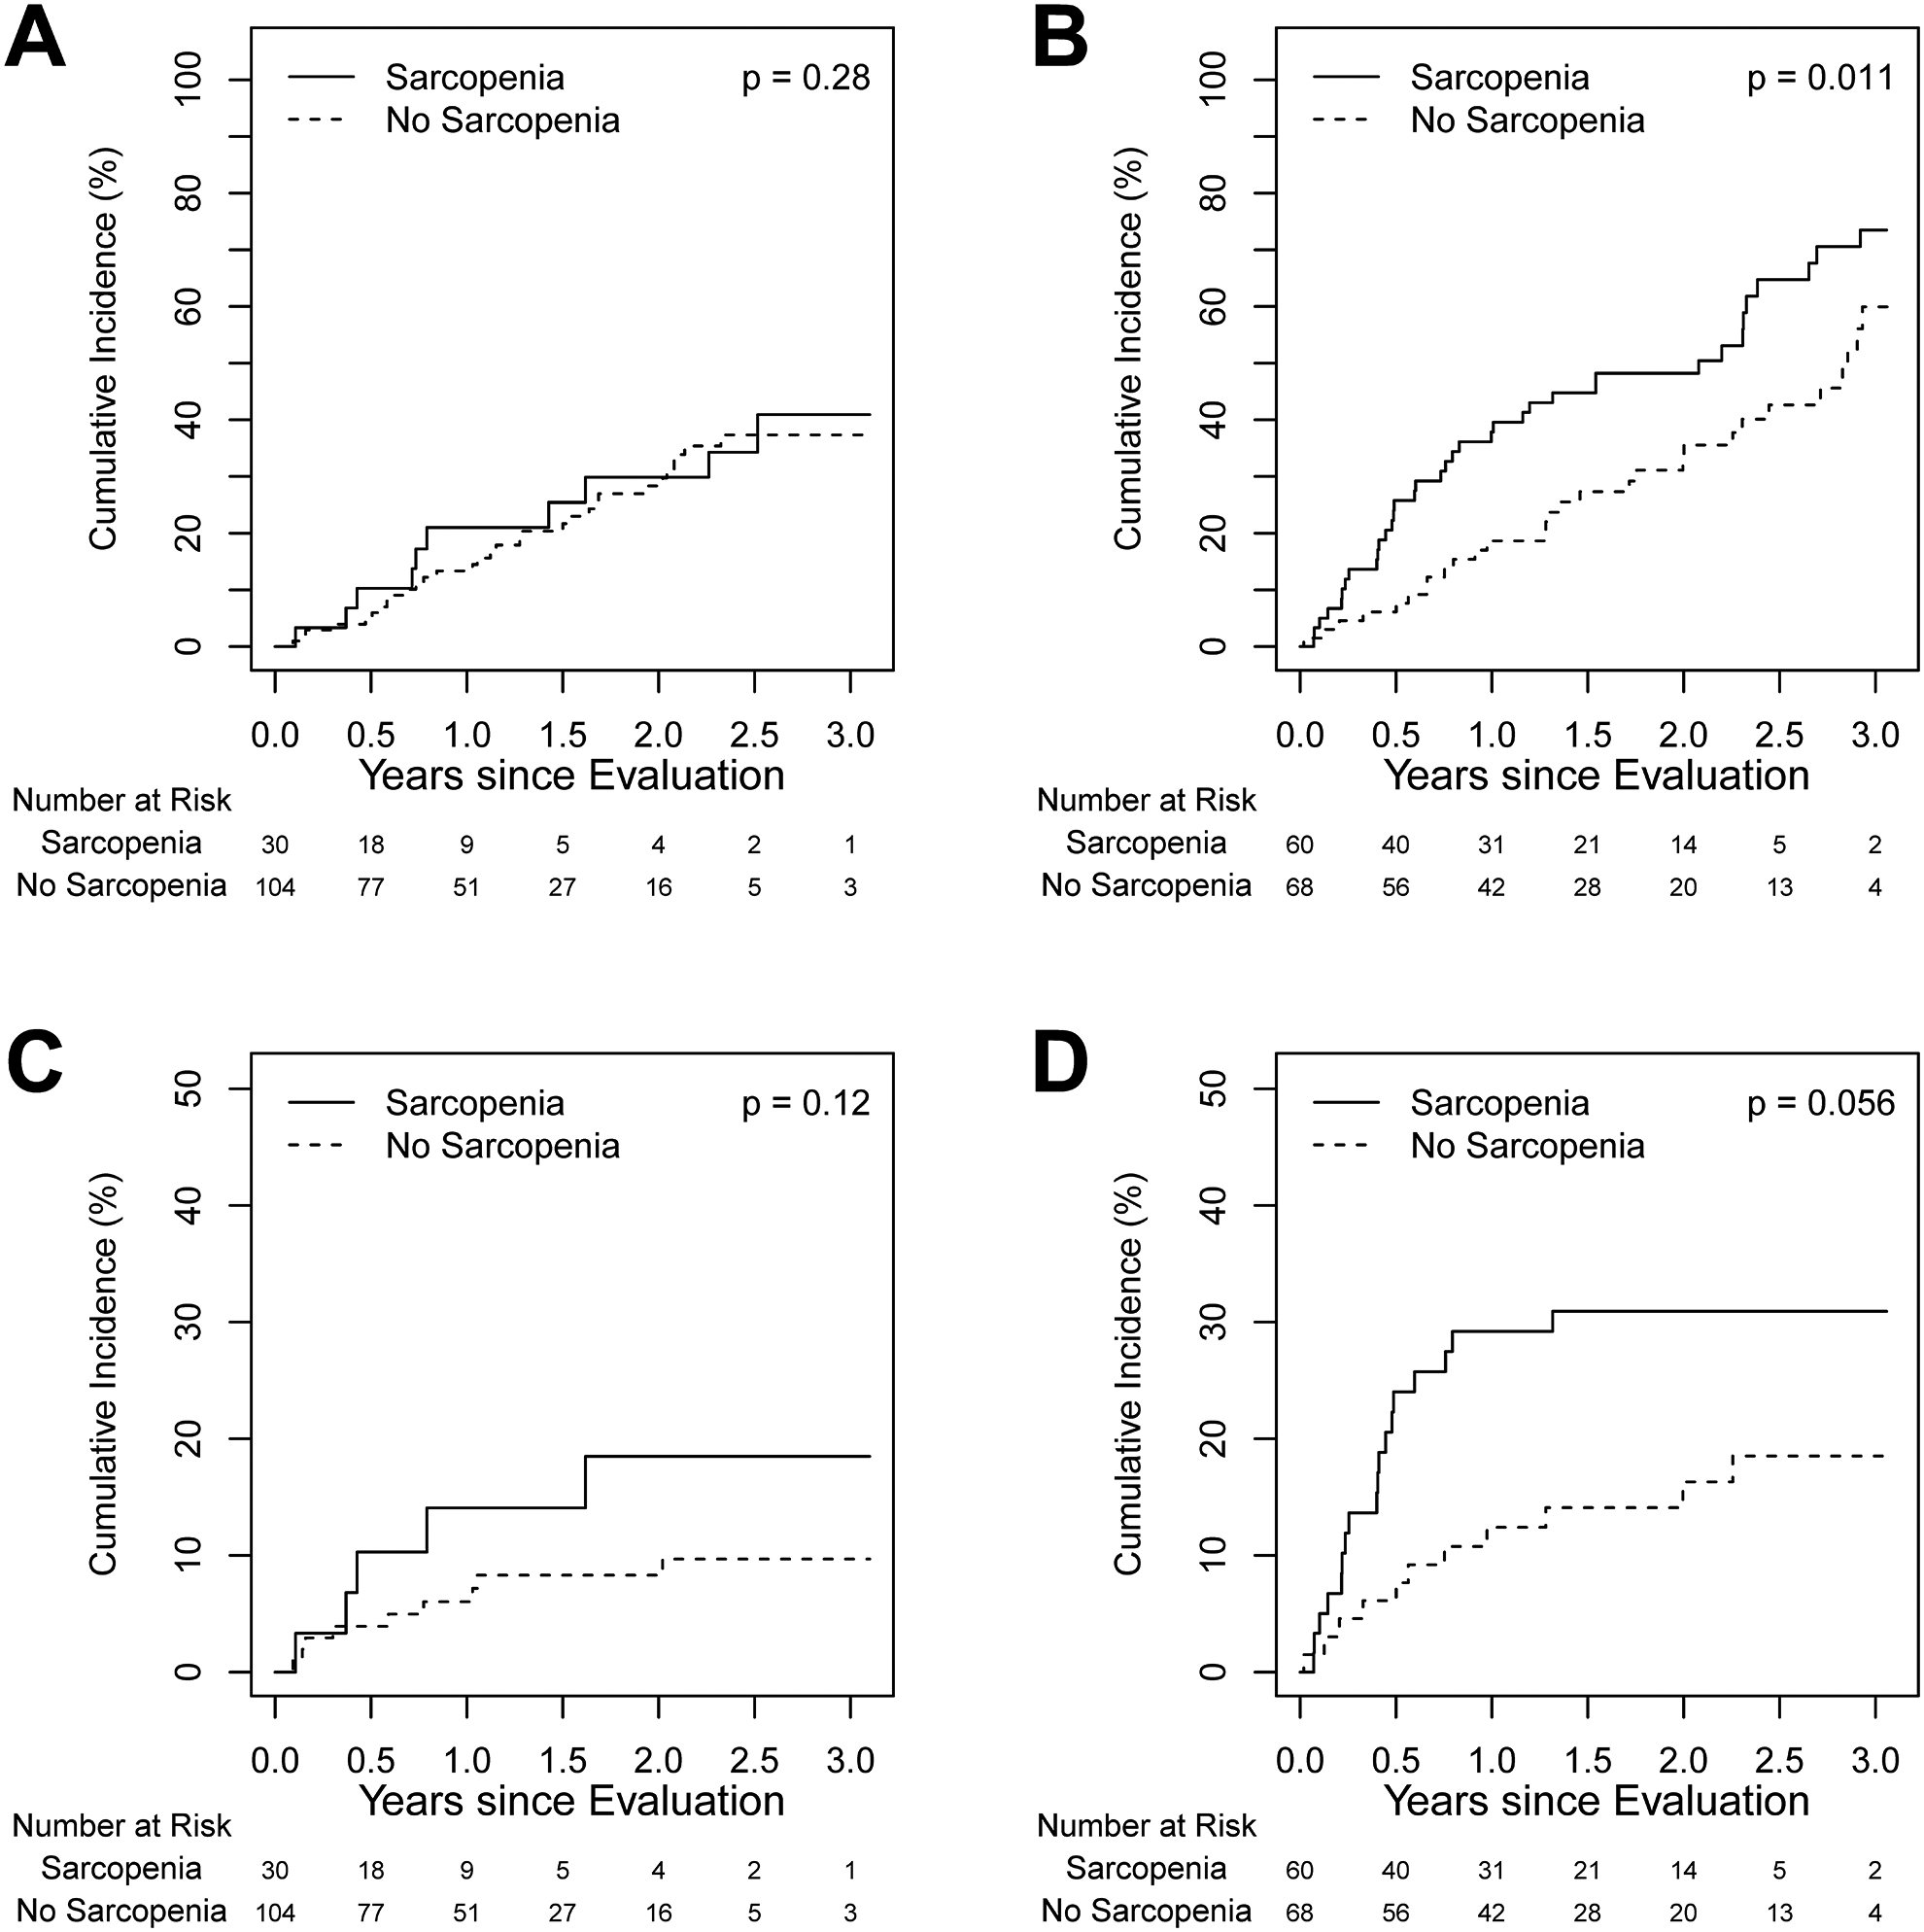
Cumulative incidence of delisting and death on wait list in sarcopenic and nonsarcopenic patients: (A) delisting in NASH patients; (B) delisting in ALD patients; (C) death on wait list in NASH patients; and (D) death on wait list in ALD patients.
Table 5:
Multivariable models for the risk of delisting in NASH and ALD cohorts
| NASH | HR | 95% CI | p-value |
|---|---|---|---|
| Age (per 10 yrs) | 1.78 | (0.90, 3.54) | 0.10 |
| Sex (F vs M) | 0.67 | (0.32, 1.41) | 0.29 |
| MELD Score (per 1 point) | 1.04 | (0.97, 1.13) | 0.27 |
| BMI (per 1 kg/m2) | 1.0 | (0.92, 1.07) | 0.89 |
| Muscle mass (per 1 cm2/m2) | 0.97 | (0.92, 1.02) | 0.25 |
| Myosteatosis (per HU) | 0.96 | (0.91, 1.02) | 0.20 |
| Frailty deficit index (per 0.1 unit) | 1.46 | (1.06, 2.03) | 0.02 |
| ALD | HR | 95% CI | p-value |
| Age (per 10 yrs) | 1.14 | (0.82, 1.60) | 0.43 |
| Sex (F vs M) | 0.60 | (0.30, 1.21) | 0.15 |
| MELD Score (per 1 point) | 1.04 | (0.98, 1.09) | 0.18 |
| BMI (per 1 kg/m2) | 1.02 | (0.92, 1.12) | 0.76 |
| Muscle mass (per 1 cm2/m2) | 0.96 | (0.91, 1.02) | 0.17 |
| Myosteatosis (per HU) | 0.99 | (0.96, 1.03) | 0.75 |
| Frailty deficit index (per 0.1 unit) | 1.01 | (0.80, 1.26) | 0.96 |
Frailty was significantly associated with delisting on multivariable analysis in patients with NASH. For every 0.1-unit increase in the frailty deficit index the risk of delisting was 1.46 times higher (95% CI [1.06, 2.03], p=0.02) (Table 5). In contrast, in patients with ALD, frailty did not impact delisting.
Impact of sarcopenia and frailty on waitlist survival
Patients with NASH had a numerically but not statistically lower risk of death on the waitlist when compared to patients with ALD, (cumulative incidence at 1-year 7.4%, 95% CI [3.1, 11.5] vs. 20.2%, 95% CI [12.8, 26.9]; HR=0.53, 95% CI [0.28, 1.01]; p=0.05). In NASH patients, sarcopenia did not impact waitlist survival (HR −2.1, 95% CI [0.7, 6.3]; p= 0.21, adjusted for mean HU (myosteatosis)). Both age (per 10 years; HR 3.24; 95% CI [1.07, 9.78]; p=0.04, adjusted for MELD) and MELD score (per point; HR 1.11; 95% CI [1.03, 1.20]; p=0.007, adjusted for age) were associated with increased risk of death on the waitlist on multivariable analysis. In patients with ALD, those with sarcopenia had an increased risk of death on the waitlist, however this difference was not statistically significant (HR 2.08; 95% CI [0.98, 4.41]; p=0.06) using univariate analysis (Fig. 2). In multivariable analysis, only MELD score was significantly associated with death on the waitlist (HR 1.07; 95% CI [1.003, 1.15]; p=0.04, adjusted for age and mean HU (myosteatosis)). The most common causes for death in NASH patients were liver failure (24%) followed by infection (19%), unknown (29%) and other causes (29%, including hemorrhage, cancer, CVD and accidental deaths). Similarly, in patients with ALD the most common cause for death was related to liver failure (20%), followed by infection (13%), unknown (33%) and other (34%, including hemorrhage, cancer, CVD and accidental deaths).
When comparing frail to non-frail patients, there was no significant difference in death occurring while on the waitlist for either NASH or ALD patients (HR=0.89, 95% CI [0.31, 2.58], p=0.83; and HR=1.04, 95% CI [0.46, 2.32], p=0.93, respectively) (Supplemental Fig. 2). No frailty index cut off point could be identified that predicted death or delisting.
DISCUSSION
This study confirms sarcopenia and frailty affect patient populations differently. Sarcopenia was less frequent, but frailty was more common in patients with NASH when compared to patients with ALD. Importantly, sarcopenia was associated with poor waitlist outcomes, including increased risk of delisting and worse waitlist survival, only in patients with ALD. Frailty was associated with an increased average LOS and an increased risk of waitlist removal in patients with NASH, but not in patients with ALD. These findings raise awareness that these complications are common but not synonymous and have varying impact on patient outcomes.
This is the first study to address both sarcopenia and frailty in NASH and ALD populations. The prevalence of sarcopenia in NASH patients (22%) was lower than the 40–60% reported in patients with cirrhosis of any etiology in previous studies (18, 19). Though sarcopenia and NASH share many of the pathophysiological mechanisms (4) it seems there may be other factors involved that also contribute to sarcopenia. The higher BMI and increased fat stores in the NASH population may partly explain the lower rates of sarcopenia in this population. Preferential loss of fat mass may spare muscle mass (20). Patients with higher BMI may experience greater muscle work for similar activity levels than lower BMI patients, explaining the relationship seen with BMI, which may translate more frequently in the NASH population. Ascites was more common in ALD than NASH patients which may affect the BMI measures as well as identify a more catabolic patient population.
Interestingly, patients with NASH had a significantly higher prevalence of frailty (49%) when compared to patients with ALD, and this rate exceeds that of 25% reported for all patients with cirrhosis (2). Frailty measures encompass more comorbidities than just muscle mass and are a reflection of overall health vulnerability. It is likely that comorbidities frequently seen in NASH, such as diabetes, hypertension, cardiovascular disease, or chronic sedentary lifestyle will contribute to frailty as well. Congruent with prior work, our study shows frailty is associated with an increased LOS, and an increased risk of delisting in patients with NASH (2, 21). This relationship was not seen in patients with ALD, despite the higher prevalence of sarcopenia. This may relate to the direct effect of alcohol on muscle itself, and a composite of less comorbidities in this population.
Our study results are in agreement with prior studies (22), showing the presence of either sarcopenia or frailty leads to poor outcomes in patients with ESLD on the transplant waitlist, whether it be increased LOS, delisting, or waitlist survival. We did not, however find any adverse clinical outcomes associated with myosteatosis, which has previously been shown to be associated with increased LOS and poor survival (14).
Limitations of this study are its retrospective nature and the single center patient population which may not be representative of other centers. In this study, sarcopenia was diagnosed based solely on muscle mass as we had missing data on hand grip strength and six-minute walk test (50%). These tools diagnose reduced muscle function, another component used in diagnosing sarcopenia (1). Another limitation is the relatively small number of subjects/events included, which makes our study underpowered to detect the associations between frailty and sarcopenia and mortality. The fact that statistical significance is found shows the strength of the association, as per previous studies that have shown both conditions are associated with poor outcomes (2, 3). Thus, it is possible both frailty and sarcopenia have an even greater impact in these patients. Of note, the prevalence of both frailty and sarcopenia increases with advanced liver disease and both are influenced by age, and sex. Further, both entities have significant overlap in pathophysiology and are linked with sarcopenia being a key component of frailty. As a result of this, it is difficult to ascertain the clinical impact of these conditions in isolation. Our study provides justification for larger, multicenter studies that are adequately powered to evaluate the association between frailty and sarcopenia and clinical outcomes in patients with varying etiologies for liver disease. Finally, frailty was defined using the deficit index developed by Rockwood et al (15) for the geriatric population. Although this has not been used frequently in the cirrhotic population, its use in other populations has shown it correlates with mortality (23). Further, both the Fried Frailty index and the deficit index have been shown to have significant overlap in identifying frailty and have statistical convergence (17).
CONCLUSION
Sarcopenia and frailty occur with differing prevalence in patients with NASH and ALD, suggesting further studies in these areas should account for underlying diseases and comorbidities. Both sarcopenia and frailty impact clinical outcomes in waitlisted patients differently. Further, larger studies are needed to confirm these findings. It is imperative that future studies address the management of sarcopenia and frailty and the resulting impact on waitlist outcomes.
Supplementary Material
Acknowledgments
Grant support: CCK is supported by the NIH NHLBI 128859 and the Robert D. And Patricia E. Kern Center for the Science of Healthcare Delivery.
Abbreviations:
- ESLD
end-stage liver disease
- LT
liver transplant
- NASH
non-alcoholic steatohepatitis
- ALD
alcoholic liver disease
- HU
Hounsfield units
- L3SMI
L3 skeletal muscle index
- LOS
length of stay
Footnotes
Disclosures: The authors have nothing to disclose.
REFERENCES:
- 1.Cruz-Jentoft AJ, Baeyens JP, Bauer JM, Boirie Y, Cederholm T, Landi F, et al. Sarcopenia: European consensus on definition and diagnosis: Report of the European Working Group on Sarcopenia in Older People. Age and ageing. 2010;39(4):412–23. [DOI] [PMC free article] [PubMed] [Google Scholar]
- 2.Lai JC, Feng S, Terrault NA, Lizaola B, Hayssen H, Covinsky K. Frailty predicts waitlist mortality in liver transplant candidates. American journal of transplantation : official journal of the American Society of Transplantation and the American Society of Transplant Surgeons. 2014;14(8):1870–9. [DOI] [PMC free article] [PubMed] [Google Scholar]
- 3.Kalafateli M, Mantzoukis K, Choi Yau Y, Mohammad AO, Arora S, Rodrigues S, et al. Malnutrition and sarcopenia predict post-liver transplantation outcomes independently of the Model for End-stage Liver Disease score. Journal of cachexia, sarcopenia and muscle. 2016. [DOI] [PMC free article] [PubMed] [Google Scholar]
- 4.Bhanji RA, Narayanan P, Allen AM, Malhi H, Watt KD. Sarcopenia in hiding: The risk and consequence of underestimating muscle dysfunction in nonalcoholic steatohepatitis. Hepatology (Baltimore, Md). 2017. [DOI] [PubMed] [Google Scholar]
- 5.Lee YH, Jung KS, Kim SU, Yoon HJ, Yun YJ, Lee BW, et al. Sarcopaenia is associated with NAFLD independently of obesity and insulin resistance: Nationwide surveys (KNHANES 2008–2011). Journal of hepatology. 2015;63(2):486–93. [DOI] [PubMed] [Google Scholar]
- 6.Carias S, Castellanos AL, Vilchez V, Nair R, Dela Cruz AC, Watkins J, et al. Nonalcoholic steatohepatitis is strongly associated with sarcopenic obesity in patients with cirrhosis undergoing liver transplant evaluation. Journal of gastroenterology and hepatology. 2016;31(3):628–33. [DOI] [PMC free article] [PubMed] [Google Scholar]
- 7.Dasarathy J, McCullough AJ, Dasarathy S. Sarcopenia in Alcoholic Liver Disease: Clinical and Molecular Advances. Alcoholism, clinical and experimental research. 2017;41(8):1419–31. [DOI] [PMC free article] [PubMed] [Google Scholar]
- 8.Lang CH, Frost RA, Deshpande N, Kumar V, Vary TC, Jefferson LS, et al. Alcohol impairs leucine-mediated phosphorylation of 4E-BP1, S6K1, eIF4G, and mTOR in skeletal muscle. American journal of physiology Endocrinology and metabolism. 2003;285(6):E1205–15. [DOI] [PubMed] [Google Scholar]
- 9.Bonet-Ponce L, Saez-Atienzar S, da Casa C, Flores-Bellver M, Barcia JM, Sancho-Pelluz J, et al. On the mechanism underlying ethanol-induced mitochondrial dynamic disruption and autophagy response. Biochimica et biophysica acta. 2015;1852(7):1400–9. [DOI] [PubMed] [Google Scholar]
- 10.Villalta J, Ballesca JL, Nicolas JM, Martinez de Osaba MJ, Antunez E, Pimentel C. Testicular function in asymptomatic chronic alcoholics: relation to ethanol intake. Alcoholism, clinical and experimental research. 1997;21(1):128–33. [PubMed] [Google Scholar]
- 11.Takahashi N, Sugimoto M, Psutka SP, Chen B, Moynagh MR, Carter RE. Validation study of a new semi-automated software program for CT body composition analysis. Abdominal radiology. 2017. [DOI] [PubMed] [Google Scholar]
- 12.Carey EJ, Lai JC, Wang CW, Dasarathy S, Lobach I, Montano-Loza AJ, et al. A multi-center study to define sarcopenia in patients with end-stage liver disease. Liver transplantation : official publication of the American Association for the Study of Liver Diseases and the International Liver Transplantation Society. 2017. [DOI] [PMC free article] [PubMed] [Google Scholar]
- 13.Martin L, Birdsell L, Macdonald N, Reiman T, Clandinin MT, McCargar LJ, et al. Cancer cachexia in the age of obesity: skeletal muscle depletion is a powerful prognostic factor, independent of body mass index. Journal of clinical oncology : official journal of the American Society of Clinical Oncology. 2013;31(12):1539–47. [DOI] [PubMed] [Google Scholar]
- 14.Montano-Loza AJ, Angulo P, Meza-Junco J, Prado CM, Sawyer MB, Beaumont C, et al. Sarcopenic obesity and myosteatosis are associated with higher mortality in patients with cirrhosis. Journal of cachexia, sarcopenia and muscle. 2016;7(2):126–35. [DOI] [PMC free article] [PubMed] [Google Scholar]
- 15.Rockwood K, Song X, MacKnight C, Bergman H, Hogan DB, McDowell I, et al. A global clinical measure of fitness and frailty in elderly people. CMAJ : Canadian Medical Association journal = journal de l’Association medicale canadienne. 2005;173(5):489–95. [DOI] [PMC free article] [PubMed] [Google Scholar]
- 16.Wilson ME, Vakil AP, Kandel P, Undavalli C, Dunlay SM, Kennedy CC. Pretransplant frailty is associated with decreased survival after lung transplantation. The Journal of heart and lung transplantation : the official publication of the International Society for Heart Transplantation. 2016;35(2):173–8. [DOI] [PubMed] [Google Scholar]
- 17.Clegg A, Young J, Iliffe S, Rikkert MO, Rockwood K. Frailty in elderly people. Lancet (London, England). 2013;381(9868):752–62. [DOI] [PMC free article] [PubMed] [Google Scholar]
- 18.Montano-Loza AJ, Meza-Junco J, Prado CM, Lieffers JR, Baracos VE, Bain VG, et al. Muscle wasting is associated with mortality in patients with cirrhosis. Clinical gastroenterology and hepatology : the official clinical practice journal of the American Gastroenterological Association. 2012;10(2):166–73, 73.e1. [DOI] [PubMed] [Google Scholar]
- 19.Periyalwar P, Dasarathy S. Malnutrition in cirrhosis: contribution and consequences of sarcopenia on metabolic and clinical responses. Clinics in liver disease. 2012;16(1):95–131. [DOI] [PMC free article] [PubMed] [Google Scholar]
- 20.Peng S, Plank LD, McCall JL, Gillanders LK, McIlroy K, Gane EJ. Body composition, muscle function, and energy expenditure in patients with liver cirrhosis: a comprehensive study. The American journal of clinical nutrition. 2007;85(5):1257–66. [DOI] [PubMed] [Google Scholar]
- 21.Dunn MA, Josbeno DA, Tevar AD, Rachakonda V, Ganesh SR, Schmotzer AR, et al. Frailty as Tested by Gait Speed is an Independent Risk Factor for Cirrhosis Complications that Require Hospitalization. The American journal of gastroenterology. 2016;111(12):1768–75. [DOI] [PubMed] [Google Scholar]
- 22.Tandon P, Ney M, Irwin I, Ma MM, Gramlich L, Bain VG, et al. Severe muscle depletion in patients on the liver transplant wait list: its prevalence and independent prognostic value. Liver transplantation : official publication of the American Association for the Study of Liver Diseases and the International Liver Transplantation Society. 2012;18(10):1209–16. [DOI] [PubMed] [Google Scholar]
- 23.Kulminski AM, Ukraintseva SV, Kulminskaya IV, Arbeev KG, Land K, Yashin AI. Cumulative deficits better characterize susceptibility to death in elderly people than phenotypic frailty: lessons from the Cardiovascular Health Study. Journal of the American Geriatrics Society. 2008;56(5):898–903. [DOI] [PMC free article] [PubMed] [Google Scholar]
Associated Data
This section collects any data citations, data availability statements, or supplementary materials included in this article.