

Abstract
Human breast tumors are not fully autonomous. They are dependent on nutrients and growth-promoting signals provided by the supporting stromal cells. Within the tumor microenvironment, one of the secreted macromolecules by tumor cells is activin A, where we show to downregulate CD36 in fibroblasts. Downregulation of CD36 in fibroblasts also increases the secretion of activin A in fibroblasts. We hypothesize that overexpression of CD36 in fibroblasts inhibits the formation of solid tumors in subtypes of breast cancer models. For the first time, we show that co-culturing organoid models of breast cancer cell lines of MDA-MB-231 (e.g., a triple-negative line) or MCF7 (e.g., a luminal-A line) with CD36+ fibroblasts inhibit the growth and normalizes basal and lateral polarities, respectively. In the long-term anchorage-independent growth assay, the rate of colony formation is also reduced for MDA-MB-231. These observations are consistent with the mechanism of tumor suppression involving the downregulation of pSMAD2/3 and YY1 expression levels. Our integrated analytical methods leverage and extend quantitative assays at cell- and colony-scales in both short- and long-term cultures using brightfield or immunofluorescent microscopy and robust image analysis. Conditioned media are profiled with the ELISA assay.
Keywords: Breast cancer, Tumor microenvironment, organoid model, growth inhibition
Introduction
Tumor microenvironments[1] include fibroblasts, immune cells, and endothelial cells, and they are known to influence human breast cancer progression and malignancy. Cancers are not entirely autonomous and depend on nutrients and growth-promoting signals from supporting cells. Although cancer cells are highly plastic and can develop resistance to therapeutic drugs, supporting cells are generally more stable, with limited adaptation to external challenges. Hence, these stromal cells may provide alternative therapeutic targets with reduced toxicity. In a recent collaboration, we demonstrated that CD36 expression is downregulated in the fibroblasts of normal breast tissues with high mammographic density[2, 3], suggesting that normalizing the microenvironment by correcting fibroblast CD36 expression may have therapeutic potential. In addition, tumor cells overexpress and secrete activin A, which can downregulate CD36 in fibroblasts, as modeled in Supplementary Fig. 1. Herein, we present a brief review of the literature associated with this hypothesis, followed by an experimental strategy for testing it.
Activin A is a secreted macromolecule that is overexpressed in cancer cells[4, 5] or in response to microenvironmental stressors, such as increased mammographic density (MD) in normal mammary glands[3] or organoid models of high MD[6]. Activin A is a member of the TGF-β superfamily of cytokines, and similar to TGFβ, it signals through pSmad 2/3 effectors to activate cell cycle checkpoints in normal cells. In addition, activin A induces tumorigenesis by increasing the production of cytokines that enhance tumor–microenvironment interactions[7], thereby promoting anchorage-independent growth (AIG), migration of breast cancer cell lines, and inducing epithelial-mesenchymal transition and invasion [8].
The secretion of activin A and other macromolecules by tumor cells, in turn, can transform fibroblasts into cancer-associated fibroblasts (CAFs)[9] that promote malignancy and tumor progression. CAFs play important roles in tumor fibrosis, angiogenesis, and metastasis [10] by secreting cytokines, chemokines, and collagen into the tumor stroma, and by mediating collagen cross-linking[11]. Activin A was suggested to induce CAFs by down-regulating CD36 [12], which is a membrane protein with roles in fatty acid and glucose metabolism. We hypothesize that normalizing the microenvironment by restoring CD36 expression may have a therapeutic impact. To test our hypothesis, we examined the responses of solid tumors to transfected fibroblasts using a series of quantitative assays. Because cell-cell interactions, such as those between tumor and fibroblast cells, are difficult to decipher, we investigated the basic components of this complex system independently and then combined them to perform additional experiments. Measurements of cell-based protein expressions were based on immunofluorescent microscopy because the analysis (a) is quantitative, (b) can be performed on a cell-by-cell basis, (c) requires a smaller number of cells, and our lab has extensive experience in quantitative analysis of on immunofluorescent images[13, 14].
Materials and Methods
Cell subculture and maintenance
Cells were maintained at 37°C in a humidified incubator containing 5% CO2. FM1 cells were cultured in fibroblast medium (Zenbio). MDA-MB-231 and MCF7 cells were cultured in DMEM supplemented with 10% fetal bovine serum and 1% penicillin-streptomycin. MCF7 cells were cultured in EMEM supplemented with 10% FBS and insulin.
CD36 transfection and validation
Fibroblasts were transfected with CD36 overexpression and knockdown constructs using CRISPR-cas9 technology (Santa Cruz Biotechnology SC400233-ACT/KO) and validated using fluorescent microscopy per vendor’s protocol. The transfection efficiency was around 75%. The vendor’s protocol was followed without modifications. Negative control cells were transfected with empty plasmid vectors. After 24 h, transfected cells were stained with the CD36 antibody (Santa Cruz Technology SC73643). Immunofluorescence microscopy analyses of transfected cells indicated that the transfection was stable for up to four passages.
Co-culture of fibroblasts and epithelial cells
Fibroblasts (CD36+, CD36−) were subcultured and grown in cell culture inserts (Thermo Fisher 1406274 and 141008) to 90% confluency. Layers of Matrigel (50μm thick) were then added to each well (24 well plate). In single sets of plates, MCF7 and MDA-MB-231 cells were cultured using the on-top method[15]. With both cell types, media was added, and disposable inserts containing fibroblasts were hung well above the epithelial cells to allow the exchange of macromolecules. The epithelial–fibroblast ratio was maintained at 1:3. Co-culture media was a 50%/50% mixture of culture media for epithelial and fibroblast cells. MCF7 and MDA-MB-231 co-cultures with fibroblasts were incubated for 10 and 7 days, respectively.
Profiling of activin A secretions
MCF7, MDA-MB-231, and nontransformed MCF10A (for use in a control group) cells were grown in 3D culture using the “on-top” method[16] and were then co-cultured with fibroblasts (CD36+, CD36−). On days 3 and 6, conditioned media was collected and analyzed using activin A enzyme-linked immunosorbent assay (ELISA) Kits (Thermo Fisher, EHACTIVINA) per specified protocol.
CD36 expression in primary fibroblasts under the influence of Activin A
Expressions of CD36, in fibroblasts, were quantified in (i) monocultures of primary fibroblasts, and (ii) co-cultures of MDA-MB-231 with primary fibroblasts. In each case, controls included CD36+ and CD36− fibroblasts and activin A neutralizing antibody. The concentration of neutralizing antibody (R&D system, MAB3381) was set at 1 μg/mL[17]. All experiments were performed in triplicates.
In the first experiment, monocultures of fibroblast cells were exposed to concentrations of activin A at 1, 2.25, or 20ng/mL and prepared through serial dilution. In the second experiment, primary fibroblasts and MDA-MB-231 were seeded in 24-well plates, and cell culture inserts with the seeding density of 4.5k and 1.5k cells per well, respectively. The MDA-MB-231 was cultured in the insert. 24 hours after seeding, the fibroblasts and tumor cells were co-cultured together without cell-cell contact. On days 3 and 5, fibroblasts were fixed and stained with CD36 antibody and DAPI nuclear stain. Experiments for each of the two days were performed in separate plates with independent controls.
Fixation and immunofluorescence staining
Cell cultures were fixed at room temperature in 10% formalin supplemented with 0.5% saponin (Sigma 47036) for 15 min. After three washes in calcium and magnesium-free phosphate-buffered saline (PBS), cells were permeabilized using a 0.1% Triton X-100 solution for 5 min, were washed again three times, and were treated for 1h with blocking solution containing 1% bovine serum albumin (Sigma A7638) and 1% goat IgG (Jackson ImmunoResearch 115005044). Samples were stained for differing molecular endpoints, but nuclei were stained with 50-ng/mL 4’−6-diamidino-2-phenylindole (DAPI; Life Science Technology D1306) to profile growth inhibition or colony organization in all samples. Monoclonal rabbit or mouse anti-human primary antibodies (CD36, Santa Cruz Biotech sc-7309; β-catenin, Abcam ab32572; β4-integrin, Abcam ab133682; YY1, Abcam ab232573, pSmad2, Cell signaling, 18338, and pSmad3, Abcam ab52903) were diluted in blocking solution (1:500) and applied to cells for 1h. After three washes in PBS, goat anti-rabbit secondary antibodies conjugated with Alexa 488 and Alexa 565 (A11008 and A11011; Life Science Technology) were diluted in blocking solution (1:250) and were conjugated to primary antibodies for 1h. Cells were finally washed 3 times in PBS.
Fluorescence microscopy
Stained samples were either imaged with (a) Olympus FV1000 confocal system with a 40X Olympus water objective with NA of 0.8 and WD of 3.3mm or (b) wide-field EVOS FL Auto Imaging System equipped with an AMEP 4633 10 × phase objective (0.25 of NA and 6.9 mm of WD) or the same objective used for confocal microscopy. In both cases, the excitation lasers were set at 385, 488, and 568 nm for DAPI, Alexa 488, and 563 fluorophores, respectively. All imaging parameters were constant for conditions within the same experiment
Quantification of molecular endpoints in the organoid model
We have leveraged robust image analysis methods that were developed in our laboratory [13, 14] for quantifying fluorescent images. These methods involve accurate segmentation of each cell and aggregating readouts over many fields of view for each condition.
For quantitative analysis nuclear-bound YY1 or Ki67, samples were imaged, in 3D, with a 40X objective with a confocal microscope. Subsequently, the middle slice was used for quantitative assessments. Regardless of the endpoints and for each condition, 60 colonies were randomly selected, imaged, and quantified. Quantitative analysis of YY1 and Ki67 were automated and performed on a cell-by-cell basis for each condition.
For quantitative analysis of isolated cells vs. colony formation by MCF7 cells, DAPI stained samples were segmented. The average size of a single cell was established by measuring the size of 100 nuclei with a constant threshold in all conditions, and the numbers of isolated cells were counted automatically. Colony formations were imaged using phase-contrast microscopy and colonies were counted interactively. All channels associated with the antibody staining were background corrected against a well containing PBS and no cells.
Anchorage-independent growth assays (AIG)
The details of AIG are summarized in Supplementary file/Supplementary Fig. 2.
Quantitative analysis of CD36 in fibroblasts
To quantify the CD36 expression in fibroblasts, samples were also DAPI stained and imaged with a 10X objective using a wide-field microscope. For all conditions, within a plate, eight to twelve fields of view were captured per well. Images were (i) background-corrected against 2–3 control-wells containing PBS and no cells, and (ii) binarized with the same threshold. The total fluorescent signal per field of view was averaged against the number of nuclei in the same field, where the number of nuclei per field of view was quantified using the method in the preceding section. All imaging parameters, within the same plate, were kept constant.
Statistical analysis
All conditions were carried out in triplicates with a minimum of three independent experiments. The differences in the biological responses, between experimental variables, were significant if the p-value for the student’s t-test was less than 0.05.
Results
Activin A downregulated CD36 expression in monocultures of fibroblast cells
Control fibroblasts were transfected with CD36− and CD36+ plasmid constructs for reference signals. In previous clinical studies, concentrations of activin A were reported to be approximately 1 ng/ml in stage IV lung adenocarcinomas[18] and were 2.24 ± 0.52 ng/ml in solid tumors. Activin A was also approximately doubled in breast carcinoma patients[19]. Yet in laboratory settings, some researchers have used activin A concentrations as high as 80 and 320 ng/ml[2]. These high concentrations may have been necessary to compensate for the sensitivity of available antibodies and the imaging mode of immunohistochemistry. In the present study, activin A was used at 1, 2.25, or 20 ng/ml, samples were fixed on day 5, imaged with immunofluorescent microscopy, and quantified using robust image analysis methods[20, 21]. The rationale for day 5 fixation is that in the co-culture assay with MDA-MB-231, the CD36 expression, in fibroblasts, was reduced on day 5 but not on day 3. The readout from the co-culture assay provides a more complex environment than the simpler monocultures of the primary fibroblast cells with day 5 being a timepoint for an observable downregulation of CD36. The result of CD36 expression in the monoculture and co-culture assays are shown in Fig. 1, respectively. The controls include CD36− and CD36+ fibroblasts and neutralizing activin A antibody added to the condition media. The readout for the CD36 expression for day 3 is shown in Supplementary Fig. 3.
Figure 1:

Activin A downregulated CD36 expression in primary fibroblasts as monitored with immunofluorescent wide-field microscopy. (a) CD36 expression in transfected primary fibroblasts was monitored with a wide-field fluorescent microscope, where nuclei were labeled with DAPI and delineated computationally in yellow. (b) CD36 expression of primary fibroblasts, cocultured with MDA-MB-231 cells, was quantitatively analyzed. Controls were primary, CD36+-, CD36−-, primary fibroblasts, and fibroblast with MDA-MB-231 coculture, supplemented with activin A neutralizing antibody. (c) CD36 expression of primary fibroblasts, in response to different concentrations of activin A at 0, 1, 2.25, and 20 ng/mL and the conditioned media from MDA-MB-231 conditioned medium were quantified. Controls were CD36+-, CD36−-, primary fibroblasts and the conditioned media supplemented with the activin A neutralizing antibody.
Production of activin A in 3D colonies of MDA-MB-231 cells was reduced in the presence of CD36+ fibroblasts
We quantified the concentration of activin A in the conditioned media of (i) monocultures of transfected fibroblasts, and (ii) the 3D co-cultures of MDA-MB-231 or MCF7 breast cancer cells with CD36+ and CD36− fibroblasts. Fig. 2a indicates that the secretion of activin A is increased in monocultures of CD36− fibroblasts. Fig 2b–c indicates the concentration of activin A in the conditioned media of the co-culture assays on days 3 and 6. The results indicate that when normalized to the numbers of cells, activin A production was reduced when MDA-MB-231 was co-cultured CD36+ fibroblasts. Conversely, the production of activin A was increased when tumor cells are co-cultured with CD36− fibroblasts.
Figure 2:

The total production of activin A, in the co-culture assay, was reduced as a result of co-culturing cancer cell lines with the CD36+ fibroblasts. Conditioned medium was collected on (a) day 3 and (b) day 6 and quantified with the ELISA assay. MCF10A is a non-malignant cell line that was used as a reference signal. (c) Production of activin A in monocultures of CD36− fibroblast cells was increased compared to CD36+ fibroblasts.
3D co-culture of MDA-MB-231 or MCF7 with CD36+ fibroblasts showed growth inhibition or reversion of basal and lateral polarity, respectively
MDA-MB-231 were cocultured with CD36+, CD36−, or no fibroblasts, and fixed and stained after 6 days with DAPI and an antibody against Ki-67. Figs. 3a–b show that the growth rates of MDA-MB-231 tumor cells were significantly reduced and increased in co-cultures with CD36+ and CD36− fibroblasts, respectively. Moreover, Ki-67 expression, quantified on a cell-by-cell basis, was lower in tumor cells after co-culture with CD36+ fibroblasts. We also investigated changes in nuclear morphology under these conditions and quantified indices associated with the size and shape of nuclei for population analysis. Consensus clustering[22] revealed the two significant populations shown in Fig. 3c and these were associated with high and low levels of Ki-67 expression. Specifically, the proportion of cells in the high Ki67 expressing cluster was larger after co-culture with CD36− fibroblasts (Fig. 3d). In addition, the frequency of enlarged nuclei increased following co-culture of MDA-MB-231 cells with CD36− fibroblasts. Larger nuclei are associated with higher grades of tumors [23], with the population analysis shown in Supplementary Fig. 4.
Figure 3:

The co-culture of breast cancer cell lines with CD36+ fibroblasts showed growth inhibition, reversion of basal and lateral polarity, or reduced malignant potential. (a-d) Co-culture of MDA-MB-231 with CD36+ or CD36− fibroblasts resulted in growth inhibition or promotion, respectively; two populations of Ki67 expressing cells; and higher frequency of proliferating cells, with high-level of Ki67, with the CD36− co-culture. (e-g) Co-culture of MCF7 with CD36+ induced renormalization of lateral and basal polarity, reduced colony formation, and reduced number of single cells. (h-i) Preconditioned MDA-MB-231 cells to CD36+ fibroblasts show reduced malignant potential as indicated with the AIG assay, and preconditioned MCF7 cells to CD36+ fibroblasts show no significant statistical difference.
MCF7 were cocultured with CD36+, CD36−, or no fibroblasts, and fixed and on day 10. Samples were imaged with DAPI and β-catenin (lateral) and β4-integrin (basal) antibodies and imaged using a fluorescence microscope. Remarkably, MCF7 cells formed basal and lateral polarized (BLP) colonies in the presence of CD36+ fibroblasts, as shown in Figs. 3e. We also evaluated colony formation in co-cultures of MCF7s with CD36− fibroblasts (Figs. 3f) or with no fibroblasts (Supplementary Figure 5). Using the on-top method in 3D cell cultures[15], neighboring epithelial cells aggregate to form colonies. Organoid fusion and epithelial migration were previously performed to identify inhibitors that interfere with cell migration and colony morphogenesis [24]. Hence, if the frequency of colony formation is reduced, then the rate of epithelial cell migration may also be reduced, as manifested by increased numbers of single cells. Fig. 3g shows that co-culturing with MCF7 with CD36+ fibroblasts decreased the frequency of colony formation and increased the number of single-cell present in the culture.
Finally, after co-culture with CD36+ FB, MDA-MB-231 exhibited reduced anchorage-independent colony formation. Anchorage-independent growth (AIG) has been correlated with in vivo tumorigenicity[25]. Finally, we co-cultured MDA-MB-231 or MCF7 breast cancer cells with CD36+ or CD36− fibroblasts under standard adherent culture conditions and then retrieved the cells on days 6 and 10, respectively. We then evaluated anchorage-independent colony-forming potential, shown to be correlated with in vivo tumorigenicity[25], per quantitative protocol summarized in the supplementary file. After 21 days of culture, samples were fixed, stained, and imaged (Supplementary Figure 6). Quantitative profiling of MDA-MB-231 colonies showed reduced anchorage-independent colony formation after co-culture with CD36+ fibroblasts compared with that after co-culture with CD36− fibroblasts Whereas MCF7 cells showed a similar trend, the differences were not statistically significant (Figure 3i).
YY1 expression and pSmad2/3 were downregulated in MCF7 and MDA-MB-231, respectively, when co-cultured with CD36+ fibroblasts
The oncogene YY1 plays an important role in differentiation, proliferation, and tumorigenesis[26], whether tumorigenesis is induced by cell cycle regulation, inhibition of the p53 tumor suppressor, or apoptosis. Moreover, inhibition of YY1 has been shown to alter the phenotype of MCF7 cells to one that resembles MCF10A cells, and conversely, overexpression of YY1 in MCF10A cells leads to a phenotype that resembles MCF7 cells[27]. Hence, we investigated whether the reversion of polarity in MCF7 colonies co-cultured with CD36+ fibroblasts is related to YY1 expression. As shown in Fig. 4a–b, YY1 expression was significantly downregulated in MCF7 cells co-cultured with CD36+ fibroblasts and was increased in MCF7 cells co-cultured with CD36− fibroblasts.
Figure 4:
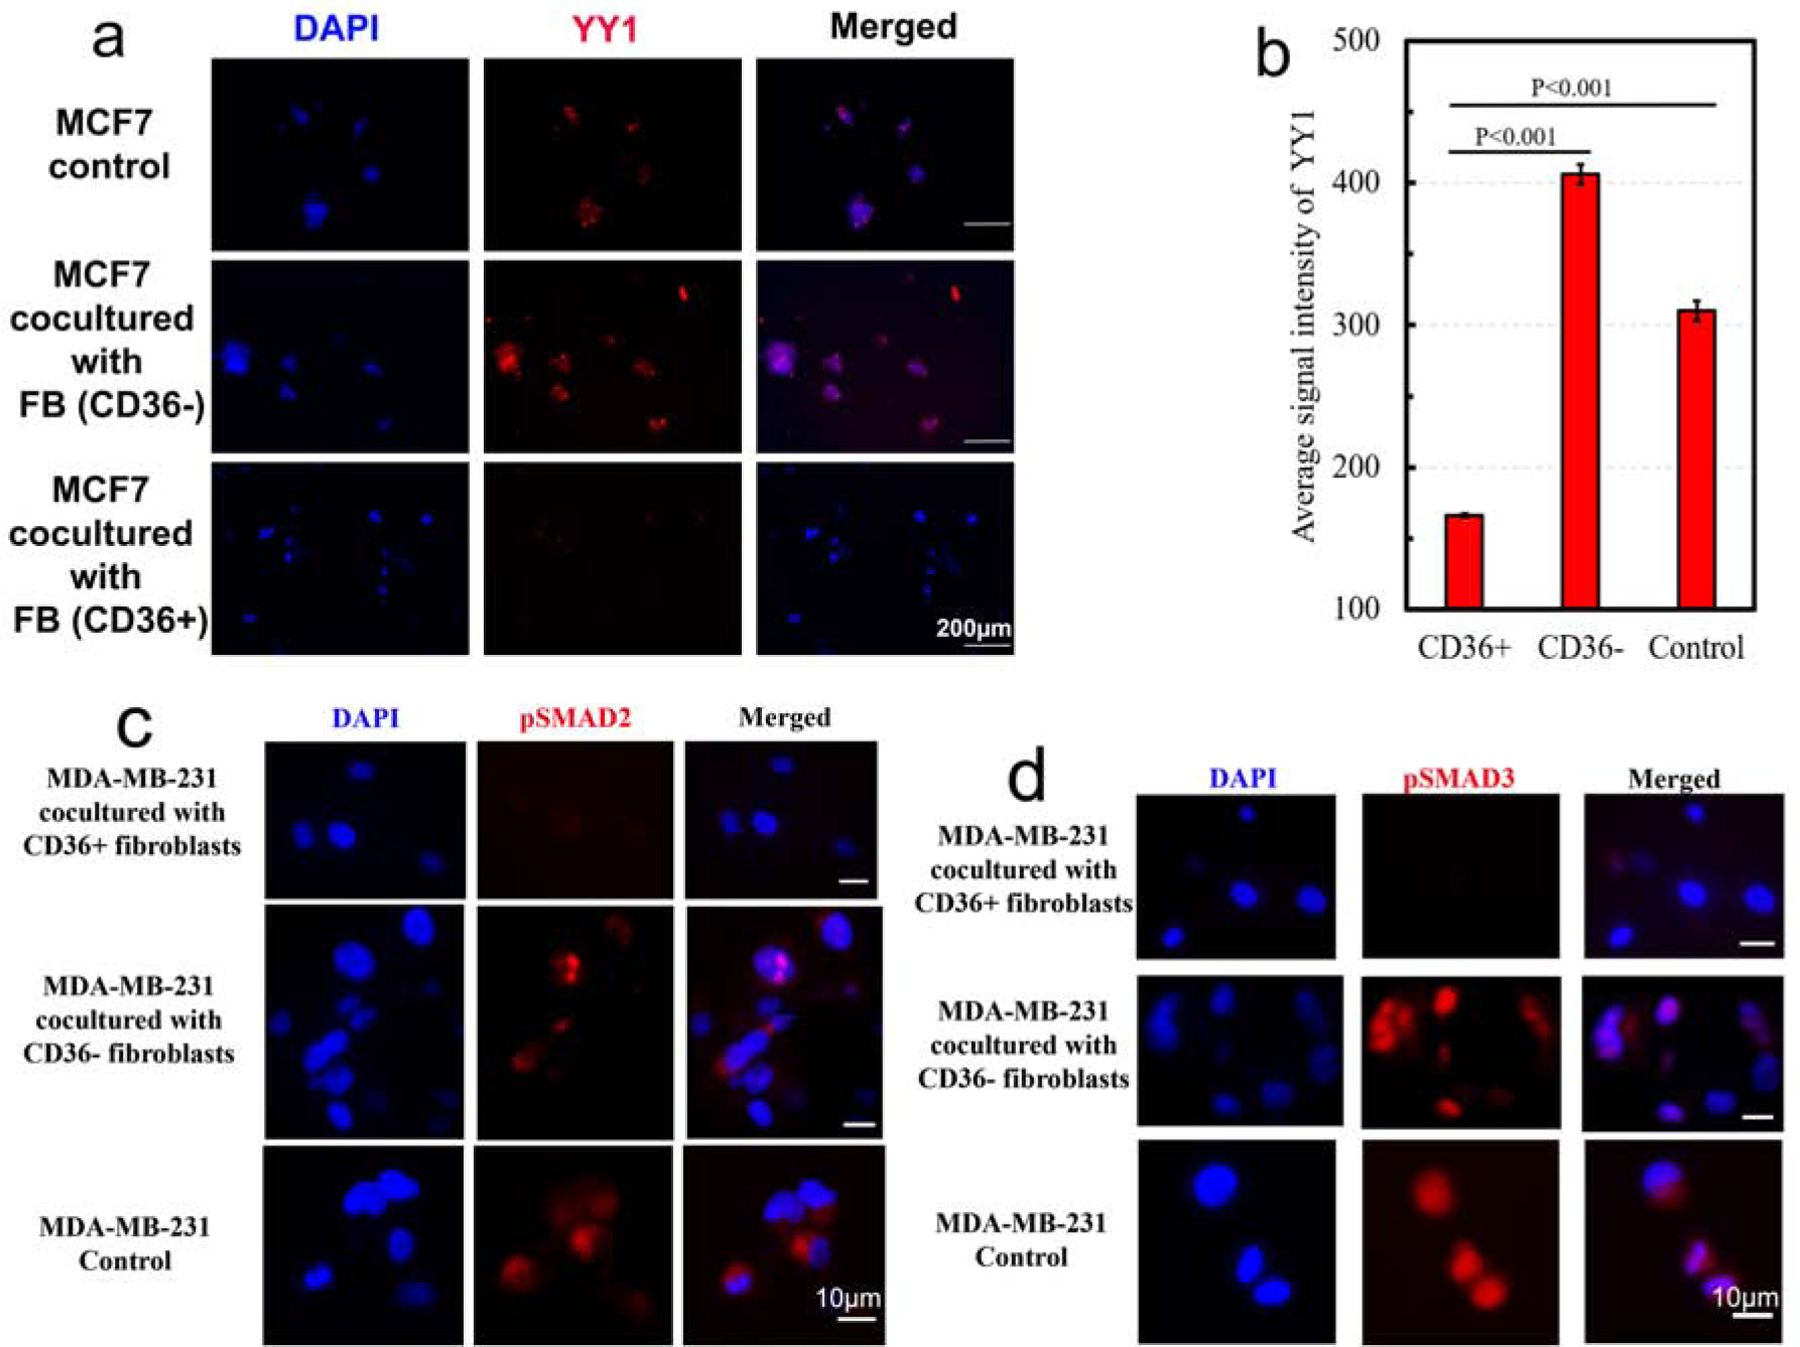
YY1 and pSmad 2/3 expressions were downregulated in organoid models of MCF7 and MDA-MB-231, co-cultured with CD36+ fibroblasts, respectively.
The TGF-β superfamily of ligands activates Smad proteins that regulate transcription and control cell proliferation in multiple cancer types[28]. In particular, pSmad 2/3 are downstream effectors of activin A and TGFβ and play important roles in cell cycle arrest. Thus, we considered whether growth inhibition is consistent with the known mechanisms of tumor inhibition, such as downregulation of pSmad 2/3. MDA-MB-231 cells were co-cultured in 3D with CD36+, CD36−, and no fibroblasts for 6 days. Subsequently, samples were fixed and stained with DAPI and an antibody against pSmad 2/3. These experiments (Fig. 4c–d) indicated that pSmad 2/3 are downregulated in MDA-MB-231 cells co-cultured with CD36+ fibroblasts.
Discussion
We hypothesized that the co-culture of CD36+ fibroblasts with breast cancer cell lines can suppress tumor formation and performed experiments using co-cultures of organoid models of two tumor cell lines along with CD36+, CD36−, or no fibroblasts. We evaluated proliferation and colony organization in short-term experiments and the potential for colony formation in long-term experiments and quantified secretions of activin A in co-culture assays and in monocultures of CD36+ or CD36− fibroblasts. Subsequently, we investigated tumor growth in an immunocompromised mouse model. The present co-culture experiments show that the CD36+ fibroblast secretome either induces growth inhibition, in the case of the triple-negative MDA-MB-231 cells or reverses the aberrant polarity of 3D colonies of luminal-A MCF7 cells.
Details of the mechanisms behind the observed growth inhibition and polarity reversion remain an open problem and the subject of our continued research, although the results suggested that these mechanisms differ between cell lines. These observations consistent with the mechanisms of tumor suppression involving the downregulation of pSmad2/3 and YY1, and with reduced secretion of activin A in MDA-MB-231 co-cultured with CD36+ fibroblasts. Conversely, downregulation of CD36 in fibroblast cells resulted in a positive feedback loop that favored overexpression of activin A. Higher circulating activin A concentrations are associated with tumor progression[18]. Tumor inhibition was also partially validated in immunocompromised mice, although larger animal experiments are required for statistical power. Collectively, however, the present data suggest that secreted macromolecules from CD36+ fibroblasts provide a program directive for tumor suppression. These macromolecules may include cytokines, microRNAs, DNAs, signaling peptides, and exosomes, and the ensuing molecular signals are likely to be diverse. We suggest that further studies are warranted to decipher the precise mechanisms behind the crosstalk and communication between these cell types.
Future clinical strategies may include the targeting of activin A pathway, genetic engineering of fibroblasts to overexpress CD36 or identification of biomarkers in the secretome of CD36+. Targeting of the activin A pathway has been considered a strategy for treating breast cancer patients[8] and the activin A inhibitor STM434 has received FDA approval, albeit with designation as an orphan drug. Recent studies also show that inhibition of activin A signaling enhances the therapeutic index of mainstay chemotherapy treatments in lung adenocarcinomas[29]. However, because activin A also regulates muscle mass[30] and modulates the function of immune cells [31], its clinical utility requires additional investigation. Genetically engineered fibroblasts have been examined for its anti-tumor effects have been shown in the liver metastases[32]. But gene therapies must be restricted to overexpression of CD36 in fibroblast cells while avoiding tumor epithelial cells[33]. This is a difficult goal because tumor cells often acquire molecular machinery from fibroblast cells. Finally, identifying biomarkers in the secretome of CD36+ or CD36− fibroblasts may provide a viable pathway for translation in extended studies.
Supplementary Material
Highlights.
CD36 expression in fibroblasts is reduced as a result of exposure to the physiological level of tumor-secreting activin A.
Co-culture of CD36+ fibroblast cells with the triple-negative MDA-MB-231 breast cancer cell lines induces growth inhibition.
Co-culture of CD36+ fibroblast cells with the Luminal A MCF7 breast cancer cell lines induces reversion of aberrant lateral and basal polarities coupled with reduced colony formation.
Acknowledgment
This grant was funded in part by NIH R15CA235430 and gifts to Parvin’s lab. We acknowledge Ms. Michelle Scott of BioRad for improving the quality of pSmad2/3 staining. The authors also thank a fruitful discussion with Dr. Thea Tlsty.
Footnotes
Publisher's Disclaimer: This is a PDF file of an unedited manuscript that has been accepted for publication. As a service to our customers we are providing this early version of the manuscript. The manuscript will undergo copyediting, typesetting, and review of the resulting proof before it is published in its final form. Please note that during the production process errors may be discovered which could affect the content, and all legal disclaimers that apply to the journal pertain.
Declaration of competing interests
Authors declare no conflicts of interest in this article.
Reference
- 1.Kenny PA and Bissell MJ, Tumor reversion: correction of malignant behavior by microenvironmental cues. Int J Cancer, 2003. 107(5): p. 688–95. [DOI] [PMC free article] [PubMed] [Google Scholar]
- 2.DeFilippis RA, et al. , Stress signaling from human mammary epithelial cells contributes to phenotypes of mammographic density. Cancer Res, 2014. 74(18): p. 5032–44. [DOI] [PMC free article] [PubMed] [Google Scholar]
- 3.DeFilipps R, et al. , CD36 repression activates a multicellular stromal program shared by high mammographic density and tumor tissues. Cancer Discovery, 2012. [DOI] [PMC free article] [PubMed] [Google Scholar]
- 4.Taylor C, et al. , Activin a signaling regulates cell invasion and proliferation in esophageal adenocarcinoma. Oncotarget, 2015. 6(33): p. 34228–44. [DOI] [PMC free article] [PubMed] [Google Scholar]
- 5.Luisi S, et al. , Expression and secretion of activin A: possible physiological and clinical implications. Eur J Endocrinol, 2001. 145(3): p. 225–36. [DOI] [PubMed] [Google Scholar]
- 6.Cheng Q and Parvin B, Organoid model of mammographic density displays a higher frequency of aberrant colony formations with radiation exposure. Bioinformatics, 2019. [DOI] [PMC free article] [PubMed] [Google Scholar]
- 7.Fordyce CA, et al. , Cell-extrinsic consequences of epithelial stress: activation of protumorigenic tissue phenotypes. Breast Cancer Res, 2012. 14(6): p. R155. [DOI] [PMC free article] [PubMed] [Google Scholar]
- 8.Bashir M, et al. , Activin-A signaling promotes epithelial-mesenchymal transition, invasion, and metastatic growth of breast cancer. NPJ Breast Cancer, 2015. 1: p. 15007. [DOI] [PMC free article] [PubMed] [Google Scholar]
- 9.Kalluri R, The biology and function of fibroblasts in cancer. Nat Rev Cancer, 2016. 16(9): p. 582–98. [DOI] [PubMed] [Google Scholar]
- 10.Ohlund D, Elyada E, and Tuveson D, Fibroblast heterogeneity in the cancer wound. J Exp Med, 2014. 211(8): p. 1503–23. [DOI] [PMC free article] [PubMed] [Google Scholar]
- 11.Pankova D, et al. , Cancer-Associated Fibroblasts Induce a Collagen Cross-link Switch in Tumor Stroma. Mol Cancer Res, 2016. 14(3): p. 287–95. [DOI] [PMC free article] [PubMed] [Google Scholar]
- 12.Gascard P and Tlsty TD, Carcinoma-associated fibroblasts: orchestrating the composition of malignancy. Genes Dev, 2016. 30(9): p. 1002–19. [DOI] [PMC free article] [PubMed] [Google Scholar]
- 13.Cheng Q, et al. , Stiffness of the microenvironment upregulates ERBB2 expression in 3D cultures of MCF10A within the range of mammographic density. Sci Rep, 2016. 6: p. 28987. [DOI] [PMC free article] [PubMed] [Google Scholar]
- 14.Han J, et al. , Multidimensional profiling of cell surface proteins and nuclear markers. IEEE Transactions on Computational Biology and Bioinformatics, 2010. [DOI] [PubMed] [Google Scholar]
- 15.Lee GY, et al. , Three-dimensional culture models of normal and malignant breast epithelial cells. Nat Methods, 2007. 4(4): p. 359–65. [DOI] [PMC free article] [PubMed] [Google Scholar]
- 16.Lee G, et al. , Three-dimensional culture models of normal and malignant breast epithelial cells. Nature Method, 2007. 4(4): p. 359–365. [DOI] [PMC free article] [PubMed] [Google Scholar]
- 17.Scullen T, et al. , Lenalidomide in combination with an activin A-neutralizing antibody: preclinical rationale for a novel anti-myeloma strategy. Leukemia, 2013. 27(8): p. 1715–21. [DOI] [PubMed] [Google Scholar]
- 18.Hoda MA, et al. , High circulating activin A level is associated with tumor progression and predicts poor prognosis in lung adenocarcinoma. Oncotarget, 2016. 7(12): p. 13388–99. [DOI] [PMC free article] [PubMed] [Google Scholar]
- 19.Reis FM, et al. , Serum and tissue expression of activin a in postmenopausal women with breast cancer. J Clin Endocrinol Metab, 2002. 87(5): p. 2277–82. [DOI] [PubMed] [Google Scholar]
- 20.Han J, et al. , Multiscale iterative voting for differential analysis of stress response for 2D and 3D cell culure models. Microscopy, 2010. 241(3): p. 315–326. [DOI] [PubMed] [Google Scholar]
- 21.Rejniak K, et al. , Linking changes in epithelial morphogenesis to cancer mutations using computational modeling. PLoS Computational Biology, 2010. 6(8). [DOI] [PMC free article] [PubMed] [Google Scholar]
- 22.Monti S, et al. , Consensus clustering: A resampling-based method for class discovery and visualization of gene expression microarray data. Machine Learning, 2003. 52(1–2): p. 91–118. [Google Scholar]
- 23.Jevtic P, et al. , Sizing and shaping the nucleus: mechanisms and significance. Curr Opin Cell Biol, 2014. 28: p. 16–27. [DOI] [PMC free article] [PubMed] [Google Scholar]
- 24.Belair DG, et al. , A Three-Dimensional Organoid Culture Model to Assess the Influence of Chemicals on Morphogenetic Fusion. Toxicol Sci, 2018. 166(2): p. 394–408. [DOI] [PubMed] [Google Scholar]
- 25.Shin SI, et al. , Tumorigenicity of virus-transformed cells in nude mice is correlated specifically with anchorage independent growth in vitro. Proc Natl Acad Sci U S A, 1975. 72(11): p. 4435–9. [DOI] [PMC free article] [PubMed] [Google Scholar]
- 26.Gordon S, et al. , Transcription factor YY1: structure, function, and therapeutic implications in cancer biology. Oncogene, 2006. 25(8): p. 1125–42. [DOI] [PubMed] [Google Scholar]
- 27.Wan M, et al. , Yin Yang 1 plays an essential role in breast cancer and negatively regulates p27. Am J Pathol, 2012. 180(5): p. 2120–33. [DOI] [PMC free article] [PubMed] [Google Scholar]
- 28.Korkut A, et al. , A Pan-Cancer Analysis Reveals High-Frequency Genetic Alterations in Mediators of Signaling by the TGF-beta Superfamily. Cell Syst, 2018. 7(4): p. 422–437 e7. [DOI] [PMC free article] [PubMed] [Google Scholar]
- 29.Marini KD, et al. , Inhibition of activin signaling in lung adenocarcinoma increases the therapeutic index of platinum chemotherapy. Sci Transl Med, 2018. 10(451). [DOI] [PubMed] [Google Scholar]
- 30.Latres E, et al. , Activin A more prominently regulates muscle mass in primates than does GDF8. Nat Commun, 2017. 8: p. 15153. [DOI] [PMC free article] [PubMed] [Google Scholar]
- 31.Hardy CL, Rolland JM, and O’Hehir RE, The immunoregulatory and fibrotic roles of activin A in allergic asthma. Clinical and Experimental Allergy, 2015. 45(10): p. 1510–1522. [DOI] [PMC free article] [PubMed] [Google Scholar]
- 32.Iwazawa T, et al. , Potent antitumor effects of intra-arterial injection of fibroblasts genetically engineered to express IL-12 in liver metastasis model of rat: no additional benefit of using retroviral producer cell. Cancer Gene Ther, 2001. 8(1): p. 17–22. [DOI] [PubMed] [Google Scholar]
- 33.Pascual G, et al. , Targeting metastasis-initiating cells through the fatty acid receptor CD36. Nature, 2017. 541(7635): p. 41–45. [DOI] [PubMed] [Google Scholar]
Associated Data
This section collects any data citations, data availability statements, or supplementary materials included in this article.