

Abstract
Motivation: Long-range RNA-RNA interactions (LRIs) play an important role in viral replication, however, only a few of these interactions are known and only for a small number of viral species. Up to now, it has been impossible to screen a full viral genome for LRIs experimentally or in silico. Most known LRIs are cross-reacting structures (pseudoknots) undetectable by most bioinformatical tools.
Results: We present LRIscan, a tool for the LRI prediction in full viral genomes based on a multiple genome alignment. We confirmed 14 out of 16 experimentally known and evolutionary conserved LRIs in genome alignments of HCV, Tombusviruses, Flaviviruses and HIV-1. We provide several promising new interactions, which include compensatory mutations and are highly conserved in all considered viral sequences. Furthermore, we provide reactivity plots highlighting the hot spots of predicted LRIs.
Availability and Implementation: Source code and binaries of LRIscan freely available for download at http://www.rna.uni-jena.de/en/supplements/lriscan/, implemented in Ruby/C ++ and supported on Linux and Windows.
Contact: manja@uni-jena.de
Supplementary information: Supplementary data are available at Bioinformatics online.
1 Introduction
Long-range RNA-RNA interactions (LRIs) have been marginally reported in various positive strand RNA viruses like Tombusvirus (8 in Carnation Italian Ringspot Virus (CIRV) and Tomato Bushy Stunt Virus (TBSV)), Hepacivirus [5 in Hepatitis C Virus (HCV)], Coronavirus (1 in Transmissible Gastroenteritis Virus (TGEV)), Flavivirus (3 in Dengue Virus (DENV) and West Nile Virus (WNV)), Luteovirus (2 in Barley Yellow Dwarf Virus (BYDV)), Apthovirus (2 in Foot-and-Mouth Disease Virus (FMDV)), Pestivirus (1 in Classical Swine Fever Virus (CSFV)) and Human Immunodeficiency Virus (5 in HIV-1) (Abbink and Berkhout, 2003; Andersen et al., 2004; Beerens and Kjems, 2010; Huthoff and Berkhout, 2001; Ooms et al., 2007). According to their definition, a long-range interaction spans distances between a few hundred and several thousands of nucleotides (>26 kb in TGEV). LRIs are often located in loop regions or internal bulges of local RNA structures (known as cis-acting regulatory elements) and therefore build pseudoknot-like structures. Various programs have been developed for general RNA-RNA interaction prediction, which can be classified into five groups (Kato et al., 2010; Seemann et al., 2011): The first group neglects intramolecular base-pairs, based on the hybrids minimum free energy (MFE). Members of this group are RNAduplex and RNAplex (Lorenz et al., 2011; Tafer and Hofacker, 2008) or RNAhybrid (Rehmsmeier et al., 2004). The second category includes RNAcofold (Bernhart et al., 2006) and PairFold (Andronescu et al., 2005). These tools concatenate two interacting RNA sequences and calculate the MFE of the joint RNA sequences. The third group considers intramolecular and intermolecular RNA-RNA interactions in separated steps, however, only one binding site is predicted. Members of this group are IntaRNA (Busch et al., 2008) or RNAup (Mückstein et al., 2006). The fourth group considers more complex RNA-RNA interactions and allows also more than one binding site. This group includes tools like RactIP (Kato et al., 2010), inteRNA (Alkan et al., 2006) or inRNAs (Salari et al., 2010). The final group contains e.g. PETcofold (Seemann et al., 2011), RNAaliduplex (Lorenz et al., 2011), IRBIS (Pervouchine, 2014), ripalign (Li et al., 2011) and simulfold (Meyer and Miklós, 2007). These tools consider not only a pair of single sequences, like the tools mentioned earlier, they use multiple sequence alignments as input. With this comparative method, it is possible to reduce the false-positive rate by incorporating evolutionary conserved information. All of these programs have different properties, unsuitable for viral genomes. For example, RNAaliduplex is unable to predict pseudoknots and neglects intramolecular RNA foldings. PETcofold considers both, intra- and intermolecular interactions as well as pseudo-knots, but returns per default only a single secondary structure, which makes the detection of multiple functional binding sites impossible. Ripalign’s running time makes the program not applicable to viral sequences and IRBIS is only applicable for predictions of RNA interactions related to RNA splice sites. Up to now, we are aware of a single program that is designed for LRI prediction called CovaRNA (Bindewald and Shapiro, 2013). This tool detects long-range nucleotide covariation from multiple sequence alignments of eukaryotic genomes using an index-based algorithm to find clusters of covarying base-pairs. The extended function CovStat determines the statistical significance of observed covariation cluster. CovaRNA has very strict filter criteria and is therefore very conservative in predicting LRIs. For short genomes, such as viral genomes, this leads to almost no predicted interactions.
Here, we present LRIscan for detecting LRIs in complete viral genome alignments without prior knowledge. Sparse alignment interaction dotplots in combination with RNAalifold (Bernhart et al., 2008) secondary structure foldings based on MFE calculations are used to predict possible LRIs. We add several filter steps and scoring functions to reduce false positive candidates. We confirm 14 out of 16 experimentally known and evolutionary conserved LRIs in HCV, Tombusviruses, Flaviviruses and HIV-1. We predict several promising new interactions, being highly conserved in all considered viral sequences with multiple compensatory mutations and highly conserved in all considered viral sequences.
2 Materials and methods
With LRIscan, we propose for the first time a method for conserved genome-wide LRI prediction in viral genomes based on a multiple sequence alignment. LRIscan is based on the C-library of the ViennaRNA Package 2.0 (Lorenz et al., 2011). The pipeline consists of four basic steps (see workflow Fig. 1):
Fig. 1.

LRIscan workflow. (A) Coverage (dark gray) and complexity (light gray) of the entire alignment. Only regions which pass both, the coverage-threshold (dotted line) and the complexity-threshold (dashed line) are considered for further calculations. (B) Dotplot containing all possible seed interactions (gray and black lines) without gaps and a given minimum interaction length. We calculate only interactions with a distance . To decrease the run time, multiple CPUs are used, calculating only a specific range of the dotplot matrix. All ranges overlap by the minimum seed length. (C) For all seeds, we calculate the MFE of the alignment with RNAalifold. For each seed passing the MFE threshold (black dots in B), we calculate a P-value based on the z-score and the compensatory score as defined in the methods. (D) Seeds are extended toward both sides. An extended z-score/P-value and compensatory score is calculated (Color version of this figure is available at Bioinformatics online.)
Calculate alignment coverage and complexity.
Find LRI seeds with a sparse dotplot method.
Filter LRI candidates based on MFE; calculate z-score/P-value and compensatory score.
Extend seed interaction.
The input of LRIscan is a nucleotide alignment A of length n with m sequences. By Ai, we denote the i-th column of the alignment. Entry is the k-th row of column i. We define the alignment coverage for each column Ai as percentage of nucleotides over all sequences m, without gaps. We introduce the pairing matrix Π with entries if at least t percent (default t = 0.95 for more than 100 sequences, otherwise default t = 0.80) of the corresponding sequences can form a base-pair , otherwise .
2.1 Alignment cleaning, coverage and complexity
To improve the alignment quality for the nucleotide folding, rarely occurring IUPAC nucleotide ambiguities are replaced by the most occurring valid nucleotides of the same alignment column.
We introduce the coverage matrix with entries if the coverage of columns Ai and Aj is greater than the minimum coverage defined by the user (default 0.5), otherwise .
Let δ be the compression function replacing stretches of identical nucleotides by a single nucleotide, e.g. .
The complexity for each alignment column Ai is stored by the complexity matrix C computed as
| (1) |
where s is the minimum seed interaction length (default: 5 bp). With the complexity score, we avoid calculations of regions with gaps or low complexity, such as poly-A/U stretches.
A minimum coverage- and complexity-threshold can be defined by the user (default: coverage = 0.5, complexity = 0.5), with a direct effect on run time.
2.2 LRI seed detection
To find LRIs, we use a dotplot calculation combined with several base-pairing criteria computed by RNAalifold (Bernhart et al., 2008). To efficiently identify interacting seed regions, we initialize the dotplot seed matrix S with . Each entry with minimum distance w between column i and j (default w = 100 nt) is calculated, following the recursion:
| (2) |
will be considered as seed candidate, if (i) and , (ii) the MFE of the seed alignment, calculated by RNAalifold, is smaller as the maximum MFE defined by the user (default ) and (iii) the mean sequence complexity of the seed is greater than the user defined threshold (see black dots in Fig. 1B).
To speed up the seed finding, which needs quadratic time , multiple CPU’s can be used. Each CPU calculates a row of 100 nt (Fig. 1B) overlapping by the minimum seed length s. To save memory, we store only the last valid entry for each seed in a hash.
2.3 LRI seed scoring
For each LRI, we calculate the MFE with RNAalifold. Sequences including only gaps are neglected. Based on the MFE, we calculate a z-score to determine the reliability of each LRI, compared with a randomly sampled alignment. The z-score can be calculated for each predicted LRI as
| (3) |
where X is the MFE of the corresponding interaction, μ the mean MFE and σ the corresponding standard deviation of the z-times randomly swap-shuffled alignments.
Pseudocode 1. Algorithm to find seed interactions in a multiple genome alignment.
S[i,j] = 0
for i in 1…n–w
if PHI(i) > 0
forj in i + w…n
if PHI(j) > 0 and PI(i,j)> 0
S[i,j] = S[i −1,j + 1] + 1
else
ifS[i−1,j + 1] ≥ MIN_SEED_LENGTH
andC(S[i−1,j + 1]) > MIN_COMPLEX
and mfe(S[i−1,j + 1]) < MAX_MFE
returnS[i−1,j + 1]
end
end
end
end
end
For each consensus base-pair of a given seed (of length ), we determine the compensatory score τ to find LRIs with a high amount of compensatory mutations coincident with a high amount of compatible base-pairs. We consider 1 nt changes (e.g. AU to GU), which preserve a base-pairing, as well as 2 nt changes (e.g. AU to GC) as compensatory mutations.
For each consensus base-pair, u is the number of different base-pair types () and h is the number of compatible base-pairs (). We normalize by the maximum number of different base-pairs over all consensus base-pairs () for all sequences k included in the LRI ().
| (4) |
2.4 LRI seed extension
For each LRI seed, we attempt to extend the alignment by 10 bp at the 5′ and 3′ end. For the extended alignment, the MFE is calculated by RNAalifold, with a hard constraint to build given seed base-pairs and a soft constraint which forces an intermolecular interaction of the surrounding base-pairs. For the extended alignment, a separate z-score and P-value calculation is possible (default off). These scores are independent from seed scores.
2.5 Output results
All resulting LRIs are presented in a tab-separated file and additionally as HTML table, linking all corresponding figures to allow the user to browse through the output.
The interacting alignment positions are calculated back to the original position of each virus isolate to easily assess the interactions.
2.6 CovaRNA
To compare LRIscan with CovaRNA, we converted all alignments to the UCSC MAF format and used CovaRNA with a minimum number of two input sequences, reading out of the MAF input file (-s 2).
2.7 Dataset
For HCV, we downloaded 950 genomes from NCBI and the HCV database (http://hcv.lanl.gov/content/sequence/NEWALIGN/align.html) [v. 2008 (Kuiken et al., 2005)]. Sequences which occur in both datasets were considered only once. For Tombusvirus and Flavivirus, we downloaded all genomes listed as complete genomes at NCBI-Genome, resulting in 13 sequences for Tombusvirus and six sequences for Flavivirus (mosquito/vertebrate Flaviviruses).
For the 950 HCV sequences, an alignment was generated with MAFFT –auto, v.6.8 (Katoh et al., 2002) and a phylogenetic tree was built with Geneious, v.6.1 (Kearse et al., 2012) neighbor-joining method Tamura-Nei (Tamura and Nei, 1993). Based on this tree and the annotations from NCBI and the HCV database, the dataset was reduced to two of the longest genomes from each subtype if available, resulting in 106 sequences from 65 subtypes.
For Tombusvirus (13 sequences), Flavivirus (6 sequences) and the reduced HCV set (106 sequences), we generated MAFFT –maxiterate 1000 –localpair alignments as input for LRIscan.
For HIV, we downloaded the hand curated compendium alignment from the HIV sequence database (http://www.hiv.lanl.gov/content/sequence/NEWALIGN/align.html) choosing all subtypes of the HIV-1 alignment of 2014, resulting in an alignment of 200 sequences.
All input alignments can be found at the supplementary page (http://www.rna.uni-jena.de/en/supplements/lriscan/).
2.8 Sensitivity and specificity
To calculate the sensitivity and specificity of LRIscan, we performed dinucleotide shuffling of each sample alignment with multiperm (Anandam et al., 2009) and hid true positive LRIs. We defined all experimentally detected LRIs as true positives as well as the top LRIs of the original alignment. We applied LRIscan with the same parameters as with the original alignments.
3 Results and discussion
To validate our tool, we chose the four positive strand RNA viruses with known LRIs: HCV, Flavivirus, Tombusvirus and HIV. The best studied viruses, with highest number of known LRIs, are HCV and Tombusviruses. In HCV, five LRIs are experimentally verified (Fig. 2B) and another 12 LRIs have been predicted semimanually in Fricke et al. (2015). Currently, eight LRIs in Tombusvirus (Fig. 5B), three LRIs in Flaviviruses (Fig. 3B) and two LRIs in HIV-1 (Fig. 6B) have been experimentally verified. As input for LRIscan, we used alignments of 106 HCV genomes, 13 Tombusvirus genomes, 6 Flavivirus genomes and 200 HIV-1 genomes.
Fig. 2.
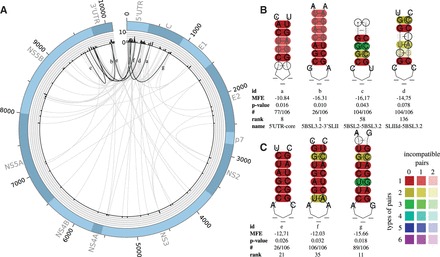
(A) Plot of all predicted LRIs with (74) found in the HCV alignment of 106 sequences. The outer circle represents the genome. The histogram represents the number of LRIs per alignment position. High reactive genome positions can be found in the 5′/3′ UTR and the coding region of the core gene C. The inner circle shows all predicted interactions between all genome positions. Gray—all new LRIs; black—LRIs corresponding to B and C. The plot was created with Circos (Krzywinski et al., 2009). (B) Experimentally verified LRIs, which can be predicted by LRIscan, named SLIIId-5BSL3.2 (Romero-López and Berzal-Herranz, 2009, 2012), 5BSL2-5BSL3.2 (Romero-López et al., 2014; Tuplin et al., 2012), 5BSL3.2-3′SLII (Friebe et al., 2005) and 5′ UTR-core (Beguiristain et al., 2005; Honda et al., 1999). (C) Highly interesting new LRIs predicted by LRIscan. In a former study, we suggested that LRI 2e could be a seed interaction for a HCV genome circularization (Fricke et al., 2015). A complete list including all predicted LRIs can be found at the supplementary page. Colors are used to indicate conserved base-pairs: from red (no variation of a base-pair within the alignment) to purple (all six base-pair types are found); from dark (all sequences contain this base-pair) to light colors (1 or 2 sequences are unable to form this base-pair). Compensatory mutations are marked by a circle around the variable base(s) (Color version of this figure is available at Bioinformatics online.)
Fig. 5.
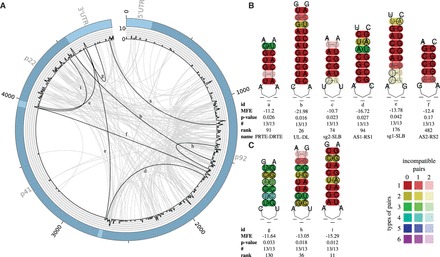
(A) Plot of all predicted LRIs with (213) found in the Tombusvirus alignment of 13 sequences. The outer circle represents the genome. The histogram represents the number of LRIs per alignment position. The inner circle shows all predicted interactions between all genome positions. Gray—all new LRIs; black—LRIs corresponding to B and C. The plot was created with Circos (Krzywinski et al., 2009). (B) Experimentally verified LRIs, which have been also predicted by LRIscan, named SL3-SLB (Fabian and White, 2004, 2006; Nicholson and White, 2008), PRTE-DRTE (Cimino et al., 2011), UL-DL (Wu et al., 2009), sg2-SLB (Fabian and White, 2004), AS1-RS1 (Lin and White, 2004) and AS2-RS2 (Lin and White, 2004). (C) Highly interesting new LRIs predicted by LRIscan. A complete list including all predicted LRIs can be found at the supplementary page (Color version of this figure is available at Bioinformatics online.)
Fig. 3.
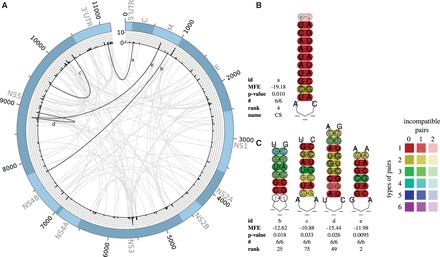
(A) Plot of all predicted LRIs with (113) found in the Flavivirus alignment of six sequences. The outer circle represents the genome. The histogram represents the number of LRIs per alignment position. The inner circle shows all predicted interactions between all genome positions. Gray—all new LRIs; black—LRIs corresponding to B and C. The plot was created with Circos (Krzywinski et al., 2009). (B) Experimentally verified LRI, which can be predicted by LRIscan, named 5′–3′ CS (Friebe and Harris, 2010). (C) Highly interesting new LRIs predicted by LRIscan. A complete list including all predicted LRIs can be found at the supplementary page (Color version of this figure is available at Bioinformatics online.)
Fig. 6.
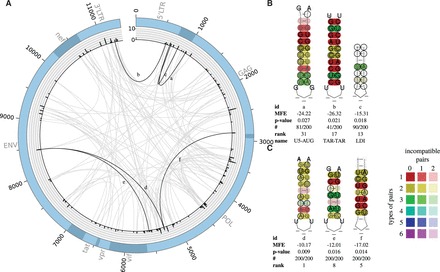
(A) Plot of all predicted LRIs with (115) found in the HIV-1 alignment of 200 sequences. The outer circle represents the genome. The histogram represents the number of LRIs per alignment position. The inner circle shows all predicted interactions between all genome positions. Gray—all new LRIs; black—LRIs corresponding to B and C. The plot was created with Circos (Krzywinski et al., 2009). (B) Experimentally verified LRIs, which can be predicted by LRIscan, named LDI, U5-AUG and TAR-TAR (Abbink and Berkhout, 2003; Andersen et al., 2004; Beerens and Kjems, 2010; Huthoff and Berkhout, 2001). (C) Highly interesting new LRIs predicted by LRIscan. A complete list including all predicted LRIs can be found at the supplementary page (Color version of this figure is available at Bioinformatics online.)
3.1 HCV
To determine the LRIs of the HCV alignment, we used LRIscan with default parameters. Due to general assembly problems of the 5′/3′ untranslated region (UTR) of viral sequences, the HCV alignment consists of only 19 complete sequences. Therefore, we set the minimum number of involved sequences to 17% (18 sequences), resulting in 311 predicted LRIs (74 LRIs with ).
We plotted all detected LRIs of HCV, passing the P-value threshold, to the corresponding genome alignment position (Fig. 2A) to detect regions with a high number of interactions. Interestingly, we detected some highly reactive regions in the 5′ and 3′ UTR but also high reactivity sites in the coding sequence (CDS) of the core and NS5B protein coding region. The UTRs and the core region show the highest amount of possible LRIs, in agreement with the known highly structured regions for all HCV subtypes (Fricke et al., 2015). Consistent with regions of high reactivity (superior interacting regions), it has been shown that the 5′ UTR includes three LRIs (Beguiristain et al., 2005; Filbin and Kieft, 2011; Honda et al., 1999; Romero-López and Berzal-Herranz, 2009, 2012).
For HCV, five LRIs have been experimentally verified: SLII-SLIV (Filbin and Kieft, 2011), SLIIId-5BSL3.2 (Romero-López and Berzal-Herranz, 2009, 2012), 5BSL2-5BSL3.2 (Romero-López et al., 2014; Tuplin et al., 2012), 5BSL3.2-3′SLII (Friebe et al., 2005) and 5′ UTR-core (Beguiristain et al., 2005; Honda et al., 1999). We identified three known LRIs within the first 58 hits ranked by P-value (Fig. 2B). We missed SLII-SLIV because of the unfavorable seed MFE of only −7 kcal/mol (default threshold −10 kcal/mol). The LRI SLIIId-5BSL3.2 did not pass our conservative P-value threshold but is part of the LRIscan output (LRI 2d). Increasing the MFE or P-value threshold would increase the amount of LRIs dramatically, very likely resulting in a high false positive rate (Fig. 4).
Fig. 4.
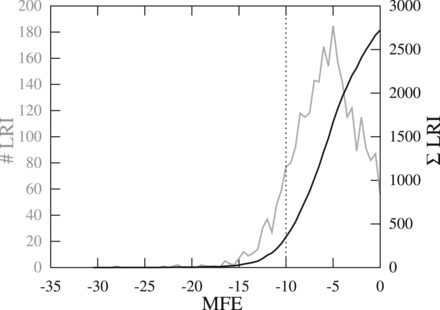
Plot of predicted LRIs in the HCV alignment using different MFE thresholds. The default threshold is −10 kcal/mol resulting in 311 LRIs. With increasing MFE threshold, the number of predicted LRI increases dramatically and therewith the false positive rate. Thus, we decided to choose a conservative MFE threshold. Black—cumulative sum of LRIs per MFE threshold. Gray—sum of LRIs per MFE threshold
We present three highly interesting new LRIs based on P-value, compensatory score and location in the HCV genome (Fig. 2C).
The LRI g of Figure 2 (LRI 2g) is one of the best ranked LRI with a very long seed interaction of 8 nt and three compensatory base-pairs, whereof one base-pair consists of three different types of base-pairs changed in both sites. This LRI is conserved in 89/106 isolates and spans a distance of 754 nt between 5′ UTR and the coding region of the core protein. An experimental verification of the interactions would be highly recommended.
LRI 2f is also highly conserved in all isolates and spans a distance of 9440 nt, connecting the 5′ UTR with the NS5B coding regions [corresponding to LRI 4 in Fricke et al. (2015)]. We identified also the possible genome circularization 2e) between 5′SLII and 3′DLS [see Fricke et al. (2015)].
3.2 Flavivirus
For Flavivirus genomes, we used LRIscan with default values. We predicted 113/157 LRIs with a P-value smaller 0.05. Although Flaviviruses and Hepacivirus are both assigned to the family Flaviviridae, the LRI distribution is very different. In Flaviviruses, we found some clearly separated peaks with an accumulation of LRIs, located at the 3′ end of gene M and in the center of the NS3 and NS5 gene (Fig. 3A). Different from the HCV alignment, we did not find an accumulation of LRIs in the 5′ and 3′ UTR. This effect could be explained by different sequence conservations of the UTRs. In HCV, the pairwise identity of the UTRs is > 95%, whereas the UTR pairwise identity of the Flaviviruses is < 50%. The Flavivirus alignment consists of only six sequences, including only the mosquito/vertebrate Flaviviruses. In Flavivirus, three experimentally verified LRIs are known: 5′–3′-UAR, DAR and 5′–3′-CS (Alvarez et al., 2005; Corver et al., 2003; Friebe and Harris, 2010; Khromykh et al., 2001; You et al., 2001; Zhang et al., 2008). All known interactions are in close proximity and can build a genome circularization, essential for the viral replication. The strongest interaction (CS) was ranked at fourth position (Fig. 3B). It was not possible to identify the 5′–3′-UAR and DAR, because the seed region does not appear to be conserved in the highly variable 5′ UTR.
However, we found several new promising LRIs (Fig. 3C) in the considered Flaviviruses. All depicted interactions are ranked among the first 75 hits and show a high amount of compensatory mutations (up to four types of base-pairs) and being conserved in all sequences.
3.3 Tombusvirus
For the genomes of the Tombusviridae, we used LRIscan with default parameters. We found 529 LRIs (213 LRIs with ). Most of the LRIs in Tombusvirus are located in the p92 region (Fig. 5A). This is in line with the already known interactions, where four out of eight known LRIs start in the p92 region (Cimino et al., 2011; Lin and White, 2004; Wu et al., 2009). But also the intergenic regions between p41/p22 and the 3′ end of the p92 coding regions show high reactivity (Fig. 5A). These areas harbor the known interacting regions of the AS1/RS1, DE/CE, sg1/SLB, AS2/RS2, sg2/SLB (Fabian and White, 2004; Lin and White, 2004; Wu et al., 2009). In contrast, the p41 region contains only a few predicted LRIs. This is due to the very variable sequence of this gene, which encodes the coat protein of the Tombusviruses.
In addition to the mentioned five, three more LRIs are known from experimental data for Tombusviruses: SL3-SLB (Fabian and White, 2004, 2006; Nicholson and White, 2008), PRTE-DRTE (Cimino et al., 2011) and UL-DL (Wu et al., 2009). We detected six of the eight known LRIs (Fig. 5B). AS2-RS2 was ranked very low due to a very short seed of 5 bp, a low P-value and a poly-G stretch. The missing SL3-SLB and DE-CE have been only described for one species and are also manually not discoverable in other species. Both interactions are located in variable regions with low conserved RNA sequences. Here, we present three novel LRIs (Fig. 5C). The LRI 5g with strong compensatory mutations in 6 of 6 base-pairs and up to four types is conserved in all sequences. The LRIs 5h and 5i are conserved in all sequences and have a very high rank as well as compensatory base-pairs with up to three types of base-pairs mutated at both interaction sites. The introduced LRIs are interesting candidates for further wet lab studies.
3.4 HIV
For the HIV alignment, LRIscan was used with default parameters. Only 20% of HIV genomes (40 sequences) contained a complete 5′ and 3′ UTR, therefore we decreased the minimum involved sequences to 20%. With these settings, we identified 314 LRIs (115 LRIs with ).
In HIV, five LRIs are known termed R-GAG, LDI, U5-AUG, TAR-TAR and GAG-U3R (Abbink and Berkhout, 2003; Andersen et al., 2004; Beerens and Kjems, 2010; Huthoff and Berkhout, 2001; Ooms et al., 2007). We identified three of the known interactions: U5-AUG, TAR-TAR and LDI, (Fig. 6B). Due to the conservative MFE threshold, it was not possible to detect the conserved R-GAG interaction. For the GAG-U3R interactions, no conserved seed interaction exists.
We also suggest three novel LRIs (Fig. 6C). These LRIs are conserved in all 200 sequences and have several compensatory mutations. LRI 6d is ranked at position one and has compensatory mutations in 7 out of 9 base-pairs with up to 3 different base-pair types.
3.5 Comparison to CovaRNA
We compare LRIscan with CovaRNA, designed for large eukaryotic genomes. CovaRNA outputs no reliable results for the small viral genomes. For the HCV and for the Tombusvirus alignment, CovaRNA found only one covariation cluster consisting of only two base-pairs. This cluster covers no known LRI. No cluster could be identified for the HIV alignment. The output of the Flavivirus alignment includes five covariation clusters. All clusters contain only two base-pairs and cover none of the known LRIs.
3.6 Sensitivity and specificity
An accurate sensitivity/specificity calculation is difficult due to the limited number of experimentally verified LRIs. We reach a mean sensitivity of 0.83. Most of the non-detected true positive LRIs are specific and experimentally verified only for single isolates. We investigated their conservation throughout the individuals of the alignment manually, resulting in isolate-specific LRIs. The sensitivity is independent on the sequence number and alignment identity (Table 1). The mean specificity of 0.64 depicts a rather high number of false positives. A more stringent P-value would remove a large fraction of false positives, however, results also in a loss of true positive LRIs, see Figures 2, 3, 5, and 6. In practice, known LRIs have very small P-values (high ranks) and/or high compensatory scores and/or can be extended in length. The user selects the LRIs based on all metrics and on the regions of interests. A minimal P-value threshold including almost all experimental verified LRIs can be found at 0.05.
Table 1.
Plot of sensitivity and specificity (P < 0.05) of the four shuffled genome alignments of HCV, Flaviviruses, Tombusviruses and HIV
| #seq | identity % | true positives (TP) | sensitivity | specificity | |
|---|---|---|---|---|---|
| HCV | 106 | 62.2 | 10 | 0.81 | 0.69 |
| Flaviviruses | 6 | 58.3 | 10 | 0.83 | 0.46 |
| Tombusviruses | 13 | 63.5 | 23 | 0.88 | 0.75 |
| HIV | 200 | 80.0 | 16 | 0.81 | 0.69 |
| Mean | 0.83 | 0.64 |
4 Conclusions
The identification of LRIs is experimentally and bioinformatically a challenging task. The huge amount of theoretically possible interactions makes it impossible to verify all possible interactions by wet lab experiments. LRIscan offers the opportunity to predict possible LRIs under certain criteria and reduces dramatically the number of candidates for wet lab studies. As shown in part A of Figures 2, 3, 5, and 6 also well studied viruses provide a huge list of highly ranked LRIs, which could be involved in viral translation and transcription mechanisms. Further wet lab studies, which verify the functionality of these interactions, could improve our understanding of the viral replication.
Supplementary Material
Funding
This work has been partially financed by Carl Zeiss Stiftung.
Conflict of Interest: none declared.
References
- Abbink T.E., Berkhout B. (2003) A novel long distance base-pairing interaction in human immunodeficiency virus type 1 RNA occludes the Gag start codon. J. Biol. Chem., 278, 11601–11611. [DOI] [PubMed] [Google Scholar]
- Alkan C. et al. (2006) RNA-RNA interaction prediction and antisense RNA target search. J. Comput. Biol., 13, 267–282. [DOI] [PubMed] [Google Scholar]
- Alvarez D.E. et al. (2005) Long-range RNA-RNA interactions circularize the dengue virus genome. J. Virol., 79, 6631–6643. [DOI] [PMC free article] [PubMed] [Google Scholar]
- Anandam P. et al. (2009) Multiperm: shuffling multiple sequence alignments while approximately preserving dinucleotide frequencies. Bioinformatics, 25, 668–669. [DOI] [PubMed] [Google Scholar]
- Andersen E.S. et al. (2004) Role of the trans-activation response element in dimerization of HIV-1 RNA. J. Biol. Chem., 279, 22243–22249. [DOI] [PubMed] [Google Scholar]
- Andronescu M. et al. (2005) Secondary structure prediction of interacting RNA molecules. J. Mol. Biol., 345, 987–1001. [DOI] [PubMed] [Google Scholar]
- Beerens N., Kjems J. (2010) Circularization of the HIV-1 genome facilitates strand transfer during reverse transcription. RNA, 16, 1226–1235. [DOI] [PMC free article] [PubMed] [Google Scholar]
- Beguiristain N. et al. (2005) RNase III cleavage demonstrates a long range RNA: RNA duplex element flanking the hepatitis C virus internal ribosome entry site. Nucleic Acids Res., 33, 5250–5261. [DOI] [PMC free article] [PubMed] [Google Scholar]
- Bernhart S.H. et al. (2006) Partition function and base pairing probabilities of RNA heterodimers. Algorithms Mol. Biol., 1, 3.. [DOI] [PMC free article] [PubMed] [Google Scholar]
- Bernhart S.H. et al. (2008) RNAalifold: improved consensus structure prediction for RNA alignments. BMC Bioinformatics, 9, 474.. [DOI] [PMC free article] [PubMed] [Google Scholar]
- Bindewald E., Shapiro B.A. (2013) Computational detection of abundant long-range nucleotide covariation in Drosophila genomes. RNA, 19, 1171–1182. [DOI] [PMC free article] [PubMed] [Google Scholar]
- Busch A. et al. (2008) IntaRNA: efficient prediction of bacterial sRNA targets incorporating target site accessibility and seed regions. Bioinformatics, 24, 2849–2856. [DOI] [PMC free article] [PubMed] [Google Scholar]
- Cimino P.A. et al. (2011) Multifaceted regulation of translational readthrough by RNA replication elements in a tombusvirus. PLoS Pathog., 7, e149. [DOI] [PMC free article] [PubMed] [Google Scholar]
- Corver J. et al. (2003) Fine mapping of a cis-acting sequence element in yellow fever virus RNA that is required for RNA replication and cyclization. J. Virol., 77, 2265–2270. [DOI] [PMC free article] [PubMed] [Google Scholar]
- Fabian M.R., White K.A. (2004) 5′-3′ RNA-RNA interaction facilitates cap- and poly(A) tail-independent translation of tomato bushy stunt virus mRNA: a potential common mechanism for tombusviridae. J. Biol. Chem., 279, 28862–28872. [DOI] [PubMed] [Google Scholar]
- Fabian M.R., White K.A. (2006) Analysis of a 3′-translation enhancer in a tombusvirus: a dynamic model for RNA-RNA interactions of mRNA termini. RNA, 12, 1304–1314. [DOI] [PMC free article] [PubMed] [Google Scholar]
- Filbin M.E., Kieft J.S. (2011) HCV IRES domain IIb affects the configuration of coding RNA in the 40S subunit’s decoding groove. RNA, 17, 1258–1273. [DOI] [PMC free article] [PubMed] [Google Scholar]
- Fricke M. et al. (2015) Conserved RNA secondary structures and long-range interactions in hepatitis C viruses. RNA, 21, 1219–1232. [DOI] [PMC free article] [PubMed] [Google Scholar]
- Friebe P., Harris E. (2010) Interplay of RNA elements in the dengue virus 5′ and 3′ ends required for viral RNA replication. J. Virol., 84, 6103–6118. [DOI] [PMC free article] [PubMed] [Google Scholar]
- Friebe P. et al. (2005) Kissing-loop interaction in the 3′ end of the hepatitis C virus genome essential for RNA replication. J. Virol., 79, 380–392. [DOI] [PMC free article] [PubMed] [Google Scholar]
- Honda M. et al. (1999) A phylogenetically conserved stem-loop structure at the 5′ border of the internal ribosome entry site of hepatitis C virus is required for cap-independent viral translation. J. Virol., 73, 1165–1174. [DOI] [PMC free article] [PubMed] [Google Scholar]
- Huthoff H., Berkhout B. (2001) Mutations in the TAR hairpin affect the equilibrium between alternative conformations of the HIV-1 leader RNA. Nucleic Acids Res., 29, 2594–2600. [DOI] [PMC free article] [PubMed] [Google Scholar]
- Kato Y. et al. (2010) RactIP: fast and accurate prediction of RNA-RNA interaction using integer programming. Bioinformatics, 26, 460–466. [DOI] [PMC free article] [PubMed] [Google Scholar]
- Katoh K. et al. (2002) MAFFT: a novel method for rapid multiple sequence alignment based on fast Fourier transform. Nucleic Acids Res., 30, 3059–3066. [DOI] [PMC free article] [PubMed] [Google Scholar]
- Kearse M. et al. (2012) Geneious Basic: an integrated and extendable desktop software platform for the organization and analysis of sequence data. Bioinformatics, 28, 1647–1649. [DOI] [PMC free article] [PubMed] [Google Scholar]
- Khromykh A.A. et al. (2001) Essential role of cyclization sequences in flavivirus RNA replication. J. Virol., 75, 6719–6728. [DOI] [PMC free article] [PubMed] [Google Scholar]
- Krzywinski M. et al. (2009) Circos: an information aesthetic for comparative genomics. Genome Res., 19, 1639–1645. [DOI] [PMC free article] [PubMed] [Google Scholar]
- Kuiken C. et al. (2005) The Los Alamos hepatitis C sequence database. Bioinformatics, 21, 379–384. [DOI] [PubMed] [Google Scholar]
- Li Y.P. et al. (2011) MicroRNA-122 antagonism against hepatitis C virus genotypes 1-6 and reduced efficacy by host RNA insertion or mutations in the HCV 5′ UTR. Proc. Natl. Acad. Sci. USA, 108, 4991–4996. [DOI] [PMC free article] [PubMed] [Google Scholar]
- Lin H.X., White K.A. (2004) A complex network of RNA-RNA interactions controls subgenomic mRNA transcription in a tombusvirus. EMBO J., 23, 3365–3374. [DOI] [PMC free article] [PubMed] [Google Scholar]
- Lorenz R. et al. (2011) ViennaRNA Package 2.0. Algorithms Mol. Biol., 6, 26.. [DOI] [PMC free article] [PubMed] [Google Scholar]
- Meyer I.M., Miklós I. (2007) SimulFold: simultaneously inferring RNA structures including pseudoknots, alignments, and trees using a Bayesian MCMC framework. PLoS Comput. Biol., 3, e1002423. [DOI] [PMC free article] [PubMed] [Google Scholar]
- Mückstein U. et al. (2006) Thermodynamics of RNA-RNA binding. Bioinformatics, 22, 1177–1182. [DOI] [PubMed] [Google Scholar]
- Nicholson B.L., White K.A. (2008) Context-influenced cap-independent translation of Tombusvirus mRNAs in vitro. Virology, 380, 203–212. [DOI] [PubMed] [Google Scholar]
- Ooms M. et al. (2007) Circularization of the HIV-1 RNA genome. Nucleic Acids Res., 35, 5253–5261. [DOI] [PMC free article] [PubMed] [Google Scholar]
- Pervouchine D.D. (2014) IRBIS: a systematic search for conserved complementarity. RNA, 20, 1519–1531. [DOI] [PMC free article] [PubMed] [Google Scholar]
- Rehmsmeier M. et al. (2004) Fast and effective prediction of microRNA/target duplexes. RNA, 10, 1507–1517. [DOI] [PMC free article] [PubMed] [Google Scholar]
- Romero-López C., Berzal-Herranz A. (2009) A long-range RNA-RNA interaction between the 5′ and 3′ ends of the HCV genome. RNA, 15, 1740–1752. [DOI] [PMC free article] [PubMed] [Google Scholar]
- Romero-López C., Berzal-Herranz A. (2012) The functional RNA domain 5BSL3.2 within the NS5B coding sequence influences hepatitis C virus IRES-mediated translation. Cell. Mol. Life Sci., 69, 103–113. [DOI] [PMC free article] [PubMed] [Google Scholar]
- Romero-López C. et al. (2014) End-to-end crosstalk within the hepatitis C virus genome mediates the conformational switch of the 3′X-tail region. Nucleic Acids Res., 42, 567–582. [DOI] [PMC free article] [PubMed] [Google Scholar]
- Salari R. et al. (2010) Time and Space Efficient RNA-RNA Interaction Prediction via Sparse Folding, Research in Computational Molecular Biology: 14th Annual International Conference, RECOMB 2010, In: Bonnie,B. (ed.), Lisbon, Portugal, April 25–28, 2010. Proceedings, Berlin, Heidelberg: Springer Berlin Heidelberg. 473–490. doi="10.1007/978-3-642-12683-3_31. 10.1007/978-3-642-12683-3_31. [DOI]
- Seemann S.E. et al. (2011) PETcofold: predicting conserved interactions and structures of two multiple alignments of RNA sequences. Bioinformatics, 27, 211–219. [DOI] [PMC free article] [PubMed] [Google Scholar]
- Tafer H., Hofacker I.L. (2008) RNAplex: a fast tool for RNA-RNA interaction search. Bioinformatics, 24, 2657–2663. [DOI] [PubMed] [Google Scholar]
- Tamura K., Nei M. (1993) Estimation of the number of nucleotide substitutions in the control region of mitochondrial DNA in humans and chimpanzees. Mol. Biol. Evol., 10, 512–526. [DOI] [PubMed] [Google Scholar]
- Tuplin A. et al. (2012) A twist in the tail: SHAPE mapping of long-range interactions and structural rearrangements of RNA elements involved in HCV replication. Nucleic Acids Res., 40, 6908–6921. [DOI] [PMC free article] [PubMed] [Google Scholar]
- Wu B. et al. (2009) A discontinuous RNA platform mediates RNA virus replication: building an integrated model for RNA-based regulation of viral processes. PLoS Pathog., 5, [DOI] [PMC free article] [PubMed] [Google Scholar]
- You S. et al. (2001) In vitro RNA synthesis from exogenous dengue viral RNA templates requires long range interactions between 5′- and 3′-terminal regions that influence RNA structure. J. Biol. Chem., 276, 15581–15591. [DOI] [PubMed] [Google Scholar]
- Zhang B. et al. (2008) Co-selection of West Nile virus nucleotides that confer resistance to an antisense oligomer while maintaining long-distance RNA/RNA base pairings. Virology, 382, 98–106. [DOI] [PMC free article] [PubMed] [Google Scholar]
Associated Data
This section collects any data citations, data availability statements, or supplementary materials included in this article.