

Abstract
Glioblastoma (GBM), the most aggressive form of brain cancer, is characterized by a high level of molecular heterogeneity, and infiltration by various immune and stromal cell populations. Important advances have been made in deciphering the microenvironment of GBMs, but its association with existing molecular subtypes and its potential prognostic role remain elusive. We have investigated the abundance of infiltrating immune and stromal cells in silico, from gene expression profiles. Two cohorts, including in‐house normal brain and glioma samples (n = 70) and a large sample set from TCGA (n = 393), were combined into a single exploratory dataset. A third independent cohort (n = 124) was used for validation. Tumors were clustered based on their microenvironment infiltration profiles, and associations with known GBM molecular subtypes and patient outcome were tested a posteriori in a multivariable setting. We identified a subset of GBM samples with significantly higher abundances of most immune and stromal cell populations. This subset showed increased expression of both immune suppressor and immune effector genes compared to other GBMs and was enriched for the mesenchymal molecular subtype. Survival analyses suggested that tumor microenvironment infiltration pattern was an independent prognostic factor for GBM patients. Among all, patients with the mesenchymal subtype with low immune and stromal infiltration had the poorest survival. By combining molecular subtyping with gene expression measures of tumor infiltration, the present work contributes with improving prognostic models in GBM.
Keywords: glioblastoma, infiltration, microenvironment, stratification, survival
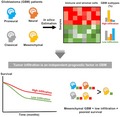
This work combined molecular subtyping of glioblastomas (GBMs) with gene expression measures of tumor infiltration and identified a subset of GBMs with high abundances of most immune and stromal cell populations. Survival analyses suggested that tumor microenvironment infiltration was an independent prognostic factor for GBM patients. Among all, patients with the mesenchymal subtype and low infiltration had the poorest survival.
Abbreviations
- AII
grade II astrocytoma
- FDR
false discovery rate
- GBM
glioblastoma
- G‐CIMP
glioma CpG island methylator phenotype
- GSVA
gene set variation analysis
- HR
hazard ratio
- IDH
isocitrate dehydrogenase
- OII
grade II oligodendroglioma
- pGBM
primary glioblastoma
- sGBM
secondary glioblastoma
- TCGA
The cancer genome atlas
- WHO
World health organization
1. Introduction
Gliomas account for 25% of all primary central nervous system tumors in adults (Ostrom et al., 2016). The World Health Organization (WHO) grading system classifies gliomas into grades I–IV based on histopathological features (Louis et al., 2016). Glioblastomas (GBMs, grade IV gliomas) are the most frequent and aggressive brain tumors in adults. Lower‐grade non‐GBM tumors include grade II astrocytomas (AII) and oligodendrogliomas (OII). The least favorable prognosis is associated with GBM, which has a 5‐year survival rate around 5% (Ostrom et al., 2016). While histologic classification has been a valuable tool in clinical practice, significant differences in survival among patients of the same subtype have been observed, indicating underlying clinically significant molecular heterogeneity that has not yet been detected in all its ramifications.
Advances in the understanding of glioma biology have underscored the importance of various genetic and epigenetic aberrations (Cairncross et al., 1998; Gupta et al., 2011; Smith et al., 2000; Weller et al., 2010). Among them, IDH1/2 hotspot mutations have been observed in the vast majority of grade II/III gliomas. In high‐grade gliomas, IDH mutations stratify GBM into (a) primary GBMs (pGBM), IDH wild‐type tumors, which do not show clinical or histopathological evidence of stemming from a precursor lesion, and (b) secondary GBMs (sGBMs), which develops from lower‐grade tumors and exhibit IDH mutations (Gupta et al., 2011; Louis et al., 2016). At the transcriptome level, large efforts to establish homogenous molecular subtypes have led to the identification of four major GBM subtypes: classical, mesenchymal, proneural, and neural, which have been associated with specific genomic aberrations (Li et al., 2009; Phillips et al., 2006; Riddick and Fine, 2011; Verhaak et al., 2010).
GBMs are also characterized by immune and stromal cell infiltration in their surrounding tumor microenvironment (Chen and Hambardzumyan, 2018; Darmanis et al., 2017; Domingues et al., 2016; Tomaszewski et al., 2019; Wang et al., 2017). Macrophages/microglia, myeloid‐derived suppressor cells, and leukocytes, mostly T‐helper cells, Tregs, and NK cells, have been consistently reported in the stroma of GBMs and associated with the main molecular subtypes (Doucette et al., 2013; Gieryng et al., 2017; Mirzaei et al., 2017). Previous studies have focused on the prognostic value of various tumor‐infiltrating cell populations in GBMs (Becht et al., 2016a; Klopfenstein et al., 2019). As an example, the association of T‐cell infiltration with patient outcome has been investigated by several research groups (Han et al., 2014; Kmiecik et al., 2013; Mostafa et al., 2016; Preusser et al., 2015) and has reached inconsistent results. This underscores the complexity of the tumor microenvironment and therefore the need for further characterization. Better knowledge could improve prognostication and support qualification of GBM patients for therapies targeting the tumor microenvironment (Jackson et al., 2014; Kamran et al., 2017; Schaller and Sampson, 2017).
In this study, we used high‐resolution transcriptomics to analyze gene expression in glioma samples. Three independent datasets were included in the study; a series of in‐house generated expression profiles from grade II gliomas, GBMs, and normal brain samples (n = 70), and two publicly available GBM datasets from TCGA (n = 393; Brennan et al ., 2013) and GEO (n = 124 – http://www.ncbi.nlm.nih.gov/geo/query/acc.cgi?acc=GSE68848; Madhavan et al., 2009). Particular emphasis was given to the immune and stromal characterization of the GBM microenvironment, and association with known molecular subtypes and patient outcome.
2. Materials and methods
2.1. Patients and tumor samples
The study included 67 glioma samples, which were grouped according to the 2016 revision of the WHO classification of tumors of the central nervous system (Louis et al., 2016). It comprised 36 pGBMs, 5 sGBMs, 18 AIIs, and 8 OIIs from glioma patients who underwent surgery at the Department of Neurosurgery (Oslo University Hospital) between June 2006 and April 2010. Patients were included following written informed consent. Permission to include deceased patients was obtained from The National Health Authorities. The study was approved by the Regional Ethics Committee (S‐06046) as well as the Institutional Study Board. All experiments were performed in accordance with the standards set by the Declaration of Helsinki. Histological diagnoses were reviewed by an expert neuropathologist (author D.S.). Four commercially available normal brain total RNA samples were also included (BioChain, Newark, CA, USA), B209031, pool of five male donors; B306103, one male donor; Takara Bio USA (Mountain View, CA, USA), 1004311A, one male donor; Invitrogen (Waltham, MA, USA), First Choice Human Brain – 105P055201A, pool of 23 donors). The preliminary results showed that one of the normal brain samples, with material from just one donor (BioChain B306103), did not cluster with the other normal samples. As this outlier sample came from one person only, whereas the other three normal samples represented a total of 29 donors, the outlier was excluded from further analyses. The clinical characteristics of the patients and samples are summarized in Table S1.
IDH1/IDH2 mutation analysis had previously been performed for the majority of samples (Håvik et al., 2014). All IDH mutated samples (n = 29) included in our series had mutation in the IDH1 gene, not in IDH2. From three samples not previously analyzed, DNA was extracted from the TRIzol left over from the RNA extraction using a standard protocol (Invitrogen). Sanger sequencing of IDH1 and IDH2 mutations was performed as described in the previous study from Håvik et al. (2014). Combined loss of 1p and 19q was examined for by loss of heterozygosity–polymerase chain reaction (LOH‐PCR) or multiplex ligation‐dependent probe amplification (MLPA) as previously described (Håvik et al., 2014).
2.2. Microarray gene expression analysis
Tumor tissue samples were collected on RNAlater (Qiagen, Hilden, Germany), and total RNA was extracted using a standard TRIzol protocol. Quantity and quality of RNA was assessed by NanoDrop ND‐1000 Spectrophotometer (Thermo Fisher Scientific, Waltham, MA, USA) and Agilent BioAnalyzer 2100 (Agilent Technologies, Santa Clara, CA, USA), respectively. All samples were analyzed for global gene expression using Affymetrix Human Exon 1.0. ST Array (Thermo Fisher Scientific). Total RNA (250 ng) was used as input and processed according to the manufacturer's instructions, using the Ambion WT Expression Kit protocol (Invitrogen), Affymetrix GeneChip WT terminal labeling, and Hybridization User Manual (Affymetrix, Santa Clara, CA, USA).
2.3. Publicly available datasets
Normalized gene expression profiles from Affymetrix H133A arrays and matching clinical information were downloaded for n = 441 glioblastoma samples from TCGA using the TCGA2STAT r package version 1.2 (Brennan et al., 2013; Wan et al., 2015). CpG island methylator phenotype (G‐CIMP) annotations were provided for each tumor. Since G‐CIMP, promoted by mutations in IDH (Turcan et al., 2012), is associated with better outcome and younger age at diagnosis, these tumors were discarded from the dataset, as previously suggested in Klopfenstein et al. (2019). It resulted in n = 393 pGBM expression profiles. Survival data were available for all except one patient (n = 392), and the following treatment groups were considered for the analyses: (a) temozolomide (TMZ) chemoradiation followed by TMZ (n = 147), (b) radiation and TMZ (n = 69), or (c) radiotherapy alone (n = 118). Data from the Rembrandt study were included for validation purposes (Madhavan et al., 2009, GEO accession number http://www.ncbi.nlm.nih.gov/geo/query/acc.cgi?acc=GSE68848). In this dataset, gene expression profiles were generated using the H133Plus2 Affymetrix platform. The 124 grade IV GBM samples were kept for the analysis, and matching clinical data were downloaded from Klopfenstein et al. (2019).
2.4. Statistical analyses and graphical representations
Statistical analyses were conducted with r version 3.2.2 and default packages from r environment. Differential analyses of expression and infiltration profiles were performed using the moderated t‐test approach implemented in the limma r package, version 3.30.13 (Ritchie et al., 2015). All plots were created using the ggplot2 r package, version 3.0.0 (Wickham, 2016).
2.5. Preprocessing of the in‐house generated data
For each sample, a CEL file storing intensity measures was generated by the affymetrix genechip command console software (version 1.0). These files were further background corrected, quantile normalized, and summarized at the gene level via median polish, by the robust multi‐array average (RMA) approach using the r package oligo, version 1.34.2 (Carvalho and Irizarry, 2010). Affymetrix identifiers were converted to gene symbols from NetAffx annotation files provided by IPA (release 36).
2.6. Batch correction
The batch effect between the three datasets was corrected using ComBat, an empirical Bayes‐based method implemented in the SVA package (Leek et al., 2012). The in‐house generated data and the TCGA expression profiles were merged to constitute the exploratory dataset (n = 463, among which 429 were pGBM). The third cohort was used for validation (n = 124). The analyses were performed on the set of 13 265 genes common to the three platforms.
2.7. In silico estimation of immune and stromal cell infiltration
Tumor infiltration by immune and other stromal cells was estimated from expression data using the MCPcounter approach, implemented in the MCPcounter r package (version 1.1.0) (Becht and de Reynies, 2016). MCPcounter provides abundance estimates for eight immune cell populations, namely CD3+ T cells, CD8+ T cells, natural killer (NK) cells, B lymphocytes, cells originating from monocytes, myeloid dendritic cells, neutrophils, and cytotoxic lymphocytes (including both CD8+ T cells and cytotoxic innate lymphoid NK cells). The abundance of two nonimmune stromal cell populations, that is, fibroblastic and endothelial cells, is also computed by the method. Primary GBMs were clustered based on MCPcounter abundance estimates, using a partitioning around medoids algorithm (PAM), available in the cluster r package version 2.0.3 (Maechler et al., 2017). The silhouette values were computed for every sample and averaged over all data points to determine the optimal number of pGBM infiltration clusters.
2.8. Immune and molecular characterization of the pGBM infiltration clusters
A list of 63 key immune effector and suppressive genes, compiled by Doucette et al. (2013), was investigated for differential expression in the pGBM infiltration clusters and against the normal samples (see Tables S2 and S3). An FDR < 0.05 was used as the threshold for statistical significance in the various contrasts. Five representative immune gene sets, described in Thorsson et al. (2018), were downloaded from the paper supplementary materials. Sample‐based enrichment scores were computed using Gene Set Variation Analysis (GSVA) as implemented in the GSVA r package, for each of the five gene sets (Hänzelmann et al., 2013). The clusters were also tested for association with the Verhaak's molecular subtypes (Verhaak et al., 2010). The four gene sets, that is, classical, mesenchymal, neural, and proneural, were downloaded from MSigDB (Subramanian et al., 2005). Primary GBM samples of the exploratory and validation cohorts were assigned a Verhaak's molecular subtype based on their highest enrichment score.
2.9. Survival analyses
Survival analyses were conducted with Cox's proportional hazards regression implemented in the r survival package (version 2.40‐1), with calculation of P‐values from Wald's tests for predictive potential (Therneau, 2015). Hazard ratios (HR) and 95% confidence intervals were derived from the model. Kaplan–Meier method was used to estimate the survival curves. Overall survival was censored at 24 months.
2.10. Validation
A random forest approach was implemented in order to assess the reproducibility of the clusters identified from infiltration profiles in the validation cohort, and to confirm their prognostic value. The model was trained on the MCPcounter estimates of the pGBM exploratory samples and applied to classify patients of the validation cohort. All figures included in the main paper refer to the exploratory data, and results from the validation cohort are presented in the supplementary material.
3. Results
3.1. Analyses of immune and stromal cell infiltration reveal distinct microenvironments in primary GBMs
In silico analyses of individual immune and stromal cell populations in the exploratory dataset underlined a higher variability in the composition of the microenvironment of pGBMs compared to AII and other subtypes (Fig. 1A). Using unsupervised partitioning, we conducted further investigations into the infiltration profiles of pGBMs and identified two distinct infiltration clusters of samples – denoted pGBM‐I1 (n = 192) and pGBM‐I2 (n = 237) (Fig. S1). Tumors of the pGBM‐I1 cluster showed a consistent high infiltration in fibroblasts, and moderate‐to‐high infiltration in the eight immune cell populations and endothelial cells (Fig. S2A,B). In comparison, pGBM‐I2 samples had overall lower infiltration in all immune and stromal cell populations (Fig. S2A,C). Further differential analyses established that the pGBM‐I1 cluster had significant increased infiltration in nine out of ten cell populations (B lineage, CD8 T cells, endothelial cells, fibroblasts, monocytic lineage and myeloid dendritic cells, neutrophils, NK cells, and T cells; Fig. 1B). CD45, a pan‐hematopoietic marker, was also considered as an alternative strategy to measure the general immune infiltration in GBMs. Its expression was highly associated with abundance of cells of monocytic origin. However, CD45 expression poorly correlated with other immune cell populations such as NK cells or T cells (data not shown), highlighting the relevance of investigating immune cell populations individually. In the validation cohort, the random forest model trained on these nine cell populations classified the samples into pGBM‐I1 and pGBM‐I2, with significant differences in abundances between the two clusters for the same cell populations, except NK cells (Fig. S3).
Fig. 1.
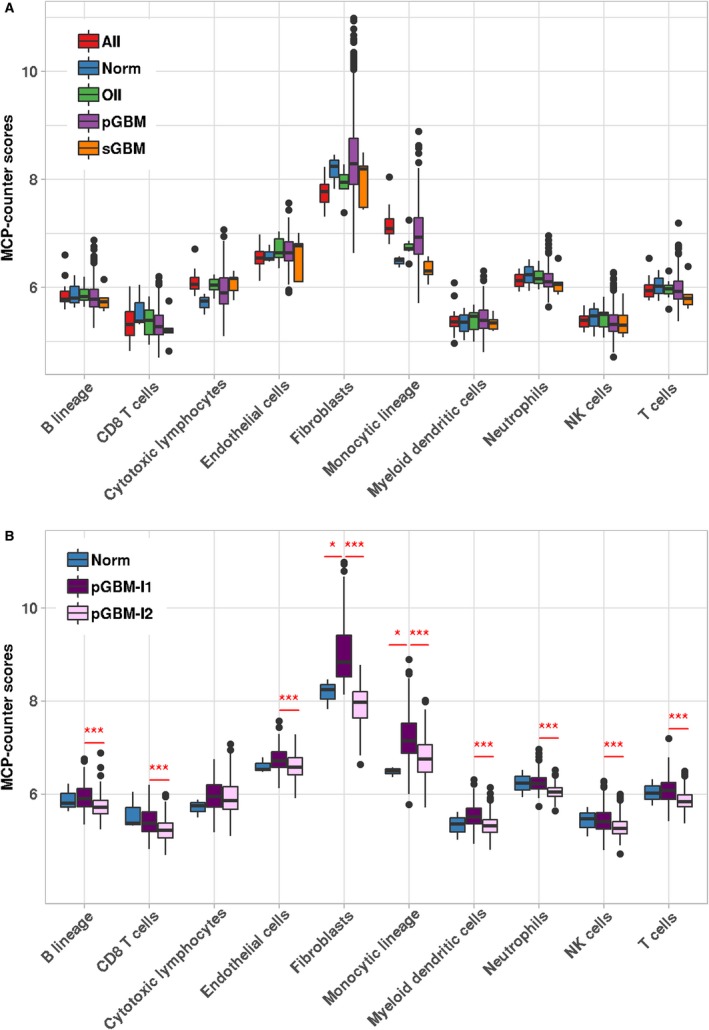
Identification of two pGBM clusters with distinct microenvironments. (A) Boxplots showing the MCPcounter abundance estimates of eight immune and two stromal cell populations among glioma subtypes (n = 460) and normal samples (n = 3) of the exploratory cohort. (B) Comparison of the MCPcounter abundance estimates in pGBM‐I1 (n = 192), pGBM‐I2 (n = 237), and normal samples (n = 3). For each comparison, the significance level derived from limma (FDR criterion, Benjamini–Hochberg procedure) is indicated: (*) FDR < 0.05, (**) FDR < 0.01, (***) FDR < 0.001.
Analyzing pGBM‐I1 vs. pGBM‐I2 samples for differential gene expression in the exploratory dataset revealed that > 80% of the selected immune effector and suppressor genes were significantly upregulated in pGBM‐I1 (Tables S2 and S3). When tested against normal samples, pGBM‐I1 had significantly increased expression in about 35% of the suppressor genes and 32% of the effectors. The percentage of upregulated immune effectors and suppressors in pGBM‐I2 samples was comparable to AII and lower than in pGBM‐I1 (Fig. 2A). To further characterize the immune microenvironment according to the six pan‐cancer immune subtypes defined by Thorsson et al. (2018), we derived sample‐based enrichment scores from the five representative gene sets described in the paper: (a) activation of macrophages/monocytes, (b) overall lymphocyte infiltration, (c) TGF‐β response, (d) IFN‐γ response, and (e) wound healing (Fig. 2B). Enrichment scores were significantly higher in pGBM‐I1 for the lymphocyte, the macrophage, and the TGF‐β response signatures and to a lesser extent, significantly lower for the wound healing signature (FDR < 0.05).
Fig. 2.
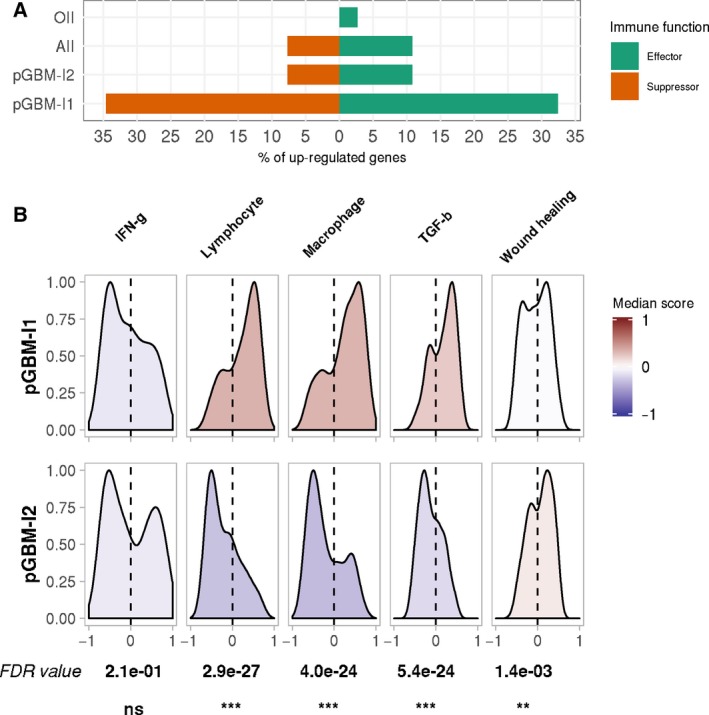
Immune characterization of the pGBM infiltration clusters. (A) Differential analyses were carried out in each glioma subtypes vs. normal samples in the exploratory dataset, using the moderated t‐test approach implemented in limma. The percentage of significantly upregulated genes (FDR < 0.05) among a list of 26 immune suppressors (red) and 37 immune effectors (green) is displayed for each glioma subtype, including the two pGBM infiltration clusters. None of the 63 genes were significantly differentially expressed in sGBM. (B) Distribution of Thorsson et al. signature enrichment scores among the two infiltration clusters in the exploratory dataset. The color scale indicates the median enrichment score for each gene set, with deeper red colors denoting a positive enrichment score and deeper blue colors, a negative enrichment. The gene sets were tested for differential enrichment in the two clusters. FDR values (Benjamini–Hochberg procedure) and significance levels are indicated for each comparison: (ns) not significant, (*) FDR < 0.05, (**) FDR < 0.01, (***) FDR < 0.001.
3.2. Significant over‐representation of mesenchymal tumors in pGBM‐I1
The pGBM samples were classified according to Verhaak's molecular subtypes. The exploratory cohort included a majority of mesenchymal tumors (32%), similar rates of classical and proneural (26% and 25%) and fewer neural tumors (17%), as reported in TCGA data by Verhaak et al. (2010). The mesenchymal tumors displayed a significantly lower expression of NF1 (Fig. S4), in line with the frequent number of mutations in the NF1 tumor suppressor gene reported in the mesenchymal subtype (Verhaak et al., 2010). High expressions of CHI3L1, CD44, SERPINE1, and CTGF, typical of mesenchymal tumors, were also observed (Parker et al., 2016). Compared to other pGBM molecular subtypes, mesenchymal samples had increased infiltration in monocytic lineage cells (FDR = 0.0060) and a tendency toward higher infiltration in fibroblasts (FDR = 0.12) (Fig. S5).
We found a significant association between the molecular classification and the pGBM infiltration clusters, with pGBM‐I1 being enriched in tumors of the mesenchymal subtype both in the exploratory (Fisher's exact test P‐value < 2e‐16, Fig. 3) and in the validation datasets (Fisher's exact test P‐value = 3.0e‐05, Fig. S6). The infiltration patterns observed in pGBM‐I1 and pGBM‐I2 were similar across molecular subtypes; there was a trend toward low infiltration in most cell populations in pGBM‐I2, while tumors of pGBM‐I1 had high expression in fibroblast markers and moderate‐to‐high abundance of immune cell populations and endothelial cells (Figs S7–S10).
Fig. 3.
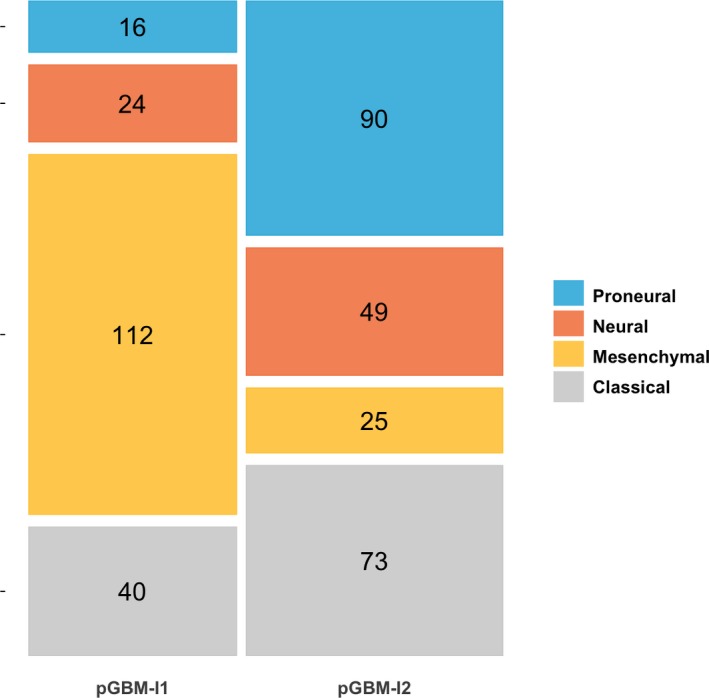
Molecular characterization of the pGBM infiltration clusters. Mosaic plot displaying the proportion of Verhaak's molecular subtypes among the pGBM‐I1 (n = 192) and pGBM‐I2 (n = 237) clusters, in the exploratory cohort. A Fisher's exact test (P‐value < 1e‐16) demonstrated a significant association between the molecular subtypes and the two infiltration clusters.
3.3. Immune and stromal infiltration identifies patients with an inferior prognosis
We tested the overall significance of several univariable Cox's regression models to predict patient survival in the exploratory cohort. The regression model including the Verhaak's molecular classification alone as a factor did not reach the significance level (Wald's test P‐value = 0.086, Fig. 4A, Table S4). In comparison, the univariable model accounting for the infiltration clusters was overall significant, with pGBM‐I2 being associated with worse prognosis compared to pGBM‐I1 [Wald's test P‐value = 0.032, HR = 1.3 (1.0–1.6), Fig. 4B]. We found no association between the pGBM infiltration clusters and the type of treatment received after surgery (Fisher's exact test P‐value = 0.36). A multivariable Cox's regression model, including the molecular subtypes and the infiltration cluster annotation as covariates, was fitted to the data. Comparing the uni‐ and multivariable models using deviance and chi‐square statistic revealed that adding the infiltration clusters significantly improved our ability to predict survival compared to the molecular subtypes alone (P‐value = 0.0034). We also tested whether we should account for potential differences in survival in our own series and the TCGA series, but no significant effect was observed. The molecular subtypes and infiltration clusters had independent prognostic values in the multivariable model (Table S4). When controlling for the molecular subtype, pGBM‐I2 was significantly associated with inferior survival compared to pGBM‐I1 [HR = 1.5 (1.1–2.0), P‐value = 0.0037]. Mesenchymal tumors showed significantly worse outcome among pGBM patients when adjusting for immune and stromal infiltration [HR = 1.7 (1.2–2.4), P‐value = 0.0016]. Patient with mesenchymal pGBM‐I2 tumors had the worst prognosis, with a median survival < 10 months and an HR = 3.0 (1.7–5.4) (P‐value = 2.5e‐4) when compared to classical pGBM‐I1, which had the best outcome (median survival = 18 months).
Fig. 4.
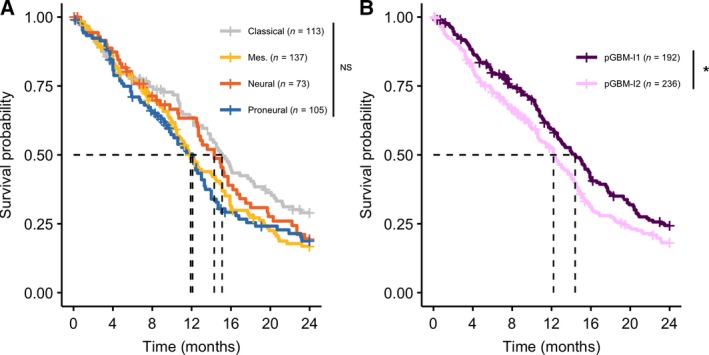
Kaplan–Meier curves modeling the effect of molecular subtypes and tumor infiltration on overall survival in pGBM patients. (A) Overall survival among pGBM patients, stratified by molecular subtypes in the exploratory cohort. The univariable Cox's regression model was overall not significant (P‐value = 0.086). Multivariable analyses demonstrated a significant worse prognosis for patients with the mesenchymal subtype when adjusting for the pGBM infiltration cluster [HR = 1.7 (1.2–2.4), P‐value = 0.0016, when compared to patients with the classical subtype]. Dashed lines are drawn at the median survival time for patient of the classical (15.1 months), mesenchymal (11.9 months), neural (14.3 months), and proneural (12.1 months) subtypes. (B) Overall survival among patients of the exploratory cohort, stratified according to the pGBM‐I1 (violet, n = 192) and pGBM‐I2 (pink, n = 236) clusters. Patients of the pGBM‐I2 subtype showed a significantly worse prognosis compared to pGBM‐I1, both in the univariable Cox's regression model [P‐value = 0.032 and HR = 1.3 (1.0–1.6)] and in the multivariable model including the tumor molecular subtype and infiltration cluster annotation as covariates [P‐value = 0.0037 and HR = 1.5 (1.1–2.0)]. Dashed lines are drawn at the median survival time for pGBM‐I1 (14.4 months) and pGBM‐I2 patients (12.2 months). P‐values are derived from Cox's regression models and hazard ratio (HR) are provided together with their 95% confidence interval. The significance levels of the univariable models are displayed on the figures. Abbreviations: (NS) not significant, (*) P‐value < 0.05.
In the validation cohort, the proneural subtype was significantly associated with a better outcome [P‐value = 0.018, HR = 0.42 (0.21–0.86), Fig. S11 and Table S5]. The survival between pGBM‐I1 and pGBM‐I2 patients was not significantly different in the univariable model [P‐value = 0.47 and HR = 1.2 (0.75–1.9), Fig. S12 and Table S5]. Including the immune and stromal infiltration as a covariate, in addition to the molecular subtype, significantly improved the fit of the Cox's regression. We confirmed the independent prognostic value of the molecular subtype and infiltration cluster in the multivariable model; patients with pGBM‐I2 tumors were found to have a significantly worse outcome compared to pGBM‐I1 [P‐value = 0.048, HR = 1.7 (1.0–2.8), Table S5]. Mesenchymal pGBM‐I2 had again the shortest median survival (11 months).
Combining survival data from the exploratory and validation cohorts strengthened our finding and confirmed the independent prognostic value of the infiltration clusters (Table S6). In stratified analyses, the mesenchymal subtype showed consistently significantly worse outcome among patients with high (pGBM‐I1) or low (pGBM‐I2) tumor infiltration (Table S7 and Fig. S13).
4. Discussion
Gene expression profiling was used to investigate the abundance of tumor‐infiltrating immune and stromal cells in gliomas. Our study revealed a substantial variability in the composition of the microenvironment of pGBMs compared to low‐grade gliomas, in line with the findings of Doucette et al. (2013) and Wang et al. (2017). Two clusters of pGBM samples, called pGBM‐I1 and pGBM‐I2 and displaying distinct tumor microenvironments, were identified from the exploratory cohort and successfully validated in an independent dataset. The clusters were characterized based on (a) single pro‐inflammatory and immune suppressive genes selected from Doucette et al. (2013), (b) previously established immune signatures (Thorsson et al., 2018), and (c) abundance of individual tumor‐infiltrating immune and stromal cell populations (Becht and de Reynies, 2016). Finally, we assessed the performance of a survival model combining molecular and tumor microenvironment classifications, in predicting prognosis of GBM patients.
Tumors of pGBM‐I1 displayed higher expression in most of the pro‐inflammatory and immune‐suppressive genes compared to pGBM‐I2. When analyzed for activation of the representative gene sets previously reported in Thorsson et al. (2018), the clusters showed significant differential enrichment for most of the sets. Based on expression data, tumors of pGBM‐I2 had a profile similar to the ‘lymphocyte‐depleted’ subtype established by Thorsson et al. (2018) and described as being enriched in glioma samples. With an overall higher activation of the TGF‐β, macrophage, and lymphocyte signatures, the pGBM‐I1 cluster was, on the other hand, closer to the ‘TGF‐β‐dominant’ immune subtype. Interestingly, the ‘lymphocyte‐depleted’ and ‘TGF‐β‐dominant’ immune subtypes were both reported by Thorsson et al. (2018) to have the least favorable outcome among all the pan‐cancer subtypes, a finding in accordance with the overall poor prognosis of GBMs. Tumors of pGBM‐I1 were characterized by high expression of fibroblast markers, and moderate‐to‐high infiltration in immune cell populations and endothelial cells, and were associated with the mesenchymal subtype. They also displayed significantly higher expression of immune checkpoints such as PDL1, in line with Liu et al. (2017), and CTLA4, indicating they could be good candidates for immune checkpoint inhibitors therapies. Although others have previously reported similar finding in mesenchymal tumors (Chen and Hambardzumyan, 2018; Doucette et al., 2013; Kaffes et al., 2019), we provide here an alternative strategy based on unsupervised learning, without making any prior assumption on the tumor molecular subtypes. Our approach enables to identify tumors from other molecular subtypes presenting a similar immune and stromal phenotype, which could also benefit from treatments targeting the microenvironment. Interestingly, the distinct makeup found in the microenvironment of mesenchymal pGBM has also been described in mesenchymal colorectal tumors (Becht et al., 2016b), suggesting that similar patient stratification and therapeutic strategies could be implemented across cancer types.
When it comes to survival, studies have reported different clinical outcomes for pGBM patients. It has been proposed that proneural tumors are associated with increased survival compared to other molecular subtypes, while mesenchymal tumors have an inferior outcome (Phillips et al., 2006). In our exploratory cohort, a trend for worse prognosis in both the mesenchymal and the proneural subtypes was observed, but overall the molecular classification was not significantly associated with patient's survival in a univariable setting. In the validation cohort, the proneural subtype was significantly associated with better outcome as also demonstrated in Klopfenstein et al. (2019). Others have investigated the prognostic value of various tumor‐infiltrating cell populations in GBM. Using univariable analyses, Becht et al. (2016a) reported that infiltration in most immune cell populations was associated with improved survival, while increased fibroblast infiltration had a negative prognostic value. In another study, Busek et al. (2016) documented no association between expression of a marker of cancer‐associated fibroblast and survival. They speculated that the glioma subtype may act as a confounder and could explain the inconsistent results regarding the prognostic value of fibroblasts in the literature. These discrepancies suggest that when considered alone, molecular subtypes or immune infiltration does not fully capture the varied clinical course of pGBMs. Our work established that both factors have independent prognostic value and combining them significantly improved our ability to predict survival, as also reported by others (Gruosso et al., 2019; Zeng et al., 2019), including recently in GBM (Klopfenstein et al., 2019).
5. Conclusions
In the present study, transcriptomic profiling identified GBM samples with distinct infiltration of immune and stromal cell populations. Our findings could be further exploited to support qualification of patients for therapeutic strategies targeting the tumor microenvironment. We also established that estimations of immune and stromal infiltration combined with known molecular subtypes improve prognostic models in GBM.
Conflict of interest
The authors declare no conflict of interest.
Author contributions
GEL, RAL, PB, and SH were responsible for the conception and design. ABH, PB, TRM, THA, and DS were responsible for the acquisition of data. MJ, ABH, LC, AS, and GEL were responsible for the analyses and interpretation of data. MJ has drafted the manuscript. All authors read and approved the final manuscript.
Supporting information
Fig. S1. Selection of the number of pGBM infiltration clusters in the exploratory cohort.
Fig. S2. Estimation of tumor infiltration across samples of the exploratory cohort.
Fig. S3. Differential abundance of immune and stromal cell populations between pGBM‐I1 and pGBM‐I2, in the validation dataset.
Fig. S4. Expression levels of selected genes in the mesenchymal subtype vs. other subtypes (neural, proneural and classical), in the exploratory cohort.
Fig. S5. Comparison of abundance of immune and stromal cell populations in the pGBM molecular subtypes (exploratory cohort).
Fig. S6. Molecular characterization of the pGBM‐I1 and pGBM‐I2 clusters according to the Verhaak's signatures in the validation dataset.
Fig. S7. Heatmaps of MCPcounter scores in mesenchymal tumors of the exploratory cohort.
Fig. S8. Heatmaps of MCPcounter scores in neural tumors of the exploratory cohort.
Fig. S9. Heatmaps of MCPcounter scores in classical tumors of the exploratory cohort.
Fig. S10. Heatmaps of MCPcounter scores in proneural tumors of the exploratory cohort.
Fig. S11. Kaplan‐Meier curves modeling the effect of GBM molecular classification on survival in the validation cohort.
Fig. S12. Kaplan‐Meier curves modeling the effect of tumor infiltration on overall survival in the validation cohort.
Fig. S13. Effect of molecular subtypes on survival, in the pooled exploratory and validation cohorts, in (A) pGBM‐I1 and (B) pGBM‐I2.
Table S1. Summary of in‐house patient characteristics (n=67).
Table S2. Regulation of immune suppressor genes in the pGBM infiltration clusters of the exploratory cohort.
Table S3. Regulation of immune effector genes in the pGBM infiltration clusters of the exploratory cohort.
Table S4. Univariable and multivariable Cox's proportional hazard analyses, with survival as endpoint, in the exploratory cohort.
Table S5. Univariable and multivariable Cox's proportional hazard analyses, with survival as endpoint, in the validation cohort.
Table S6. Univariable and multivariable Cox's proportional hazard analyses, with survival as endpoint, in the pooled exploratory and validation cohorts.
Table S7. Effect of molecular subtypes on survival in pGBM‐I1 and pGBM‐I2, in the pooled exploratory and validation cohorts.
Acknowledgements
We thank Jim Thorsen for extracting DNA from TRIzol rests and Hanne‐Sofie Spenning Dahlback for supplying G‐band and HR‐CGA data. This work was supported by the Research Council of Norway (project number 239961, G.E. Lind), the South‐Eastern Norway Regional Health Authority (project number 2013067, G.E. Lind; PR‐2009‐093, R.A. Lothe; project number 2019030, M. Jeanmougin), and the Norwegian Cancer Society (PR‐2006‐0442, R.A Lothe).
Marine Jeanmougin and Annette B. Håvik shared first authors
Data accessibility
The in‐house generated dataset is available in the GEO repository (GEO: http://www.ncbi.nlm.nih.gov/geo/query/acc.cgi?acc=GSE111260).
References
- Becht E and de Reynies A (2016) MCPcounter: estimating tissue‐infiltrating immune and other stromal subpopulations abundances using gene expression. https://github.com/ebecht/MCPcounter
- Becht E, de Reyniès A, Giraldo NA, Pilati C, Buttard B, Lacroix L, Selves J, Sautès‐Fridman C, Laurent‐Puig P and Fridman WH (2016b) Immune and stromal classification of colorectal cancer is associated with molecular subtypes and relevant for precision immunotherapy. Clin Cancer Res 22, 4057–4066. [DOI] [PubMed] [Google Scholar]
- Becht E, Giraldo N, Lacroix L, Buttard B, Elarouci N, Petitprez F, Selves J, Pierre L‐P, Catherine S‐F, Fridman W et al (2016a) Estimating the population abundance of tissue‐infiltrating immune and stromal cell populations using gene expression. Genome Biol 17, 218. [DOI] [PMC free article] [PubMed] [Google Scholar]
- Brennan CW, Verhaak RGW, McKenna A, Campos B, Noushmehr H, Salama SR, Zheng S, Chakravarty D, Sanborn JZ, Berman SH et al (2013) The somatic genomic landscape of glioblastoma. Cell 155, 462–477. [DOI] [PMC free article] [PubMed] [Google Scholar]
- Busek P, Balaziova E, Matrasova I, Hilser M, Tomas R, Syrucek M, Zemanova Z, Krepela E, Belacek J and Sedo A (2016) Fibroblast activation protein alpha is expressed by transformed and stromal cells and is associated with mesenchymal features in glioblastoma. Tumor Biol 37, 13961–13971. [DOI] [PubMed] [Google Scholar]
- Cairncross J, Ueki K, Zlatescu M, Lisle D, Finkelstein D, Hammond R, Silver J, Stark P, Macdonald D, Ino Y et al (1998) Specific genetic predictors of chemotherapeutic response and survival in patients with anaplastic oligodendrogliomas. J Natl Cancer Inst 90, 1473–1479. [DOI] [PubMed] [Google Scholar]
- Carvalho BS and Irizarry RA (2010) A framework for oligonucleotide microarray preprocessing. Bioinformatics 26, 2363–2367. [DOI] [PMC free article] [PubMed] [Google Scholar]
- Chen Z and Hambardzumyan D (2018) Immune microenvironment in glioblastoma subtypes. Front Immunol 9, 1004. [DOI] [PMC free article] [PubMed] [Google Scholar]
- Darmanis S, Sloan SA, Croote D, Mignardi M, Chernikova S, Samghababi P, Zhang Y, Neff N, Kowarsky M, Caneda C et al (2017) Single‐cell RNA‐seq analysis of infiltrating neoplastic cells at the migrating front of human glioblastoma. Cell Rep 21, 1399–1410. [DOI] [PMC free article] [PubMed] [Google Scholar]
- Domingues P, González‐Tablas M, Otero Á, Pascual D, Miranda D, Ruiz L, Sousa P, Ciudad J, Gonçalves JM, Lopes MC et al (2016) Tumor infiltrating immune cells in gliomas and meningiomas. Brain Behav Immun 53, 1–15. [DOI] [PubMed] [Google Scholar]
- Doucette T, Rao G, Rao A, Shen L, Aldape K, Wei J, Dziurzynski K, Gilbert M and Heimberger AB (2013) Immune heterogeneity of glioblastoma subtypes: extrapolation from the Cancer Genome Atlas. Cancer Immunol Res 1, 112–122. [DOI] [PMC free article] [PubMed] [Google Scholar]
- Gieryng A, Pszczolkowska D, Walentynowicz KA, Rajan WD and Kaminska B (2017) Immune microenvironment of gliomas. Lab Invest 97, 498–518. [DOI] [PubMed] [Google Scholar]
- Gruosso T, Gigoux M, Manem VSK, Bertos N, Zuo D, Perlitch I, Saleh SMI, Zhao H, Souleimanova M, Johnson RM et al (2019) Spatially distinct tumor immune microenvironments stratify triple‐negative breast cancers. J Clin Invest 129, 1785–1800. [DOI] [PMC free article] [PubMed] [Google Scholar]
- Gupta R, Webb‐Myers R, Flanagan S and Buckland ME (2011) Isocitrate dehydrogenase mutations in diffuse gliomas: clinical and aetiological implications. J Clin Pathol 64, 835–844. [DOI] [PubMed] [Google Scholar]
- Han S, Zhang C, Li Q, Dong J, Liu Y, Huang Y, Jiang T and Wu A (2014) Tumour‐infiltrating CD4+ and CD8+ lymphocytes as predictors of clinical outcome in glioma. Br J Cancer 110, 2560–2568. [DOI] [PMC free article] [PubMed] [Google Scholar]
- Hänzelmann S, Castelo R and Guinney J (2013) GSVA: gene set variation analysis for microarray and RNA‐Seq data. BMC Bioinformatics 14, 7. [DOI] [PMC free article] [PubMed] [Google Scholar]
- Håvik AB, Lind GE, Honne H, Meling TR, Scheie D, Hall KS, Van Den Berg E, Mertens F, Picci P, Lothe RA et al (2014) Sequencing IDH1/2 glioma mutation hotspots in gliomas and malignant peripheral nerve sheath tumors. Neuro Oncol 16, 320–322. [DOI] [PMC free article] [PubMed] [Google Scholar]
- Jackson CM, Lim M and Drake CG (2014) Immunotherapy for brain cancer: recent progress and future promise. Clin Cancer Res 20, 3651–3659. [DOI] [PMC free article] [PubMed] [Google Scholar]
- Kaffes I, Szulzewsky F, Chen Z, Herting CJ, Gabanic B, Vega JEV, Shelton J, Switchenko JM, Ross JL, McSwain LF et al (2019) Human mesenchymal glioblastomas are characterized by an increased immune cell presence compared to proneural and classical tumors. OncoImmunology 8, e1655360. [DOI] [PMC free article] [PubMed] [Google Scholar]
- Kamran N, Kadiyala P, Saxena M, Candolfi M, Li Y, Moreno‐Ayala MA, Raja N, Shah D, Lowenstein PR and Castro MG (2017) Immunosuppressive myeloid cells' blockade in the glioma microenvironment enhances the efficacy of immune‐stimulatory gene therapy. Mol Ther 25, 232–248. [DOI] [PMC free article] [PubMed] [Google Scholar]
- Klopfenstein Q, Truntzer C, Vincent J and Ghiringhelli F (2019) Cell lines and immune classification of glioblastoma define patient's prognosis. Br J Cancer 120, 806. [DOI] [PMC free article] [PubMed] [Google Scholar]
- Kmiecik J, Poli A, Brons NHC, Waha A, Eide GE, Enger PØ, Zimmer J and Chekenya M (2013) Elevated CD3+ and CD8+ tumor‐infiltrating immune cells correlate with prolonged survival in glioblastoma patients despite integrated immunosuppressive mechanisms in the tumor microenvironment and at the systemic level. J Neuroimmunol 264, 71–83. [DOI] [PubMed] [Google Scholar]
- Leek JT, Johnson WE, Parker HS, Jaffe AE and Storey JD (2012) The sva package for removing batch effects and other unwanted variation in high‐throughput experiments. Bioinformatics 28, 882–883. [DOI] [PMC free article] [PubMed] [Google Scholar]
- Li A, Walling J, Ahn S, Kotliarov Y, Su Q, Quezado M, Oberholtzer JC, Park J, Zenklusen JC and Fine HA (2009) Unsupervised analysis of transcriptomic profiles reveals six glioma subtypes. Cancer Res 69, 2091–2099. [DOI] [PMC free article] [PubMed] [Google Scholar]
- Liu S, Wang Z, Wang Y, Fan X, Zhang C, Ma W, Qiu X and Jiang T (2017). PD‐1 related transcriptome profile and clinical outcome in diffuse gliomas. Oncoimmunology 7, e1382792. [DOI] [PMC free article] [PubMed] [Google Scholar]
- Louis DN, Perry A, Reifenberger G, von Deimling A, Figarella‐Branger D, Cavenee WK, Ohgaki H, Wiestler OD, Kleihues P and Ellison DW (2016) The 2016 World Health Organization classification of tumors of the central nervous system: a summary. Acta Neuropathol 131, 803–820. [DOI] [PubMed] [Google Scholar]
- Madhavan S, Zenklusen J‐C, Kotliarov Y, Sahni H, Fine HA and Buetow K (2009) Rembrandt: helping personalized medicine become a reality through integrative translational research. Mol Cancer Res 7, 157–167. [DOI] [PMC free article] [PubMed] [Google Scholar]
- Maechler M, Rousseeuw P, Struyf A, Hubert M and Hornik K (2017) cluster: Cluster Analysis Basics and Extensions. https://cran.r-project.org/package=cluster
- Mirzaei R, Sarkar S and Yong VW (2017) T cell exhaustion in glioblastoma: intricacies of immune checkpoints. Trends Immunol 38, 104–115. [DOI] [PubMed] [Google Scholar]
- Mostafa H, Pala A, Högel J, Hlavac M, Dietrich E, Westhoff MA, Nonnenmacher L, Burster T, Georgieff M, Wirtz CR et al (2016) Immune phenotypes predict survival in patients with glioblastoma multiforme. J Hematol Oncol 9, 77. [DOI] [PMC free article] [PubMed] [Google Scholar]
- Ostrom QT, Gittleman H, Xu J, Kromer C, Wolinsky Y, Kruchko C and Barnholtz‐Sloan JS (2016) CBTRUS statistical report: primary brain and other central nervous system tumors diagnosed in the United States in 2009–2013. Neuro Oncol 18, v1–v75. [DOI] [PMC free article] [PubMed] [Google Scholar]
- Parker NR, Hudson AL, Khong P, Parkinson JF, Dwight T, Ikin RJ, Zhu Y, Cheng ZJ, Vafaee F, Chen J et al (2016) Intratumoral heterogeneity identified at the epigenetic, genetic and transcriptional level in glioblastoma. Sci Rep 6, 22477. [DOI] [PMC free article] [PubMed] [Google Scholar]
- Phillips HS, Kharbanda S, Chen R, Forrest WF, Soriano RH, Wu TD, Misra A, Nigro JM, Colman H, Soroceanu L et al (2006) Molecular subclasses of high‐grade glioma predict prognosis, delineate a pattern of disease progression, and resemble stages in neurogenesis. Cancer Cell 9, 157–173. [DOI] [PubMed] [Google Scholar]
- Preusser M, Lim M, Hafler DA, Reardon DA and Sampson JH (2015) Prospects of immune checkpoint modulators in the treatment of glioblastoma. Nat Rev Neurol 11, 504–514. [DOI] [PMC free article] [PubMed] [Google Scholar]
- Riddick G and Fine HA (2011) Integration and analysis of genome‐scale data from gliomas. Nat Rev Neurol 7, 439–450. [DOI] [PMC free article] [PubMed] [Google Scholar]
- Ritchie ME, Phipson B, Wu D, Hu Y, Law CW, Shi W and Smyth GK (2015) limma powers differential expression analyses for RNA‐sequencing and microarray studies. Nucleic Acids Res 43, e47. [DOI] [PMC free article] [PubMed] [Google Scholar]
- Schaller TH and Sampson JH (2017) Advances and challenges: dendritic cell vaccination strategies for glioblastoma. Expert Rev Vaccines 16, 27–36. [DOI] [PMC free article] [PubMed] [Google Scholar]
- Smith J, Perry A, Borell T, Lee H, O'Fallon J, Hosek S, Kimmel D, Yates A, Burger P, Scheithauer B et al (2000) Alterations of chromosome arms 1p and 19q as predictors of survival in oligodendrogliomas, astrocytomas, and mixed oligoastrocytomas. J Clin Oncol 18, 636–645. [DOI] [PubMed] [Google Scholar]
- Subramanian A, Tamayo P, Mootha VK, Mukherjee S, Ebert BL, Gillette MA, Paulovich A, Pomeroy SL, Golub TR, Lander ES et al (2005) Gene set enrichment analysis: a knowledge‐based approach for interpreting genome‐wide expression profiles. Proc Natl Acad Sci USA 102, 15545–15550. [DOI] [PMC free article] [PubMed] [Google Scholar]
- Therneau TMS (2015) A package for survival analysis in S. https://cran.r-project.org/web/packages/survival/index.html
- Thorsson V, Gibbs DL, Brown SD, Wolf D, Bortone DS, Ou Yang T‐H, Porta‐Pardo E, Gao GF, Plaisier CL, Eddy JA et al (2018) The immune landscape of cancer. Immunity 48, 812–830.e14. [DOI] [PMC free article] [PubMed] [Google Scholar]
- Tomaszewski W, Sanchez‐Perez L, Gajewski TF and Sampson JH (2019) Brain tumor microenvironment and host state: implications for immunotherapy. Clin Cancer Res 25, 4202–4210. [DOI] [PMC free article] [PubMed] [Google Scholar]
- Turcan S, Rohle D, Goenka A, Walsh LA, Fang F, Yilmaz E, Campos C, Fabius AWM, Lu C, Ward PS et al (2012) IDH1 mutation is sufficient to establish the glioma hypermethylator phenotype. Nature 483, 479–483. [DOI] [PMC free article] [PubMed] [Google Scholar]
- Verhaak RGW, Hoadley KA, Purdom E, Wang V, Qi Y, Wilkerson MD, Miller CR, Ding L, Golub T, Mesirov JP et al (2010) Integrated genomic analysis identifies clinically relevant subtypes of glioblastoma characterized by abnormalities in PDGFRA, IDH1, EGFR, and NF1. Cancer Cell 17, 98–110. [DOI] [PMC free article] [PubMed] [Google Scholar]
- Wan Y‐W, Allen GI, Anderson ML and Liu ZR (2015) TCGA2STAT: simple TCGA data access for integrated statistical analysis in R. https://CRAN.R-project.org/package=TCGA2STAT [DOI] [PubMed]
- Wang Q, Hu B, Hu X, Kim H, Squatrito M, Scarpace L, deCarvalho AC, Lyu S, Li P, Li Y et al (2017) Tumor evolution of glioma intrinsic gene expression subtype associates with immunological changes in the microenvironment. Cancer Cell 32, 42–56.e6. [DOI] [PMC free article] [PubMed] [Google Scholar]
- Weller M, Stupp R, Reifenberger G, Brandes AA, van den Bent MJ, Wick W and Hegi ME (2010) MGMT promoter methylation in malignant gliomas: ready for personalized medicine? Nat Rev Neurol 6, 39–51. [DOI] [PubMed] [Google Scholar]
- Wickham H (2016) ggplot2: elegant graphics for data analysis. Springer International Publishing, New York, NY. [Google Scholar]
- Zeng D, Li M, Zhou R, Zhang J, Sun H, Shi M, Bin J, Liao Y, Rao J and Liao W (2019) Tumor microenvironment characterization in gastric cancer identifies prognostic and immunotherapeutically relevant gene signatures. Cancer Immunol Res 7, 737–750. [DOI] [PubMed] [Google Scholar]
Associated Data
This section collects any data citations, data availability statements, or supplementary materials included in this article.
Supplementary Materials
Fig. S1. Selection of the number of pGBM infiltration clusters in the exploratory cohort.
Fig. S2. Estimation of tumor infiltration across samples of the exploratory cohort.
Fig. S3. Differential abundance of immune and stromal cell populations between pGBM‐I1 and pGBM‐I2, in the validation dataset.
Fig. S4. Expression levels of selected genes in the mesenchymal subtype vs. other subtypes (neural, proneural and classical), in the exploratory cohort.
Fig. S5. Comparison of abundance of immune and stromal cell populations in the pGBM molecular subtypes (exploratory cohort).
Fig. S6. Molecular characterization of the pGBM‐I1 and pGBM‐I2 clusters according to the Verhaak's signatures in the validation dataset.
Fig. S7. Heatmaps of MCPcounter scores in mesenchymal tumors of the exploratory cohort.
Fig. S8. Heatmaps of MCPcounter scores in neural tumors of the exploratory cohort.
Fig. S9. Heatmaps of MCPcounter scores in classical tumors of the exploratory cohort.
Fig. S10. Heatmaps of MCPcounter scores in proneural tumors of the exploratory cohort.
Fig. S11. Kaplan‐Meier curves modeling the effect of GBM molecular classification on survival in the validation cohort.
Fig. S12. Kaplan‐Meier curves modeling the effect of tumor infiltration on overall survival in the validation cohort.
Fig. S13. Effect of molecular subtypes on survival, in the pooled exploratory and validation cohorts, in (A) pGBM‐I1 and (B) pGBM‐I2.
Table S1. Summary of in‐house patient characteristics (n=67).
Table S2. Regulation of immune suppressor genes in the pGBM infiltration clusters of the exploratory cohort.
Table S3. Regulation of immune effector genes in the pGBM infiltration clusters of the exploratory cohort.
Table S4. Univariable and multivariable Cox's proportional hazard analyses, with survival as endpoint, in the exploratory cohort.
Table S5. Univariable and multivariable Cox's proportional hazard analyses, with survival as endpoint, in the validation cohort.
Table S6. Univariable and multivariable Cox's proportional hazard analyses, with survival as endpoint, in the pooled exploratory and validation cohorts.
Table S7. Effect of molecular subtypes on survival in pGBM‐I1 and pGBM‐I2, in the pooled exploratory and validation cohorts.
Data Availability Statement
The in‐house generated dataset is available in the GEO repository (GEO: http://www.ncbi.nlm.nih.gov/geo/query/acc.cgi?acc=GSE111260).