

Abstract
Endonuclease V (EndoV) is a conserved inosine-specific ribonuclease with unknown biological function. Here, we present the first mouse model lacking EndoV, which is viable without visible abnormalities. We show that endogenous murine EndoV cleaves inosine-containing RNA in vitro, nevertheless a series of experiments fails to link an in vivo function to processing of such transcripts. As inosine levels and adenosine-to-inosine editing often are dysregulated in hepatocellular carcinoma (HCC), we chemically induced HCC in mice. All mice developed liver cancer, however, EndoV−/− tumors were significantly fewer and smaller than wild type tumors. Opposed to human HCC, adenosine deaminase mRNA expression and site-specific editing were unaltered in our model. Loss of EndoV did not affect editing levels in liver tumors, however mRNA expression of a selection of cancer related genes were reduced. Inosines are also found in certain tRNAs and tRNAs are cleaved during stress to produce signaling entities. tRNA fragmentation was dysregulated in EndoV−/− livers and apparently, inosine-independent. We speculate that the inosine-ribonuclease activity of EndoV is disabled in vivo, but RNA binding allowed to promote stabilization of transcripts or recruitment of proteins to fine-tune gene expression. The EndoV−/− tumor suppressive phenotype calls for related studies in human HCC.
INTRODUCTION
One of the most abundant modified bases in RNA is inosine (I), which is the deamination product of adenosine (A) (1). Inosines are formed by adenosine deaminases acting on RNA (ADAR) in a process referred to as A-to-I editing. Mammals have three different ADAR genes (ADAR1-3) whose activity is strictly regulated and coordinated at multiple levels (2,3). Cellular proteins read inosine as guanosine and depending on the location in the transcript, editing has different outcomes such as recoding, change of splice sites, recognition sites or gene expression (4–7). Editing in coding sequences is limited (0.05% of total number of edits), whereas editing in untranslated regions is found in the majority of human genes (8–10). ADAR enzymes are essential for normal development and health (2,11–16).
Cells have enzymes that recognize and process inosines in RNA. One of these is Endonuclease V (EndoV) which binds and cleaves the second phosphodiester bond 3′ to the deaminated base, yielding 3′-OH and 5′-P termini (17). Homologs of EndoV are found in most organisms throughout phylogeny (18). Early studies described EndoV as a DNA repair protein for inosine which seems to apply for EndoV in Escherichia coli and some other bacteria (17,19–21), but not in human and mouse. The mammalian enzymes are indeed inosine specific, but instead of cleaving DNA, they are active on RNA (22–24). Transcriptomic analyses reveal a multitude of human ENDOV transcript variants where most appear incomplete (18,25). Three complete full length isoforms differing in the C-termini have been examined, all showing basically the same enzymatic properties and subcellular localization (25). ENDOV is found in the cytoplasm in human cells and upon various stresses, it relocalizes to cytoplasmic stress granules, suggesting that ENDOV activity is regulated. Polyadenylate binding protein cytoplasmic1, PABPC1, was found to interact with human ENDOV, but the biological significance of this interaction remains unknown (26).
Whereas the in vitro activity of mammalian EndoV is well studied, the in vivo function remains enigmatic. Mutants of EndoV have been characterized in bacteria, and except for a moderate increase in mutation frequency, no clear phenotype has been reported (27). EndoV from the unicellular eukaryote parasite Trypanosoma brucei has, similarly to mouse and human EndoV, a strong preference for inosine in RNA over DNA. The enzyme appears to be non-essential in the bloodstream form of the parasite which is the mammalian stage. In contrast, protein depletion in the procyclic forms (insect-stage parasites) leads to impaired growth and defects in cell cycle progression, suggesting a specific role for T. brucei EndoV at this phase of life (28).
Liver cancers are the second most common cause of cancer-related death worldwide (World Health Organization, 2018). The majority of liver cancers are aggressive hepatocellular carcinomas (HCC) where risk factors include viral infection, alcohol and carcinogen exposure, chronic liver disease and obesity (29). Prognosis for HCC is poor with median survival following diagnosis of 6–20 months. This relates to an asymptomatic initial phase and late manifestation with large tumors where surgical resection is infeasible. At this stage the tyrosin kinase inhibitor sorafenib is the standard choice of therapy which prolongs life for ∼3 months (30,31). HCC is a heterogeneous disease with complex molecular patterns and dysfunction in numerous cellular pathways (29). For example, A-to-I editing is found dysregulated and both hyper- and hypoediting in coding and non-coding regions of several genes are found (16,32,33).
To elucidate the in vivo function of EndoV in mammals, we generated a gene targeted EndoV deficient mouse strain by homologous recombination. The resulting EndoV−/− mice are viable with normal appearance. The pathogenesis of HCC is not understood completely, but recent studies have suggested a specific role for ADAR1 (16,34) and A-to-I editing imbalance (33). To elucidate a possible in vivo role of EndoV, we therefore challenged wild type and EndoV−/− mice with diethylnitrosamine (DEN) to induce HCC. Both wild type and EndoV−/− mice developed liver tumors, and notably, EndoV−/− mice had fewer and smaller tumors compared to wild type mice.
MATERIALS AND METHODS
Mouse experiments and ethics
This study has been approved by the Norwegian National Animal Research Authority with project license numbers FOTS 3147, 5336 and 7478. All animal experiments were performed in accordance with the European Directive 2010/63/EU.
The EndoV−/− mouse strain was generated by replacing exon 3–5 of the EndoV gene with a neomycin resistance cassette using the restriction sites BsrGI and HindIII in C57BL/6J background (Genoway/Charles River Laboratories, Research Models and Services, Germany GmbH) and backcrossed in C57BL/6N. Primers used for genotyping are listed in Supplementary Table S1.
The mice were housed under a 12 h light–dark cycle and given access ad libitum to water and regular rodent chow food unless otherwise stated. Mice were sacrificed by cardiac puncture. Blood glucose was measured using glucose strips (Roche, Merck). The remaining blood was collected using a 1 ml syringe with coating of 0.5 M EDTA (Fluka, Sigma-Aldrich). EDTA blood was immediately placed on ice and centrifuged within 30 min at 2000g (4°C) for 20 min to obtain platelet-poor plasma. The livers and spleens were removed immediately, washed in cold PBS and weighted. All samples were stored at −80°C until further use.
Liver lipids were extracted by homogenization in 5% Igepal (Sigma-Aldrich), followed by slow heating to 95°C min for 10 min. Homogenization and heating was repeated once before removing insoluble materials by centrifugation. Liver and plasma triglycerides, cholesterol and non-esterified fatty acids (NEFA) were analysed according to manufacture's guidelines (Wako Chemicals GmbH). Plasma C-peptide levels were determined by ELISA following manufacture's protocol (Chrystal Chem).
To induce HCC, 2-week-old male mice (n = 30) were injected intraperitoneally with a single dose of 25 mg/kg body weight of DEN (Sigma-Aldrich) and maintained on a standard chow diet for 40 weeks. The mice were sacrificed by cardiac puncture, the livers were removed immediately, washed in cold PBS and weighted. The number of visible surface liver tumor nodules that were >1 mm in diameter was counted. The maximal tumor size was determined by measuring the diameter of the major axis of each surface liver tumor nodule. Liver tissues were fixated in formalin or stored at −80°C until further use. Coagulated blood samples were centrifuged at 1500g for 20 min, and serum ALT and AST activities were measured at The Central Laboratory, Department of Basic Sciences and Aquatic Medicine, Norwegian University of Life Sciences.
See Supplementary Material for details on mouse behavioural analysis.
IP and activity assay with endogenous mEndoV
Organs (liver, spleen, testis, heart, brain, thymus and kidney) were harvested from 16-month-old male mice and flash frozen in liquid nitrogen. The organs were thawed on ice and homogenized in RIPA buffer (50 mM Tris pH 7.5, 150 mM NaCl, 0.1% SDS, 0.5% Na-Deoxycholate, 0.5% Triton X-100 and freshly added PIC 1:100 (Sigma-Aldrich), 1 mM DTT, 100 U/ml RNase OUT™ (Invitrogen) and 400 μM VRC (BioNordika/NEB). Extracts were cleared by centrifugation at 21 000g for 20 min and protein concentration was measured with Bradford assay.
Endogenous EndoV was immunoprecipitated from protein extracts from wild type and EndoV−/− mice using an in-house polyclonal antibody (26). 1.5 mg of total protein was incubated with 2 μg antibody in 1 ml of buffer containing 100 mM KCl, 5 mM MgCl2, 10 mM HEPES pH 7.0, 0.5% IGEPAL® CA-630 (Sigma-Aldrich), 1 mM DTT, 100 U RNase OUT, 400 μM VRC and protease inhibitor coctail (1:100). Recombinant mouse EndoV (40 ng) (22) was included as positive control. The mixtures were incubated for 2 h with slow rotation at 4°C. Protein A/G Plus-agarose beads (Santa Cruz) were added and incubation continued overnight. The beads were collected by centrifugation at 1000g for 5 min and washed three times with 1 ml NT2 buffer (50 mM Tris–HCl pH 7.4, 150 mM NaCl, 1 mM MgCl2 and 0.5% IGEPAL® CA 630). After the last wash, the liquid was removed and EndoV activity measured by adding 2 μl 32P-end-labeled single stranded RNA substrate (5′-ACUGGACA[rI][rI]U[rI]CUCCGAGG-3′), 4 μl reaction buffer (final 10 mM Tris–HCl pH 7.5, 0.5 mM MnCl2, 50 mM KCl, 1 mM DTT, 5% glycerol) and 8 μl water as described in (26). Reactions proceeded at 37°C for 10 min and were stopped by adding 10 μl formamide loading dye (80% formamide, 10 mM EDTA, 0.1% xylene cyanol and bromophenol blue). The samples were heated at 50°C for 5 min, and the reaction products separated on 20% polyacrylamide/urea sequencing gels at 1700 V for 1.5 h in 1× taurine buffer. The 32P-labeled fragments were visualized by phosphorimaging (Typhoon 9410 Variable Mode Imager).
Culturing of mammalian cells
Flp-In T-REx 293 cells (Invitrogen) were used to establish stable cell lines overexpressing either human Flag-EndoV fusion protein (hereafter referred to as Flag-EndoV) or the catalytically inactive mutant, Flag-EndoV D52A (23). Cells were stably transfected and cultured as previously described (26). The human haploid EndoV knock-out cell line, HAP1 (Horizon Genomics) and HEK293T (American type Culture Collection) were established and cultured as previously described (26). Primary fibroblasts cultures from three wild type and three EndoV−/− mice tails were established as follows. Tail skin was separated, cut into smaller pieces and incubated over night at 5% CO2 and 37°C in 1 mg/ml Collagenase (Sigma) added to complete media [DMEM (Sigma), 10% fetal bovine serum (Sigma), 1% penicillin-streptomycin (Lonza), 1% GlutaMAX (Gibco)]. The digested tail tissues were washed and primary cells were isolated using 70 μm cell strainers and centrifuged at 1200 rpm for 10 min. Cell pellets were suspended in complete media with 0.25 μg/ml amphotericin B (Gibco). Cells were washed with PBS to remove debris and added fresh media after 48 h.
Cell proliferation and viability assays
Cell proliferation was determined using Cell Proliferation Kit I (MTT; Roche). Primary tail fibroblasts were seeded in 96-well plates and cell viability was assessed following the manufacturer's protocol. Hap1 cells (26) were seeded in 96-well plates and treated with or without sorafenib (Toronto Research Chemicals) for 24 h before MTT assay was performed.
CASP3/7 activity assay for apoptosis detection and analysis
Flp-In T-REx 293 and cell lines overexpressing Flag-EndoV or Flag-EndoV D52A were seeded in 96-well plates for 24 h before being treated with or without sorafenib. Cells were subsequently monitored in real-time by fluorescently measuring the CASP3/7 activity for 24 h using IncuCyte®S3 and IncuCyte caspase-3/7 Green Apoptosis Assay according to the manufacturer's protocol (Essen Bioscience). CASP3/7 activity was normalized to the total number of cells per well measured by confluence. Normalized values were related to the average of untreated sample for each cell line. An in-house monoclonal human EndoV antibody raised and purified as described in (23) was used to verify the presence of Flag-EndoV or Flag-EndoV D52A via Western blot. An α-Tubulin antibody (Sigma, T5168) was used as loading control.
Subcellular localization
The mouse EndoV open reading frame was cloned into the vector pEGFP-C1 (HindIII-KpnI) in frame with GFP (Genescript). The GFP-EndoV fusion protein was transiently expressed in HEK 293T cells using X-tremeGene 9 DNA transfection agent according to the manufacturer's protocol. Cells were grown in complete DMEM media (as described above) on 12 mm fibronectin-coated (20 μg/ml, Sigma-Aldrich) coverslips until 70–80% confluence was reached and exposed to 0.5 mM sodium arsenite (Sigma) for 30 min. Cells were washed in PBS before fixation in 4% paraformaldehyde in PBS for 15 min. After washing in PBS, cells were quenched in PBS/0.1 M glycine for 10 min, permeabilized in PBS/0.1% Triton for 10 min and incubated in blocking buffer (PBS/0.5% BSA) for 30 min. All subsequent labeling steps were performed in blocking buffer and cells were incubated for 1 h with primary (1:100 dilution) and secondary antibodies. Stress granules were detected with anti-G3BP (BD Biosciences, 611126) and Alexa Fluor® 594 anti-mouse IgG antibodies (Life Technologies). Coverslips were mounted with Mowiol (Sigma-Aldrich). Confocal images were acquired with Carl Zeiss LSM 510 CLSM laser scanning microscope with a 63×/1.1 NA oil immersion objective (Jena). Representative images are shown.
Immunohistochemistry
Formalin-fixed parafin-embedded liver tissues were cut into 4 μm thick sections and subjected to routine hematoxilin-eosin (H&E) staining for histological evaluation. Immunohistological analyses were performed using anti-F4/80 (rat monoclonal, 1:200, Invitrogen 14-4801-82), anti-CD163 (rabbit polyclonal, 1:200, Abcam Ab182422), anti-iNOS (rabbit polyclonal, 1:100, Abcam Ab15323), The ImmPRESS HRP-Reagent anti-rabbit (Vector Labs, MP7401) or anti-rat (Vector Labs, MP7404) were used as per the manufacturer's recommendations. The immunoreaction was then visualized using DAB substrate (Vector Labs). Sections were counterstained with hematoxylin QS (Vector Labs, H-3404). The stained sections (n = 5–6) were scanned (Axio Scan.Z1, Zeiss), and the amount of positive DAB-staining was quantitatively assessed using the Z9 analysis platform, an in-house made software for analysis of histological sections, by estimating cross sectional coverage of positive antibody staining in the tissue relative to the total area of the cross section of the tissue.
RNA isolations
Total RNA used for mass spectrometric (MS) analysis was isolated using Trizol. Small (<200 nt) and large (>200 nt) RNA were isolated using mirVana™ miRNA isolation kit (Ambion) following the manufactures protocol. Homogenization of the tissue in lysis buffer (with the addition of 100 μM adenosine deaminase inhibitor EHNA, Toronto Research Chemicals) was done using FastPrep®-24 Classic instrument (MP Biomedicals) with one steel bead per tube (Qiagen), at a speed of 5 m/s for 30 s. mRNA was isolated from the large RNA fraction using Dynabeads® Oligo dT (Ambion).
For all other experiments, total RNA was isolated using miRNeasy mini kit (Qiagen) following the manufacturer protocol. Quality was checked with 2100 Bioanalyzer and Agilent 6000 Nano Kit (Agilent Technologies).
RNA sequencing
The RNA sequencing was conducted by Beijing Genomics Institute (BGI) Tech Solution (Hong Kong) using Illumina HiSeq4000 (50 SE, 20 M clean reads/sample). The acquired dataset was mapped to the mouse genome (mm9) using TopHat2 (35). Partek® Genomics Suite® software, version 6.6 Copyright ©; 2018 (Partek Inc., St. Louis, MO, USA) was used to align the reads to the transcriptome (RefSeq transcript: 01.11.2016) and perform differential gene expression analysis.
Inosine content in RNA by mass spectrometry
Small RNA fraction (2 μg), mRNA (250 ng) and DNA (15 μg) were analyzed for inosine content by mass spectrometry (MS). DNA was isolated using AllPrep kit (Qiagen) following the manufacturer protocol. DNA or RNA was hydrolyzed to nucleosides by 20 U benzonase (Santa Cruz Biotech), 0.2 U nuclease P1, and 0.1 U alkaline phosphatase (Sigma-Aldrich) in 10 mM ammonium acetate pH 6.0, 1 mM MgCl2 and 100 μM deaminase inhibitor EHNA (Sigma-Aldrich) at 40°C for 40 min, added 3 volumes of acetonitrile and centrifuged (16 000g, 30 min, 4°C). The supernatants were lyophilized at −80°C to minimize spontaneous adenine deamination during drying and dissolved in 50 μl water for LC–MS/MS analyses of deoxyinosine, inosine and unmodified nucleosides. Chromatographic separation was performed using an Agilent 1290 Infinity II UHPLC system with an ZORBAX RRHD Eclipse Plus C18 150 × 2.1 mm ID (1.8 μm) column protected with an ZORBAX RRHD Eclipse Plus C18 5 × 2.1 mm ID (1.8 μm) guard column (Agilent). For deoxyinosine or inosine analyses, the mobile phase consisted of water and methanol (both added 10 mM acetic acid) run at 0.25 ml/min, starting with 5% methanol for 0.5 min, followed by a 4 min gradient of 5–90% methanol, and 4 min re-equilibration with 5% methanol. A portion of each sample was diluted for the analysis of unmodified nucleosides which was chromatographed isocratically with water/methanol/formic acid (80/20/0.1%). Mass spectrometric detection was performed using an Agilent 6495 Triple Quadrupole system with electrospray ionization, for DNA monitoring the mass transitions 251.1/135.1 (deoxyinosine, negative mode), 252.1/136.1 (dA, positive mode), 228.1/112.1 (dC, positive mode), 268.1/152.1 (dG, positive mode) and 243.1/127.1 (dT, positive mode), and for RNA monitoring 267.1/135.1 (inosine, negative mode), 268.1/136.1 (A, positive mode), 244.1/112.1 (C, positive mode), 284.1/152.1 (G, positive mode) and 245.1/113.1 (U, positive mode). Quantification was accomplished by comparison to pure nucleoside standards.
Analyses of A-to-I editing by DNA sequencing
For site-specific editing in exons, cDNA (n = 3) was made with qScript cDNA supermix (Quanta). Regions of interest were PCR amplified, PCR products separated by agarose gel electrophoresis, excised from the gel and purified with QIAquick gel extraction kit (Qiagen). Sequencing of PCR products was conducted by GATC-Biotech (Germany) and editing levels were determined by measuring peak heights using Chromas Lite. Editing levels (%) were calculated as a ratio of G-peak height to the A+G peak height (G/G+A). This method was also used for determination of A-to-I editing in the Ctn 3′UTR after preparing of cDNA (n = 5) using Quantitect Reverse Transcription Kit (Qiagen). Primer sequences are found in Supplementary Table S1.
For identification of A-to-I editing in the 3′UTRs of Replication protein A1 (Rpa1) and Tapbp (Transporter associated with antigen processing) binding protein (Tapbp), liver cDNA (n = 3) was prepared using Quantitect Reverse Transcription Kit. PCR amplification of 3′UTR regions was performed on pooled cDNAs from each genotype (see Supplementary Table S1 for primers). To map single editing events, PCR products were cloned using TOPO® TA Cloning® Kit (Invitrogen). Twenty four different clones per genotype were sequenced using the M13 forward primer. Sequences were analyzed by ChromasLite and aligned using ClustalX and GeneDoc. All A-to-G mutations found in the cDNAs (compared to genomic DNA) were classified as A-to-I deamination events. Average and standard deviation for the 24 different clones (PCR fragments) were calculated. Total number of mutations per PCR fragment was expressed in percentage relative to the total number of adenosines in the PCR fragment.
Real-time quantitative PCR
cDNA was generated from tumor and non-tumor liver total RNA using Quantitect Reverse Transcription Kit. Real-time quantitative PCR (RT-qPCR) was performed using Step One Plus Real-time PCR system or the ABI 7900HT system (Applied Biosystem) with Power SYBR Green PCR master mix (Life Technologies) according to the system instructions. 5–10 animals from each genotype were analyzed, using 5 ng cDNA per reaction. The experiments were repeated twice. Mouse eukaryotic elongation factor 2 (Eef2) or β-actin (actb) were used as the reference genes for normalization in all the experiments. Melting point analysis was performed to confirm the specificity of the PCR products. All samples were related to the average of wild type non-tumor samples. Primer sequences are available on request.
Northern blot analyses
Liver total RNA (4 μg) was mixed with equal volume of formamide loading dye and heated to 50°C for 5 min before separation by 15% denaturating PAGE (7 M urea and 1× taurine) at 200 V for 50 min in 1x taurine. The RNA was transferred to a nylon membrane (Hybond XL, GE Healthcare) by electroblotting in 1x taurine at 5 V, for 1 h at room temperature. RNA was UV-crosslinked to the membranes (120 mJ/cm−2 in a CL-1000 UV-Crosslinker, UVP). The Northern Max kit (Ambion, Applied Biosystems) was used for prehybridization, hybridization and washing steps as described by the manufacturer. 32P 5′-end-labeled DNA oligonucleotides (Supplementary Table S1) complementary to the specific tRNAs were used as probes. Hybridization signals were analyzed by phosphorimaging (Typhoon 9410 Variable Mode Imager) and quantified by ImageQuant TL software using background substraction rolling ball. Hybridized probes were removed from the membranes by boiling in 0.1% SDS.
For recombinant mouse EndoV (22), tRNA cleavage was assayed by incubating small RNA isolated from human U373 cells (2 μg; (23)) and MBP-EndoV enzymes in reaction buffer as described previously. Further steps were as for northern blot analyses.
tRNA fragments qPCR array
Total RNA from three animals from each genotype was isolated with Trizol as described above and tested by Arraystar (mouse nrStar™ tRF&tiRNA PCR Array, Arraystar Inc, Rockwill, MD, USA). RT-qPCRs were analyzed using ΔΔCt method. Fragments that had a fold difference <2 and a P-value >0.05 were excluded from further analyses.
Statistical analyses
The statistical significance was determined by the Student's t-test when applicable. Unpaired t-test was used to determine P-values between wild type and EndoV−/− samples. Paired t-tests were performed in samples from the same individual. Differences were considered statistically significant at P < 0.05 (*P < 0.05; **P < 0.01; ***P < 0.001; ****P < 0.0001). The plots are shown as means ± standard deviation (SD) or standard error of mean (SEM), when applicable. For northern blot analyses, the nonparametric Mann–Whitney test was used.
RESULTS
Low and ubiquitous expression of mouse EndoV
In mouse, the EndoV gene is made up of nine exons where exon 1–8 cover the conserved Endonuclease core (18,22). Mouse EndoV is expressed as a single isoform containing all nine exons, contrasting the situation in human cells where a multitude of human ENDOV transcript variants is found (18,25). Mouse EndoV has identical inosine-specificity as human ENDOV and cleaves the same RNA substrates, but with reduced efficiency (22). We performed RT-qPCR with exon 3 primers and detected EndoV mRNA in all tissues tested (cycle threshold (Ct) values > 30). We used eukaryotic elongation factor 2 (Eef2) as a reference gene for normalization and found highest level in testis, intermediate in internal organs like liver, lung, kidney and spleen and lowest amount in muscle (Figure 1A), which correlates well with previous results (36).
Figure 1.

Endogenous and ectopic expression of mouse EndoV. (A) Expression of EndoV mRNA in various mouse tissues as quantified by RT-qPCR. The values are relative to muscle tissue which was set to 1. (B) Schematic presentation of wild type and EndoV−/− genomic loci. (C) Genotyping of EndoV mutant (−/−), wild type (+/+), and heterozygote (+/−) alleles (expected size are 400 bp for EndoV−/− and 216 for wild type). (D) Immunoprecipitated proteins from wild type (WT) and EndoV−/− (−/−) tissues were subjected to EndoV activity assay using a 32P-labeled single stranded inosine-containing RNA substrate. Cleaved fragments (EV products) were separated from intact substrate by polyacrylamide gel electrophoresis. Glyphs to the right of the gel picture indicate the full-length and cleaved RNA substrates. Recombinant human EndoV (rEV) was used as a positive control in the IP and activity assays. (E) HEK 293T cells transiently transfected with a plasmid expressing mouse EndoV fused to GFP were left untreated (UT) or exposed to arsenite (Ars; 0.5 mM, 30 min), fixed and processed for confocal microscopy. Cells were stained with G3BP (red) antibody to visualize stress granules. GFP-EndoV is shown in green. Localization of proteins was observed by confocal microscopy (Zeiss) using 63× oil objective. Scale bar, 10 μm.
To date, EndoV mutants have not been ascribed clear phenotypes and no mammalian model exists. We established a mouse EndoV knockout strain by homologous recombination in embryonic stem cells deleting exons 3, 4 and 5 (EndoV−/−; Figure 1B and C). EndoV-deficient mice were born at expected Mendelian frequency and had normal growth, development (Supplementary Figure S1A–C, Supplementary Table S2) and life expectancy up to 20 months (data not shown). Basic metabolism (Supplementary Table S2) as well as various behavior parameters (physical performance, anxiety and olfaction) were similar in wild type and EndoV−/− mice (Supplementary Figure S1D–K).
To check whether endogenous mouse EndoV protein had the same inosine-specificity as the recombinant murine enzyme (22), immunoprecipitation (IP) was performed prior to activity measurement. Cleavage of the inosine-containing RNA substrate by immunoprecipitated EndoV was found for all tissues tested (liver, spleen, testis, heart, brain, thymus and kidney; Figure 1D). Corresponding samples from the EndoV−/− mice showed no activity, confirming that mouse EndoV indeed is responsible for the inosine-RNA cleavage. Some unspecific degradation of the RNA substrate is visible in all lanes from both genotypes confirming comparable input in all samples (Figure 1D). This occurs probably due to co-purifing ribonucleases. Finally, in agreement with published data for human EndoV (23,26), murine EndoV transiently expressed in HEK 293T cells is mainly cytoplasmic and re-localizes to stress-granules after oxidative stress (Figure 1E). In conclusion, mouse EndoV is a cytoplasmic inosine-specific ribonuclease expressed at low levels that is relocated upon stress.
RNA analyses in the liver of EndoV−/− mice
To assess if EndoV ablation affects basal gene expression, we performed RNA sequencing of liver mRNA from 12 months old animals. Overall, mRNA levels in EndoV−/− mice were only modestly changed and ∼150 genes were found differentially expressed in the two genotypes with a most/least fold change: +3.64/−1.96 (see Supplementary Table S3 for the top 15 up/down regulated genes). It appears that EndoV ablation does not substantially affect gene expression at basal conditions.
As EndoV has specificity for inosines in RNA, we measured inosine levels in RNA by mass spectrometry. Liver total RNA, mRNA, long and short RNA showed no difference between the two genotypes (Figure 2A). Short RNAs had ∼20× higher number of inosines than total RNA which can be ascribed to wobble inosines in tRNA. Also, for another tissue (spleen), there were no difference in inosine levels in total RNA between the two genotypes (Figure 2A). As EndoV in bacteria is active on DNA, we measured inosines in liver genomic DNA. Also here the two genotypes had same inosine values (Figure 2A).
Figure 2.

Inosines in mouse RNAs. (A) Nucleic acids were isolated from liver, spleen or kidney from wild type and EndoV−/− mice (n = 5–8) and subjected to mass spectrometry for direct quantification of inosines. x = 104 for RNA, x = 106 for DNA, nt = nucleotides, tot = total. (B) Site-specific A-to-I editing in Cog3(I635V), Copa(I164V) and Flnb(Q2272R) liver mRNA from wild type and EndoV−/− mice (n = 3) was analyzed after reversed transcription of liver RNA, PCR amplification and direct DNA sequencing of the PCR products. A-to-G mutations were identified and the editing level determined by the relative peak height of G related to A+G at the specific position (in %). (C) Defined regions of the 3′UTRs of the Rpa1 and Tapbp mRNAs were analyzed for A-to-I hyper editing by DNA sequencing of individual clones (n = 24) obtained after reverse transcription, PCR amplification and subcloning starting with liver RNA. A-to-G mutations were identified as in (B). The average frequency of all A to G mutations per transcript (clone) is shown (in %). Graphs are shown as means ± SEM for A and B, and as means ± SD for C.
As the overall inosine content in RNA was similar in wild type and EndoV−/− mice, we analyzed defined positions in liver mRNA known to be A-to-I edited (37). To identify site-specific editing, we performed RT-qPCR and DNA sequencing of some A-to-I edited sites of the following genes: antizyme inhibitor (Azin1: S367G), bladder cancer associated protein (Blcap: Y2C, Q5R, K15R), E-cadherin (Cdh1:5′UTR), coatomer protein complex subunit α (Copa: I164V), component of oligomeric Golgi complex 3 (Cog3: I635V) and filamin β (Flnb: Q2272R). Editing of these sites gives non-synonymous changes except for Cdh1, where editing is in the 5′UTR. In mice, A-to-I editing was detected in Cog3, Copa and Flnb genes with levels of ∼80%, ∼30% and ∼15% respectively, with no difference between wild type and EndoV−/− mice (Figure 2B). No editing was detected by this method in Azin1, Blcap and Cdh1 genes.
In addition to site-selective editing, ADARs operate by a different mode referred to as hyper-editing (2,38). We analyzed hyper-editing by sequencing parts of the 3′UTRs of replication protein A1 (Rpa1) and Tap associated binding protein (Tapbp) transcripts. Previously reported edited sites were identified as well as several new positions (Supplementary Figure S2A and B). For the 3′UTR stretches analyzed, hyper-editing was close to equal in wild type and EndoV−/− mice (Figure 2C). Rpa1 3′UTR, had close to 4% of all A’s edited, whereas Tapbp editing was ∼1%. In sum, these data indicated that in mice under standard laboratory conditions, EndoV has no or only limited impact on inosine levels or A-to-I editing in mRNA.
Reduced tumorigenesis in EndoV−/− mice
A-to-I editing imbalance is found in several disease states, including cancer and HCC (32). To assess the role of EndoV in HCC, wild type and EndoV−/− mice were given a single dose of DEN and followed for 40 weeks until termination. Weight gain and liver weight/body weight ratio was similar for the two genotypes after this exposure (Figure 3A and B). Gross inspection revealed numerous tumors in the livers of all animals (Figure 3C). Multiplicity and sizes of the liver tumors were determined macroscopically and EndoV−/− tumors were significantly fewer (mean number 11.2 ± 2.0 versus 18.2 ± 1.5 in the wild type; Figure 3D) and smaller (mean diameter 5.6 ± 0.49 mm versus 7.5 ± 0.67 mm in the wild type; Figure 3E) than those in wild type mice. Liver damage analyses as measured by AST and ALT, revealed no significant differences between wild type and EndoV−/− mice (Supplementary Figure S3A and B). No tumors were found in any other organs.
Figure 3.

DEN-induced hepatocarcinogenesis is suppressed by the loss of EndoV. Two-weeks-old EndoV−/− and wild type mice were given a single dose of DEN and followed for 40 weeks. (A) Body weight was determined every week and (B) liver weight relative to body weight was determined at termination. (C) Representative pictures of liver tumors in DEN-treated mice. (D) Liver tumor numbers (>1 mm) per mouse and (E) maximal tumor size (diameter in mm) were determined in each DEN-treated mice group. Graphs are shown as means ± SEM (n = 28–30). (F) Representative images of hematoxylin and eosin (H&E) stained liver sections from DEN-treated wild type and EndoV−/− mice showing both tumor (T) and non-tumor (NT) tissue (42 weeks old). Red dotted line depicts the transition between tumor and non-tumor area. Magnification and scale bar: 10× objective/200 μm (left panel) and 40× objective/50 μm (right panels). (G–H) Level of Afp and Ccnd1 mRNA in non-tumor and tumor tissue in wild type and EndoV−/− mice as analyzed by RT-qPCR. The values are related to the average of wild type NT samples which was set as 1. Graphs are shown as means ± SEM (n = 10). *P < 0.05, **P < 0.01, ***P < 0.001 by Student's t-test.
Histological analyses using H&E staining showed tumors with loss of hepatic architecture and with a high degree of interindividual variations. However, no consistent histological difference was observed between DEN-treated wild type and EndoV−/− mice (Figure 3F). RNA was isolated from the liver lesions macroscopically recognized as tumors or non-tumors, and RT-qPCR was performed. The analysis of the alpha fetoprotein (Afp) gene, a well characterized HCC marker (29), revealed 5–7-fold upregulation of the mRNA levels in tumor tissue in both wild type and EndoV−/− mice (Figure 3G). The proliferation marker Cyclin D1 (Ccnd1) mRNA level was also higher in tumor than non-tumor tissue for both genotypes (Figure 3H), confirming that our macroscopic classification of tumor and non-tumor tissue was appropriate. Expression of EndoV mRNA was unchanged in tumor tissue compared to non-tumor tissue (Supplementary Figure S3C) as also seen in various human cancers (18).
Alteration in gene expression in HCC
Hallmarks of cancer include dysregulation of essential cellular pathways engaged in energetics, cell growth, cell death, signaling, genome instability and inflammation among others. We tested possible involvement of EndoV by measuring mRNA levels of more than 40 genes known to be differently regulated in cancer generally or in HCC specifically. As expected, many of the genes, were up or down regulated in tumor livers compared to non-tumor tissue (Supplementary Table S4). When comparing wild type and EndoV−/− non-tumor samples, mRNA levels were almost the same, similar to what was seen in the RNA sequencing of the healthy livers (Supplementary Table S3). Also for tumor samples, mRNA amounts were equal in wild type and EndoV−/− for most genes except Ccl2, Gdf15, Jkamp, Mapk9, Vegfc and Xbp1 (Figure 4A–H). These genes were upregulated in tumors from wild type but not from EndoV−/− mice. For Ccr2, mRNA levels increased in tumors for both wild type and EndoV, however EndoV−/− tumors had significantly reduced amount of Ccr2 transcripts compared to wild type (Figure 4B). The top up (Serpina1e; a peptidase inhibitor) and down (Slc25a47; a mitochondrial carrier protein) regulated genes from the RNA sequencing analysis (Supplementary Table S3), had same mRNA levels in the DEN mice regardless of genotype and disease state (Supplementary Table S4). This discrepancy could be due to different age of the mice in the analyses or merely be a consequence of the different nature of the two methods.
Figure 4.

mRNA expression in HCC livers Levels of (A) Ccl2, (B) Ccr2, (C) Gdf15, (D) Jkamp, (E) Mapk9, (F) Vegfc, (G) Total Xbp1 and (H) spliced Xbp1 (Xbp1s) mRNA in non-tumor (NT) and tumor (T) liver tissue in wild type and EndoV−/− mice as analyzed by RT-qPCR. The values are related to the average of wild type NT samples which was set as 1. Graphs are shown as means ± SEM (n = 10). *P < 0.05; **P < 0.01 by Student's t-test.
Inflammation in HCC
The Ccl2–Ccr2 signaling pair has been shown to play key roles in cancer by favoring tumor development and subsequent metastasis (39,40). Ccl2 (also known as Mcp1) is expressed in a wide range of cells with the function to attract monocytes and macrophages during inflammation (41,42). Ccl2 exerts its functions by binding to Ccr2 expressed mainly on monocytes and NK cells. As Ccl2 and Ccr2 mRNAs are reduced in EndoV−/− tumors (Figure 4A and B), we evaluated the macrophage population in liver tissue sections from the two genotypes. We found equal number of F4/80 (a general macrophage marker) positive cells in wild type and EndoV−/− non-tumor tissues (Supplementary Figure S4A). In wild type tumors, there were a small reduction of F4/80 positive cells (not statistically significant) despite the increase in Ccl2/Ccr2 mRNA. For EndoV−/− tumors, the number of F4/80 positive cells was similar as in non-tumor tissue. Macrophages can be roughly classified into different subgroups exerting anti-tumor (M1) or pro-tumor activities (M2), where the M2 type often dominates within the tumor microenvironment (43). Indeed, M1 macrophages staining (stained for inducible nitric oxid synthase; iNOS) was almost not detected in neither of the genotypes, whereas CD163 positive M2 macrophages were identified. Tumor tissue from both wild type and EndoV−/− mice had ∼50% weaker M2 signals than non-tumor tissue (statistically significant), but there were no difference between the two genotypes (Supplementary Figure S4B).
Thus, HCC tumors in EndoV−/− mice had reduced expression of Ccl2/Ccr2 as compared to wild type tumors, but despite this, macrophage infiltration seemed similar in the two genotypes.
A-to-I editing in HCC livers
Impairment of the ADAR enzymes is associated with a variety of disorders (11) and in human HCC, differential expression of ADAR yields A-to-I editing imbalance (16,32,33). We measured expression of the constitutive p110 and the interferon inducible p150 Adar1 transcripts (44) in the murine samples and found no changes in tumor versus non-tumor tissues, nor between wild type and EndoV−/−mutant mice (Supplementary Figure S5A and B). The same was the case for Adar2 expression (Supplementary Figure S5C). This differs from the upregulation of ADAR1 and downregulation of ADAR2 found in human HCC (33). To evaluate if ADAR activity was changed, we measured A-to-I site specific editing in Azin1, Blcap, Cdh1, Copa, Cog3 and Flnb transcripts. Dysregulated editing in these transcripts is seen in human HCC (32,45). In the DEN treated mice, A-to-I site-specific editing was detected in the Cog3, Copa and Flnb (Supplementary Figure S5D-F) with the same editing levels as found for non-treated livers (Figure 2B). No editing was found in the Azin1, Blcap and Cdh1 genes, also similar to what was seen in non-treated livers. This contrasts the over-editing of Azin1 found in human HCC (33). It appears that A-to-I editing and inosine levels over all are unaffected by EndoV in mice.
Fine-tuning liver RNA expression
Nuclear retention
A-to-I editing at specific exonic sites has clear recoding properties, however, the role of hyper-editing is less defined, but has been implicated in heterochromatin formation and gene expression (46,47), RNA stability (46,47) and nuclear retention (48–50) among others. A well-studied example of nuclear retention is the mouse cationic transporter Cat2 gene (Slc7a2) for which two transcript variants exist: a nuclear retained version Ctn with a long 3′UTR and a shorter Cat2 transcript (Figure 5A). Upon cellular stress, the 3′UTR of Ctn is cleaved to give rise to Cat2 which is exported to the cytoplasm for synthesis of the amino acid transporter Cat2 (51). By storing Ctn-RNA in the nucleus, cells can rapidly produce Cat2 proteins upon stimuli. The Ctn3′UTR contains three inverted repeat elements (IR1, IR2 and IR3) of SINE origin that are inverted relative to the forward repeat FwR. A-to-I editing by ADAR is found in the FwR and IR2 repeats. To check if EndoV is involved in release of Ctn to the cytoplasm, we measured Ctn and Cat2 mRNA levels by RT-qPCR. The Ctn primers are located in the 3′UTR and are specific for Ctn, whereas the Cat2 primers lie in the open reading frame and amplify both Cat2 and Ctn transcripts. With standard normalization to Eef2, Cat2 and Ctn mRNA levels did not differ between the genotypes and disease state (Figure 5B and C). When directly relating Cat2 and Ctn mRNA levels, we found that the Cat2/Ctn ratio significantly increased in EndoV−/− compared to wild type tumor tissue (1.4 versus 0.8 respectively: Figure 5D). In non-tumor liver tissue the Cat2/Ctn ratio in wild type and EndoV−/− mice were the same (Figure 5D). Sequencing of the FwR and IR2 repeats (Figure 5A) showed the presence of inosine (guanosine) in all 12 known A-to-I edited positions (7 in the Fwd and 2 in the IR2 region; Figure 5E and F). Frequencies of editing varied from 4% up to 55% depending on the specific position. Overall, editing levels were very similar in wild type and EndoV−/− livers and also in non-tumor versus tumor samples, in agreement with our other results (Figure 2, Supplementary Figure S2 and Figure S5). Of note, editing was never higher in EndoV−/− samples, rather a slight decrease was seen (significant for 7 out of 18 samples; Figure 5 E and F). Despite harbouring inosines, it does not appear that EndoV is rigorously cleaving at these residues in the Ctn transcripts.
Figure 5.

Quantification and editing of Cat2 and Ctn transcripts. (A) Schematic presentation of the mouse Cat2 and Ctn2 transcripts including open reading frames and 5′- and 3′ untranslated regions. Positions of the RT-qPCR primers for Cat2 and Ctn are shown as well as the DNA sequences of the FwR and IR2 repeats analyzed for A-to-I editing. Edited adenosines are colored in red and numbered. The drawing is not at scale. (B) Normalized levels of total Cat2+Ctn and (C) Ctn mRNAs as analyzed by RT-qPCR of liver RNA from the DEN-treated mice. (D) Levels of total Cat2 from RT-qPCR was directly related to Ctn mRNA. The values in RT-qPCR are related to the average of wild type non-tumor (NT) samples which was set as 1. Graphs are shown as means ± SEM (n = 10). DNA sequencing of PCR products amplified from Cat2/Ctn cDNA identified A-to-I editing in the (E) FwdR and (F) IR2 regions (n = 5). The peak heights of G related to A+G defined percentage of editing. *P < 0.05; **P < 0.01; ***P < 0.001 by Student's t-test.
Another protein, staphylococcal nuclease and tudor domain containing 1, Snd1, has been linked to degradation of inosine containing transcripts (52). It has also been speculated whether Snd1 could be involve in cleavage of the nuclear retained Ctn-mRNA (2). Snd1 is a multifunctional protein involved in transcription (53), RNA degradation (54), anti-apoptosis (55) and metastasis (56) and contributes in multiple ways in hepatocarcinogenesis (57–59). Further, Morita et al. has previously reported that Snd1 enhances EndoV activity in vitro (24). We measured the Snd1 mRNA levels, and found no difference between the genotypes or disease state (Supplementary Figure S5G), suggesting that Snd1 activity is unaltered in HCC in mice.
tRNA cleavage
Besides its presence in mRNA, inosines are also found in the wobble position of certain tRNAs (60,61) and EndoV can cleave these inosine-tRNAs in vitro (23). Moreover, various tRNA fragments (tRFs) are generated by enzymatic cleavage of the arms of tRNA molecules (62). They are assigned important roles in cells and are often found imbalanced in cancer (62–65). Angiogenin (Ang) is the key enzyme for cleavage of tRNAs in the anticodon loop (66), however, studies do not exclude other enzymes. To assess a potential role for EndoV, liver tRNA isolated from wild type and EndoV−/− mice was subjected to northern blot analyzes. Valin (Val)AAC is one of the 8 tRNAs with inosine in the anticodon and by using a probe recognizing the 5′fragment of ValAAC, weak cleavage products were detected in tumor and non-tumor tissue for both genotypes (Figure 6A). Hence, cleavage of ValAAC tRNA appears independent of EndoV and in fact, quantification revealed that deletion of EndoV gave increased tRNA fragmentation compared to the wild type (Figure 6B). For two other tRNAs with wobble inosine; alanine (AlaAGC 5′: Figure 6A, 3′: data not shown), and arginine (ArgACG 5′ and 3′: data not shown for both), cleavage was not detected in any of the samples. For tRNA without wobble inosine, no fragments were seen for lysine tRNA (LysCTT 5′; data not shown), whereas for leucin (LeuCAG 3′) and glutamate (GluCTC 5′) tRNAs, fragments were found for both tumor and non-tumor tissue in both genotypes (Figure 6A). Also here more fragmentation was found in EndoV−/− than wild type samples for both non-tumor and tumor tissue (Figure 6C and D). The increase seen in EndoV−/− samples in Figure 6B–D was not statistically significant, nevertheless the data point to a trend. All fragments detected, corresponded to the size of tRNA halves for all probes. Due the high sequence homology between the 20 and 30 tRNA genes for each amino acid, the probes likely hybridized to the other similar tRNA isoacceptors as well. For example the leucine isoacceptor LeuAAG, has wobble inosine, and it could be that the LeuCAG probe used, also annealed to this variant. Finally, Ang, the key enzyme for cleavage in the anticodon, is reported to be upregulated in human HCC (67) and could thus be responsible for the increased tRNA cleavage seen in the liver tumors. Surprisingly, Ang transcript levels were decreased in tumor compared to non-tumor tissue in both wild type and EndoV−/− animals (Figure 6E). Notably, recombinant mouse EndoV could cleave arginine tRNAs in vitro using high amounts of enzyme (Supplementary Figure S6). Thus, we can not exclude that endogenous EndoV can cleave certain tRNAs in vivo under the right conditions.
Figure 6.

tRNA halfs as analyzed by northern blot. (A) Representative images of northern blot analyses of total RNA from wild type (WT) and EndoV−/− mice, non-tumor (NT) and tumor tissue (T) using probes for ValAAC5′, AlaAGC5′, LeuCAG3′ and GluCTC5′. Equal loading is shown by ethidium bromide staining of the gel (lower panel). Glyphs to the right of the gel pictures indicate full-length and fragment tRNA species. Quantification of tRNA fragmentation is shown for (B) ValAAC5′, (C) LeuCAG3′and (D) GluCTC5′. Graphs are shown as means ± SEM (n = 6–8). (E) Levels of Ang mRNA as analyzed by RT-qPCR. The values are related to the average of wild type non-tumor (NT) samples which was set as 1. Graphs are shown as means ± SEM (n = 8–10). *P < 0.05; **P < 0.01 by Student's t-test.
In sum, for three of the six tRNAs analyzed, tRNA halves were detected and the amount of them was unchanged by disease state. tRNA cleavage was independent of wobble inosines and surprisingly, slightly increased in the absence of EndoV.
To extend the analyses of tRNA fragmentation, a tRF RT-qPCR array was performed. This method allows the detection and quantification of 88 different tRFs (1′tRF, 3′tRF and 5′tRF; Figure 7A and Supplementary Table S5). tRNA halves generated by cleavage in the anticodon loop were not part of the array. Prior to reverse transcription, the tRFs were demethylated using AlkB dioxygenase to allow efficient reverse transcription. Based on the abundance of the tRFs as quantified by RT-qPCR array, they were grouped into four categories. Overall the distribution of tRFs within the four groups were fairly similar for the two genotypes and disease states with few rare/absent (9–11%; Ct value >35) or very abundant (5–8%; Ct values<25) tRFs. The remaining tRFs could be classified as intermediate low (47–59%; Ct value 30–35) or intermediate high (27–40%; Ct value 25–30) (Figure 7B). Comparing non-tumor and tumor tissue for wild type mice, a tendency was seen where tumors had an increase in the intermediate high group (from 27 to 40%) and a corresponding decrease in the intermediate low group (from 59 to 47%; neither statistically significant). This shift was not seen in the EndoV−/− samples.
Figure 7.

Quantification of tRNA fragments in EndoV−/− liver RNA. (A) Shematic presentation of the different tRFs detected in the array. (B) Distribution of tRFs by abundance as determined by RT-qPCR in the various liver samples. Change in the amount of cellular tRFs presented by Volcano plot after comparison of (C) wild type non-tumor versus EndoV−/− non-tumor, (D) wild type tumor versus wild type non-tumor, (E) tumor versus non-tumor in EndoV−/−mice and (F) wild type tumor versus EndoV−/− tumor. Significant differently regulated tRFs were identified and labeled (1′tRFs = orange, 3′tRFs = blue and 5′tRFs = red), n = 3. The black vertical line indicates a fold-change value of 1. The light blue vertical lines indicate the threshold of fold-change, defined as 2. The red horizontal line indicates the P-value cutoff, defined as 0.05 (by Student's t-test).
Looking at individual tRFs in non-tumor tissue, EndoV−/− livers had a significant increase in ten tRFs compared to wild type livers, but none decreased (Figure 7C, Supplementary Table S6). Of the 10, seven were 3′tRFs (AspGTC, GluCTC/GluTTC, GluTTC/AspGTC, GlyCCC, IleTAT, LeuTAA and SerCGA), two were 5′tRFs (AspGTC and GlyCCC/GlyGCC) and one was 1′tRF (CysGCA). Interstingly, non of these have inosine in the anticodon. In general, the data were skewed to the right and 92% of all tRFs were more abundant in EndoV−/− than in wild type non-tumor livers (although not statistically significant). In wild type tumors, six tRFs were significantly elevated (3′MetCAT, 3′ValTAC, 5′AlaTGC/ProCGG/ProAGG/CysGCA, 5′ValTAC 5′ValTAC/GlnCTG and 5′ValCAC/ValAAC/GlyACC) and two significantly reduced (3′SerTGA and 1′TyrGTA) compared to wild type non-tumor tissue (Figure 7D, Supplementary Table S6). Among these tRNAs only two have codons subjected to adenosine deamination (ProAGG and ValAAC). Also in this comparison the data shifted to the right as the majority of the tRFs (85%) increased in tumor. Notably, such a shift in tRFs was not seen in tumor versus non-tumor tissue from EndoV−/− mice (Figure 7E), nor for EndoV−/− tumors versus wild type tumors (Figure 7F). In the EndoV−/− tumor samples, two tRFs were significantly upregulated (3′GlyCCC and 1′TyrGTA) and three downregulated (3′IleAAT, 3′ThrAGT and 1′HisATG) compared to wild type tumors (Figure 7F, Supplementary Table S6). Of these, two of the downregulated tRFs (IleAAT and ThrAGT) have inosines in the anticodon. To conclude, tRF fragmentation increased in non-tumor livers in the absence of EndoV (Figure 7C) and as wild type livers turned cancerous (Figure 7D). The influence of EndoV on tRNA cleavage is complex and probably not only limited to inosine-containing tRNAs.
EndoV modulates sorafenib sensitivity
HCC is a deadly disease with limited options of approved therapies. The standard choice is the tyrosin kinase inhibitor sorafenib which prolongs survival for about 3 months (30,31). To test if EndoV could modulate cellular sensitivity to sorafenib, we isolated primary tail fibroblasts (TEF) from the mice. TEFs from wild type and EndoV−/− mice proliferated at the same rate (Supplementary Figure S7A), but due to limited dividing capacity of the TEFs, we failed to monitor sorafenib sensitivity. We therefore turned to human cell lines (Hap1) depleted for ENDOV and treated these cells with sorafenib and measured viability. Increasing doses of sorafenib (up to 8 μM), reduced cell viability, but there was no difference between wild type and ENDOV− cells (Supplementary Figure S7B). To evaluate the effect of increased ENDOV levels, we exposed Flp-in T-REx 293 cells stably overexpressing human ENDOV to sorafenib, and measured apoptosis. More cell death was detected in these cells compared to cells with only endogenous levels of ENDOV (control = Flp-in T-Rex 293) (Figure 8A). Cells overexpressing a catalytic inactive form of ENDOV (D52A), had same level of apoptosis as the control cells. Western blot analysis confirmed overexpression of human ENDOV wild type and mutant (D52A) proteins (Figure 8B). These results indicate that ENDOV could be involved in modulating cellular sensitivity to sorafenib and that the catalytic activity is required for this.
Figure 8.
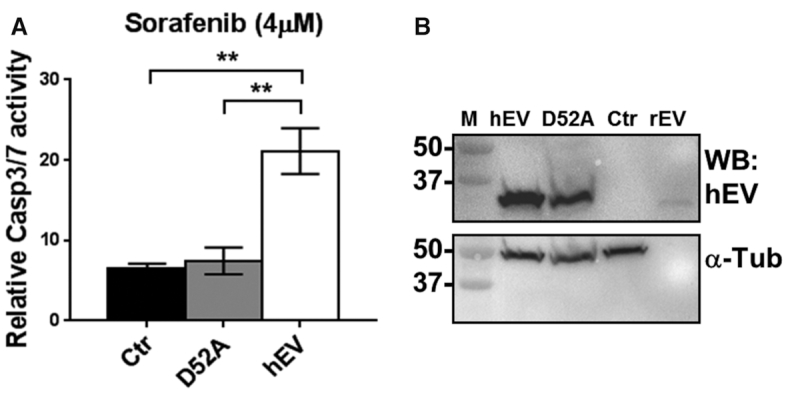
Role of EndoV in apoptosis. (A) Response to sorafenib treatment in human Flp-In T-REx 293 cells overexpressing human Flag-EndoV (hEV; white bar) or human Flag-EndoV D52A (D52A; grey bar). Flp-In T-REx 293 cells are included as a control (Ctr; black bar). Apoptosis was assessed by fluorescently measuring the CASP3/7 activity for 24 h after sorafenib addition (4 μM). CASP3/7 positive cells were normalized to the total number of cells per well and related to the average of untreated sample for each cell line. Graphs are shown as means ± SEM (n = 4). (B) Western blot of Flp-In T-REx cells (Ctr) overexpressing either human Flag-EndoV (hEV) or Flag-EndoV D52A (D52A) probed with a hEndoV antibody (upper panel). Molecular weight marker (M) with sizes (in kDa) is shown to the left. Probing with α-Tubulin (α-Tub) was used as a loading control (lower panel).
DISCUSSION
Despite strong evolutionary conservation of the EndoV proteins and their presence in most organisms, very little is known about the in vivo function. Here, we present the first report on a mammalian EndoV gene knock-out model. We find that EndoV is not essential in mice under standard laboratory conditions and that EndoV−/− mice have a normal life span. When challenged with a carcinogen that causes HCC, the cancer load is suppressed in EndoV−/− mice compared to wild type control mice.
Having in mind the abundance of inosines in RNA and the ability of EndoV to cleave at these residues, we find surprisingly small deviation in the liver transcriptome of EndoV−/− mice. This is probably also reflected in their normal appearance under ordinary laboratory conditions. Moreover, the total inosine-levels and A-to-I editing in RNA were comparable between wild type and EndoV−/− mice, so EndoV function is likely not to be a nuclease for general degradation of inosine-containing transcripts. In addition, low expression, subcellular compartmentalization and intracellular relocalization after stress of EndoV supports this hypothesis. Further, activity might also be regulated by available intracellular metabolites like ATP (26), which is known to fluctuate in cells in response to environmental changes. It could be that EndoV activity is mostly ‘turned off’ in cells. Nevertheless, EndoV could still be important in gene regulation, for example by binding to (without cleaving) inosine-containing RNA and recruiting other proteins, or opposite, hinder the access of other RNA binding/processing proteins. The functional assays presented here (Ctn1-nuclear retention and tRNA cleavage; Figures 5–7) support such a function of EndoV. Several RNA binding proteins are known to affect mRNAs stability to regulate gene expression (51,68,69). Among these are ADAR1 and ADAR2 which enhance the stability of the Ctn transcript (as well as other RNAs), and intriguingly, this appears to be editing-independent (51). It is shown that ADAR competes with HuR, PARN and Staufen for binding at 3′UTRs to control mRNA decay. For example, ADAR prevents Staufen mediated mRNA decay by protecting anti-apoptosis gene transcripts leading to suppression of apoptosis (68). We were not able to detect differences in apoptosis in the mice at the stages the analyses were done, however we cannot exclude that fine-tuning of apoptosis is disturbed at certain points in the EndoV−/− mice.
RNA sequencing showed basically equal mRNA levels in unexposed wild type and EndoV−/− livers (Supplementary Table S3), however, RT-qPCR of the DEN-induced liver tumors revealed differential expression of certain cancer related genes. For all these genes (Vegfc, Jkamp, Mapk9, Xbp1, Gdf15, Ccl2 and Ccr2), EndoV−/− tumors had lower mRNA levels than the corresponding wild type tumors (Figure 4). As not all genes examined were expressed at a lower level in EndoV−/− tumors than in wild type tumors, it could be that EndoV has a specific role in regulation of selected transcripts in HCC. Whether this is linked to inosines, or if it is the expression of these genes that is decreased or the transcript half-life that is reduced, is not known.
Cleaved tRNAs are important signaling molecules in cells affecting vital processes such as translation, proliferation and gene expression. Various positions in tRNAs are subjected to cleavage including the anticodon loop, where the known responsible enzyme is Ang. Ang is frequently upregulated in cancer, but unexpectedly, in our liver tumors Ang mRNA levels were lower than in the surrounding non-tumor tissue. In agreement, tRNA halfs in the tumors tended to be reduced (Figure 6). Further, Ang mRNA levels were not higher in EndoV−/− samples, suggesting that Ang is not responsible for the increased tRNA fragmentation seen in our study. This assumption is based on a correlation between mRNA and protein levels and neglects regulation by the Ang inhibitor Rnh1 (66) which was not addressed here. Interestingly, a recent study also refers to an Ang independent generation of tRNA halfs (70). Nevertheless, in all northern blots, samples without EndoV had more tRNA halfs than the corresponding wild type samples. Likewise, in the tRF array analyses, the levels of most tRFs increased in non-tumor tissue without EndoV (Figure 7C). Fragmentation was found for all types of tRNA, arose from all tRNA arms and was independent of inosines. As EndoV is an inosine specific nuclease in vitro, these results are not easily interpreted. We speculate, as discussed above, whether the in vivo conditions unfavor cleavage by EndoV but allow binding to tRNA and possibly interactions with other proteins. It could be that EndoV has affinity for structural RNAs similarly as seen for structural DNA (18). The 3-dimentional shape of a tRNA molecule has several branches and could represent a corresponding structural entity.
tRFs are induced by stress, but are still found at low levels, generally only 1–2% of the amount of the corresponding full length tRNA. Hence, tRNA cleavage does not shrink the total tRNA pool significantly (71). Taken into account the high copy number of the various tRNAs in cells, we believe the increase/decrease in tRNA fragments we see in our analyses could impact cellular phenotype. Several studies use knock-down of specific tRNA fragments and reveal effects on cell growth, invasion and translation among others (72–75). For example, Honda et al. show that a 50% reduction in tRF reduces proliferation of breast cancer cells. In another study, a 20–30% increase in tRFs was seen after hypoxia which was linked to more metastasis in breast cancer cell lines (73). Interestingly, one study reports that a specific small non-coding RNA from the cyclin D1 promoter region that exists in only 4 copies per cell, has regulatory function on transcription (76).
HCC in human is a diverse disease with complex etiologies, including chronic liver damage, viral infection, alcohol abuse and metabolic syndrome, in addition to several congenital disorders affecting normal liver function (30). Altered ADAR activity and disturbance in A-to-I editing has been shown in many types of human cancers and also HCC, and has been suggested as an important event in cancer development (33). A consistent finding appears to be the site-specific A-to-I editing of the AZIN1 transcript in the initiation and progression of human HCC (77). The editing site is well conserved and ADAR1-specific (77). In line with this, expression of ADAR1 is increased while ADAR2 is decreased in human HCC (33). Interestingly, we did not detect changes in Adar expression, nor editing of Azin1 transcripts in DEN-induced HCC in mice. No other A-to-I edited sites were affected in this HCC-model. Although widely used, DEN-treatment might not be the best suited approach to study the role of A-to-I editing in HCC. Furthermore, there is conflicting evidence regarding the ratio of inosines in tumor and non-tumor tissue (78) and in a recent study, Qi et al. showed that the importance of ADARs in HCC extends beyond their A-to-I editing function. ADARs were found to regulate gene expression through the RNAi machinery and through interactions with other RNA processing enzymes in an editing and RNA binding independent manner (79). Clearly, the functional significance of ADARs is much more multifaceted than previously anticipated.
We hypothesized that ablation of EndoV in mice would affect HCC development due to altered A-to-I editing. As DEN-induced HCC did not affect editing events, it was surprising that loss of EndoV dampened the cancer burden in our model. Liver tumors from the EndoV−/− mice had lower levels of some key HCC genes than wild type tumors, however, other genes were expressed at the same level in both genotypes (for example BclXL, Mmp12, Cdh1, Igf2 and G6pdx). Whether this reflects careful selection of transcripts by EndoV or merely is a result of the different degree/phases of the tumors is currently unknown. Further, we found imbalanced tRNA fragmentation in the absence of EndoV (Figures 6 and 7) and one of the described functions of tRFs is transcriptional gene silencing (62). Thus, the down regulation of genes in the EndoV−/− tumors could be a consequence of changes of the available tRF pool. Indeed, such a scenario is seen for the RNA binding protein YBX1 which in breast cancer is displaced from oncogenic transcripts by tRNA fragments, leading to transcript destabilization and also tumor suppression (73).
Our data suggest that EndoV is involved in the development of HCC in mice. Moreover, overexpression of EndoV in human cells increases sensitivity towards current treatment for HCC, sorafenib. This illustrates the complexity of HCC and that knowledge at a molecular level is important for management of this deadly disease.
DATA AVAILABILITY
The RNA seq data has GEO-number GSE144779 and is accessible at: https://www.ncbi.nlm.nih.gov/geo/query/acc.cgi.
Supplementary Material
ACKNOWLEDGEMENTS
We thank Hanne Korvald for assistance in RT-qPCR, Therese Christensen for assistance with the transgenic mice and Jonas Øgaard for analyzing the histological sections with the Z9 platform. The LC-MS/MS analyses was performed by the Proteomics and Modomics Experimental Core Facility (PROMEC), Norwegian University of Science and Technology (NTNU). PROMEC is funded by the Faculty of Medicine and Health Sciences at NTNU and the Central Norway Regional Health Authority.
SUPPLEMENTARY DATA
Supplementary Data are available at NAR Online.
FUNDING
Norwegian Cancer Society [5739724]; Norwegian Research Council [250474, 144245]; Health Authority South East [2017088, 2018084, 2018064]. Funding for open access charge: Norwegian Research Council [250474].
Conflict of interest statement. None declared.
REFERENCES
- 1. Gray M.W. Evolutionary origin of RNA editing. Biochemistry. 2012; 51:5235–5242. [DOI] [PubMed] [Google Scholar]
- 2. Nishikura K. A-to-I editing of coding and non-coding RNAs by ADARs. Nat. Rev. Mol. Cell Bio. 2016; 17:83–96. [DOI] [PMC free article] [PubMed] [Google Scholar]
- 3. Bass B.L., Nishikura K., Keller W., Seeburg P.H., Emeson R.B., O’Connell M.A., Samuel C.E., Herbert A.. A standardized nomenclature for adenosine deaminases that act on RNA. RNA. 1997; 3:947–949. [PMC free article] [PubMed] [Google Scholar]
- 4. Alseth I., Dalhus B., Bjoras M.. Inosine in DNA and RNA. Curr. Opin. Genet. Dev. 2014; 26:116–123. [DOI] [PubMed] [Google Scholar]
- 5. Maas S., Rich A.. Changing genetic information through RNA editing. BioEssays: News Rev. Mol. Cell Dev. Biol. 2000; 22:790–802. [DOI] [PubMed] [Google Scholar]
- 6. Rueter S.M., Dawson T.R., Emeson R.B.. Regulation of alternative splicing by RNA editing. Nature. 1999; 399:75–80. [DOI] [PubMed] [Google Scholar]
- 7. Kawahara Y., Zinshteyn B., Sethupathy P., Iizasa H., Hatzigeorgiou A.G., Nishikura K.. Redirection of silencing targets by adenosine-to-inosine editing of miRNAs. Science. 2007; 315:1137–1140. [DOI] [PMC free article] [PubMed] [Google Scholar]
- 8. Bazak L., Haviv A., Barak M., Jacob-Hirsch J., Deng P., Zhang R., Isaacs F.J., Rechavi G., Li J.B., Eisenberg E. et al.. A-to-I RNA editing occurs at over a hundred million genomic sites, located in a majority of human genes. Gen. Res. 2014; 24:365–376. [DOI] [PMC free article] [PubMed] [Google Scholar]
- 9. Picardi E., Manzari C., Mastropasqua F., Aiello I., D’Erchia A.M., Pesole G.. Profiling RNA editing in human tissues: towards the inosinome Atlas. Sci. Rep. 2015; 5:14941. [DOI] [PMC free article] [PubMed] [Google Scholar]
- 10. Peng Z., Cheng Y., Tan B.C., Kang L., Tian Z., Zhu Y., Zhang W., Liang Y., Hu X., Tan X. et al.. Comprehensive analysis of RNA-Seq data reveals extensive RNA editing in a human transcriptome. Nat. Biotech. 2012; 30:253–260. [DOI] [PubMed] [Google Scholar]
- 11. Fritzell K., Xu L.D., Lagergren J., Ohman M.. ADARs and editing: the role of A-to-I RNA modification in cancer progression. Sem. Cell Dev. Biol. 2018; 79:123–130. [DOI] [PubMed] [Google Scholar]
- 12. Hartner J.C., Schmittwolf C., Kispert A., Muller A.M., Higuchi M., Seeburg P.H.. Liver disintegration in the mouse embryo caused by deficiency in the RNA-editing enzyme ADAR1. J. Biol. Chem. 2004; 279:4894–4902. [DOI] [PubMed] [Google Scholar]
- 13. Higuchi M., Maas S., Single F.N., Hartner J., Rozov A., Burnashev N., Feldmeyer D., Sprengel R., Seeburg P.H.. Point mutation in an AMPA receptor gene rescues lethality in mice deficient in the RNA-editing enzyme ADAR2. Nature. 2000; 406:78–81. [DOI] [PubMed] [Google Scholar]
- 14. Wang Q., Miyakoda M., Yang W., Khillan J., Stachura D.L., Weiss M.J., Nishikura K.. Stress-induced apoptosis associated with null mutation of ADAR1 RNA editing deaminase gene. J. Biol. Chem. 2004; 279:4952–4961. [DOI] [PubMed] [Google Scholar]
- 15. Rice G.I., Kasher P.R., Forte G.M., Mannion N.M., Greenwood S.M., Szynkiewicz M., Dickerson J.E., Bhaskar S.S., Zampini M., Briggs T.A. et al.. Mutations in ADAR1 cause Aicardi-Goutieres syndrome associated with a type I interferon signature. Nat. Genet. 2012; 44:1243–1248. [DOI] [PMC free article] [PubMed] [Google Scholar]
- 16. Chen L., Li Y., Lin C.H., Chan T.H., Chow R.K., Song Y., Liu M., Yuan Y.F., Fu L., Kong K.L. et al.. Recoding RNA editing of AZIN1 predisposes to hepatocellular carcinoma. Nat. Med. 2013; 19:209–216. [DOI] [PMC free article] [PubMed] [Google Scholar]
- 17. Yao M., Hatahet Z., Melamede R.J., Kow Y.W.. Purification and characterization of a novel deoxyinosine-specific enzyme, deoxyinosine 3′ endonuclease, from Escherichia coli. J. Biol. Chem. 1994; 269:16260–16268. [PubMed] [Google Scholar]
- 18. Fladeby C., Vik E.S., Laerdahl J.K., Gran N.C., Heggelund J.E., Thorgaard E., Strom-Andersen P., Bjoras M., Dalhus B., Alseth I.. The human homolog of Escherichia coli endonuclease V is a nucleolar protein with affinity for branched DNA structures. PLoS One. 2012; 7:e47466. [DOI] [PMC free article] [PubMed] [Google Scholar]
- 19. Feng H., Klutz A.M., Cao W.. Active site plasticity of endonuclease V from Salmonella typhimurium. Biochemistry. 2005; 44:675–683. [DOI] [PubMed] [Google Scholar]
- 20. Huang J., Lu J., Barany F., Cao W.. Multiple cleavage activities of endonuclease V from Thermotoga maritima: recognition and strand nicking mechanism. Biochemistry. 2001; 40:8738–8748. [DOI] [PubMed] [Google Scholar]
- 21. Kiyonari S., Egashira Y., Ishino S., Ishino Y.. Biochemical characterization of endonuclease V from the hyperthermophilic archaeon Pyrococcus furiosus. J. Biochem. 2014; 155:325–333. [DOI] [PubMed] [Google Scholar]
- 22. Nawaz M.S., Vik E.S., Ronander M.E., Solvoll A.M., Blicher P., Bjoras M., Alseth I., Dalhus B.. Crystal structure and MD simulation of mouse EndoV reveal wedge motif plasticity in this inosine-specific endonuclease. Sci. Rep. 2016; 6:24979. [DOI] [PMC free article] [PubMed] [Google Scholar]
- 23. Vik E.S., Nawaz M.S., Strom A.P., Fladeby C., Bjoras M., Dalhus B., Alseth I.. Endonuclease V cleaves at inosines in RNA. Nat. Commun. 2013; 4:2271. [DOI] [PMC free article] [PubMed] [Google Scholar]
- 24. Morita Y., Shibutani T., Nakanishi N., Nishikura K., Iwai S., Kuraoka I.. Human endonuclease V is a ribonuclease specific for inosine-containing RNA. Nat. Commun. 2013; 4:2273. [DOI] [PMC free article] [PubMed] [Google Scholar]
- 25. Berges N., Nawaz M.S., Borresdatter Dahl T., Hagen L., Bjoras M., Laerdahl J.K., Alseth I.. Complex alternative splicing of human Endonuclease V mRNA, but evidence for only a single protein isoform. PLoS One. 2019; 14:e0225081. [DOI] [PMC free article] [PubMed] [Google Scholar]
- 26. Nawaz M.S., Vik E.S., Berges N., Fladeby C., Bjoras M., Dalhus B., Alseth I.. Regulation of human endonuclease V activity and relocalization to cytoplasmic stress granules. J. Biol. Chem. 2016; 291:21786–21801. [DOI] [PMC free article] [PubMed] [Google Scholar]
- 27. Schouten K.A., Weiss B.. Endonuclease V protects Escherichia coli against specific mutations caused by nitrous acid. Mut. Res. 1999; 435:245–254. [DOI] [PubMed] [Google Scholar]
- 28. Garcia-Caballero D., Perez-Moreno G., Estevez A.M., Ruiz-Perez L.M., Vidal A.E., Gonzalez-Pacanowska D.. Insights into the role of endonuclease V in RNA metabolism in Trypanosoma brucei. Sci. Rep. 2017; 7:8505. [DOI] [PMC free article] [PubMed] [Google Scholar]
- 29. Singh A.K., Kumar R., Pandey A.K.. Hepatocellular carcinoma: causes, mechanism of progression and biomarkers. Curr. Chem. Gen. Transl. Med. 2018; 12:9–26. [DOI] [PMC free article] [PubMed] [Google Scholar]
- 30. Llovet J.M., Zucman-Rossi J., Pikarsky E., Sangro B., Schwartz M., Sherman M., Gores G.. Hepatocellular carcinoma. Nat. Rev.Dis. Primers. 2016; 2:1–23. [DOI] [PubMed] [Google Scholar]
- 31. Llovet J.M., Ricci S., Mazzaferro V., Hilgard P., Gane E., Blanc J.F., de Oliveira A.C., Santoro A., Raoul J.L., Forner A. et al.. Sorafenib in advanced hepatocellular carcinoma. N. Engl. J. Med. 2008; 359:378–390. [DOI] [PubMed] [Google Scholar]
- 32. Qi L., Chan T.H., Tenen D.G., Chen L.. RNA editome imbalance in hepatocellular carcinoma. Cancer Res. 2014; 74:1301–1306. [DOI] [PubMed] [Google Scholar]
- 33. Chan T.H., Lin C.H., Qi L., Fei J., Li Y., Yong K.J., Liu M., Song Y., Chow R.K., Ng V.H. et al.. A disrupted RNA editing balance mediated by ADARs (adenosine deaminases that act on RNA) in human hepatocellular carcinoma. Gut. 2014; 63:832–843. [DOI] [PMC free article] [PubMed] [Google Scholar]
- 34. Shi L., Yan P., Liang Y., Sun Y., Shen J., Zhou S., Lin H., Liang X., Cai X.. Circular RNA expression is suppressed by androgen receptor (AR)-regulated adenosine deaminase that acts on RNA (ADAR1) in human hepatocellular carcinoma. Cell Death Dis. 2017; 8:e3171. [DOI] [PMC free article] [PubMed] [Google Scholar]
- 35. Kim D., Pertea G., Trapnell C., Pimentel H., Kelley R., Salzberg S.L.. TopHat2: accurate alignment of transcriptomes in the presence of insertions, deletions and gene fusions. Gen. Biol. 2013; 14:R36–R36. [DOI] [PMC free article] [PubMed] [Google Scholar]
- 36. Moe A., Ringvoll J., Nordstrand L.M., Eide L., Bjoras M., Seeberg E., Rognes T., Klungland A.. Incision at hypoxanthine residues in DNA by a mammalian homologue of the Escherichia coli antimutator enzyme endonuclease V. Nucleic Acids Res. 2003; 31:3893–3900. [DOI] [PMC free article] [PubMed] [Google Scholar]
- 37. Pinto Y., Cohen H.Y., Levanon E.Y.. Mammalian conserved ADAR targets comprise only a small fragment of the human editosome. Gen. Biol. 2014; 15:R5. [DOI] [PMC free article] [PubMed] [Google Scholar]
- 38. Wagner R.W., Smith J.E., Cooperman B.S., Nishikura K.. A double-stranded RNA unwinding activity introduces structural alterations by means of adenosine to inosine conversions in mammalian cells and Xenopus eggs. Proc. Natl. Acad. Sci. U.S.A. 1989; 86:2647–2651. [DOI] [PMC free article] [PubMed] [Google Scholar]
- 39. Zhao L., Lim S.Y., Gordon-Weeks A.N., Tapmeier T.T., Im J.H., Cao Y., Beech J., Allen D., Smart S., Muschel R.J.. Recruitment of a myeloid cell subset (CD11b/Gr1 mid) via CCL2/CCR2 promotes the development of colorectal cancer liver metastasis. Hepatology. 2013; 57:829–839. [DOI] [PubMed] [Google Scholar]
- 40. Zhuang H., Cao G., Kou C., Liu T.. CCL2/CCR2 axis induces hepatocellular carcinoma invasion and epithelial-mesenchymal transition in vitro through activation of the Hedgehog pathway. Oncol. Rep. 2018; 39:21–30. [DOI] [PMC free article] [PubMed] [Google Scholar]
- 41. Yoshimura T. The production of monocyte chemoattractant protein-1 (MCP-1)/CCL2 in tumor microenvironments. Cytokine. 2017; 98:71–78. [DOI] [PubMed] [Google Scholar]
- 42. Yoong K.F., Afford S.C., Jones R., Aujla P., Qin S., Price K., Hubscher S.G., Adams D.H.. Expression and function of CXC and CC chemokines in human malignant liver tumors: a role for human monokine induced by gamma-interferon in lymphocyte recruitment to hepatocellular carcinoma. Hepatology. 1999; 30:100–111. [DOI] [PubMed] [Google Scholar]
- 43. Capece D., Fischietti M., Verzella D., Gaggiano A., Cicciarelli G., Tessitore A., Zazzeroni F., Alesse E.. The inflammatory microenvironment in hepatocellular carcinoma: a pivotal role for tumor-associated macrophages. Biomed Res. Int. 2013; 2013:187204. [DOI] [PMC free article] [PubMed] [Google Scholar]
- 44. Patterson J.B., Samuel C.E.. Expression and regulation by interferon of a double-stranded-RNA-specific adenosine deaminase from human cells: evidence for two forms of the deaminase. Mol. Cell. Biol. 1995; 15:5376–5388. [DOI] [PMC free article] [PubMed] [Google Scholar]
- 45. Hu X., Wan S., Ou Y., Zhou B., Zhu J., Yi X., Guan Y., Jia W., Liu X., Wang Q. et al.. RNA over-editing of BLCAP contributes to hepatocarcinogenesis identified by whole-genome and transcriptome sequencing. Cancer Lett. 2015; 357:510–519. [DOI] [PubMed] [Google Scholar]
- 46. Sakurai M., Shiromoto Y., Ota H., Song C., Kossenkov A.V., Wickramasinghe J., Showe L.C., Skordalakes E., Tang H.Y., Speicher D.W. et al.. ADAR1 controls apoptosis of stressed cells by inhibiting Staufen1-mediated mRNA decay. Nat. Struct. Mol. Biol. 2017; 24:534–543. [DOI] [PMC free article] [PubMed] [Google Scholar]
- 47. Wang I.X., So E., Devlin J.L., Zhao Y., Wu M., Cheung V.G.. ADAR regulates RNA editing, transcript stability, and gene expression. Cell Rep. 2013; 5:849–860. [DOI] [PMC free article] [PubMed] [Google Scholar]
- 48. Chen L.L., DeCerbo J.N., Carmichael G.G.. Alu element-mediated gene silencing. EMBO J. 2008; 27:1694–1705. [DOI] [PMC free article] [PubMed] [Google Scholar]
- 49. Prasanth K.V., Prasanth S.G., Xuan Z., Hearn S., Freier S.M., Bennett C.F., Zhang M.Q., Spector D.L.. Regulating gene expression through RNA nuclear retention. Cell. 2005; 123:249–263. [DOI] [PubMed] [Google Scholar]
- 50. Zhang Z., Carmichael G.G.. The fate of dsRNA in the nucleus: a p54(nrb)-containing complex mediates the nuclear retention of promiscuously A-to-I edited RNAs. Cell. 2001; 106:465–475. [DOI] [PubMed] [Google Scholar]
- 51. Anantharaman A., Gholamalamdari O., Khan A., Yoon J.H., Jantsch M.F., Hartner J.C., Gorospe M., Prasanth S.G., Prasanth K.V.. RNA-editing enzymes ADAR1 and ADAR2 coordinately regulate the editing and expression of Ctn RNA. FEBS Lett. 2017; 591:2890–2904. [DOI] [PMC free article] [PubMed] [Google Scholar]
- 52. Scadden A.D. The RISC subunit Tudor-SN binds to hyper-edited double-stranded RNA and promotes its cleavage. Nat. Struct. Mol. Biol. 2005; 12:489–496. [DOI] [PubMed] [Google Scholar]
- 53. Yang J., Aittomaki S., Pesu M., Carter K., Saarinen J., Kalkkinen N., Kieff E., Silvennoinen O.. Identification of p100 as a coactivator for STAT6 that bridges STAT6 with RNA polymerase II. EMBO J. 2002; 21:4950–4958. [DOI] [PMC free article] [PubMed] [Google Scholar]
- 54. Caudy A.A., Ketting R.F., Hammond S.M., Denli A.M., Bathoorn A.M., Tops B.B., Silva J.M., Myers M.M., Hannon G.J., Plasterk R.H.. A micrococcal nuclease homologue in RNAi effector complexes. Nature. 2003; 425:411–414. [DOI] [PubMed] [Google Scholar]
- 55. Sundstrom J.F., Vaculova A., Smertenko A.P., Savenkov E.I., Golovko A., Minina E., Tiwari B.S., Rodriguez-Nieto S., Zamyatnin A.A. Jr, Valineva T. et al.. Tudor staphylococcal nuclease is an evolutionarily conserved component of the programmed cell death degradome. Nat. Cell Biol. 2009; 11:1347–1354. [DOI] [PubMed] [Google Scholar]
- 56. Santhekadur P.K., Akiel M., Emdad L., Gredler R., Srivastava J., Rajasekaran D., Robertson C.L., Mukhopadhyay N.D., Fisher P.B., Sarkar D.. Staphylococcal nuclease domain containing-1 (SND1) promotes migration and invasion via angiotensin II type 1 receptor (AT1R) and TGFbeta signaling. FEBS Open Biol. 2014; 4:353–361. [DOI] [PMC free article] [PubMed] [Google Scholar]
- 57. Jariwala N., Rajasekaran D., Srivastava J., Gredler R., Akiel M.A., Robertson C.L., Emdad L., Fisher P.B., Sarkar D.. Role of the staphylococcal nuclease and tudor domain containing 1 in oncogenesis (review). Int. J. Onc. 2015; 46:465–473. [DOI] [PMC free article] [PubMed] [Google Scholar]
- 58. Santhekadur P.K., Das S.K., Gredler R., Chen D., Srivastava J., Robertson C., Baldwin A.S. Jr, Fisher P.B., Sarkar D.. Multifunction protein staphylococcal nuclease domain containing 1 (SND1) promotes tumor angiogenesis in human hepatocellular carcinoma through novel pathway that involves nuclear factor kappaB and miR-221. J. Biol. Chem. 2012; 287:13952–13958. [DOI] [PMC free article] [PubMed] [Google Scholar]
- 59. Yoo B.K., Santhekadur P.K., Gredler R., Chen D., Emdad L., Bhutia S., Pannell L., Fisher P.B., Sarkar D.. Increased RNA-induced silencing complex (RISC) activity contributes to hepatocellular carcinoma. Hepatology. 2011; 53:1538–1548. [DOI] [PMC free article] [PubMed] [Google Scholar]
- 60. Su A.A., Randau L.. A-to-I and C-to-U editing within transfer RNAs. Biochemistry (Mosc.). 2011; 76:932–937. [DOI] [PubMed] [Google Scholar]
- 61. Lim V.I. Analysis of action of the wobble adenine on codon reading within the ribosome. J. Mol. Biol. 1995; 252:277–282. [DOI] [PubMed] [Google Scholar]
- 62. Sun C., Fu Z., Wang S., Li J., Li Y., Zhang Y., Yang F., Chu J., Wu H., Huang X. et al.. Roles of tRNA-derived fragments in human cancers. Cancer Lett. 2018; 414:16–25. [DOI] [PubMed] [Google Scholar]
- 63. Goodarzi H., Nguyen H.C., Zhang S., Dill B.D., Molina H., Tavazoie S.F.. Modulated expression of specific tRNAs drives gene expression and cancer progression. Cell. 2016; 165:1416–1427. [DOI] [PMC free article] [PubMed] [Google Scholar]
- 64. Lee Y.S., Shibata Y., Malhotra A., Dutta A.. A novel class of small RNAs: tRNA-derived RNA fragments (tRFs). Genes Dev. 2009; 23:2639–2649. [DOI] [PMC free article] [PubMed] [Google Scholar]
- 65. Zhao H., Bojanowski K., Ingber D.E., Panigrahy D., Pepper M.S., Montesano R., Shing Y.. New role for tRNA and its fragment purified from human urinary bladder carcinoma conditioned medium: inhibition of endothelial cell growth. J. Cell Biochem. 1999; 76:109–117. [DOI] [PubMed] [Google Scholar]
- 66. Yamasaki S., Ivanov P., Hu G.F., Anderson P.. Angiogenin cleaves tRNA and promotes stress-induced translational repression. J. Cell Biol. 2009; 185:35–42. [DOI] [PMC free article] [PubMed] [Google Scholar]
- 67. Hisai H., Kato J., Kobune M., Murakami T., Miyanishi K., Takahashi M., Yoshizaki N., Takimoto R., Terui T., Niitsu Y.. Increased expression of angiogenin in hepatocellular carcinoma in correlation with tumor vascularity. Clin. Cancer Res. 2003; 9:4852–4859. [PubMed] [Google Scholar]
- 68. Shevchenko G., Morris K.V.. All I’s on the RADAR: role of ADAR in gene regulation. FEBS Lett. 2018; 592:2860–2873. [DOI] [PMC free article] [PubMed] [Google Scholar]
- 69. Kishore S., Luber S., Zavolan M.. Deciphering the role of RNA-binding proteins in the post-transcriptional control of gene expression. Brief. Funct. Gen. 2010; 9:391–404. [DOI] [PMC free article] [PubMed] [Google Scholar]
- 70. Krishna S., Yim D.G., Lakshmanan V., Tirumalai V., Koh J.L., Park J.E., Cheong J.K., Low J.L., Lim M.J., Sze S.K. et al.. Dynamic expression of tRNA-derived small RNAs define cellular states. EMBO Rep. 2019; 20:e47789. [DOI] [PMC free article] [PubMed] [Google Scholar]
- 71. Saikia M., Krokowski D., Guan B.J., Ivanov P., Parisien M., Hu G.F., Anderson P., Pan T., Hatzoglou M.. Genome-wide identification and quantitative analysis of cleaved tRNA fragments induced by cellular stress. J. Biol. Chem. 2012; 287:42708–42725. [DOI] [PMC free article] [PubMed] [Google Scholar]
- 72. Honda S., Loher P., Shigematsu M., Palazzo J.P., Suzuki R., Imoto I., Rigoutsos I., Kirino Y.. Sex hormone-dependent tRNA halves enhance cell proliferation in breast and prostate cancers. Proc. Natl. Acad. Sci. U.S.A. 2015; 112:E3816–E3825. [DOI] [PMC free article] [PubMed] [Google Scholar]
- 73. Goodarzi H., Liu X., Nguyen H.C., Zhang S., Fish L., Tavazoie S.F.. Endogenous tRNA-derived fragments suppress breast cancer progression via YBX1 displacement. Cell. 2015; 161:790–802. [DOI] [PMC free article] [PubMed] [Google Scholar]
- 74. Kim H.K., Fuchs G., Wang S., Wei W., Zhang Y., Park H., Roy-Chaudhuri B., Li P., Xu J., Chu K. et al.. A transfer-RNA-derived small RNA regulates ribosome biogenesis. Nature. 2017; 552:57–62. [DOI] [PMC free article] [PubMed] [Google Scholar]
- 75. Huang B., Yang H., Cheng X., Wang D., Fu S., Shen W., Zhang Q., Zhang L., Xue Z., Li Y. et al.. tRF/miR-1280 suppresses stem cell-like cells and metastasis in colorectal cancer. Cancer Res. 2017; 77:3194–3206. [DOI] [PubMed] [Google Scholar]
- 76. Wang X., Arai S., Song X., Reichart D., Du K., Pascual G., Tempst P., Rosenfeld M.G., Glass C.K., Kurokawa R.. Induced ncRNAs allosterically modify RNA-binding proteins in cis to inhibit transcription. Nature. 2008; 454:126–130. [DOI] [PMC free article] [PubMed] [Google Scholar]
- 77. Chen L., Li Y., Lin C.H., Chan T.H.M., Chow R.K.K., Song Y., Liu M., Yuan Y.-F., Fu L., Kong K.L. et al.. Recoding RNA editing of AZIN1 predisposes to hepatocellular carcinoma. Nat. Med. 2013; 19:209. [DOI] [PMC free article] [PubMed] [Google Scholar]
- 78. Paz N., Levanon E.Y., Amariglio N., Heimberger A.B., Ram Z., Constantini S., Barbash Z.S., Adamsky K., Safran M., Hirschberg A. et al.. Altered adenosine-to-inosine RNA editing in human cancer. Genome Res. 2007; 17:1586–1595. [DOI] [PMC free article] [PubMed] [Google Scholar]
- 79. Qi L., Song Y., Chan T.H.M., Yang H., Lin C.H., Tay D.J.T., Hong H., Tang S.J., Tan K.T., Huang X.X. et al.. An RNA editing/dsRNA binding-independent gene regulatory mechanism of ADARs and its clinical implication in cancer. Nucleic Acids Res. 2017; 45:10436–10451. [DOI] [PMC free article] [PubMed] [Google Scholar]
Associated Data
This section collects any data citations, data availability statements, or supplementary materials included in this article.
Supplementary Materials
Data Availability Statement
The RNA seq data has GEO-number GSE144779 and is accessible at: https://www.ncbi.nlm.nih.gov/geo/query/acc.cgi.