

Abstract
The genetic structure of populations of Turnip mosaic virus (TuMV) in East Asia was assessed by making host range and gene sequence comparisons of 118 isolates utilizing a population genetic approach. Most, but not all, isolates collected from Brassica plants in China infected only Brassica plants, whereas those from Japan infected both Brassica and Raphanus (BR) plants. Analyses of the positions of recombination sites in five regions of the genomes (one third of the full sequence) of the many recombinant isolates were fully congruent with the results of phylogenetic analysis, and at least one recombination type pattern was shared between Chinese and Japanese populations. One lineage of nonrecombinant isolates from the basal‐BR lineage was found in 2000 in Kyushu, Japan but none in China, and have since been found over the whole island. The sudden expansion of this basal‐BR population was strongly supported by calculations showing the deviations from the neutral equilibrium model for the individual geographical lineages with overall lack of nucleotide diversity, and by analysis of mismatch distribution. Our study shows that the recent Chinese and Japanese TuMV isolates are part of the same population but are discrete lineages.
Keywords: East Asia, expansion, phylogeography, population, recombination, TuMV
Introduction
Comparisons of the genetic structures of the populations of codistributed species can provide significant insight into the extent to which extrinsic and intrinsic factors interact to affect the geographical scale of population differentiation (Bermingham & Moritz 1998; Campbell et al. 2006). For instance, ecologically and phylogenetically disparate virus populations may exhibit striking concordance in phylogeographical structure across historical barriers to gene flow. Whereas a large number of such studies on the structure of animal and human RNA viruses have been reported, there have been few similar studies of plant RNA viruses (García‐Arenal et al. 2001). In addition, very few studies on genetic populations using sequence‐based analysis have been reported, whereas several studies of plant viruses have used molecular markers (Tsompana et al. 2005).
Turnip mosaic virus (TuMV) was ranked second only to Cucumber mosaic virus (CMV) as the most important virus infecting field‐grown vegetables in a survey of their virus diseases in 28 countries and regions (Tomlinson 1987; Walsh & Jenner 2002). TuMV infects a wide range of plant species, most from the family Brassicaceae. It is probably the most widespread and important virus infecting both crop and ornamental species of this family throughout the world, and especially threatens cultivated brassicas in East Asia (Provvidenti 1996; Tomimura et al. 2003). TuMV belongs to the genus Potyvirus. This is the largest genus of the largest family of plant viruses, the Potyviridae (Shukla et al. 1994; Fauquet et al. 2005), which itself belongs to the picorna‐like supergroup of viruses. TuMV, like other potyviruses, is transmitted by aphids in the nonpersistent manner (Hamlyn 1953). Potyviruses have flexuous filamentous particles 700–750 nm long, each of which contains a single copy of the genome, which is a single‐stranded positive sense RNA molecule of about 10 000 nucleotides (nts). The genomes have terminal untranslated regions flanking a single open reading frame. The single large polyprotein hydrolyses itself after translation into at least 10 proteins (Riechmann et al. 1992; Urcuqui‐Inchima et al. 2001). The protein 1 (P1) gene, situated at 5′ end of the genome, encodes a serine proteinase and is the protein with the greatest between‐species variation. Even though P1 enhances amplification and movement of the virus, it is not strictly required for viral infectivity (Verchot et al. 1992; Klein et al. 1994). The 6K protein 2 (second 6‐kda protein) is involved in viral long‐distance movement and symptom induction (Restrepo‐Hartwig & Carrington 1994). The viral genome‐linked protein (VPg) is a multifunctional protein with several suggested roles in the viral infection cycle; it may act as a primer for RNA replicase during virus multiplication, possibly through direct interaction with the viral RNA polymerase, and it has essential functions in host genotype specificity (Schaad et al. 1997). The nuclear inclusion a proteinase (NIa‐Pro) cleaves the polyprotein (Parks et al. 1995). The coat protein (CP) is involved in aphid transmission, cell‐to‐cell and systemic movement, encapsidation of the viral RNA and regulation of viral RNA amplification (Atreya et al. 1991; Dolja et al. 1994). CP sequences have been studied extensively to assess the difference within and between potyvirus species (Urcuqui‐Inchima et al. 2001).
Phylogeographical analysis looks for congruence between the phylogenetic and geographical relationships of organisms. It thereby elucidates the processes that underlie the genetic diversity of populations in space and time. We therefore decided that to better understand the evolution of host/virus interactions of TuMV, it was important to determine in more detail the molecular changes that occurred during the evolution of its populations. Our earlier studies have shown that the Asian TuMV subpopulation has probably emerged from the more ancient Eurasian subpopulation (2003, 2004). In both regions, Brassica crops are an important component of local agriculture, but in Europe the crops are mostly Brassica species whereas in Asia they are both Brassica and Raphanus species. It is of particular interest to evaluate the impact of recombination in shaping potyvirus populations. However, the structure of potyvirus populations has rarely been analysed at the local scale, so that evolutionary processes determining the population structure of the species are often unknown (Moreno et al. 2004). Although Japan is close to China geographically, there is no evidence for plant virus migration between China and Japan.
There are many reports on ‘emerging’ plant viruses such as begomoviruses (Brown 2001; Briddon & Stanley 2006) and tospoviruses (Moyer 1999). It is relatively easy to identify a ‘new’ emerging virus when it is first introduced into a region; however, a more detailed genetic study of the population is required to identify an ‘emergent’ virus subpopulation when it is mixed with older endemic subpopulation, and there are few reports known to us, of such studies for plant virus species other than CMV (Moreno et al. 2004).
We report here that we have determined and compared gene sequences from c. 120 representative isolates of TuMV from different parts of China and Japan and from different host species, and used these to assess the genetic structure of the population by studies of their recombination, phylogeny, selection, using neutrality tests and mismatch distribution. In addition, we discuss the results in terms of the information they provide about the changes that have occurred during country‐wide evolution, migration and demographic changes in the TuMV populations, resulting in perhaps the most detailed such a study of a plant virus to date.
Materials and methods
Virus isolates and host tests
Details of the TuMV isolates, their country of origin, original host plant, year of isolation, and host type are shown in Table 1, together with details of the isolates for which complete genomic sequences have already been reported (Tomimura et al. 2003; Suehiro et al. 2004; GenBank Accession nos AF394601 and AF394602). All the isolates were inoculated to Chenopodium quinoa and serially cloned through single lesions at least three times. They were propagated in Brassica rapa cv. Hakatasuwari or Nicotiana benthamiana plants. Plants infected systemically with each of the TuMV isolates were homogenized in 0.01 m potassium phosphate buffer (pH 7.0), and the isolates were mechanically inoculated to young plants of B. rapa cv. Hakatasuwari, B. pekinensis cv. Nozaki‐1go, and B. napus cv. Norin‐32go, as well as to Raphanus sativus cvs. Taibyo‐sobutori and Akimasari. Inoculated plants were kept for at least 4 weeks in a glasshouse at 25 °C.
Table 1.
Turnip mosaic virus isolates analysed in this study
| Isolate | Original host | Location (city, prefecture) | Year of collection | Host type* | Reference† | Sequenced region‡ or Accession no. |
|---|---|---|---|---|---|---|
| Japan/Kyushu | ||||||
| 1 J | Raphanus sativus | Saga, Saga | 1977 | BR | (a) | D83184 |
| 59 J | R. sativus | Saga, Saga | 1996 | BR | (b), (e) | AB093620 |
| C42J | Brassica rapa | Saga, Saga | 1993 | B | (b), (e) | AB093625 |
| FD21J | R. sativus | Shime, Fukuoka | 1998 | BR | (b), (d) | AB076416 AB179984 Ab076492 |
| FD27J | R. sativus | Fukuoka, Fukuoka | 1998 | BR | (b), (e) | AB093618 |
| FD997J | R. sativus | Ukiha, Fukuoka | 2001 | BR | AB233078 (P1) AB233126 (Mid) AB233030 (CP) | |
| KD32J | R. sativus | Nankan, Kumamoto | 1998 | BR | (b), (e) | AB093621 |
| KD41J | R. sativus | Taura, Kumamoto | 1998 | BR | AB233079 (P1) AB233127 (Mid) AB233031 (CP) | |
| KD834J | R. sativus | Ichinomiya, Kumamoto | 2000 | BR | AB233080 (P1) AB233128 (Mid) AB233032 (CP) | |
| KD941J | R. sativus | Ueki, Kumamoto | 2001 | BR | AB233081 (P1) AB233129 (Mid) AB233033 (CP) | |
| KD946J | R. sativus | Sakamoto, Kumamoto | 2003 | BR | AB233082 (P1) AB233130 (Mid) AB233034 (CP) | |
| KD980J | R. sativus | Takamori, Kumamoto | 2004 | BR | AB233083 (P1) AB233131 (Mid) AB233035 (CP) | |
| KGB662J | Brassica sp. | Ei, Kagoshima | 2003 | BR | AB233084 (P1) AB233132 (Mid) AB233036 (CP) | |
| KGD54J | R. sativus | Sendai, Kagoshima | 1998 | BR | AB233085 (P1) AB233133 (Mid) AB233037 (CP) | |
| KGD58J | R. sativus | Kanoya, Kagoshima | 1998 | BR | AB233086 (P1) AB233134 (Mid) AB233038 (CP) | |
| KGD661J | R. sativus | Ei, Kagoshima | 2003 | BR | AB233087 (P1) AB233135 (Mid) AB233039 (CP) | |
| KGD851J | R. sativus | Kagoshima, Kagoshima | 2000 | BR | AB233088 (P1) AB233136 (Mid) AB233040 (CP) | |
| KGD852J | R. sativus | Kagoshima, Kagoshima | 2000 | BR | AB233089 (P1) AB233137 (Mid) AB233041 (CP) | |
| KGD946J | R. sativus | Higashi‐sakurajima, | 2001 | BR | AB233090 (P1) AB233138 (Mid) | |
| Kagoshima | AB233042 (CP) | |||||
| KGD947J | R. sativus | Sakurajima, Kagoshima | 2001 | BR | AB233091 (P1) AB233139 (Mid) AB233043 (CP) | |
| KGD948J | R. sativus | Higashi‐sakurajima, Kagoshima | 2001 | BR | AB233092 (P1) AB233140 (Mid) AB233044 (CP) | |
| KGD949J | R. sativus | Sakurajima, Kagoshima | 2001 | BR | AB233093 (P1) AB233141 (Mid) AB233045 (CP) | |
| KGD950J | R. sativus | Aira, Kagoshima | 2001 | BR | AB233094 (P1) AB233142 (Mid) AB233046 (CP) | |
| KGD954J | R. sativus | Sakurajima, Kagoshima | 2001 | BR | AB233095 (P1) AB233143 (Mid) AB233047 (CP) | |
| KGN60J | Brassica sp. | Osumi, Kagoshima | 1998 | BR | AB233096 (P1) AB233144 (Mid) AB233048 (CP) | |
| MC982J | Brassica oleracea | Kitaura, Miyazaki | 2001 | BR | AB233097 (P1) AB233145 (Mid) AB233049 (CP) | |
| MD44J | R. sativus | Nobeoka, Miyazaki | 1998 | BR | AB233098 (P1) AB233146 (Mid) AB233050 (CP) | |
| MD45J | R. sativus | Miyazaki, Miyazaki | 1998 | BR | AB233099 (P1) AB233147 (Mid) AB233051 (CP) | |
| MD47J | R. sativus | Takachiho, Miyazaki | 1998 | BR | AB233100 (P1) AB233148 (Mid) AB233052 (CP) | |
| MD49J | R. sativus | Miyakonojo, Miyazaki | 1998 | BR | AB233101 (P1) AB233149 (Mid) AB233053 (CP) | |
| MD963J | R. sativus | Nobeoka, Miyazaki | 2001 | BR | AB233102 (P1) AB233150 (Mid) AB233054 (CP) | |
| MD964J | R. sativus | Nobeoka, Miyazaki | 2001 | BR | AB233103 (P1) AB233151 (Mid) AB233055 (CP) | |
| MD966J | R. sativus | Tano, Miyazaki | 2001 | BR | AB233104 (P1) AB233152 (Mid) AB233056 (CP) | |
| MD967J | R. sativus | Tsuno, Miyazaki | 2001 | BR | AB233105 (P1) AB233153 (Mid) AB233057 (CP) | |
| MD969J | R. sativus | Kitaura, Miyazaki | 2001 | BR | AB233106 (P1) AB233154 (Mid) AB233058 (CP) | |
| MD971J | R. sativus | Kiyotake, Miyazaki | 2001 | BR | AB233107 (P1) AB233155 (Mid) AB233059 (CP) | |
| MD973J | R. sativus | Sadowara, Miyazaki | 2001 | BR | AB233108 (P1) AB233156 (Mid) AB233060 (CP) | |
| MD974J | R. sativus | Sadowara, Miyazaki | 2001 | BR | AB233109 (P1) AB233157 (Mid) AB233061 (CP) | |
| MD979J | R. sativus | Nobeoka, Miyazaki | 2001 | BR | AB233111 (P1) AB233159 (Mid) AB233063 (CP) | |
| MN43J | Brassica sp. | Nobeoka, Miyazaki | 1998 | BR | (b), (d) | AB076425 AB179989 Ab076501 |
| MN978J | Brassica sp. | Tsuno, Miyazaki | 2001 | BR | AB233110 (P1) AB233158 (Mid) AB233062 (CP) | |
| ND10J | R. sativus | Hirato, Nagasaki | 1998 | BR | (b), (d) | AB076418 AB179985 AB076494 |
| NDJ | R. sativus | Takaki, Nagasaki | 1997 | BR | (b), (e) | AB093616 |
| ND256J | R. sativus | Kinkai, Nagasaki | 2001 | BR | AB233112 (P1) AB233160 (Mid) AB233064 (CP) | |
| ND257J | R. sativus | Takaki, Nagasaki | 2001 | BR | AB233113 (P1) AB233161 (Mid) AB233065 (CP) | |
| ND258J | R. sativus | Higashisonogi, Nagasaki | 2002 | BR | AB233114 (P1) AB233162 (Mid) AB233066 (CP) | |
| ND264J | R. sativus | Kinkai, Nagasaki | 2001 | BR | AB233115 (P1) AB233163 (Mid) AB233067 (CP) | |
| NKJ | B. rapa | Takaki, Nagasaki | 1997 | BR | AB233116 (P1) AB233164 (Mid) AB233068 (CP) | |
| OB995J | Brassica sp. | Hita, Oita | 2001 | BR | AB233117 (P1) AB233165 (Mid) AB233069 (CP) | |
| OB996J | Brassica sp. | Yamaga, Oita | 2001 | BR | AB233118 (P1) AB233166 (Mid) AB233070 (CP) | |
| OD11J | R. sativus | Hiji, Oita | 1998 | BR | (b), (d) | AB076420 AB179986 AB076496 |
| OD14J | R. sativus | Amagase, Oita | 1998 | BR | (b), (d) | AB076422 AB179987 AB076498 |
| OD15J | R. sativus | Hita, Oita | 1998 | BR | AB233119 (P1) AB233167 (Mid) AB233071 (CP) | |
| OD985J | R. sativus | Tsukumi, Oita | 2001 | BR | AB233120 (P1) AB233168 (Mid) AB233072 (CP) | |
| OD993J | R. sativus | Hita, Oita | 2001 | BR | AB233121 (P1) AB233169 (Mid) AB233073 (CP) | |
| OD994J | R. sativus | Yamaga, Oita | 2001 | BR | AB233122 (P1) AB233170 (Mid) AB233074 (CP) | |
| ON16J | B. rapa | Yufuin, Oita | 1998 | BR | (b), (d) | AB076423 AB179988 AB076499 |
| SB20J | Brassica sp. | Yamato, Saga | 2004 | BR | AB233123 (P1) AB233171 (Mid) AB233075 (CP) | |
| SD3J | R. sativus | Saga, Saga | 1996 | BR | (b), (d) | AB076413 AB179983 AB076489 |
| SD22J | R. sativus | Karatsu, Saga | 2004 | BR | AB233124 (P1) AB233172 (Mid) AB233076 (CP) | |
| SN4J | Brassica sp. | Saga, Saga | 1998 | BR | AB233125 (P1) AB233173 (Mid) AB233077 (CP) | |
| ST19J | Brassica juncea | Nabeshima, Saga | 1998 | B | (b), (d) | AB076411 AB179981 AB076487 |
| STD8J | R. sativus | Tosu, Saga | 1997 | BR | (b), (d) | AB076412 AB179982 AB076488 |
| SYN6J | Brassica sp. | Yamato, Saga | 1998 | BR | (b) | AB076414 AB233174 (Mid) AB076490 |
| Japan/Honshu | ||||||
| 2J | Brassica pekinensis | —, Tochigi | 1994 | BR | (b), (e) | AB093622 |
| CP845J | Calendula officinalis | Kisarazu, Chiba | 1997 | BR | (b), (e) | AB093614 |
| DMJ | R. sativus | —, Tochigi | 1996 | BR | (b), (e) | AB093623 |
| Ka1J | B. pekinensis | —, Tochigi | 1994 | BR | (b), (e) | AB093624 |
| KYD81J | R. sativus | Joyo, Kyoto | 1998 | BR | (b), (e) | AB093613 |
| SGD311J | R. sativus | Nishiazai, Shiga | 1998 | BR | (b), (e) | AB093619 |
| TD88J | R. sativus | Tokyo, Tokyo | 1998 | BR | (b), (e) | AB093615 |
| Tu‐2R1 | R. sativus | —, Tochigi | Not known | BR | (c) | AB105135 |
| Tu‐3 | B. oleracea | —, Tochigi | Not known | B | (c) | AB105134 |
| Japan/Hokkaido | ||||||
| HOD517J | R. sativus | Kimobetsu, Hokkaido | 1998 | BR | (b), (e) | AB093617 |
| China/Mainland | ||||||
| CH6 | R. sativus | Zengjiang, Jiangsu | 1999 | BR | (d) | AB179888 AB179939 AB179990 |
| CH7 | R. sativus | Zengjiang, Jiangsu | 1999 | BR | (d) | AB179889 AB179940 AB179991 |
| CH8 | R. sativus | Zengjiang, Jiangsu | 1999 | BR | (d) | AB179890 AB179941 AB179992 |
| CHBJ1 | R. sativus | Beijing | 1999 | BR | (d) | AB179891 AB179942 AB179993 |
| CHBJ2 | R. sativus | Beijing | 1999 | BR | (d) | AB179892 AB179943 AB179994 |
| CHHH29 | Brassica campestris | Hengyang, Hunan | 1999 | B(R) | (d) | AB179893 AB179944 AB179995 |
| CHHH30 | Brassica sp. | Hengyang, Hunan | 1999 | B(R) | (d) | AB179894 AB179945 AB179996 |
| CHHZ3 | Brassica sp. | Zhuzhou, Hunan | 1999 | B | (d) | AB179895 AB179946 AB179997 |
| CHK16 | R. sativus | Guilin, Guangxi | 2000 | BR | (d) | AB179896 AB179947 AB179998 |
| CHK51 | R. sativus | Guilin, Guangxi | 2001 | BR | (d) | AB179897 AB179948 AB179999 |
| CHK55 | B. rapa | Guilin, Guangxi | 2001 | B | (d) | AB179898 AB179949 AB180000 |
| CHL13 | R. sativus | Lushun, Liaoning | 1999 | BR | (d) | AB179899 AB179950 AB180001 |
| CHL14 | R. sativus | Lushun, Liaoning | 1999 | BR | (d) | AB179900 AB179951 AB180002 |
| CHN12 | Not known | Not known | < 1990 | B | (e), (d) | AY090660 |
| CHSC2 | Brassica sp. | Chengdu, Sichuan | 1999 | B(R) | (d) | AB179905 AB179956 AB180007 |
| CHSE1 | Brassica sp. | Emei, Sichuan | 1999 | B | (d) | AB179906 AB179957 AB180008 |
| CHYK19 | Brassica integrifolia | Kunming, Yunnan | 2000 | B | (d) | AB179907 AB179958 AB180009 |
| CHYK20 | B. integrifolia | Kunming, Yunnan | 2000 | B | (d) | AB179908 AB179959 AB180010 |
| CHYK56 | B. rapa | Kunming, Yunnan | 2001 | B(R) | (d) | AB179909 AB179960 AB180011 |
| CHZC1 | B. juncea | Hongzhou, Zhejiang | 1998 | B | (d) | AB179910 AB179961 AB180012 |
| CHZC21 | B. campestris | Cixi, Zhejiang | 1999 | B | (d) | AB179911 AB179962 AB180013 |
| CHZC22 | Brassica sp. | Cixi, Zhejiang | 1999 | B | (d) | AB179912 AB179963 AB180014 |
| CHZH33 | B. juncea | Hongzhou, Zhejiang | 2000 | B | (d) | AB179913 AB179964 AB180015 |
| CHZH34 | B. campestris | Hongzhou, Zhejiang | 2000 | B | (d) | AB179914 AB179965 AB180016 |
| CHZH36 | B. rapa | Hongzhou, Zhejiang | 2000 | BR | (d) | AB179915 AB179966 AB180017 |
| CHZJ23 | R. sativus | Jiande, Zhejiang | 1999 | BR | (d) | AB179916 AB179967 AB180018 |
| CHZJ25 | Brassica sp. | Jiande, Zhejiang | 1999 | B | (d) | AB179917 AB179968 AB180019 |
| CHZJ26 | B. campestris | Jiande, Zhejiang | 1999 | BR | (d) | AB179918 AB179969 AB180020 |
| CHZJ27 | B. campestris | Jiande, Zhejiang | 1999 | B | (d) | AB179919 AB179970 AB180021 |
| HBI2 | B. pekinensis | Hongzhou, Zhejiang | 1998 | B | (d) | AB179920 AB179971 AB180022 |
| HJ1S | B. juncea | Hongzhou, Zhejiang | 1998 | B | (d) | AB076479 AB179972 AB076553 |
| HRD | R. sativus | Hongzhou, Zhejiang | 1998 | BR | (d) | AB093627 |
| HZ5 | R. sativus | Xiaoshan, Zhejiang | 1998 | BR | (d) | AB076481 AB179973 AB076555 |
| HZ6 | Brassica sp. | Xiaoshan, Zhejiang | 1998 | B | (d) | AB179923 AB179974 AB180025 |
| China/Taiwan | ||||||
| C1 | Not known | Not known | Not known | Not known | AF394601 | |
| CHN1 | Brassica sp. | Not known | < 1980 | BR | (b), (e) | AB093626 |
| CHN2 | Brassica sp. | Not known | < 1980 | B | (b), (d) | AB076475 AB179952 AB076549 |
| CHN3 | Brassica sp. | Not known | < 1980 | B | (b), (d) | AB076476 AB179953 AB076550 |
| CHN4 | Brassica sp. | Not known | < 1980 | B | (b), (d) | AB076477 AB179954 AB076551 |
| CHN5 | Brassica sp. | Not known | < 1985 | B | (b), (d) | AB076478 AB179955 AB076552 |
| TW | Not known | Not known | Not known | Not known | AF394602 | |
| Korea | ||||||
| CQS1 | B. pekinensis | Not known | 1998 | B | (d) | AB179924 AB179975 AB180026 |
| RAD1 | R. sativus | Not known | Not known | BR | (d) | AB179925 AB179976 AB180027 |
| RHS1 | R. sativus | Not known | Not known | BR | (d) | AB179926 AB179977 AB180028 |
Host type B; Brassica, isolates infected B. rapa cv. Hakatasuwari systemically with mosaic symptoms in uninoculated leaves. Host type B(R); isolates infected B. rapa systemically with mosaic symptoms in the uninoculated leaves and infected R. sativus cvs. Akimasari and Taibyo‐sobutori only occasionally and latently. Host type BR; isolates infected both B. rapa and R. sativus cvs. Akimasari and Taibyo‐sobutori systemically, with mosaic symptoms in uninoculated leaves.
Reference: (a) Ohshima et al. (1996); (b) Ohshima et al. (2002); (c) Suehiro et al. (2004); (d) Tan et al. (2004); (e) Tomimura et al. (2003).
P1; Mid C‐terminus CI +6K2 + VPg + NIa‐Pro; CP, where we sequenced in this study.
Extraction of viral RNA and sequencing
The viral RNAs were extracted from purified virions (Choi et al. 1977) or TuMV‐infected B. rapa and N. benthamiana leaves using Isogen (Nippon Gene). The RNAs were reverse transcribed and amplified using high‐fidelity Platinum™Pfx DNA polymerase (Invitrogen). The cDNAs were separated by electrophoresis in agarose gels and purified using the QIAquick Gel Extraction Kit (QIAGEN). The purified cDNAs were cloned into pBluescript II SK+. Plasmids were maintained in Escherichia coli XL1‐Blue (Stratagene). Sequences from each isolate were determined using two independent reverse transcription‐polymerase chain reaction (RT‐PCR) products and cloned plasmids. Each cloned plasmid and RT‐PCR product was sequenced by primer walking in both directions using the BigDye Terminator version 3.1 Cycle Sequencing Ready Reaction Kit (Applied Biosystems) and an Applied Biosystems Genetic Analyser DNA Model 310; ambiguous nts in any sequence were checked in sequences obtained from at least four other independent plasmids. Sequence data were assembled using bioedit version 5.0.9 (Hall 1999).
Recombination analyses
The sequences of 196 isolates, collected worldwide, were obtained from the international gene sequence database and used for the recombination analyses. First, we joined the nt sequences of the P1, part C‐terminus of cylindrical inclusion protein (Ct‐CI, 3′ terminal 63 nts), 6K2, VPg, NIa‐Pro and CP genes of each sequence, and called this its ‘concat’, namely a concatenated sequence analogous to a contiguous sequence or ‘contig’. Phylogenies were calculated from 29 equal slices of the aligned gene sequences. Only those from the region around nt 5501–6500 in degapped sequences, which we call region 12 (R12; see Tomimura et al. 2003), and which encodes from the Ct‐CI to the middle of NIa‐Pro nt sequences, gave trees calculated by three different methods [i.e. maximum‐likelihood (ML), maximum parsimony (MP) and neighbour‐joining (NJ), as described below] that were almost identical to those constructed from entire genomic sequences. The concats were used for evolutionary analyses. The corresponding regions of two sequences of Japanese yam mosaic virus (JYMV) (Fuji & Nakamae 1999, 2000), one of Scallion mosaic virus (ScMV) (Chen et al. 2002) and one of Narcissus yellow stripe virus (NYSV) (Chen et al. 2003) were used to align the TuMV concats, as blast searches had shown them to be the sequences in the international sequence databases most closely and consistently related to those of TuMV; TuMV P1 genes were more closely related to those of JYMV than ScMV, whereas for some other TuMV regions/genes such as R12 and the remainder of NIa‐Pro gene it was the converse, except that the TuMV CP gene was most closely related to that of NYSV. We thus aligned all 196 P1 sequences with those of two JYMV isolates as the outgroup, the R12 + Pro sequences with those of JYMV and ScMV, and the CP sequences with that of NYSV using clustal x (Jeanmougin et al. 1998). However, this procedure resulted in some gaps, which were not in multiples of three nts. Therefore, the amino acid sequences corresponding to individual gene regions, together with the appropriate outgroups shown above, were aligned using clustal x with transalign (kindly supplied by Georg Weiller) to maintain the degapped alignment of the encoded amino acids, and then the separate gene regions reassembled to form sequences 3315 nts long. The aligned sequences were checked for incongruent relationships, which might have resulted from recombination, using rdp (Martin & Rybicki 2000), geneconv (Sawyer 1999), bootscan (Salminen et al. 1995), maxchi (Maynard Smith 1992), chimaera (Posada & Crandall 2001) and siscan programs in rdp2 software (Martin et al. 2005), and phylpro (Weiller 1998) and siscan version 2 (Gibbs et al. 2000) programs in the original software. We first checked for incongruent relationships using phylpro and siscan version 2, and then the programs in rdp2, whose analyses were done using default settings for different detection programs and a Bonferroni‐corrected P‐value cut off of 0.05 or 0.01, and then all isolates that had been identified as likely recombinants by the programs in rdp2 were rechecked using phylpro and siscan version 2, reviewing not just the complete nt sequences but also the synonymous (ds) and nonsynonymous (dn) sites separately. In addition, we checked 100 and 50 nt slices of all the sequences for evidence of recombination using the same programs. These analyses also assessed which nonrecombinant sequences have regions that are most closely related to regions of the recombinant sequences, and hence indicate the likely lineages that provided those regions to the recombinants. For simplicity, we call these the ‘parental’ isolates of recombinants, although they are merely those that include the most closely related regions.
Phylogenetic analyses of the world TuMV population
The phylogenetic relationships of the sequences were determined by three methods: the ML algorithm of tree‐puzzle version 5.0 (Strimmer & von Haeseler 1996; Strimmer et al. 1997), the MP algorithm of paup* 4.0 beta version 10 (Swofford 2003) and the NJ algorithm of phylip version 3.5 (Felsenstein 1993). For ML analyses, 100 puzzling steps were calculated using the Hasegawa–Kishino–Yano (HKY) model of substitution (Hasegawa et al. 1985). For MP analyses, the heuristic search option and 100 bootstrap resamplings was used. For NJ analyses, distance matrices were calculated by dnadist with the Kimura two‐parameter option (Kimura 1980), and trees constructed from these matrices by the NJ method (Saito & Nei 1987). A bootstrap value for each internal node of the NJ trees was calculated using 1000 random resamplings with seqboot (Felsenstein 1985). The calculated trees were displayed by treeview (Page 1996). One ScMV and two JYMV sequences were used as the outgroup to construct a phylogenetic tree of the concats, because the CP sequence of only one NYSV isolate was available (Chen et al. 2003). The JYMV and ScMV sequences corresponding to individual gene regions within the concats were aligned as the encoded amino acids using clustal x with transalign to maintain the degapped alignment of the nts and then reassembled to form sequences 2979 nt long.
Phylogenetic analyses of the East Asian TuMV population
The phylogenetic relationships of all the East Asian sequences were determined in almost the same way as that used to analyse isolates from all parts of the world. In this analysis, only isolates with known collection years were used. The 306 nts nearest to the 5′ end of the concats were discarded before the phylogenies were constructed because this region contained many recombination sites (RSs) involving parents from different major lineages (i.e. interlineage recombinants). Bootstraps using 100 or 1000 puzzling steps were calculated using the HKY model of substitution for ML analyses. The parts of the JYMV and ScMV sequences homologous the component parts of the concats were aligned using clustal x with transalign in order to maintain the degapped alignment of the nts, and then reassembled to form concat sequences 2673 nt long.
Variation analyses
The nt diversity was estimated using Kimura two‐parameter correction (Kimura 1980), and was expressed as the average number of nt substitutions per site in each pair of sequence variants. We used a ML approach to assess selection pressures in TuMV. Dn and Ds differences that correlated with phylogenetic relationships were estimated using the codeml program of paml package version 3.14 (Yang 1997) with parameter runmode = −2 and Nssites = 0; this model assumes one dn/ds ratio for all sites, and uses the Pamilo–Bianchi– Li (PBL) method (Li 1993; Pamilo & Bianchi 1993) of mega version 3.1 (Kumar et al. 2004).
Population demography analyses
dnasp version 4.10 (Rozas et al. 2003) was used to estimate Tajima's D (Tajima 1989), Fu & Li's D and F (Fu & Li 1993) statistical tests, and haplotype diversity. Tajima's D test is based on the differences between the numbers of segregating sites and the average number of nt differences. Fu & Li's D test is based on the differences between the numbers of singletons (mutations appearing only once among the sequence) and the total numbers of mutations. Fu & Li's F test is based on the differences between the numbers of singletons and the average number of nt differences between every pair of sequences. Haplotype diversity was calculated based on the frequency and number of haplotype in the population.
arlequin version 3.0 (Excoffier et al. 2005) was used to estimate the frequency distribution of the number of pairwise differences among all sequences (mismatch distribution). The analysis was based on 1000 simulated samples. Mismatch distribution was used to evaluate which population had a star‐like phylogeny due to the accumulation of low frequency mutations during a recent expansion.
Results
Biological and molecular characteristics of the East Asian isolates
A total of 118 TuMV isolates were examined in this study; 34 came from mainland China, seven from Taiwan, three from Korea, and the remaining 74 from different islands of Japan of which 64 were from Kyushu, nine from Honshu and one from Hokkaido (Table 1 and Fig. 1). The original host plants of one isolate, CHN12, and the host types of two isolates, C1 and TW, both Taiwenese, were unknown, as too the year of collection of the Korean RAD1 and RHS1 isolates.
Figure 1.
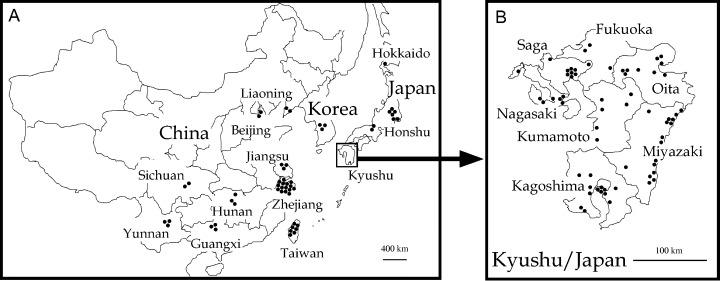
Location of sampling sites of Turnip mosaic virus isolates used in this study. Maps of East Asia including China and Japan (A) and Kyushu Island (B).
B. rapa and N. benthamiana plants infected systemically with each of the East Asian TuMV isolates were homogenized and their sap mechanically inoculated to young plants of B. rapa cv. Hakatasuwari, B. pekinensis cv. Nozaki‐1go, and B. napus cv. Norin‐32go, as well as to R. sativus cvs. Taibyo‐sobutori and Akimasari. Nineteen out of 26 isolates collected from Brassica plants in China infected most Brassica plants systemically but did not infect R. sativus (Table 2A). Thus, half of the isolates, despite minor differences in virulence for some of the tested Brassica hosts (data not shown), belong to the Brassica (B) infecting host type (Tan et al. 2004), and seven of the isolates always infected Raphanus plants, although sometimes only occasionally, and thus are of the Brassica/Raphanus (BR) host type. By contrast, only three of 17 isolates collected from Brassica in Japan were B host type and most were BR infecting host type whether they had been collected from Brassica and Raphanus plants (Table 2B). The same host‐type patterns were obtained when the results for China were separated into their mainland Chinese and Taiwanese components, and the Japanese isolates were separated into Kyushu and Honshu‐Hokkaido components. All the isolates collected from Raphanus plants in China and Japan were BR host type.
Table 2.
Relationships between original host and host type of Turnip mosaic virus isolates collected in China and Japan
|
A. China | ||||||||||||
|---|---|---|---|---|---|---|---|---|---|---|---|---|
| Original host* | Whole country | Mainland | Taiwan | |||||||||
| B† | B(R) | BR | Total | B | B(R) | BR | Total | B | B(R) | BR | Total | |
| Brassica sp. | 19‡ | 4 | 3 | 26 | 15 | 4 | 2 | 21 | 4 | 0 | 1 | 5 |
| Raphanus sp. | 0 | 0 | 12 | 12 | 0 | 0 | 12 | 12 | 0 | 0 | 0 | 0 |
| Total | 19 | 4 | 15 | 38 | 15 | 4 | 14 | 33 | 4 | 0 | 1 | 5 |
|
B. Japan | ||||||||||||
|---|---|---|---|---|---|---|---|---|---|---|---|---|
| Original host | Whole country | Kyushu | Honshu & Hokkaido | |||||||||
| B | B(R) | BR | Total | B | B(R) | BR | Total | B | B(R) | BR | Total | |
| Brassica sp. | 3 | 0 | 14 | 17 | 2 | 0 | 12 | 14 | 1 | 0 | 2 | 3 |
| Raphanus sp. | 0 | 0 | 55 | 55 | 0 | 0 | 50 | 50 | 0 | 0 | 5 | 5 |
| Total | 3 | 0 | 69 | 72 | 2 | 0 | 62 | 64 | 1 | 0 | 7 | 8 |
The sequences of the genes encoding the P1, Ct‐CI, 6K2, VPg and NIa‐Pro, and the CP of each isolate from Kyushu, Japan, were determined. The genomic regions encoding the P1, 6K2, VPg, NIa‐Pro and CP of all isolates were 1086, 159, 576, 729 and 864 nts long, respectively. Therefore the lengths of the genes of all Chinese, Korean and Japanese isolates were identical. The sequences are in the GenBank, EMBL and DDBJ databases with Accession nos AB233078–AB233174.
Identification of recombinants
We looked for evidence of recombination in the concatenated P1, 6K2, VPg, NIa‐Pro and CP sequences (‘concats’) (Tomimura et al. 2004). As the 6K2, VPg and NIa‐Pro regions are contiguous in the genome, the actual position of RSs within those genes, except perhaps in the 5′‐ and 3′‐terminal 100 nts, will be revealed by phylpro and siscan analyses. Similarly, RSs within the P1 and CP regions will be found within those regions. However, RSs in the helper‐component protease protein (HC‐Pro), protein 3 (P3), first 6‐kda 1 protein (6K1) and CI genes which lie between the P1 gene and the 6K2 gene will appear as RSs at sequence interface of the concat. Similarly, single RSs, but not ‘insertions’, within the nuclear inclusion b protein (NIb) region will be found at the NIa–Pro/CP interface of the concat.
We searched for evidence of recombination in a total of 196 TuMV isolates from around the world (Jenner et al. 2002; Ohshima et al. 2002; 2003, 2004; Tan et al. 2004) using the phylpro program (Weiller 1998). This showed that some were phylogenetically anomalous, and these were examined by the ‘sister scanning’ method (siscan version 2) (Gibbs et al. 2000) to determine whether these anomalies resulted from recombination rather than convergent selection. Then, the programs in the rdp2 package (Martin et al. 2005) were used to confirm whether the RSs detected by the phylpro and siscan programs were likely. Recombination detecting programs can be grouped by their basic assumptions; for instance, bootscan (Salminen et al. 1995), rdp (Martin & Rybicki 2000) and siscan programs are phylogenetic methods, whereas geneconv (Sawyer 1999), maxchi (Maynard Smith 1992) and chimaera (Posada & Crandall 2001) programs are substitution methods, and the phylpro program is a distance comparison method (Posada & Crandall 2001).
All the East Asian isolates which had been identified as recombinants by Tomimura et al. (2003) and Tan et al. (2004) had statistically significant ‘conflicting relatedness signals’ in nts that differed synonymously from those in other sequences. The phylpro program was used to search for the ‘parental lineages’ of East Asian recombinant sequences. However not all sequences that had different relationships in adjacent 50 or 100 nt sequences showed clear phylogenetic anomalies in phylpro (Tan et al. 2004). We therefore used siscan to check 50 and 100 nt slices of all Eurasian sequences for evidence of recombination either using all nts, or using those that had ds or dn changes separately. Table 3 summarizes the location of crossover sites found in the East Asian genomes by the seven recombination detecting programs, and Fig. 2 shows the different patterns of RSs in those recombinants together with a list of the sequences in which the various patterns were found. There seemed to be at least 20 RSs in the TuMV genomes and 17 recombination type patterns (A‐Q, Fig. 2) in the East Asian population. Fourteen of the 20 RSs seemed to be derived from parents from different major lineages (i.e. interlineage RSs), seven RSs seemed to be derived from parents from the same major lineage (i.e. intralineage RSs). Most of RSs were detected by all programs; therefore, we called these ‘clear’ RSs, but two intralineage RSs at around nts 6121 and 6300 in the VPg gene were only detected by some programs and one of the parents had an RS at the same site, and thus, further analyses will be required to clarify this anomaly. We therefore considered these sites to be ‘tentative’ RSs or false positives, and so recombination type patterns K and M may be artefacts. Two of the different recombination patterns (I and J) were found in many isolates. The other recombination patterns were only found in the genomes from three or fewer isolates. Isolates with patterns I were found in China and Japan, whereas patterns A, C‐G, J and O‐Q were found only in Japanese isolates and patterns B and L only in those from China. Isolates with pattern N, the mosaic genome pattern with basal‐BR sequence, were found in both China and Korea but not in Japan. In summary, the Japanese population seemed to have a greater number of different recombination patterns than the Chinese (Table 4).
Table 3.
Recombination crossover sites in Turnip mosaic virus genome detected by recombination detecting programs
| Gene/region and crossover site* | Recombination detecting program† | P‐value‡ | Z‐value§ | Parental‐like lineage | Reference isolate¶ |
|---|---|---|---|---|---|
| P1 | |||||
| Nt 401 | RGBMCSRSSP | 8.5 × 10−42 | 4.46 | World‐B × Asian‐BR | MD49J |
| Nt 680 | RGBSRSSP | 6.4 × 10⁻¹³−1.0 × 10⁻¹⁶ | 4.30–5.82 | World‐B × World‐B | 2J, DMJ |
| Nt 727 | RGBMCSRSSP | 1.1 × 10⁻²⁴−3.0 × 10−36 | 3.33–5.55 | World‐B × Asian‐BR | MD47J, MN978J, NDJ, SN4J |
| Nt 752 | RGBMCSRSSP | 5.7 × 10⁻²¹−8.9 × 10−37 | 3.74–5.40 | World‐B × Asian‐BR | 59J, FD27J, KGD54J, MD974J |
| Nt 932 | RGBMCSRSSP | 2.8 × 10⁻²² | 4.94 | Asian‐BR × World‐B | FD27J |
| Nt 947 | RGBMCSRSSP | 9.4 × 10⁻²⁸ | 4.38 | Asian‐BR × World‐B | 1J |
| Between P1 and Ct‐CI | RGBMCSRSSP | 1.2 × 10⁻¹⁰−2.1 × 10−53 | 3.21–6.76 | Asian‐BR × World‐B | ND10J (SGD311J) |
| GBMCSRSSP | 8.1 × 10⁻¹⁹ | 5.21 | World‐B × Asian‐BR | FD27J | |
| RGBMCSRSSP | 7.2 × 10⁻¹⁵ | 5.45 | Asian‐BR × Basal‐BR | RHS1 | |
| Ct‐CI | None | ||||
| 6K2 | |||||
| Nt 5765 | RGBMCSRP | 1.5 × 10⁻¹⁶−2.1 × 10−53 | 2.97–2.99 | World‐B × Asian‐BR | (HOD517J) (SGD311J) |
| Nt 5894 | RGBMCSRSSP | 9.0 × 10⁻⁹−6.4 × 10⁻²⁰ | 4.75–6.79 | Basal‐BR × Asian‐BR | CHL13, CHL14, RHS1 |
| VPg | |||||
| Nt 6035 | RGBMCSRSSP | 1.2 × 10⁻⁹−3.9 × 10⁻²¹ | 3.47–5.48 | World‐B × Asian‐BR | KGD54J, ND10J |
| Nt 6121 | RGMCSRSSP | 3.1 × 10⁻²² | 3.16 | Asian‐BR × World‐B | HOD517J |
| RGBMCSRSSP | 6.5 × 10⁻²⁴−2.1 × 10⁻²⁷ | 4.83–4.94 | Asian‐BR × Asian‐BR | FD27J, SD3J | |
| Nt 6300 | RGBMCSR | 3.4 × 10⁻⁴−7.2 × 10⁻¹⁰ | 2.28–4.32 | World‐B × World‐B | 2J, C1, CHN5, CHN12 |
| NIa‐Pro | |||||
| Nt 6539 | GBMCSRSSP | 2.4 × 10⁻²¹ | 3.76 | Asian‐BR × World‐B | NDJ |
| NIb | None | ||||
| CP | |||||
| Nt 8904 | RGMCSRSSP | 6.7 × 10⁻²⁹ | 4.04 | Asian‐BR × World‐B | CHN1 |
Approximately estimated recombination crossover sites detected in the Turnip mosaic virus concat aligned sequences by the recombination detecting programs. Crossover site shows locations of individual genes/regions in 1J genome (Ohshima et al. 1996).
Recombinant isolates identified by the recombination detecting programs; R (rdp), G (geneconv), B (bootscan), M (maxchi), C (chimaera) and SR (siscan) programs in rdp2, and SS (siscan synonymous site analysis) in siscan version 2 and P (phylpro) programs. The analysis was carried out with default settings for the different detection methods and a Bonferroni‐corrected P values cutoff of 0.01. Typical pattern for the detected recombinants is listed.
The reported P‐value is for the program in bold type in RDP2 and is the greatest P‐value among the isolates calculated for the region in question.
One of the parents of recombinants showed Z‐values greater than 3 in (on analysis of all nucleotide‐sites in SR of rdp2 program; thus, lower Z‐values of one of the parents identified in SS of siscan version 2 program is shown.
For all isolates, see Fig. 2. Recombination crossover sites of the isolates (in parentheses) were detected by the programs using 40 entire genomic sequences available from the international gene sequence data bases. For details of the genogroups, basal‐BR, Asian‐BR and world‐B, see Ohshima et al. (2002).
Figure 2.
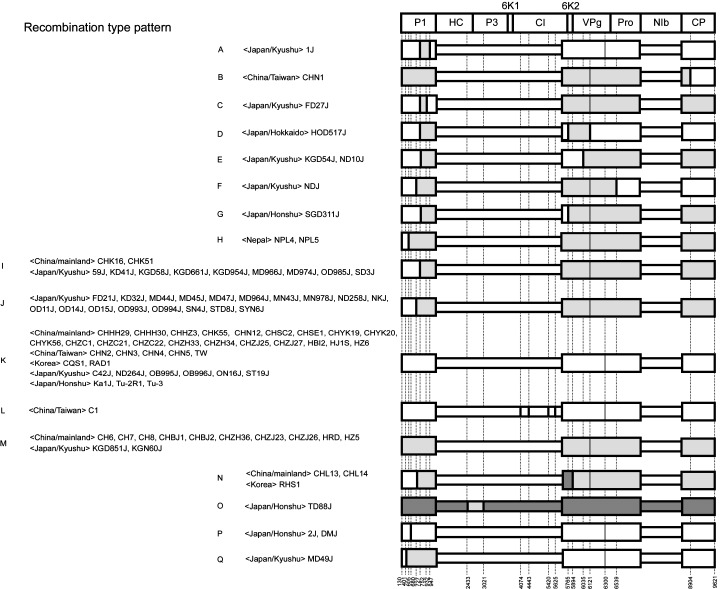
Recombination maps of Turnip mosaic virus genomes; the estimated nucleotide positions of the recombination sites (RSs) are shown relative to the 5′ end of the P1 gene using the numbering of the 1J sequence (Ohshima et al. 1996). The approximate RS positions were estimated from data analysed using the phylpro and siscan version 2 of the original software (Gibbs et al. 2000; Weiller 1998) and also rdp (Martin & Rybicki 2000), geneconv (Sawyer 1999), bootscan (Salminen et al. 1995), maxchi (Maynard Smith 1992), chimaera (Posada & Crandall 2001) and siscan in the rdp2 program, together with that published by Ohshima et al. (2002) and Tan et al. (2004). The wide box shows the P1, R12 + Pro and CP regions sequenced in this study, the narrow box shows the regions not yet sequenced. The boxes in white, grey and black are, respectively, of world‐B, Asian‐BR and basal‐BR group parents as assessed by phylogenetic analysis. The thin line indicates ‘tentative’ RS that may be false positives (see Results), and the bold line indicates ‘clear’ RSs. The recombination type patterns K and M may be nonrecombinant (see Results). Recombination type pattern H of Nepalese isolates (NPL4 and 5) is included, and the isolates had interlineage RSs at nt 605 in P1 gene (see Tan et al. 2004).
Table 4.
Relationships between original host/host type and recombinant/nonrecombinant of Turnip mosaic virus in China and Japan
|
A. China | |||||||||||
|---|---|---|---|---|---|---|---|---|---|---|---|
| Original host/host type* | Whole country | Mainland | Taiwan | ||||||||
| B† | I | K | M | N | I | K | M | N | B | K | |
| Original host | |||||||||||
| Brassica sp. | 1 | 0 | 23 | 2 | 0 | 0 | 19 | 2 | 0 | 1 | 4 |
| Raphanus sp. | 0 | 2 | 0 | 8 | 2 | 2 | 0 | 8 | 2 | 0 | 0 |
| Host type | |||||||||||
| B | 0 | 0 | 19 | 0 | 0 | 0 | 15 | 0 | 0 | 0 | 4 |
| B(R) | 0 | 0 | 4 | 0 | 0 | 0 | 4 | 0 | 0 | 0 | 0 |
| BR | 1 | 2 | 0 | 10 | 2 | 2 | 0 | 10 | 2 | 1 | 0 |
|
B. Japan | ||||||||||||||||||||||||||||||
|---|---|---|---|---|---|---|---|---|---|---|---|---|---|---|---|---|---|---|---|---|---|---|---|---|---|---|---|---|---|---|
| Original host/host type | Whole country | Basal‐BR‡ | Kyushu | Basal‐BR | Honshu & Hokkaido | Basal‐BR (discard Non‐ recombinant) | ||||||||||||||||||||||||
| A | C | D | E | F | G | I | J | K | M | O | P | Q | A | C | E | F | I | J | K | M | Q | D | G | K | O | P | ||||
| Original host | ||||||||||||||||||||||||||||||
| Brassica sp. | 0 | 0 | 0 | 0 | 0 | 0 | 0 | 5 | 7 | 1 | 0 | 1 | 0 | 3 | 0 | 0 | 0 | 0 | 0 | 5 | 5 | 1 | 0 | 3 | 0 | 0 | 2 | 0 | 1 | 0 |
| Raphanus sp. | 1 | 1 | 1 | 2 | 1 | 1 | 9 | 13 | 2 | 1 | 1 | 1 | 1 | 21 | 1 | 1 | 2 | 1 | 9 | 13 | 1 | 1 | 1 | 20 | 1 | 1 | 1 | 1 | 1 | 1 |
| Host type | ||||||||||||||||||||||||||||||
| B | 0 | 0 | 0 | 0 | 0 | 0 | 0 | 0 | 3 | 0 | 0 | 0 | 0 | 0 | 0 | 0 | 0 | 0 | 0 | 0 | 2 | 0 | 0 | 0 | 0 | 0 | 1 | 0 | 0 | 0 |
| B(R) | 0 | 0 | 0 | 0 | 0 | 0 | 0 | 0 | 0 | 0 | 0 | 0 | 0 | 0 | 0 | 0 | 0 | 0 | 0 | 0 | 0 | 0 | 0 | 0 | 0 | 0 | 0 | 0 | 0 | 0 |
| BR | 1 | 1 | 1 | 2 | 1 | 1 | 9 | 18 | 6 | 2 | 1 | 2 | 1 | 24 | 1 | 1 | 2 | 1 | 9 | 18 | 4 | 2 | 1 | 23 | 1 | 1 | 2 | 1 | 2 | 1 |
Original host/host type and
recombination type patterns of the isolates are listed in Table 1 and Fig. 2, respectively. The recombination type pattern L in China is excluded because its original host and host type are not known. Recombination type patterns K and M may be ‘tentative patterns’ or ‘false positives’ because one of parents had recombination sites at almost identical site.
‡Basal‐BR isolates were identified as nonrecombinants in this study.
Earlier analyses using recombination detecting programs showed that as larger numbers of sequences are obtained and compared, the parents of tentative recombinants are more certainly identified (Tomimura et al. 2004). One recombination pattern Q was newly found among East Asian isolates in the present study, and thus, in summary, a total of 45 out of 118 (38%) of the East Asian isolates were found to be ‘clear’ recombinants. We checked the geographical distribution of different recombination patterns and found that isolates with identical recombination patterns tended to be grouped and, when present in different countries, also tended to be grouped within those countries, an indication of founder effects during colonization (data not shown).
Relationships
We assessed the phylogenetic relationships of all the 196 concats including those of all the recombinants identified previously (Ohshima et al. 2002; 2003, 2004; Tan et al. 2004). However, the resulting trees were inconsistent, and had poor bootstrap support for some lineages as had previously been found for concat sequences (Tomimura et al. 2004). We therefore excluded the interlineage recombinant sequences and calculated trees from the concats of the remaining 139 isolates. The trees were obtained by ML, MP and NJ methods, and the ML tree is shown in Fig. 3. All the trees partitioned most of the sequences into the same four consistent groups as reported earlier: basal‐B, basal‐BR, Asian‐BR and world‐B (Ohshima et al. 2002; 2003, 2004; Tan et al. 2004). However, no East Asian isolate fell into the basal‐B group, which is sister group to all others in the ML, MP and NJ phylogenies, consists mostly of Eurasian isolates, and is most closely related to the JYMV and ScMV outgroup sequences. The remaining isolates form two major lineages one of B host type isolates, the ‘world‐B group’, and the other of BR host type isolates, mostly from East Asia, and itself forming two lineages, the ‘basal‐BR group’, which includes a few European isolates and the ‘Asian‐BR group’. The Chinese isolates fell into both the Asian‐BR and world‐B groups, whereas Japanese isolates occurred in all three groups. Within the world‐B and basal‐BR groups, there were discrete Asian sublineages. The basal‐BR group seemed to be split into at least three sublineages.
Figure 3.
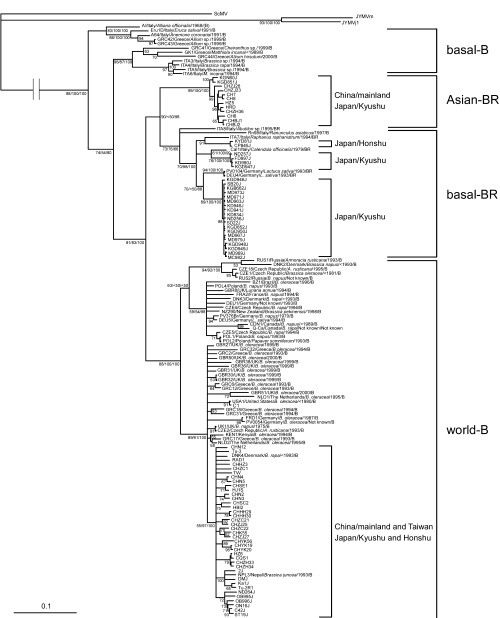
A maximum‐likelihood (ML) tree calculated from the concat sequences of 139 isolates of Turnip mosaic virus that did not include the interlineage recombinants identified in this study and those reported by Tan et al. (2004) and Tomimura et al. (2004). Numbers at each node indicate the percentage of supporting puzzling steps (or bootstrap samples) (only values > 50 are shown) in ML, maximum‐parsimony and neighbour‐joining, respectively. Horizontal branch length is drawn to scale with the bar indicating 0.1 nt replacements per site. The homologous sequences of two isolates (mild and j1) of Japanese yam mosaic virus (JYMV) and an isolate of Scallion mosaic virus (ScMV) were used as the outgroup. The name of each isolate, its country of origin, original host plant, year of isolation and host type are shown for isolates not listed in Table 1. For details of the genogroups, basal‐B, basal‐BR, Asian‐BR and world‐B, see Ohshima et al. (2002).
Comparisons of Chinese and Japanese TuMV populations
Genetic differences. The genomic recombination type patterns (Fig. 2) were studied further to see whether they provided more information about the East Asian TuMV populations. However although it was found (Table 4) that most of the B host type isolates had gene sequences with recombination pattern K with ‘tentative’ RSs, whereas two‐thirds of those of host type BR had recombination pattern I and J, the former came from China and the latter from Japan, thus recombination pattern and provenance were confounded. Chinese isolates had fewer different recombination patterns than Japanese isolates, many of which were interlineage recombinants of world‐B × Asian‐BR groups of BR host types. Furthermore, only three of the patterns were unique to China; one isolate with pattern B and L, and two others with pattern N. Thus, the recombination patterns did not yield additional phylogeographical information.
Many East Asian recombinant isolates had parents from different major lineages (i.e. interlineage recombinants) with RSs in the middle of P1 genes (Fig. 2); therefore, we calculated trees from the concats after discarding the 5′‐terminal 306 nts of the P1 genes (894 nt from 5′ noncoding region in the genome of original 1J isolate, refer Fig. 2) of each isolate. These trees were calculated for 97 East Asian isolates of known collection year including the nonrecombinants and the intralineage recombinants identified in this study. Figure 4 A shows the ML tree, but all three methods, ML, MP and NJ, partitioned most sequences into the same three consistent groups; basal‐BR, Asian‐BR and world‐B. Many Chinese and Japanese isolates, but not all, seemed to be clustered in country‐specific lineages in each of the three major lineages. Some Taiwanese and Japanese isolates clustered into a single lineage in the world‐B group (Fig. 4A). Likewise, the basal‐BR group consisted only of Japanese isolates but these split into three sublineages I, II and III, and although there were only a few isolates from Honshu‐Hokkaido, they, and the Kyushu isolates, clustered into sublineages of the world‐B and basal‐BR groups. Star‐like phylogenies were seen in basal‐BR and Asian‐BR groups.
Figure 4.
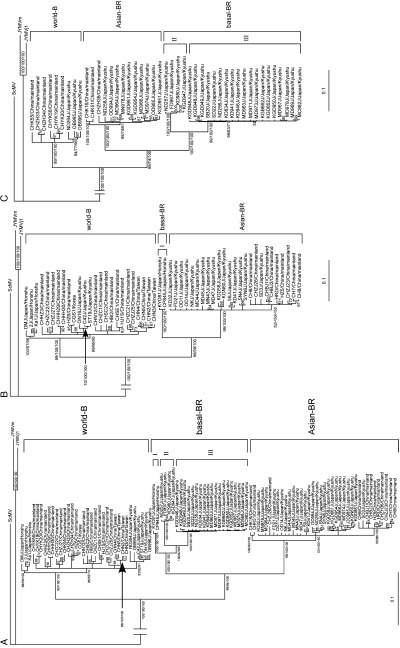
A maximum‐likelihood (ML) tree calculated from the concat sequences of East Asian isolates of Turnip mosaic virus. Isolates with known collection year were used. The sequences of 306 nucleotide from 5′ end to the interlineage recombination sites of concat sequences were discarded and the trees were calculated (see Materials and methods). (A) The ML tree calculated from all sequences of East Asian isolates that did not include the interlineage recombinants identified in this study; (B) ‘1999‐tree’ those calculated from the sequences of East Asian isolates collected before and including 1999; (C) and ‘2000‐tree’ those collected after and including 2000. Numbers at each node indicate the percentage of supporting puzzling steps (or bootstrap samples) (only values > 50 are shown) in ML, maximum‐parsimony and neighbour‐joining, respectively. Horizontal branch lengths are drawn to scale with the bar indicating 0.1 nt replacements per site. The homologous sequences of two isolates (mild and j1) of Japanese yam mosaic virus (JYMV) and an isolate of Scallion mosaic virus (ScMV) were used as the outgroup. For details of the genogroups, basal‐BR, Asian‐BR and world‐B, see Ohshima et al. (2002).
We also checked gene‐by‐gene to see whether there were significant differences between the Chinese and Japanese populations in their dn/ds substitution rates using the codeml and PBL methods (Table 5). It was found that dn was always smaller than ds and differed considerably in different genomic regions. This indicates that there is selection against most amino acid changes, namely ‘negative selection’, in most of these regions, although all had a dn/ds ratio in the range reported for most other DNA and plant RNA viruses (García‐Arenal et al. 2001; Rubio et al. 2001). The largest dn/ds ratio was for the 5′‐terminal region of the P1 gene, whereas the dn/ds ratios for the Chinese and Japanese populations and for the different phylogenetic lineages were almost the same in all the genes and concats analysed by the two methods. The dn/ds ratios of sequences from isolates collected in Taiwan were two to five times higher than those of other populations, although this may have resulted from the small number of isolates analysed.
Table 5.
Nonsynonymous and synonymous substitution ratios of Turnip mosaic virus gene/region and subpopulation of China and Japan
| Gene/region | China | Japan | ||||
|---|---|---|---|---|---|---|
| Whole country | Mainland | Taiwan | Whole country | Kyushu | Honshu & Hokkaido | |
| Codeml method | ||||||
| P1 [nt 1–321 (nt 1–627)] | 0.034 (0.042) | 0.033 (0.041) | 0.200 (0.219) | 0.025 (0.063) | 0.023 (0.061) | 0.059 (0.101) |
| 6K2 [nt 385–543] | 0.027 | 0.029 | 0.058 | 0.024 | 0.021 | 0.019 |
| VPg [nt 544–1119] | 0.045 | 0.042 | 0.143 | 0.040 | 0.044 | 0.049 |
| NIa‐Pro [nt 1120– 1848] | 0.009 | 0.008 | 0.041 | 0.005 | 0.005 | 0.011 |
| CP [nt 1849–2673] | 0.052 | 0.046 | 0.112 | 0.040 | 0.042 | 0.041 |
| Concat [nt 1–2673 (nt 1–2979)] | 0.051 (0.058) | 0.049 (0.055) | 0.113 (0.123) | 0.044 (0.053) | 0.044 (0.053) | 0.047 (0.063) |
| PBL method | ||||||
| P1 [nt 1–321 (nt 1–627)] | 0.095 (0.133) | 0.090 (0.130) | 0.296 (0.295) | 0.096 (0.136) | 0.094 (0.133) | 0.111 (0.181) |
| 6K2 [nt 385–543] | 0.096 | 0.098 | 0.067 | 0.067 | 0.059 | 0.091 |
| VPg [nt 544–1119] | 0.073 | 0.069 | 0.173 | 0.070 | 0.072 | 0.084 |
| NIa‐Pro [nt 1120– 1848] | 0.017 | 0.016 | 0.047 | 0.017 | 0.017 | 0.018 |
| CP [nt 1849–2673] | 0.062 | 0.054 | 0.134 | 0.045 | 0.047 | 0.049 |
| Concat [nt 1–2673 (nt 1–2979)] | 0.069 (0.079) | 0.065 (0.076) | 0.128 (0.143) | 0.060 (0.071) | 0.060 (0.072) | 0.064 (0.083) |
Nonsynonymous (dn) and synonymous (ds) substitution (dn/ds) ratios were calculated from Turnip mosaic virus gene/region and subpopulations using codeml method of paml package version 3.14 (Yang 1997) and Pamilo–Bianchi–Li (PBL) method of mega version 3.1 (Kumar et al. 2004). The dn/ds ratios were estimated from the concats of 2673 nts long, on the other hand, those from the concats of 2979 nts long are shown in parenthesis (see Materials and methods). An isolate from Hokkaido was not included in the analysis because it had interlineage recombination site in the genome (interlineage recombinant).
Temporal differences. Temporal differences in populations can be assessed by sampling them on different occasions, and also, making various assumptions, from tree comparisons. We therefore calculated trees from the concat sequences discarding the 5′‐terminal 306 nts of the P1 genes of isolates collected during and before 1999 and during and after 2000 separately (Fig. 4B, C). Both the ‘1999‐tree’ and the ‘2000‐tree’ partitioned the sequences into three groups, basal‐BR, Asian‐BR and world‐B, whereas the basal‐BR group consisting many Japan/Kyushu isolates appeared after 1999. Temporal information can also be obtained from trees, because if different lineages are evolving at similar rates then the lengths of the branches, or the diversity of different parts of the tree, give an indication of their age. This is probably legitimate for this TuMV data as the paml and mega analyses described above revealed almost no significant selection differences between the lineages except in the Taiwanese population. The nt diversity (average number of nt substitutions per site in each pair of sequence variants) was estimated for each genomic region (P1, 6K2, VPg, NIa‐Pro and CP genes), each country population, each lineage and each collection period. These analyses showed appreciable differences between the lineages. The P1 gene was the most variable when all isolates were compared, but not, as would be expected, when different country populations/lineages of the isolates were considered separately (data not shown). The Chinese populations of both Asian‐BR and world‐B isolates were more diverse than the Japanese populations in most of the genes examined, suggesting that the Chinese populations may be older, although to confirm this it will be necessary to compare nt diversities of the isolates collected in comparable areas of China and Japan. However, when the pre‐ and post‐1999/2000 populations of Chinese isolates were compared, they were found to be closely similar; the later ones from Kyushu were significantly more diverse (data not shown). Interestingly, isolates of the two basal‐BR sublineages that appeared in Japan during and after 2000 had less than one quarter the diversity of the Asian‐BR and world‐B isolates (Table 6). The average year of collection of the pre‐ and post‐1999/2000 populations in China and in Japan was 2 and 4 to 5 years apart, respectively.
Table 6.
Neutrality tests, haplotype and nucleotide diversity of each Turnip mosaic virus population in China and Japan
| Geographical group | Genetic group | Tajima's D | Fu & Li's D | Fu & Li's F | Haplotype diversity | Nucleotide diversity |
|---|---|---|---|---|---|---|
| China | ||||||
| Mainland | World‐B | −0.918 | −0.535 | −0.761 | 1.000 (0.016) | 0.036 (0.008) |
| Asian‐BR | −0.999 | −0.708 | −0.896 | 1.000 (0.034) | 0.024 (0.007) | |
| Taiwan | World‐B | −1.062 | −1.020 | −1.132 | 1.000 (0.096) | 0.035 (0.024) |
| Japan | ||||||
| Kyushu | World‐B | −1.059 | −1.062 | −1.167 | 1.000 (0.096) | 0.024 (0.008) |
| Asian‐BR | −1.700* | −2.165* | −2.374* | 1.000 (0.011) | 0.018 (0.006) | |
| Basal‐BR II | −0.861 | −0.861 | −0.903 | 1.000 (0.177) | 0.005 (0.002) | |
| Basal‐BR III | −2.179‡ | −2.869† | −3.102† | 1.000 (0.017) | 0.005 (0.002) | |
| Honshu & Hokkaido | World‐B | −0.574 | −0.546 | −0.601 | 1.000 (0.126) | 0.029 (0.012) |
| Basal‐BR I | — | — | — | 1.000 (0.500) | 0.005 (0.000) | |
0.05 < P < 0.1,
P < 0.02,
P < 0.01; Tajima's D test compares the nucleotide diversity with the proportion of polymorphic sites, which are expected to be equal under selective neutrality. Fu & Li's D test is based on the differences between the number of singletons (mutations appearing only once among the sequences) and the total number of mutations. Fu & Li's F test is based on the differences between the number of singletons and the average number of nucleotide differences between pairs of sequences. Nucleotide diversity was estimated by the average pairwise difference among sequence in a sample, based on all sites. Numbers in parentheses indicate standard deviations. An isolate from Hokkaido is not included in the analysis because it had interlineage recombination site in the genome (interlineage recombinant). Tajima's D, Fu & Li's D and F statistical tests are not performed because basal‐BR I group in Honshu and Hokkaido only has two isolates. For details of the genogroups, basal‐BR, Asian‐BR and world‐B, see Ohshima et al. (2002). Basal‐BR I, basal‐BR II and basal‐BR III are subgroups of basal‐BR.
Temporal difference of genetic distance in each gene, geographical and genetic group were estimated by plotting, for each pair of sequences, the genetic distances against the interval between the collection times for the pair, but there was no significant correlation (r < 0.5, a coefficient of correlation) between them. We also assessed the temporal difference of the genomic recombination type patterns of Chinese and Japanese population in two different collection periods (before and after 1999/2000; data not shown), and again found no significant difference (P > 0.05, χ2 test).
Population demography
The distribution of pairwise nt differences, or mismatch distribution (Rogers & Harpending 1992; Rogers 1995), for each TuMV subpopulation or lineage was evaluated in arlequin (Fig. 5). For populations experiencing long‐term demographic stability, the stochastic process of lineage extinction via genetic drift produces a ragged multimodal distribution. On the contrary, in the recently expanded and still intact population, the majority of lineage coalescence events are expected to post‐date the expansion, producing a smooth unimodal Poisson distribution around the time of expansion, reflecting the star‐like phylogeny of alleles due to the accumulation of low frequency mutations since the expansion. In addition, nt polymorphism of TuMV populations were estimated using Tajima's D, Fu & Li's D and F statistical tests (Table 6) because we were interested in discriminating between demographic expansion and contraction. These statistical tests are expected to have negative values for background selection, genetic hitchhiking and demographic expansion, and the negative values indicate that population maintained low frequency polymorphism. Because selection events such as genetic hitchhiking and background selection affect relatively small fractions of the genome, a multilocus trend of negative statistical values would indicate that demographic forces are acting on the population (Tajima 1989; Hey & Harris 1999; Tsompana et al. 2005). On the other hand, positive values are expected to be produced by balancing selection and a decrease of the population size. We found that the shapes of pairwise mismatch distribution for world‐B groups in all subpopulations were similar, and were ragged and multimodal, supporting long‐term demographic equilibrium or an insufficient number of samples (Fig. 5A, C, D, H). On the other hand, the shape of mismatch distribution for basal‐BR III group in Kyushu was smooth and unimodal and a good visual fit with the expectation of the sudden expansion model (Fig. 5G). Likewise, a highly significant values of Tajima's D, Fu & Li's D and F statistical tests supported demographic expansion of the same isolates (Table 6). Whereas the mismatch distribution for the Asian‐BR and basal‐BR II groups in Kyushu were not unimodal, the accumulation of low‐frequency mutations was characteristic of nonequilibrium population dynamics (Fig. 5E, F), and notably, the number of pairwise differences at the peak of the first ‘wave’ in the distribution was almost similar to that of basal‐BR III group of Kyushu, suggesting a recent demographic instability in the Asian‐BR and basal‐BR II groups of Kyushu. The haplotype diversity in all groups analysed had a value of 1.000 (Table 6).
Figure 5.

The frequency distribution of the number of pairwise nucleotide differences obtained from concat nucleotide sequences for: (A) world‐B group of mainland China, (B) Asian‐BR group of mainland China, (C) world‐B group of Taiwan, (D) world‐B group of Kyushu, (E) Asian‐BR group of Kyushu, (F) basal‐BR II group of Kyushu, (G) basal‐BR III group of Kyushu, and (H) world‐B group of Honshu and Hokkaido. Unbroken line represents the observed data and broken line represents the data expected under the sudden population expansion model. For details of the genogroups, basal‐BR, Asian‐BR and world‐B, see Fig. 4.
Discussion
We have determined and compared TuMV gene sequences from c. 120 representative isolates from East Asia in order to assess the spatial genetic structure of the population using different evolutionary assumptions. In particular, we collected more than 60 TuMV isolates representing all regions of Kyushu island (approximately 42 000 km2), which is located at the southwest end of the main Japanese island chain and therefore is the island nearest to mainland continental China, this also involved resampling localities from which TuMV had been obtained before 2000. These isolates were cloned by single‐lesion isolations because of the high frequency of mixed infections in the field, not only with other viruses, especially CMV, but also other isolates of TuMV (approximately 2% in Kyushu), which had caused problems when gene sequencing for earlier studies (data not shown). Biological cloning is, of course, also mandatory when attempting to analyse recombinational events, so that one does not mistake a mixture of two distinct isolates as a recombinant (Ohshima et al. 2002; Moreno et al. 2004).
There have been several studies of the genetic structure of plant virus populations, for instance of those of begomoviruses (Briddon et al. 2004), Citrus tristeza virus (Rubio et al. 2001), Rice yellow mottle virus (RYMV) (Traore et al. 2005), Tomato spotted wilt virus (TSWV) (Tsompana et al. 2005) and TuMV (Tomimura et al. 2004). All these have been continental‐scale studies. Whereas analyses of the structure of local populations are less frequently reported, they may be particularly informative (García‐Arenal et al. 2000; Bateson et al. 2002; Moreno et al. 2004). For example, the increased frequency of recombinants in the CMV population of Spain was reported recently (Bonnet et al. 2005). In addition, there are few reports of phylogeographical studies of plant viruses (Tsompana et al. 2005) like that we report here of TuMV from species of Brassicacae in China and Japan. We have collected samples of nearly 300 plants of R. sativus, B. rapa, B. juncea and other crucifers showing mosaic symptoms plants, over the past decade in Kyushu island. However, although many of R. sativus plants reacted positively with TuMV antisera in enzyme‐linked immunosorbent assay (ELISA) tests as it is relatively easy to detect TuMV in this species, it was more difficult to find TuMV‐infected Brassica plants. In the present study, only 17 TuMV isolates were found in Brassica plants in Kyushu and other area of Japan and all were involved in this study (Table 2).
Host typing of each isolate also revealed that most B and all BR host type isolates were collected, respectively, from Brassica and Raphanus plants in China, and hence the ‘host type’ of each isolates correlated well with the host species from which it was originally isolated, whereas most isolates from Japan were BR host type regardless of whether the isolates had been collected from either Brassica or Raphanus plants. These results indicate that TuMV may be constrained differently by its host plants in the two countries, but whether this is a direct function of the host, or an indirect effect of the host on aphid vectors, is unknown.
Recombination is an important source of genetic variation for potyvirus species (Revers et al. 1996; Moury et al. 2002; Moreno et al. 2004; Tomimura et al. 2004; Chare & Holmes 2006). Our earlier studies showed that the mapping of recombinational events as well as phylogenetic relationships were useful for tracing the migration and evolution of TuMV (Tan et al. 2004). In the present study, many RSs in the P1 gene of the TuMV genome were similar in the Chinese and Japanese isolates. Although it is not possible to exclude the possibility that the RSs positions coincide with recombinational hotspots, it is also possible that genomes with the same recombination type pattern have a shared ancestor. In fact, from the analysis of the concat sequences, although number of isolates in recombination type patterns is different in each country, the isolates of recombination type pattern I, and nonrecombinants in Asian‐BR and world‐B groups migrated in both country populations (2, 3) and hence probably represent the successful ‘founder’ TuMVs of East Asia. However, although the recombination type patterns and nonrecombinants did not give additional insights, they were congruent with the relationships indicated by the phylogenetic analyses. Note that some of the conflicting signals attributed to recombinant events may be due to differences in rate of evolution among genes and among lineages.
The degree of translational selection in genes can be estimated by comparing the nt diversity at dn vs. ds positions. Using this measure, it has been found that there is strong negative selection (i.e. selection against change) operating on most animal and plant viruses (Domingo et al. 2001; García‐Arenal et al. 2001). In TuMV, the P1 gene has the largest dn/ds ratio, whereas the NIa‐Pro has the smallest, indicating that different genes are under different selective constraints (Tomimura et al. 2004). In this study, we looked at the dn/ds ratios of five genes in the populations in each country and district, and found that the values for Chinese and Japanese isolates were almost identical but that for the Taiwanese population was much greater (Table 5), indicating that constraints in different local population may not be similar. We also tried to estimate dn/ds ratios of each lineage in each country using intralineage recombinant sequences (data not shown), but numbers of isolates available for these analyses were very small (see Fig. 4B,C), and no worthwhile estimate could be obtained.
Star phylogenies, as found in epidemic populations of Simian and Human immunodeficiency viruses, and CMV have been considered to indicate a recent emergence with minimal selection (Myers et al. 1993; Roossinck et al. 1999). Such star phylogenies were seen in the Asian‐BR and basal‐BR groups of ‘1999‐tree’ and ‘2000‐tree’ (Fig. 4B, C). Furthermore, phylogenetic analyses of isolates collected pre‐ and post‐1999/2000 showed that new lineages of closely related basal‐BR II and III isolates appeared around Kyushu after 1999, and the sudden expansion of the isolates in the basal‐BR III lineage was strongly supported by the deviations from the neutral equilibrium model for the geographical lineages with overall lack of nt diversity (Table 6), and by the analysis for mismatch distribution within individual geographical group (Fig. 5). Mismatch distribution analysis provided evidence of sudden expansion of the severe acute respiratory syndrome (SARS) coronavirus (Yeh et al. 2004). A combination for high haplotype diversity and low genetic diversity, assessed by mitochondrial DNA (mtDNA) markers, is taken as evidence of a recent population expansion after a genetic bottleneck (Grant & Bowen 1998) and this was found for a plant virus, TSWV, using nt sequences (Tsompana et al. 2005). This combination was especially seen in the basal‐BR III group of TuMV population, and this conclusion may also apply to this population, although RNA viruses may evolve faster than mtDNA, and nt mismatches may produce unusually large haplotype diversities. However, it is likely that the results obtained from the population of basal‐BR III indicate a sudden expansion after a bottleneck, namely a ‘founder effect’, confirming other conclusions of our study.
In TuMV population, some of closely related subpopulations of the world‐B and Asian‐BR groups were found in both China and Japan, and this was confirmed by the shared recombination type patterns (Fig. 2) and phylogenetic relationships of the isolates (Fig. 4). On the other hand, no nonrecombinant basal‐BR isolates, like those found in southern Japan, were found in China. So the question then is from where did the basal‐BR lineage in Japan come? It may have originated in Japan, or from the TuMV population in other parts of the world and our existing phylogenetic evidence does not distinguish between these two possibilities. TuMV is transmitted by aphids in a nonpersistent manner but there is no record of seed transmission (Provvidenti 1980) although several potyviruses are. However, the occurrence of TuMV in broad bean (Vicia faba) and in saffron (Crocus sativus) in China (Hu et al. 1996; Chen & Chen 2000), in Allium ampeloprasum in Israel (Gera et al. 1997) and in Ranunculus (Ranunculus asiaticus) in Italy (Tomimura et al. 2004) indicates that the host reactions of TuMV, including its ability to be seed‐borne, may need to be re‐examined. The other alternative would be metapopulation events involving colonization and extinction as has been reported for several plant viruses including CMV, tobamoviruses and TSWV (Fraile et al. 1997; 2000, 2001; Tsompana et al. 2005).
In conclusion, our biological and molecular studies show that the Chinese and Japanese TuMV isolates analysed here are part of the same population but are discrete lineages, each with little diversity and with close evolutionary relationships, suggesting that recent founder effects have shaped their genetic structure, although this may have been modified subsequently by clinal genetic drift. At present, the only effective control of TuMV is through the use of host plant genetic resistance, either conventional or transgenic, or by cross‐protection with attenuated strains. Hence, it is very important for us to understand the phylogeography of TuMV population in each country or region. This analysis provides the first demonstration, to our knowledge, of population structuring and species‐wide population expansions in a single‐stranded plant RNA virus, utilizing a population genetic approach.
This work is part of Yasuhiro Tomitaka's PhD study on phylogeography and genetic structure of Turnip mosaic virus in Asia and Eurasia. Kazusato Ohshima is a professor in the Faculty of Agriculture at the Saga University, Japan. His research interests include the evolution and epidemiology/ecology of Turnip mosaic virus and potyviruses, toward understanding host–virus interactions and virus pathogenicity.
Acknowledgements
We thank Akemi Sato and Hisao Shinohara (Saga University, Japan) for their careful technical assistance, and Adrian Gibbs for very kindly reading the manuscript. This work was supported by Grant‐in‐Aid for Scientific Research no. 17580040 from the Japan Society for the Promotion of Science.
References
- Atreya PL, Atreya CD, Pirone TP (1991) Amino acid substitutions in the coat protein result in loss of insect transmissibility of a plant virus. Proceedings of the National Academy of Sciences, USA, 88, 11919–11923. [DOI] [PMC free article] [PubMed] [Google Scholar]
- Bateson MF, Lines RE, Revill P et al. (2002) On the evolution and molecular epidemiology of the potyvirus Papaya ringspot . Journal of General Virology, 83, 2575–2585. [DOI] [PubMed] [Google Scholar]
- Bermingham E, Moritz C (1998) Comparative phylogeography: concepts and application. Molecular Ecology, 7, 367–369. [Google Scholar]
- Bonnet J, Fraile A, Sacristán S, Malpica JM, García‐Arenal F (2005) Role of recombination in the evolution of natural populations of Cucumber mosaic virus, a tripartite RNA plant virus. Virology, 332, 359–368. [DOI] [PubMed] [Google Scholar]
- Briddon RW, Bull SE, Amin I et al. (2004) Diversity of DNA 1: a satellite‐like molecule associated with monopartite begomovirus–DNA β complexes. Virology, 324, 462–474. [DOI] [PubMed] [Google Scholar]
- Briddon RW, Stanley J (2006) Subviral agents associated with plant single‐stranded DNA viruses. Virology, 344, 198–210. [DOI] [PubMed] [Google Scholar]
- Brown JK (2001) The molecular epidemiology of begomoviruses In: Trends in Plant Pathology (eds Khan JA, Dykstra J.), pp. 279–316. Haworth Press, New York. [Google Scholar]
- Campbell P, Schneider CJ, Adnan AM, Zubaid A, Kunz TH (2006) Comparative population structure of Cynopterus fruit bats in peninsular Malaysia and southern Thailand. Molecular Ecology, 15, 29–47. [DOI] [PubMed] [Google Scholar]
- Chare ER, Holmes EC (2006) A phylogenetic survey of recombination frequency in plant RNA viruses. Archives of Virology, 151, 933–946. [DOI] [PubMed] [Google Scholar]
- Chen J, Chen JS (2000) Occurrence and control of mosaic disease [turnip mosaic virus] in saffron (Crocus sativus). Zhejiang Nongye Kexue, 3, 132–135. [Google Scholar]
- Chen J, Zheng HY, Chen JP, Adams MJ (2002) Characterisation of a potyvirus, and a potexvirus from Chinese scallion. Archives of Virology, 147, 683–693. [DOI] [PubMed] [Google Scholar]
- Chen J, Chen JP, Langeveld SA, Derks AFLM, Adams MJ (2003) Molecular characterization of carla and potyviruses from Narcissus in China. Journal of Phytopathology, 151, 26–29. [Google Scholar]
- Choi JK, Maeda T, Wakimoto S (1977) An improved method for purification of turnip mosaic virus. Annals of the Phytopathological Society of Japan, 43, 440–448. [Google Scholar]
- Dolja VV, Haldeman R, Robertson NL, Dougherty WG, Carrington JC (1994) Distinct functions of capsid protein in assembly and movement of tobacco etch potyvirus in plants. EMBO Journal, 13, 1482–1491. [DOI] [PMC free article] [PubMed] [Google Scholar]
- Domingo E, Biebricher CK, Eigen M, Holland JJ (2001) Quasispecies and RNA Virus Evolution: Principles and Consequences Landes Bioscience, Georgetown, Texas. [Google Scholar]
- Excoffier L, Laval G, Schneider S (2005) arlequin (version 3.0): an integrated software package for population genetics data analysis. Evolutionary Bioinformatics Online, 1, 47–50. [PMC free article] [PubMed] [Google Scholar]
- Fauquet CM, Mayo MA, Maniloff J, Desselberger U, Ball LA (2005) Virus Taxonomy. Eighth report of the International Committee on Taxonomy of Viruses. Elsevier Academic Press, San Diego, California. [Google Scholar]
- Felsenstein J (1985) Confidence limits on phylogenies: an approach using the bootstrap. Evolution, 39, 783–791. [DOI] [PubMed] [Google Scholar]
- Felsenstein J (1993) phylip (phylogeny interference package), version 3.5. Department of Genetics. University of Washington, Seattle, Washington. [Google Scholar]
- Fraile A, Alonso‐Prados JL, Aranda MA et al. (1997) Genetic exchange by recombination or reassortment is infrequent in natural populations of a tripartite RNA plant virus. Journal of Virology, 71, 934–940. [DOI] [PMC free article] [PubMed] [Google Scholar]
- Fu YX, Li WH (1993) Statistical tests of neutrality of mutations. Genetics, 133, 693–709. [DOI] [PMC free article] [PubMed] [Google Scholar]
- Fuji S, Nakamae H (1999) Complete nucleotide sequence of the genomic RNA of a Japanese yam mosaic virus, a new potyvirus in Japan. Archives of Virology, 144, 231–240. [DOI] [PubMed] [Google Scholar]
- Fuji S, Nakamae H (2000) Complete nucleotide sequence of the genomic RNA of a mild strain of Japanese yam mosaic potyvirus in Japan. Archives of Virology, 145, 635–640. [DOI] [PubMed] [Google Scholar]
- García‐Arenal F, Escriu F, Aranda MA et al. (2000) Molecular epidemiology of Cucumber mosaic virus and its satellite RNA. Virus Research, 71, 1–8. [DOI] [PubMed] [Google Scholar]
- García‐Arenal F, Fraile A, Malpica JM (2001) Variability and genetic structure of plant virus populations. Annual Review of Phytopathology, 39, 157–186. [DOI] [PubMed] [Google Scholar]
- Gera A, Lesemann D‐E, Cohen J et al. (1997) The natural occurrence of turnip mosaic potyvirus in Allium ampeloprasum . Journal of Phytopathology, 145, 289–293. [Google Scholar]
- Gibbs MJ, Armstrong JS, Gibbs AJ (2000) Sister‐scanning: a Monte Carlo procedure for assessing signals in recombinant sequences. Bioinformatics, 16, 573–582; http://www.anu.edu.au/BoZo/software/ . [DOI] [PubMed] [Google Scholar]
- Grant WS, Bowen BW (1998) Shallow population histories in deep evolutionary lineages of marine fishes: insights from sardines and anchovies and lessons for conservation. Journal of Heredity, 89, 415–426. [Google Scholar]
- Hall TA (1999) bioedit: a user‐friendly biological sequence alignment editor and analysis program for Windows 95/98/NT. Nucleic Acids Symposium Series, 41, 95–98. [Google Scholar]
- Hamlyn BMG (1953) Quantitative studies on the transmission of cabbage black ringspot virus by Myzus persicae (Sulz.). Annals of Applied Biology, 40, 393–402. [Google Scholar]
- Hasegawa M, Kishino H, Yano T (1985) Dating of the human–ape splitting by a molecular clock of mitochondrial DNA. Journal of Molecular Evolution, 22, 160–174. [DOI] [PubMed] [Google Scholar]
- Hey J, Harris E (1999) Population bottlenecks and patterns of human polymorphism. Molecular Biology and Evolution, 16, 1423–1426. [DOI] [PubMed] [Google Scholar]
- Hu WQ, Pu ZQ, Xu ZG, Fang ZD (1996) A viral disease of broad bean caused by a non‐aphid‐transmissible strain of turnip mosaic virus. Plant Pathology, 45, 843–847. [Google Scholar]
- Jeanmougin F, Thompson JD, Gouy M, Higgins DG, Gibson TJ (1998) Multiple sequence alignment with clustal x. Trends in Biochemical Science, 23, 403–405. [DOI] [PubMed] [Google Scholar]
- Jenner CE, Tomimura K, Ohshima K, Hughes SL, Walsh JA (2002) Mutations in Turnip mosaic virus P3 and cylindrical inclusion protein are separately required to overcome two Brassica napus resistance genes. Virology, 300, 50–59. [DOI] [PubMed] [Google Scholar]
- Kimura M (1980) A simple method for estimating evolutionary rates of base substitutions through comparative studies of nucleotide sequences. Journal of Molecular Evolution, 16, 111–120. [DOI] [PubMed] [Google Scholar]
- Klein PG, Klein RR, Rodríquez‐Cerezo E, Hunt AG, Shaw JG (1994) Mutational analysis of the tobacco vein mottling virus genome. Virology, 204, 759–769. [DOI] [PubMed] [Google Scholar]
- Kumar S, Tamura K, Nei M (2004) mega3: integrated software for molecular evolutionary genetics analysis and sequence alignment. Briefings in Bioinformatics, 5, 150–163. [DOI] [PubMed] [Google Scholar]
- Li WH (1993) Unbiased estimation of the rates of synonymous and nonsynonymous substitution. Journal of Molecular Evolution, 36, 96–99. [DOI] [PubMed] [Google Scholar]
- Martin D, Rybicki E (2000) RDP: detection of recombination amongst aligned sequences. Bioinformatics, 16, 562–563. [DOI] [PubMed] [Google Scholar]
- Martin D, Williamson C, Posada D (2005) rdp2: recombination detection and analysis from sequence alignment. Bioinformatics, 21, 260–262. [DOI] [PubMed] [Google Scholar]
- Maynard Smith J (1992) Analyzing the mosaic structure of genes. Journal of Molecular Evolution, 34, 126–129. [DOI] [PubMed] [Google Scholar]
- Moreno IM, Malpica JM, Díaz‐Pendón JA et al. (2004) Variability and genetic structure of the population of watermelon mosaic virus infecting melon in Spain. Virology, 318, 451–460. [DOI] [PubMed] [Google Scholar]
- Moury B, Morel C, Johansen E, Jacquemond M (2002) Evidence for diversifying selection in Potato virus Y and in the coat protein of other potyviruses. Journal of General Virology, 83, 2563–2573. [DOI] [PubMed] [Google Scholar]
- Moyer JW (1999) Tospoviruses (Bunyaviridae) In: Encyclopedia of Virology (eds Webster R, Granoff A.), pp. 1803–1807. Academic Press, London. [Google Scholar]
- Myers G, MacInnes K, Myers L (1993) Phylogenetic moments in the AIDS epidemic In: Emerging Viruses (ed. Morse SS.), pp. 120–137. Oxford University Press, New York. [Google Scholar]
- Ohshima K, Tanaka M, Sako N (1996) The complete nucleotide sequence of turnip mosaic virus RNA Japanese strain. Archives of Virology, 141, 1991–1997. [DOI] [PubMed] [Google Scholar]
- Ohshima K, Yamaguchi Y, Hirota R et al. (2002) Molecular evolution of Turnip mosaic virus; evidence of host adaptation, genetic recombination and geographical spread. Journal of General Virology, 83, 1511–1521. [DOI] [PubMed] [Google Scholar]
- Page RDM (1996) treeview: an application to display phylogenetic trees on personal computer. Computer Applications in the Bioscience, 12, 357–358. [DOI] [PubMed] [Google Scholar]
- Pamilo P, Bianchi NO (1993) Evolution of the Zfx and Zfy genes: rates and interdependence between the genes. Molecular Biology and Evolution, 10, 271–281. [DOI] [PubMed] [Google Scholar]
- Parks TD, Howard ED, Wolpert TJ, Arp DJ, Dougherty WG (1995) Expression and purification of a recombinant tobacco etch virus NIa proteinase: biochemical analyses of the full‐length and a naturally occurring truncated proteinase form. Virology, 210, 194–201. [DOI] [PubMed] [Google Scholar]
- Posada D, Crandall KA (2001) Evaluation of methods for detecting recombination from DNA sequences: Computer simulations. Proceedings of the National Academy of Sciences, USA, 98, 13757–13762. [DOI] [PMC free article] [PubMed] [Google Scholar]
- Provvidenti R (1980) Evaluation of Chinese cabbage cultivars from Japan and the People's Republic of China for resistance to turnip mosaic virus and cauliflower mosaic virus. Journal of the American Society for Horticultural Science, 105, 571–573. [Google Scholar]
- Provvidenti R (1996) Turnip mosaic Potyvirus In: Viruses of Plants (eds Brunt AA, Crabtree K, Dallwitz MJ, Gibbs AJ, Watson L.), pp. 1340–1343. CAB International, Wallingford, UK. [Google Scholar]
- Restrepo‐Hartwig MA, Carrington JC (1994) The tobacco etch potyvirus 6‐kilodalton protein is membrane associated and involved in viral replication. Journal of Virology, 68, 2388–2397. [DOI] [PMC free article] [PubMed] [Google Scholar]
- Revers F, Le Gall O, Candresse T, Le Romancer M, Dunez J (1996) Frequent occurrence of recombinant potyvirus isolates. Journal of General Virology, 77, 1953–1965. [DOI] [PubMed] [Google Scholar]
- Riechmann J, Laín S, García JA (1992) Highlights and prospects of potyvirus molecular biology. Journal of General Virology, 73, 1–16. [DOI] [PubMed] [Google Scholar]
- Rogers AR (1995) Genetic evidence for a Pleistocene population explosion. Evolution, 49, 608–615. [DOI] [PubMed] [Google Scholar]
- Rogers AR, Harpending H (1992) Population growth makes waves in the distribution of pairwise genetic differences. Molecular Biology and Evolution, 9, 552–569. [DOI] [PubMed] [Google Scholar]
- Roossinck MJ, Zhang L, Hellwald K‐H (1999) Rearrangements in the 5′ nontranslated region and phylogenetic analyses of Cucumber mosaic virus RNA 3 indicate radial evolution of three subgroups. Journal of Virology, 73, 6752–6758. [DOI] [PMC free article] [PubMed] [Google Scholar]
- Rozas J, Sanchez‐De I, Barrio JC, Messeguer X, Rozas R (2003) dnasp, DNA polymorphism analyses by the coalescent and other methods. Bioinformatics, 19, 2496–2497. [DOI] [PubMed] [Google Scholar]
- Rubio L, Angeles M, Ayllón A et al. (2001) Genetic variation of Citrus tristeza virus isolates from California and Spain: evidence for mixed infections and recombination. Journal of Virology, 75, 8054–8062. [DOI] [PMC free article] [PubMed] [Google Scholar]
- Saitou N, Nei M (1987) The neighbor‐joining method: a new method for reconstructing phylogenetic trees. Molecular Biology and Evolution, 4, 406–425. [DOI] [PubMed] [Google Scholar]
- Salminen MO, Carr JK, Burke DS, McCutchan FE (1995) Identification of breakpoints in intergenotypic recombinants of HIV type 1 by Bootscanning. AIDS Research and Human Retroviruses, 11, 1423–1425. [DOI] [PubMed] [Google Scholar]
- Sawyer SA (1999) geneconv: a computer package for the statistical detection of gene conversion. Distributed by the Author. Department of Mathematics. Washington University in St Louis, available at http://www.math.wustl.edu/~sawyer. [Google Scholar]
- Schaad MC, Lellis AD, Carrington JC (1997) VPg of tobacco etch potyvirus is a host genotype‐specific determinant for long‐distance movement. Journal of Virology, 71, 8624–8631. [DOI] [PMC free article] [PubMed] [Google Scholar]
- Shukla DD, Ward CW, Brunt AA (1994) In: The Potyviridae (eds Shukla DD, Ward CW, Brunt AA.), pp. 1–26. CAB International, Wallingford, UK. [Google Scholar]
- Strimmer K, Von Haeseler A (1996) Quartet puzzling: a quartet maximum likelihood method for reconstructing tree topologies. Molecular Biology and Evolution, 13, 964–969. [Google Scholar]
- Strimmer K, Goldman N, Von Haeseler A (1997) Bayesian probabilities and quartet puzzling. Molecular Biology and Evolution, 14, 210–211. [Google Scholar]
- Suehiro N, Natsuaki T, Watanabe T, Okuda S (2004) An important determinant of the ability of Turnip mosaic virus to infect Brassica spp. and/or Raphanus sativus is in its P3 protein. Journal of General Virology, 85, 2087–2098. [DOI] [PubMed] [Google Scholar]
- Swofford DL (2003) paup*. Phylogenetic Analysis Using Parsimony (*and other Methods), Version 4. Sinauer Associates, Sunderland, Massachusetts. [Google Scholar]
- Tajima F (1989) Statistical method for testing the neutral mutation hypothesis by DNA polymorphism. Genetics, 123, 585–595. [DOI] [PMC free article] [PubMed] [Google Scholar]
- Tan Z, Wada Y, Chen J, Ohshima K (2004) Inter‐ and intralineage recombinants are common in natural populations of Turnip mosaic virus . Journal of General Virology, 85, 2683–2696. [DOI] [PubMed] [Google Scholar]
- Tomimura K, Gibbs AJ, Jenner CE, Walsh JA, Ohshima K (2003) The phylogeny of Turnip mosaic virus; comparisons of thirty‐eight genomic sequences reveal a Eurasian origin and a recent ‘emergence’ in east Asia. Molecular Ecology, 12, 2099–2111. [DOI] [PubMed] [Google Scholar]
- Tomimura K, Špak J, Katis N et al. (2004) Comparisons of the genetic structure of populations of Turnip mosaic virus. West and East Eurasia. Virology, 330, 408–423. [DOI] [PubMed] [Google Scholar]
- Tomlinson JA (1987) Epidemiology and control of virus diseases of vegetables. Annals of Applied Biology, 110, 661–681. [Google Scholar]
- Traore O, Sorho F, Pinel A et al. (2005) Processes of diversification and dispersion of Rice yellow mottle virus inferred from large‐scale and high‐resolution phylogeographical studies. Molecular Ecology, 14, 2097–2110. [DOI] [PubMed] [Google Scholar]
- Tsompana M, Abad J, Purugganan M, Moyer JW (2005) The molecular population genetics of the Tomato spotted wilt virus (TSWV) genome. Molecular Ecology, 14, 53–66. [DOI] [PubMed] [Google Scholar]
- Urcuqui‐Inchima S, Haenni A‐L, Bernardi F (2001) Potyvirus proteins: a wealth of functions. Virus Research, 74, 157–175. [DOI] [PubMed] [Google Scholar]
- Verchot J, Herndon KL, Carrington JC (1992) Mutational analysis of the tobacco etch potyviral 35‐kDa proteinase: identification of essential residues and requirements for autoproteolysis. Virology, 190, 298–306. [DOI] [PubMed] [Google Scholar]
- Walsh JA, Jenner CE (2002) Turnip mosaic virus and the quest for durable resistance. Molecular Plant Pathology, 3, 289–300. [DOI] [PubMed] [Google Scholar]
- Weiller GF (1998) Phylogenetic profiles: a graphical method for detecting genetic recombinations in homologous sequences. Molecular Biology and Evolution, 15, 326–335. [DOI] [PubMed] [Google Scholar]
- Yang Z (1997) paml: a program package for phylogenetic analysis by maximum likelihood. Computer Applications in the Bioscience, 13, 555–556; http://abacus.gene.ucl.ac.uk/software/paml.html . [DOI] [PubMed] [Google Scholar]
- Yeh S‐Y, Wang H‐Y, Tsai C‐Y et al. (2004) Characterization of severe acute respiratory syndrome coronavirus genomes in Taiwan: Molecular epidemiology and genome evolution. Proceedings of the National Academy of Sciences, USA, 101, 2542–2547. [DOI] [PMC free article] [PubMed] [Google Scholar]