

Summary
The awakening of the genome after fertilization is a cornerstone of animal development. However, the mechanisms that activate the silent genome after fertilization are poorly understood. Here, we show that transcriptional competency is regulated by Brd4 and p300-dependent histone acetylation in zebrafish. Live imaging of transcription revealed that genome activation, beginning at the miR-430 locus, is gradual and stochastic. We show that genome activation does not require slow-down of the cell cycle and is regulated through translation of maternally-inherited mRNAs. Among these, the enhancer regulators p300 and Brd4 can prematurely activate transcription and restore transcriptional competency when maternal mRNA translation is blocked, whereas inhibiting histone acetylation blocks genome activation. We conclude that p300 and Brd4 are sufficient to trigger genome-wide transcriptional competency by regulating histone acetylation on the first zygotic genes in zebrafish. This mechanism is critical to initiating zygotic development and developmental reprogramming.
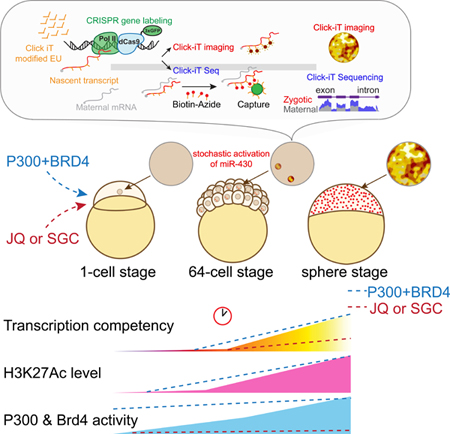
Graphical Abstract
eTOC Blurb:
Genome activation after fertilization is a cornerstone of development. Chan et al. identify the Writers and Readers of Histone Acetylation, p300 and Brd4, are limiting factors, required to activate the genome which is characterized by a gain of H3K27Ac acetylation and a stochastic activation at the first transcribed locus miR-430.
Introduction
Upon fertilization, the metazoan genome is transcriptionally silent. Understanding the mechanisms that awaken the genome remains a fundamental question in biology. Genome activation occurs during the maternal-to-zygotic transition (MZT), when developmental control shifts from maternally-provided proteins and RNAs to the zygotic nucleus. This transition is crucial to reprogram the differentiated nuclei from the sperm and the oocyte into a transient totipotent state where different cell types can be specified, and failure to activate the genome during this transition causes developmental arrest across different species(Artley et al., 1992; Edgar and Datar, 1996; Newport and Kirschner, 1982a; Schultz et al., 1999; Zamir et al., 1997). While mechanisms of zygotic genome activation (ZGA) differ across species, the timing and the number of divisions that precede genome activation is highly reproducible within species, suggesting a robust temporal regulation. Nevertheless, the mechanisms that control when and how the genome becomes activated remain poorly understood.
While the genome is silent, fertilized embryos are competent to transcribe exogenous DNA in zebrafish, Xenopus, and mouse (Harvey et al., 2013; Newport and Kirschner, 1982b; Wiekowski et al., 1993). Thus, the lack of endogenous transcription may reflect a silent chromatin state, possibly due to maternally deposited repressors or the lack of specific activators (Newport and Kirschner, 1982b). It has been proposed that the maternally deposited histones function as potential repressors (Almouzni and Wolffe, 1995; Joseph et al., 2017; Newport and Kirschner, 1982b; Prioleau et al., 1994), which are titrated down by the exponential increase in DNA content during the early cell cycles, providing a switch in transcriptional competency. Yet, it is unclear whether this relative decrease in histone levels is necessary and sufficient to mediate the switch in transcriptional competency during genome activation, as many genes in Drosophila are activated in a time dependent manner in haploid embryos (Blythe and Wieschaus, 2016; Edgar et al., 1986; Lu et al., 2009). An alternative possibility for the switch to transcriptional competency is an active mechanism mediated by proteins translated from maternal RNAs. Indeed, inhibiting translation of maternal mRNAs blocks expression of zygotic genes as well as cell division in Xenopus and Drosophila (Edgar and Schubiger, 1986; Lund and Dahlberg, 1992). Recent studies have uncovered transcription factors required for activating the first zygotically expressed genes, such as Zelda in Drosophila (Harrison et al., 2011; Liang et al., 2008; Nien et al., 2011; ten Bosch et al., 2006), Pou5f3, Sox19b and Nanog in zebrafish (Lee et al., 2013; Leichsenring et al., 2013), NF-Ya (Lu et al., 2016), and DUX transcription factors in mammals (De Iaco et al., 2017; Hendrickson et al., 2017; Iturbide and Torres-Padilla, 2017; Whiddon et al., 2017). While these transcription factors provide specificity, their binding alone is not sufficient to trigger transcriptional competency, as many bound genes are not activated during the maternal-to-zygotic transition (Leichsenring et al., 2013). Other events coincide with genome activation, including chromatin remodeling at promoters and acquisition of histone marks H3K4me3 and H3K27me3 (Akkers et al., 2009; Bogdanovic et al., 2012; Dahl et al., 2016; Li et al., 2014; Lindeman et al., 2011; Liu et al., 2016; Vastenhouw et al., 2010; Zhang et al., 2016), changes in DNA methylation pattern (Bogdanovic et al., 2016; Guo et al., 2014; Jiang et al., 2013; Lee et al., 2015; Messerschmidt et al., 2014; Potok et al., 2013) ; establishment of topologically associated domains (Du et al., 2017; Hug et al., 2017; Kaaij et al., 2018; Ke et al., 2017; Stadler et al., 2017) and acquisition of H2AZ nucleosomes in the promoter of zygotic genes (Murphy et al., 2018; Zhang et al., 2014b). While these might contribute to transcriptional competency, their direct roles and sufficiency in genome activation is unclear. Thus, although some gene-specific elements have been identified and chromatin architecture emerges during zygotic genome activation, the mechanisms that prepare the silent embryonic genome for transcriptional competency remain poorly understood.
In this study, we combine live-imaging and RNA expression analysis during embryogenesis to interrogate the cellular and molecular mechanisms that mediate zygotic genome activation in zebrafish. We find that transcription competency during zygotic genome activation is achieved via the function of P300 and Brd4, two factors that are required and sufficient to prepare the genome for transcriptional activation.
Results
Genome activation initiates at the miR-430 locus in zebrafish
The maternal-to-zygotic transition (MZT) represents a major switch in the transcriptional competency of the genome. Despite the progress made in understanding this universal transition (Lee et al., 2014; Schulz and Harrison, 2018), it is not fully understood how genome activation first begins. For example, in zebrafish transcription might begin simultaneously across the genome and synchronously across all cells in the embryo, or the process may be sequential or stochastic. To address these questions, we first analyzed global transcription during MZT using metabolic RNA labeling, Click-iT (Jao and Salic, 2008), an approach similar to previously published work in zebrafish embryos (Heyn et al., 2014). Instead of 4-thio-UTP, 5-ethynyl uridine (EU) was injected at the one-cell stage zebrafish embryos, and incorporated into nascent RNA as the embryo progresses through development. Newly transcribed RNAs are then detected by Click-It chemistry (Jao and Salic, 2008) through either imaging or sequencing (Click-iT-seq) (Figures 1A, 1B, and S1A–S1J, S2C–S2D; STAR Methods). This analysis expanded previous studies (Heyn et al., 2014; Lee et al., 2013) and identified 2669 genes transcribed by 4 hours post-fertilization (hpf) in zebrafish, that had an increase exon or intron signal when compared to embryos treated with the RNA polymerase II (Pol II) inhibitor triptolide (Figure S1, and Table S1–S2; STAR Methods). To characterize the spatiotemporal dynamics of transcription across the embryo during genome activation, we assayed for poised RNA polymerase II (Pol II p-Ser5) (Figures 1C, 1E and S2B) and for RNA synthesis using Click-iT imaging at single-cell resolution. We first observed poised RNA pol II and nascent transcription in two foci at the 64-cell stage (2 hpf) (Figures 1B, 1C and 1E). As a control, embryos treated with RNA Pol II inhibitors triptolide (Titov et al., 2011) or α-amanitin (Kane et al., 1996; Lindell et al., 1970) lacked EU-labeled nascent transcripts (Figure 1B). Pol II p-Ser5 signal colocalized with foci of active transcription and was limited to specific stages of the cell cycle during late interphase and early prophase (Figure S2A), indicating that Pol II activity is regulated during the cell cycle.
Figure 1. Zygotic genome activation begins with the miR-430 locus in a gradual and stochastic manner.

(A) Schematic illustrating strategies used to visualize global transcription using Click-iT chemistry (left) and the miR-430 locus using CRISPR-dCas9–3xGFP (dCas9) (right). (B) Time-course imaging analysis of Click-iT labeled zygotic transcription from 32-cell (~1.75hpf) to sphere stage (~4hpf). Representative nucleus from embryos treated with transcription inhibitors (α-amanitin and triptolide) are shown as negative control. Scale bar represents 5 μm. Nucleus is outlined using DAPI signal by a dotted line. (n=the fraction of analyzed nuclei that shows the same transcriptional output as the representative nucleus) (C) Representative single nucleus confocal images labeled with DAPI, phosphorylated Ser5 RNA pol II (Pol II p-Ser5), miR-430 loci, and Click-iT (transcription). Scale bar represents 5 μm. Insets represent single plane images of individual foci showing co-localized signal. (D) CRISPR-dCas9 labeling reveals two foci signals in wild-type embryos but not in miR-430−/− mutants that lack the miR-430 locus, demonstrating the signal specificity towards the miR-430 endogenous locus. (n=number of analyzed nuclei across three embryos). Scale bar represents 5 μm. (E) Time-course analysis of single nuclei labeled for Pol II p-Ser5 and dCas9 targeting the miR-430 locus from 32-cells to shield stage. Scale bar represents 5 μm. (F) Schematic illustrating in vivo labeling of nascent transcript of miR-430 in zebrafish embryos for live imaging using a molecular beacon (MBmiR430). (G, H) miR-430 transcription in vivo visualized by MBmiR430 during 128-cell stage cell cycle in wild type (G) or miR-430−/− mutant (H). Chromatin is labeled with Alexa Fluor® 488 histone H1. Scale bar represents 5 μm. The approximated stage of the cell cycle is inferred by level of condensation of the chromatin and the shape of the nucleus as labeled by the Alexa Fluor® 488 histone H1. MBmiR430 signals are highlighted by white arrows in the confocal images. miR-430 transcription is only detected in late interphase and early prophase (mitosis). Note the absence of MBmiR430 signal in miR-430−/− mutants. (I) MBmiR430 mean fluorescence intensity (MFI) quantified over each cell cycle in wild-type embryos and (J) miR-430−/− mutant embryos. Red dots represent the time points when MBmiR430 signal is detected; grey dots represent the nuclear background MBmiR430 signal. (n=number of nuclei imaged; percentage represents the proportion of analyzed nuclei that display miR-430 transcription) (K) Representative cell-lineage tracing for miR-430 transcription. Transcription competency is acquired in a stochastic manner at 64c, and once gained is maintained in the daughter cells after cell division. See also Figure S1 and S2; Movie S1 and S2.
Previous studies suggested that miR-427/430, a microRNA family that regulates the clearance of maternal mRNAs (Giraldez et al., 2006; Lund et al., 2009), as a potential candidate for one of the earliest transcribed loci in Xenopus and zebrafish (Heyn et al., 2014; Lund et al., 2009) (Figure 1D). To test this, we adapted CRISPR-dCas9-GFP-mediated labeling of endogenous loci (Ma et al., 2015) by co-injecting dCas9–3xGFP with 2 gRNAs at the one-cell stage. These two gRNAs target dCas9–3xGFP at 20 sites on the endogenous miR-430 locus, a repetitive gene with 54 copies within 17kb in chromosome 4 (Figures 1A, 1C–1E and S2A–S2C and Movie S1). We observed that miR-430 loci colocalize with the earliest detected transcription and pSer5PolII signal in 64-cell stage embryos (Figures 1C, 1E and S2B), consistent with previous observations (Heyn et al., 2014). This signal is highly specific to miR-430, as it is not detected in a miR-430 homozygous deletion mutant (Liu et al., 2013) (Figure 1D). These results reinforce the notion that the genome undergoes a gradual activation of transcription during MZT, in which miR-430 is the earliest active locus detected in the genome.
During early development, rapid cell cycles are synchronous (Tadros and Lipshitz, 2009). To determine whether genome activation occurs simultaneously throughout the embryo, we adapted a method to visualize miR-430 transcription in vivo using a molecular beacon (MBmiR430) (Chen et al., 2016) complementary to the primary miR-430 transcript (Figure 1F). The 5’ and 3’ ends of the stem are modified with a Lissamine fluorescent tag and a fluorescence quencher (Dabcyl), which reduces the fluorescent background when the probe is not bound to its target. This molecular beacon detects miR-430 transcription specifically, as the signal is lost in miR-430 homozygous deletion mutants and in embryos treated with the Pol II inhibitor α-amanitin (Figure S2E). Injection of MBmiR430 into one-cell stage embryos, followed by time-lapse confocal analysis, revealed that transcriptional competency is briefly achieved towards the end of cycle 6 (by the 64-cell stage) before the cell cycle slows down (Figures 1G–1J and Movie S2), with an increase in the intensity and duration of transcription over each cell cycle (Figures 1I). Despite the synchronous cell cycle, lineage analysis of cells exhibiting miR-430 transcription revealed that transcription competency is achieved in a stochastic pattern across the cells (Figures 1K and S2F). In particular, only a fraction (43%) of the imaged nucleus exhibited miR-430 transcription at 64-cell stage. Most cells activated both alleles simultaneously (>80% of the cells), and once competency is achieved, the active state is maintained in the daughter cells (Figures 1K and S2F), suggesting a heritable pattern. However, as all nuclei eventually express miR-430 by 256-cell stage, it is impossible to discern whether the activation pattern is a result of developmental time rather than heritability. These results suggest that transcriptional competency is first achieved at the miR-430 locus, in a stochastic manner during development.
Transcriptional competency depends on developmental time independent of cell division
To test whether lengthening of cell cycle could affect transcriptional output across the genome, we uncoupled developmental time and cell division by blocking DNA replication (Figure 2A). Chk1 blocks the formation of the origin of replication and slows cell divisions during the mid-blastula transition (MBT) (Collart et al., 2013; Collart et al., 2017). Premature Chk1 expression through mRNA injection at the 1-cell stage stops cell division in Xenopus (Collart et al., 2017) and zebrafish (Figures 2B and 2C), arresting embryos between 4- and 16-cell stages throughout the first 6 hours of development. Chk1 injected embryos (Chk1OE) increased miR-430 transcription at 2 hpf (Figure S3E) due to the longer cell cycle and subsequent increased duration of Pol II activity (Yonaha et al., 1995). However, stopping the cell cycle by Chk1 expression is not sufficient to cause premature and widespread genome activation at this developmental time as assayed by Click-iT labeling of transcription (Figure S3E), consistent with a previous study that analyzed a few genes upon extending the cell cycle by 5–10 minutes with Chk1 expression (Zhang et al., 2014a). These results suggest that slowdown of the cell cycle during MBT contributes to transcriptional output, but is not sufficient to trigger premature genome activation.
Figure 2. Genome activation occurs over time independent of the N/C ratio.

(A) Schematic illustrating the strategy to induce cell cycle arrest by expressing chk1 in zebrafish embryos. (B) Transmitted light microscopy picture of wild type (WT) and chk1-injected embryos (+chk1) at different times (hours post fertilization, hpf). (C) Bar plot quantifying the number of cells in wild type (WT) and chk1 (n=number of embryos analyzed) (D) Single nucleus confocal image of DAPI, Pol II p-Ser5 and transcription (Click-iT) in different conditions as indicated at 4hpf (+Trip, incubated with triptolide). Click-iT signal intensity is presented in a heatmap color scale. Scale bar represents 5 μm. (E) Box and whisker plots showing the mean fluorescence intensity for Click-iT signal in the conditions shown in (D). (****P<0.0001; ** P=0.0058, two-sample t-test: WT (n=129); +chk1 (n=21); +chk1+triptolide (n=15)) (F) Biplot comparing intron expression levels of genes in chk1-injected embryos with and without triptolide treatment reveals genome activation occurs in chk1-injected embryos at 4hpf. The solid black line represents the diagonal and the dashed lines represent 4-fold change. (G) Genome tracks representing normalized Click-iT-seq signal for examples of zygotic genes activated in chk1-injected embryos with (+chk1+triptolide) and without triptolide (+chk1). RPM (STAR Methods). See also Figure S3.
Another mechanism proposed to trigger genome activation is a high nuclear-to-cytoplasmic ratio (N/C ratio), in which activation of the silent chromatin requires progressive cell divisions to titrate out excess maternal repressors (Almouzni and Wolffe, 1995; Newport and Kirschner, 1982b; Prioleau et al., 1994). Specific histones can repress transcription in vitro in Xenopus egg extracts (Amodeo et al., 2015), potentially through competition with transcription factors or transcriptional machinery over access to low levels of DNA (Joseph et al., 2017; Prioleau et al., 1994). Chk1OE embryos also allowed us to address whether titration of maternal histones by DNA is required for genome activation (high N/C ratio). Chk1OE embryos stall cell division, and maintain a low N/C ratio over time, as quantification showed that DNA template and histone levels were equivalent to 16–32-cell stages of wild-type embryos (Figures S3A and S3B). Despite the low N/C ratio, Chk1OE embryos activated their genomes over time at 4 hpf, unlike control triptolide-treated embryos, as shown by Click-iT imaging and Click-iT-seq (Figures 2D–2G and S3C and S3D). To further measure transcription of Chk1OE embryos directly, we used Click-iT-seq of nascent RNAs to quantify exonic and intronic sequences. The latter provides better signal-to-noise ratio and thus increases the sensitivity of Click-iT-seq, as most maternally deposited mRNAs are spliced and the introns are degraded early on (Lee et al., 2013). Because Chk1OE embryos have a lower number of cells (and DNA template) than time-matched wild type embryos, total Click-iT-seq read levels are also lower. Thus, to identify the genes activated in Chk1OE embryos, we compared Click-iT captured gene expression between Chk1OE embryos and control triptolide-treated Chk1OE embryos, which have the same amount of DNA template. Chk1OE embryos activate 67.8% of the zygotic genes compared to triptolide treated Chk1OE embryos (1218 zygotic and 591 Maternal zygotic genes upregulated ≥ 4-fold; Table S3, STAR Methods and Figures 2F and 2G). These results indicate that dilution of maternal repressors through changes in the N/C ratio are not obligatory for genome activation, and thus suggest that activation of the zygotic genome depends on developmental time independent of cell division.
Transcriptional levels are modulated by the nuclear/cytoplasmic ratio
Single nucleus analysis of transcription revealed significantly lower Click-iT signal in nuclei from Chk1OE embryos compared to that of time-matched wild type embryos (Figures 2D and 2E). This is consistent with previous studies and indicates that embryos with low N/C ratio have lower transcription levels (Almouzni and Wolffe, 1995; Amodeo et al., 2015; Dekens et al., 2003; Jevtic and Levy, 2015; Joseph et al., 2017; Newport and Kirschner, 1982b; Prioleau et al., 1994). To test this further, we compared the transcription competency of embryos with different N/C ratio by manipulating their ploidy. We quantified transcriptional competency of haploid and diploid genomes using Click-iT-seq analysis by comparing the RNA captured from the same number of embryos while maintaining the same amount of active DNA template. To achieve this, i) we collected twice as many haploid embryos as diploid embryos to correct for the 2-fold difference in active DNA template; and ii) compensated the difference in the number of embryos collected by adding α-amanitin treated diploid embryos to the diploid samples (Figure 3A). This allows us to keep the number of embryos collected per sample constant; and control for the same maternal mRNA background. At 512-cell stage, diploid embryos displayed higher transcription levels than haploid embryos as the majority of the genes (85%) are expressed at a higher level in diploid than haploid embryos, with 1,088 genes beyond 4-fold (Figures 3B, 3C and S4A–S4C and Table S4). The lower gene expression in haploid relative to diploid samples is consistent with a transcriptional repressive role for the low N/C ratio. At 1K-cell stage, the difference in transcription competency between the haploid and diploid genome was reduced with only 163 genes displaying 4-fold difference (Figures S4G–S4I), suggesting that the repressive effect brought about by the low N/C is relieved over developmental time, consistent with the observed transcriptional activation at 4hpf in Chk1OE embryos despite the low N/C ratio. To further examine the repressive effect of low N/C ratio, we compared the relative expression of individual activated genes in both haploid and diploid conditions (STAR Methods and Figures S4P–S4Q). Stacked bar plot comparing the normalized expression of genes between stage-matched haploid and diploid condition indicates a spectrum of N/C ratio dependence across the activated genes (Figures 3C and S4P–S4Q). In particular, we observe that genes less affected by N/C ratio are significantly shorter in gene length than those more affected by N/C ratio (Figure 3D). Some examples of genes less affected by N/C ratio include aplnrb, mxtx2 and ddit4; examples of genes more affected by N/C ratio include vgll4l, asb11, fbxo5 (Figures 3E and S4R). Together, these results indicate that while high N/C ratio is not obligatory for transcriptional activation, lower N/C ratio poses repressive effect on transcriptional activation, and individual genes overcome this repression differentially over developmental time during zygotic genome activation.
Figure 3. The timing of zygotic genome activation is influenced by the ploidy of the embryo.

(A) Schematic illustrating the strategy to compare transcription competency between stage-matched haploid and diploid zebrafish embryos using Click-iT-seq analysis. Haploid is represented by 1n; Diploid is represented by 2n. (B) Biplot comparing whole gene expression levels of genes measured by Click-iT-seq in haploid and diploid embryos at 512-cell stage. The solid black line represents the diagonal and the dashed lines represent 4-fold change. (C) Stacked bar plot comparing the normalized expression levels of genes measured by Click-iT-seq in diploid embryos with haploid embryos at 512-cell stage on all zygotic (1,571 genes) and maternal zygotic (987 genes) genes (STAR Methods). Genes are ranked by the normalized expression level in diploid embryos. Dash line represents N/C ratio contribution of 0.5, which is used as a reference threshold to distinguish between N/C ratio dependent and independent genes. Example N/C ratio dependent and independent genes are highlighted. To compare the gene expression level between diploid and haploid embryos, the expression levels of genes were normalized by the expression level in α-amanitin treated embryos to take into account the maternal contribution (STAR Methods). (D) Box plots quantifying the mean gene length for N/C ratio independent (N/C ratio contribution ≥ 0.5) and N/C ratio dependent (N/C ratio contribution > 0.5) genes at 512-cell stage (Two sample t-test of gene length comparison: N/C ratio independent < N/C ratio dependent, ****P = 1.8 × 10⁻²⁴, two-sample t-test: N/C ratio independent (n=177); N/C ratio dependent (n=1,998)). Note that N/C ratio independent genes are significantly shorter than N/C ratio dependent ones. (E) Genome tracks representing normalized Click-iT-seq signal measured at 512-cell stage in diploid, α-amanitin treated diploid, haploid and α-amanitin treated haploid embryos of N/C ratio independent and dependent genes. See also Figure S4.
Translation of maternally-provided mRNAs controls ZGA
We hypothesized that transcriptional competency might be regulated by a developmental timer that depends on the translation of maternal mRNAs or the function of maternally deposited proteins on the chromatin. To test this model in zebrafish embryos, we took a similar approach as prior studies in Drosophila and Xenopus (Edgar and Schubiger, 1986; Lund and Dahlberg, 1992) to block mRNA translation initiation and elongation with Pateamine A (PatA) and Cycloheximide (CHX) (Bordeleau et al., 2006; Low et al., 2005; Schneider-Poetsch et al., 2010) before transcription is detected. PatA+CHX treatment at the 8- or 32-cell stages significantly reduced translation and arrests the cell cycle at the 16- and 64-cell stages respectively (Figures 4A, S5A and S5B)(Beaudoin et al., 2018) maintaining a low N/C ratio over time similar to that observed in Chk1OE embryos (Figure 2C). We observed global transcriptional activation by 4 hours when translation was inhibited by the 64-cell stage when compared to α-amanitin treated controls (2213 genes upregulated ≥ 4-fold; Table S3, STAR Methods and Figures 4B–4C and S5C–S5F). Examples of these include mxtx2, klf17, her5 and aplnrb (Figure 4D). Similar to Chk1OE embryos, PatA+CHX treated embryos exhibited lower Click-iT-seq read levels than time-matched wild type embryos at 4hpf due to their lower number of nuclei (i.e. DNA template) per embryo. However, blocking translation 30 minutes earlier, by the 16-cell stage, reduced transcriptional competency (to only 256 genes upregulated ≥ 4-fold; Table S3, STAR Methods and Figures 4B–4C and S5C–S5F). Based on these results, we conclude that the maternal factors translated by the 64-cell stage (2 hpf) are sufficient to trigger global genome activation for 82.9% of the zygotic transcripts and overcome the repressive effect on low N/C ratio. These results are consistent with observations in Xenopus where blocking translation of maternal mRNAs allows transcription of individual genes (Lund and Dahlberg, 1992). Despite the constant N/C ratio over that time, global activation is only observed at 4 hpf, suggesting that the maternal factors translated by the 64-cell stage still require additional time to induce transcriptional competency, possibly by regulating the chromatin during that time.
Figure 4. Transcriptional competency of the zygotic genome depends on the translation of maternal mRNAs.

(A) Embryos treated with pateamine A (PatA) and cycloheximide (CHX) at 8- (1.25hpf) and 32-cell stage (1.75hpf) arrests zebrafish embryos at 16- and 64-cell stage respectively. (B, C) Biplot of Click-iT-seq RNA levels at 4hpf comparing the level of transcription using intron signal. Embryos were treated with PatA + CHX at 8-cell stage (B) or at 32-cell stage (C), with and without α-amanitin. Dashed lines represent 4-fold change. (D) Genome tracks representing normalized Click-iT-seq signal in the embryos described in (B) and (C). Click-iT-seq was normalized by the total number of mitochondrial RNAs, as an internal control. RPM (STAR Methods). See also Figure S5.
P300 and Brd4 functions are required for zygotic genome activation
To identify temporal regulators of genome activation, we analyzed the chromatin marks labeling the first active genes and interrogated their function using chemical inhibitors for writers and readers of these marks. Two lines of evidence indicate that genome activation coincides with the acquisition of H3K27Ac and requires writing and reading of this mark by bromodomain-containing proteins P300/CBP and Brd2–4, respectively. First, we analyzed the first active gene (miR-430) for histone modifications H3K27Ac, H3K4me1, H3K4me3, at dome stage (4.3 hpf), using public datasets (Bogdanovic et al., 2012). MiR-430 was the top labeled locus with each of these marks (Figures 5A, S6A–S6C and S6G). Consistent with these results, imaging analysis revealed that the earliest H3K27Ac and H3K4me3 signals colocalized with the miR-430 locus (Figures 5C and S6H). At later stages, among the different histone marks, H3K27Ac showed the best correlation with transcription as assayed by Click-iT-seq (r=0.53, Spearman correlation, P = 3.9×10−50, rank correlation independence test)(Figures 5B and S6D–S6F). Second, we analyzed the effect of different small molecule inhibitors targeting readers or writers for H3K4me3 and H3K27Ac (Figure S6I). Among these drugs, treatment with JQ1 (an inhibitor of BET bromodomains BRD2–4) (Filippakopoulos et al., 2010), or SGC-CBP (an inhibitor of histone acetyltransferase P300 and CBP) (Hammitzsch et al., 2015; Hay et al., 2014) resulted in a significant reduction of zygotic transcription (Figures 5E–5G and S6J–S6P), which in turn blocked gastrulation (Figure 5D). For example, intron analysis revealed that 84% of zygotically-transcribed genes were reduced in expression ≥ 4-fold (Table S3, STAR Methods) by JQ1 when compared to wild type embryos (Figure 5F). This effect was also apparent for housekeeping and developmental genes (Figures 5G and S6P). These results suggest that the targets of JQ1 and SGC-CBP (BRD2–4 and P300/CBP) are required to initiate transcriptional competency across the zygotic genome.
Figure 5. H3K27Ac correlates with transcriptional activation during ZGA.

(A) Genome tracks representing normalized Click-iT-seq signal and histone mark level at the miR-430 locus. ChIP-seq data (Bogdanovic et al., 2012). RPM for Click-iT-Seq/ChIP-Seq (STAR Methods). (B) Time resolved single nucleus confocal imaging analysis of H3K27Ac from 256-cell to sphere stage reveals a positive correlation with the level of Click-iT signal. Both H3K27Ac and Click-iT signal intensity are presented in a heatmap color scale. Scale bar represents 5 μm. (C) Single plane confocal image labeled for DAPI, H3K27Ac, dCas9-miR-430 and Click-iT. Note the co-localization of H3K27Ac with Click-iT labeled transcription activity at the miR-430 locus. (n=the fraction of analyzed nuclei that shows the same co-localization of H3K27Ac with Click-iT labeled transcription at the miR-430 locus as the representative nucleus, >3 independent embryos are imaged) Scale bar represents 5 μm. (D) Schematic illustrating the selective pharmacologic inhibition of the activity of the BET bromodomain proteins (BRD2–4) and CBP/P300 by JQ1 and SGC respectively (top). Embryos treated with JQ1 and SGC both arrest before gastrulation similar to those treated with triptolide, consistent with a loss of zygotic transcription (bottom) (Ac = H3K27 acetylation, TFs = transcription factors). (E) Click-iT imaging analysis in wild-type, triptolide, JQ1 and SGC treated embryos reveals a significant reduction in transcription by the treatment of JQ1 and SGC. Click-iT signal intensity is presented in a heatmap color scale. Scale bar represents 5 μm. (F) Biplot comparing intron expression levels of genes measured by Click-iT-seq in triptolide (left) and JQ1 (right) treated embryos with wild-type embryos at 4hpf. Dashed lines represent 4-fold change. (G) Genome tracks representing normalized Click-iT-seq signal measured at 4hpf in wild-type, triptolide, JQ1 and SGC treated embryos for examples of zygotic genes. RPM (STAR Methods). See also Figure S6.
Brd4 and P300 are sufficient to activate zygotic transcription prematurely
Based on the chemical inhibitors that block transcriptional competency after fertilization, we hypothesized that the writing (P300) and reading (Brd4) of histone acetylation are required to achieve transcriptional competency, and that these activities are limiting during the initial stages of the MZT. In this model, only when these activities have reached a certain threshold, does the genome becomes competent for activation. To test this model, we first analyzed the level of translation of these factors using ribosome profiling before (i.e. 0hpf and 2hpf) and after zygotic genome activation (i.e. 5hpf). This analysis revealed high levels of translation for the maternally deposited p300 and Brd4 mRNA before zygotic transcription begins (Figures S7A–S7D), but their translation diminishes after ZGA (Figures S7A–S7D), suggesting a temporal regulation of their translation during MZT. Next, we analyzed whether a premature increase in Brd4 and P300 levels can regulate the timing of genome activation. Injection of P300 and BRD4 proteins at the 1-cell stage led to premature activation of the zygotic genome and an increase in H3K27Ac coincided with Click-IT signal, revealing premature miR-430 expression at the 32-cell stage (Figure 6A). Click-iT analysis of zygotically-transcribed mRNAs revealed an increase in transcriptional output and H3K27Ac by 1K-cell stages (Figures 6B, 6C and S7E–S7K). In support of this, RNA-seq analysis revealed >2-fold increase in zygotic transcription in P300+BRD4 expressing embryos compared to wild type (Figures 6D–6F and Table S5), with 729 genes upregulated ≥ 4- fold (Table S3, STAR Methods) in P300+BRD4 injected embryos. Together, these results suggest that P300 and Brd4 can advance transcriptional competency during the maternal-to-zygotic transition.
Figure 6. P300 and BRD4 are limiting factors regulating zygotic genome activation.

(A, B) Single nucleus imaging analysis of H3K27Ac and Click-iT signal comparing embryos with and without early expression of P300 and BRD4 at 32-cell (A) and 1K-cell stage (B). Scale bar represents 5 μm. WT: wild-type embryos; P300+BRD4: embryos with early expression of P300 and BRD4 protein; triptolide: embryos treated with triptolide. Both H3K27Ac and Click-iT signal intensity are presented in a heatmap color scale. Inset highlights the single plane confocal image of region with Click-iT signal co-localizing with high H3K27Ac signal. (n=number of incidence among the total number of nuclei imaged) (C) Box and whisker plots quantifying the mean fluorescence intensity for H3K27Ac and Click-iT signal in the conditions described in (B) (Two sample t-test of H3K27Ac signal: P300+BRD4 > WT P=0.0068; P300+BRD4 > triptolide P=0.0013; WT~Trip P=0.2482. Two sample t-test of Click-iT signal: P300+BRD4 > WT P=0.0068; P300+BRD4 > triptolide P=0.0013; WT~Trip P=0.2482). (D) Stacked bar plots comparing the total number of read count of zygotic and maternal zygotic genes in wild-type embryos (WT) and embryos with early expression of P300 and BRD4 protein (P300+BRD4) at 1K-cell stage. (E) Biplot comparing intron expression levels measured with Click-iT-seq in wild-type embryos and embryos with early expression of P300 and BRD4 at 1K-cell stage. Dashed lines represent 4-fold change. (F) Heatmap comparing intron expression levels of published zygotic genes in α-amanitin treated embryos (α-amanitin) and embryos expressing P300 and BRD4 (+P300+BRD4) with wild-type embryos (WT). Genes in the heatmap are ranked by transcription level from low to high (top to bottom) based on the difference in intron expression levels (intron RPKM) between WT embryos and α-amanitin treated embryos. Genes without intron are not included in the heatmaps. Details of gene list are included in Supplementary Table 5. (G) Biplot comparing intron expression levels measured by Click-iT-seq for embryos treated with PatA + CHX at 8-cell stage injected with and without P300 and BRD4. (H) Genome tracks representing normalized Click-iT-seq signal in the conditions described in (G). Normalized Click-iT-seq signal for embryos treated with PatA + CHX at 8-cell stage in the presence of α-amanitin is shown as control. RPM (STAR Methods). See also Figure S7.
Previous results inhibiting translation during development demonstrated that the maternal factors are limiting early in development, hence preventing transcriptional competency (Figures 4B and 4C). Single nucleus imaging analysis revealed a significant reduction in H3K27Ac signal from translation-inhibited embryos compared to that from time-matched wild type embryos (Figures S7L and S7M). To determine whether the level and activity of P300 and BRD4 are responsible for limiting transcriptional competency in translation-inhibited embryos, we introduced P300+BRD4 into embryos treated with PatA+CHX at 8-cell stage. Quantification of zygotic transcription using Click-iT-seq revealed an increase in zygotic transcripts compared to wild type embryos, with 623 genes activated ≥ 4-fold (Figures 6G and 6H; Table S3, STAR Methods) and an increase in H3K27Ac signal (Figures S7L–S7P) by the injection of P300+BRD4 in the translation-inhibited embryos. Together, our results suggest that P300 and Brd4 are highly translated maternal factors that function as a temporal switch to confer transcriptional competency via histone acetylation to the fertilized egg, regulating the timing and transcriptional output during zygotic genome activation.
Discussion
Our results provide two major insights into the mechanisms that activate the zygotic genome after fertilization. First, transcriptional competency depends on translation of maternal mRNAs and can be achieved at low N/C ratio over developmental time without diluting maternal repressors by progressive cell divisions (Figure 7). We find that Pol II is regulated during the cell cycle (Figure S2). This is consistent with the increase in transcription output with the lengthening of the cell cycle (Collart et al., 2013; Zhang et al., 2014a), and could contribute to the transition from stochastic to global transcription (Stapel et al., 2017). However, stopping the cell cycle does not cause premature genome activation (Figure S3E), which is evidence that the slow down of the cell cycle that takes place during MZT is not sufficient to activate the zygotic genome. These results are consistent with previous studies that used low levels of Chk1 to slow down the cell cycle by 5–10 minutes (Zhang et al., 2014a). Furthermore, stopping the cell cycle by either inhibiting the formation of the origin of replication (Chk1OE) or by blocking translation demonstrates that transcriptional competency is acquired over time and does not require titration of histones by replicating DNA (Figures 2D–2G and 4A, 4C–4D). While these results demonstrate than a high N/C ratio is not obligatory for transcriptional competency, comparing transcription levels in haploid and diploid embryos reveals that haploid embryos express lower levels of zygotic genes (Figure S4), consistent with histones having a repressive effect on transcription in vivo and in vitro (Almouzni and Wolffe, 1995; Amodeo et al., 2015; Dekens et al., 2003; Jevtic and Levy, 2015; Joseph et al., 2017; Newport and Kirschner, 1982b; Prioleau et al., 1994). Consistent with these observations, haploid Drosophila embryos activate a large set of genes dependent and independent of the N/C ratio (Blythe and Wieschaus, 2016; Edgar et al., 1986; Lu et al., 2009). We speculate that the increase in histone acetylation observed during MZT relieves the repressive activity of histones, providing a temporal regulator of transcriptional activation during MZT.
Figure 7. Models proposed for temporal regulation of the onset of genome activation.

(A) In fast developing embryos such as Xenopus, zebrafish, D. melanogaster, cell divisions are rapid and synchronous, consisting only of S and M-phases until midblastula transition (MBT) (Gotoh et al., 2011; Jukam et al., 2017; Lee et al., 2014; Tadros and Lipshitz, 2009). It was proposed that the short cell cycle length is not permissive for transcription, especially for longer genes (Heyn et al., 2014; Lee et al., 2013). Hence, it was thought that genome activation is not permitted until the cell cycle lengthens. (B) The nuclear-to-cytoplasmic ratio (N/C ratio) model proposes the presence of maternally deposited repressors, namely histones that bind and compact DNA, preventing the access of the transcription machinery and hence repressing transcription. It is thought that the exponential increase in DNA content through progressive cell division is required to titrate out histone, alleviating the transcription repression (Almouzni and Wolffe, 1995; Campos and Reinberg, 2009; Han and Grunstein, 1988; Joseph et al., 2017; Lorch et al., 1987; Newport and Kirschner, 1982b; Prioleau et al., 1994; Workman and Kingston, 1998). As an extension of this model, it was proposed that transcription factors compete with histones for genome competency (Ferree et al., 2016). Hence, the excess histones initially outcompete the limited level of transcription factors and prevent early transcription; as the level of transcription factors accumulate and the histone level is titrated, the ratio shifts in favor of transcriptional activation, and hence giving rise to genome activation. (C) The developmental timer model describes the limiting amount or activity of specific maternally-deposited activators upon fertilization; and proposes that transcription is permitted when critical threshold levels of these activators are achieved over time (Giraldez, 2010; Gotoh et al., 2011; Jukam et al., 2017). (D) Our studies propose P300 and BRD4 are limiting factors that regulate zygotic genome activation through histone acetylation. On the molecular level, early embryos such as 16-cell stage embryos lack genome competency due to the limiting activity of P300 and BRD4. At 64-cell stage, the embryo has accumulated sufficient maternal activators to trigger global genome activation. However, additional time is required to induce transcriptional competency via histone acetylation, and hence genome activation is not observed at this stage without additional developmental time. At sphere stage, zygotic genome activation is observed since sufficient level of maternal activators as well as time are provided to the embryonic genome to acquire transcriptional competency. Experiments overexpressing p300 and BRD4 protein in PatA+CHX-treated embryos by 16-cell stage restores genome activation over time, demonstrating the requirement of p300, Brd4 and histone acetylation for regulating the timing and transcriptional activation during ZGA (see the top illustration highlighted by dotted lines).
Second, we demonstrate that the activities of histone acetylation writer P300 and reader Brd4 are necessary and sufficient to modulate transcriptional competency during MZT. We show that transcriptional competency increases over developmental time independent of cell division or continuous protein translation and we propose that this activity depends on histone acetylation through P300 and Brd4. Our study provided two lines of evidence that support the role of P300 and Brd4 in regulating transcriptional activation in zebrafish embryos. First, functional inhibition of both factors by JQ1 and SGC reduces transcription competency of the embryo (Figures 5D–5G and S6J–S6P). Second, overexpression of P300 and BRD4 increases histone acetylation, prematurely activates the genome, and restore transcriptional competency in embryos with reduced translation (Figures 6 and S7), demonstrating that their activity is sufficient to trigger transcriptional competency. Interestingly, the level of activation correlates with the acquisition of histone acetylation (Figures 5–6, S6A–S6F and S7L–S7P), and our ribosome profiling analysis revealed high level of translation of the maternally deposited p300 and brd4 mRNA before transcription first begins (Figures S7A–S7D). Consistent with the role of histone acetylation during ZGA, H4K8Ac, H3K18Ac, and H3K27Ac coincides with genome activation in Drosophila (Harrison and Eisen, 2015; Li et al., 2014). Our findings provide a key functional link between the activity of the enhancer regulators, P300 and Brd4 (Pradeepa, 2017) with transcriptional competency during MZT. However, it remains unclear whether transcriptional competency is regulated at the level of protein abundance, or their activity instead, which can be modulated by additional factors such as Casein kinase II (CK2) and phosphatase 2A (PP2A) (Chiang, 2016). Protein quantification with specific antibodies would further provide insights on its temporal dynamics. Interestingly, Western blots analysis indicated that Brd4 protein was abundantly provided maternally (data not shown). These results are consistent with prior analysis of Brd4 in zebrafish (Toyama et al., 2008), and suggest alternative levels of regulation beyond protein abundance such as post-translational modification or changes in nuclear localization. It has been shown that the increase in the volume of the nucleus modulating the nuclear import machinery can cause premature onset of zygotic transcription (Jevtic and Levy, 2015). It will be interesting to test whether these manipulations affect the levels of Brd4 and P300 in the nucleus. Previous studies in zebrafish have shown that sequence-specific transcription factors (TFs) Nanog, SoxB1 and Pou5f1 are required for initiating a significant fraction of the first wave of ZGA (Lee et al., 2013; Leichsenring et al., 2013). The acquisition of acetylation marks at endogenous enhancers could increase accessibility to these key transcription factors, in turn mediating the loading of RNA polymerases to their distal target promoters. Alternatively, the threshold activity of histone acetylation writers and readers (P300 and Brd4) may trigger activation at those sites preloaded with pioneer factors, and allow recruitment for additional TFs required for the activation of specific genes. Currently, the temporal relationship between histone acetylation and transcription factor binding is not resolved (Harrison and Eisen, 2015; Li et al., 2014). Answering this question will require loss of function studies for different TF activators during MZT, combined with high resolution imaging or ChIP methods amenable for low input DNA. Nanog interacts and recruits P300 and BRD4 to the chromatin in ES cells (Boo et al., 2015; Fang et al., 2014), and thus may provide specificity to the activity of these general regulators of enhancer activity. We propose that P300 and Brd4 activity serves as a switch to regulate transcriptional competency after fertilization.
One of the first events the embryo must accomplish is the reprogramming of the differentiated sperm and oocyte nuclei into a transient totipotent state receptive to various differentiation programs. It is worth noting remarkable parallels between genome activation, cellular reprogramming and stem cell maintenance (Giraldez, 2010; Lee et al., 2014). For example, Brd4 and P300, Nanog and Oct4 are shared between these different developmental programs. miR-430 in zebrafish reprograms the transcriptome during MZT to a transient totipotent state (Giraldez et al., 2006; Judson et al., 2009; Lee et al., 2013; Subramanyam et al., 2011), while its homologue in mouse, miR-295/miR-302, facilitates cellular reprograming of differentiated cells into induced pluripotent stem cells (Giraldez et al., 2006; Judson et al., 2009; Lee et al., 2013; Subramanyam et al., 2011). It was reported that miR-295/miR-302 expression is controlled by a super enhancer in ES cells (Hnisz et al., 2013). Interestingly, miR-430 is abundantly labeled with H3K27Ac and H3K4me1, which typically mark super enhancers (Hnisz et al., 2013). These parallels prompt the question of whether other factors controlling super enhancer function and reprogramming regulate genome activation in vertebrates.
In summary, our results address the long-standing question of the mechanism by which zygotic genome activation is achieved, and identify key molecular factors regulating transcriptional competency, illuminating an essential step required to induce transient totipotency in embryogenesis and initiate zygotic development in zebrafish.
STAR Methods
CONTACT FOR REAGENT AND RESOURCE SHARING
Further information and requests for resources and reagents should be directed to and will be fulfilled by the Lead Contact, Antonio J. Giraldez (antonio.giraldez@yale.edu)
EXPERIMENTAL MODEL AND SUBJECT DETAILS
Zebrafish embryo production
Zebrafish wild-type embryos were obtained from natural matings of 12-month-old adult zebrafish of mixed wild-type backgrounds (TU-AB, and TL strains). Wild-type adults were selected randomly for mating. Zebrafish were maintained in accordance with AAALAC research guidelines, under a protocol approved by Yale University IACUC. All zebrafish and embryo experiments were carried out at 28°C. Embryos were grown and staged according to standard protocols to ensure all embryos were at the same expected developmental stages before sample collection. Embryos between 0 to 6 hours post-fertilization (hpf) developmental stages were randomly collected per sample as specified across different experiments.
Haploid zebrafish embryo production
Haploid embryos were generated using a modified version of the protocol by Kroeger et al (Kroeger et al., 2014). The testes from 7 male males were collected into 700 μl of Hank’s solution and macerated. 350 μl of the sperm mix was irradiated at 1000 Jm−2 in a UV crosslinker. Eggs from individual females were divided into two groups and used for separate inseminations with either intact zebrafish sperm or UV-irradiated sperm to produce diploid or haploid embryos respectively.
METHOD DETAILS
Constructs, sgRNA design, and in vitro transcription
Zebrafish chk1 ORF was amplified from cDNA from 64 cell-stage embryos using primers 5’-TTTTCCATGGCTGTGCCTTTTGTTAAAG-3’ and 5’-TTTTCCGCGGTCAAATCAATGGCAAAACCTTTTGG-3’. The resultant PCR product was digested with restriction enzymes NcoI and SacII and ligated into the plasmid pT3TS-zCas9 (Jao et al., 2013). The final construct was confirmed by sequencing and corresponded in sequence to chk1 protein XP_021324451.1. dCas9–3xGFP was generated as follows: 3xGFP was PCR amplified from plasmid pHAGE-TO-dCas9–3XGFP (Ma et al., 2015) using primers 5’ TTTCCGCGGCTACTCGAGTTTGTACAGTTC-3’ and 5’-TTTACCGGTGAGATCTCCTAAGAAGAAGAGAAAGGTGGGCTCTACTAGTGGCTCT-3’. pHAGE-TO-dCas9–3XGFP was a gift from Thoru Pederson (Addgene plasmid # 64107). PCR products were digested with restriction enzymes AgeI and SacII and ligated into the pT3TS-dCas9 plasmid, which is based on pT3TS-zCas9, containing point mutations that catalytically inactivate Cas9, also called dead Cas9 (dCas9) (Gilbert et al., 2013; Jinek et al., 2012).
sgRNAs against the miR-430 locus were designed using an updated version of the CRISPRscan (crisprscan.org) tool (Moreno-Mateos et al., 2015). Two different sgRNAs were used in combination with dCas9–3XGFP to label miR-430 locus:
sgRNA 1 specific oligonucleotide: 5’-atttaggtgacactataGAGGGTACCGATAGAGACAAgttttagagctagaa
and sgRNA 2 specific oligonucleotide: 5’-taatacgactcactataGGCTGAGTGTTAACGACTGgttttagagctagaa.
sgRNA 1 and sgRNA 2 target 11 and 9 sites in the miR-430 locus at chromosome 4, respectively. sgRNAs were generated as previously described (Moreno-Mateos et al., 2015; Vejnar et al., 2016). Briefly, a 52-nt oligo containing the SP6 (5’-atttaggtgacactata) (sgRNA 1) or T7 (5’-taatacgactcactata) (sgRNA2) promoter, 20-nt of specific sgRNA DNA-binding sequence, and a constant 15-nt tail (small case and underlined) for annealing was used in combination with an 80-nt reverse universal oligo to add the sgRNA invariable 3’ end (5’- AAAAGCACCGACTCGGTGCCACTTTTTCAAGTTGATAACGGACTAGCCTTATTTTAACTTGCTATTTCTAGCTCTAAAAC). A 117-bp PCR product was generated and purified using QIAquick PCR purification kit (Qiagen). The purified product was used as a template for T7 or SP6 in vitro transcription (AmpliScribe-T7-Flash transcription kit from Epicentre; MAXIscript™ SP6 Transcription Kit from ThermoFisher Scientific, over a 6–7 h of reaction). In vitro transcribed sgRNAs were DNAse-treated, precipitated with sodium acetate/ethanol and checked for RNA integrity on a 2% agarose gel stained with ethidium bromide.
To generate dCas9–3xGFP and Chk1 capped mRNAs, the DNA templates were linearized using XbaI (dCas9–3xGFP and Chk1) and mRNA was synthetized using the mMessage mMachine T3 kit (Ambion/ ThermoFisher Scientific). In vitro transcribed mRNAs were DNAse I treated and purified using the RNeasy Mini Kit (Qiagen).
DNA quantification by qPCR
5 embryos were manually deyolked in Ringer’s solution (116mM NaCl; 1.8mM CaCl2, 2.9mM KCl; 5ml HEPES). Genomic DNA was extracted with PureLink Genomic DNA Kits (Thermo Fisher Scientific) following manufacture’s instruction and eluted with 500 μl of MilliQ water. To quantify nuclei, 3 µL of the genomic DNA was used in a 20 µL reaction containing 1 µL of primers amplifying repetitive miR-430 loci (Forward: 5’- CAAATGTGTGAAAAATCCCATC-3’; Reverse: 5’- AAGGGTGCACTTGCCTTATG-3’), using power SYBR Green PCR Master Mix Kit (Applied Biosystems) and a ViiA 7 instrument (Applied Biosystems).
PCR cycling profile consisted of incubation at 50 °C for 2 min, followed by a denaturing step at 95 °C for 10 min and 40 cycles at 95 °C for 15 s and 60 °C for 1 min.
Embryo injections and treatments
All injections and drug treatments were carried out on wild-type one-cell stage dechorionated embryos, unless otherwise noted. Experimental samples were then collected at the specified developmental stages/time as described in the text and figure legends. Varying amounts of mRNA per embryo were used as follows: 160 pg (Chk1), 25 pg (dCas9–3XGFP). P300 and BRD4 proteins were purchased from Protein One (P2004–01) and Reaction Biology Corp. (RD-21–153), respectively, and 200 pg of P300 and 630 pg of BRD4 protein were injected into each embryo.
JQ1 treatment: embryos were bathed in 43.8 µM JQ1 (1:100 dilution from 4.38mM working stock in DMSO) to inhibit BET family of bromodomain proteins including BRD2, BRD3 and BRD4.
SGC-CBP30 treatment: embryos were bathed in 20 µg/ml SGC-CBP30 (Sigma-aldrich, 1:500 dilution from 10mg/ml working stock in DMSO) to inhibit the bromodomain-containing transcription factors CREB binding protein (CBP) and Histone acetyltransferase p300 (EP300).
Pol II inhibition: embryos were bathed in 5.8 µM triptolide (1:1,000 dilution from a 5.8 mM working stock in DMSO) or injected with 0.2ng of α-amanitin at one-cell stage to inhibit RNA polymerase II. Triptolide treatment was initially used in some experiments due to its convenience and sufficiency in inhibiting transcription by simply bathing the embryos in the drug. However, it became apparent that there is minor but detectable leaky transcription in triptolide-treated samples, and hence α-amanitin treatment was preferred to provide a more robust inhibition of transcription and hence a better negative control, especially for experiments that require a higher sensitivity to assay the onset of transcription.
Translation inhibition: embryos were collected at the one-cell stage. To limit the amount of translation of maternal mRNAs, embryos were transferred to media containing 10 µM pateamine A (PatA, purchased from D. Romo at Baylor University) and 50 µg/mL cycloheximide (CHX, Sigma Aldrich) at the 8-cell stage or the 32-cell stage, respectively. Because these treatments stop development, collection of these embryos was timed by monitoring the development of untreated sibling embryos when they reached the appropriate stage in this case sphere stage (4hpf). To evaluate the effect of translation inhibition by the treatment of PatA and CHX, 25pg dCas9–3xGFP mRNA was injected in one-cell stage embryos prior to the PatA and CHX treatment at 32-cell stage. Embryos with and without the PatA and CHX treatment were imaged using confocal microscopy to compare the dCas9–3xGFP signal at individual nucleus. Additional evaluation of the effect of translation inhibition treatment was performed by co-injecting 100pg DsRed mRNA and 0.4ng of Alexa Fluor® 488 histone H1 conjugate protein (ThermoFisher Scientific, H-13188) in one-cell stage embryos prior to the CHX treatment at 8- and 32-cell stage respectively. Embryos with and without the CHX treatment were imaged using fluorescent microscopy to compare the DsRed and H1Alexa488 signal.
Chk1 treatment: 160pg of Chk1 mRNA was injected in one-cell stage embryos to inhibit/slow down DNA replication by inducing degradation of the limiting replication initiation factor Drf1 (Collart et al., 2017). Embryos were collected when untreated sibling embryos reached the appropriate developmental stages: 64-cell stage (2hpf) or sphere stage (4hpf).
Treatments of different small molecule inhibitors targeting readers or writers for H3K4me3/H3K4me1 and H3K27Ac to test their effect on gastrulation: embryos with chorion were bathed in the titrated concentrations of each small molecule inhibitors (UNC1999, Sinefungin, MM-102, SGC-CBP30 and JQ1) as indicated in Figure S6I at one-cell stage until 6 hours post-fertilization (hpf) when the embryos were examined under microscopy for any gastrulation arrest phenotypes.
dCas9-Labeling of endogenous miR-430 locus
To label the miR-430 locus, the two previously described sgRNAs were injected at 100pg each in combination with 25pg dCas9–3xGFP into dechorionated embryos at the one-cell stage. Embryos were image either live or fixed in 4% paraformaldehyde and processed for antibody staining against GFP.
miR-430 transcription labeling by live imaging
To visualize nascent transcription of miR-430 by live imaging, a molecular beacon (MBmiR430 : Dabcyl-5’-GCTGAACAGAGGTGACTAAGTCAGC-3’-Lissamine) was specifically designed to target the primary miR-430 transcript. The molecular beacon (MBmiR430) was obtained from Gene Tools and resuspended in nuclease-free water. The molecular beacon was designed with a stem-loop structure, where the single-stranded loop region (5’-ACAGAGGTGACTAAG-3’) is antisense to the repetitive single stranded regions of the predicted structure of the primary miR-430 transcript. The single-stranded loop region is flanked by two 5-nt sequences (5’-GCTGA-3’ at the 5’ end and 5’- TCAGC-3’ at the 3’ of the molecular beacon) that are self-complementary and form the double-stranded stem. The molecular beacon is modified at the 5’ end with a fluorophore and the 3’ end with a quencher to improve the signal to noise ratio. 0.5pmole of MBmiR430 was injected into wild type embryos at the one-cell stage. To trace individual nuclei during live imaging analysis, 0.4ng of Alexa Fluor® 488 histone H1 conjugate (ThermoFisher Scientific, H-13188) was co-injected with MBmiR430.
Click-iT labeling of zygotic transcription for imaging
Click-iT™ RNA Alexa Fluor™ 594 Imaging Kit (C10330) was adapted for application in zebrafish embryos. Embryos were injected with 50 pmols of Click-iT® RNA (5-ethynyl-uridine) (EU, E10345) or in kit form with Click-iT Nascent RNA capture kit, C-10365, and collected at the times/developmental stages indicated in the text and figure legends. After collection, embryos were fixed using a 4% paraformaldehyde (PFA) solution in 1x phosphate-buffered saline (PBS) at 4°C overnight. Fixed embryos were washed three times with 1x PBS and permeabilized using 0.5% Triton X-100 (PBS-T) at room temperature for a total of 30 minutes, followed by dehydration with serial dilutions of Methanol (25%, 50%, 75%, 100% Methanol diluted with 1x PBS-T). Dehydrated embryos were incubated at −20°C for at least 2 hour s before rehydration with serial dilutions of Methanol (75%, 50%, 25%, 0% Methanol diluted with 1x PBS-T). Rehydrated embryos then underwent antibody staining, as described below, before proceeding with the manufacturer’s EdU-labeling visualization protocol. Briefly, embryos were incubated with a 1x working solution of Click-iT reaction cocktail, containing the Alexa Fluor 594 azide and CuSO4, for 1 hour in dark at room temperature. After removal of the reaction cocktail, embryos were washed once with Click-iT reaction rinse buffer. Embryos were then washed three times with 1x PBS-T and stained with DAPI, followed by dissection and mounting on glass slides in ProLong™ Diamond Antifade Mountant (ThermoFisher Scientific, P36965).
Click-iT captured nascent zygotic transcripts for RNA-Sequencing
The Click-iT® Nascent RNA Capture Kit (ThermoFisher Scientific, C10365) was adapted for application in zebrafish embryos. To capture nascent RNAs, 50 pmols of Click-iT® EU (5-ethynyl Uridine) was injected in one-cell stage embryos and allowed to incorporate into the nascent zygotic transcript until the time point/developmental stage indicated in the text and figure legends. At these time points, total RNA from 35 embryos was extracted using TRIzol reagent (Invitrogen). The EU-incorporated RNAs were biotinylated and captured following the manufacturer’s instructions. Briefly, the EU-labeled RNA was biotinylated with 0.25mM biotin azide in Click-iT reaction buffer. The biotinylated RNAs were precipitated with etanol and resuspended in nuclease-free water. The biotinylated RNAs mixed with Dynabeads MyOne Streptavidin T1 magnetic beads in Click-iT RNA binding buffer and heated at 68°C for 5 minutes, followed by incubation at room temperature for 30 minutes while gently vortexing. The beads were immobilized using the DynaMag-2 magnet and were washed with Click-iT wash buffer1 and 2. The washed beads were then resuspended in Click-iT wash buffer2 and used for cDNA synthesis using the SuperScript® VILO™ cDNA synthesis kit (Cat. no. 11754–050), followed with RNA-Sequencing. Single-stranded cDNA was recovered by heating the magnetic beads at 85°C for 5 minutes, ethanol p recipitated, and dissolved in 20 μL of water. Libraries were constructed following Illumina TruSeq and dUTP protocol from cDNA. Sequencing was performed at the Yale Center for Genome Analysis and resulted into unstranded reads.
Click-iT-seq analysis between haploid and diploid embryos
To capture nascent RNAs, 50 pmols of Click-iT® EU (5-ethynyl Uridine) was injected in one-cell stage haploid and diploid embryos and allowed to incorporate into the nascent zygotic transcript until the time point/developmental stage indicated in the text and figure 3A. At these respective developmental stages (512-cell and 1K-cell stage), total RNA from 26 haploid embryos was extracted and denoted as “haploid” sample in the text and figure legends; while total RNA from 13 diploid embryos and 13 α-amanitin injected diploid embryos was extracted and denoted as “diploid” sample in the text and figure legends. At 512-cell stage, 26 α-amanitin injected haploid and diploid embryos were collected respectively as controls for each ploidy condition. The EU-incorporated RNAs were biotinylated and captured, followed with cDNA synthesis and RNA-sequencing as described above. As illustrated in figure 3A, Click-iT-seq captured RNA expression from 512-cell stage haploid and diploid embryos are compared against corresponding α-amanitin treated embryos to identify the genes activated at 512-cell stage in different ploidy condition (indicated by red VS). Transcription competency between haploid and diploid genome is examined directly by comparing the RNA captured from samples with matching total DNA template (indicated by blue VS). Half the number of 2n embryos (Y/2) were collected to match the number of DNA templates from the 1n embryos (Y); Y/2 of amanitin treated 2n embryos are used to keep the maternal mRNA background constant.
Stacked bar plots comparing haploid & diploid embryo gene expression
The normalized expression levels of genes in diploid embryos with haploid embryos are calculated using the following equation:
Here DN(g) and HN(g) are normalized expression levels of gene g in diploid and haploid embryos. D(g) and H(g) are whole gene RPKM (see below) of gene g in diploid and haploid embryos measured by Click-iT-seq. Da(g) and Ha(g) are whole gene RPKM of gene g in diploid and haploid embryos treated with α-amanitin measured by Click-iT-seq. We set Da(g)=Ha(g)=0 at 1K-cell stage due to lack of Click-iT-seq data. Here, DN(g) is considered as percentage of gene expression that is dependent on N/C ratio and HN(g) as percentage of gene expression that is dependent on time. DN(g)/HN(g) represents the fold change of normalized expression levels of gene g between diploid and haploid embryos. All genes with (D(g)-Da(g) < 0.3) and (H(g)- Ha(g) < 0.3) are not included in the analysis. The expression levels of genes were normalized by the expression level in α-amanitin treated embryos as described above to account for the maternal contribution.
For the box plots comparing gene length between N/C ratio dependent and independent genes, genes with the same name are collapsed and only one gene with the name is kept.
Antibody staining and fluorescence microscopy
Embryos were fixed using a 4% paraformaldehyde (PFA) solution in 1x phosphate-buffered saline (PBS) at 4°C overnight. Fixed embryos were washed three times with 1x PBS and permeabilized using 0.5% Triton X-100 (PBS-T) at room temperature for a total of 30 minutes, followed by dehydration with serial dilutions of Methanol (25%, 50%, 75%, 100% Methanol diluted with 1x PBS-T). Dehydrated embryos were incubated at - 20°C for at least 2 hours before rehydration with s erial dilutions of Methanol (75%, 50%, 25%, 0% Methanol diluted with 1x PBS-T). Rehydrated embryos were washed with 1x PBS-T and incubated for 2–3 hours in blocking solution (1x PBS-T, 10% Bovine Serum Albumin), followed by overnight incubation at 4°C with the primary antibodies specified in the text and figure legends. These primary antibodies include rabbit anti-Histone H3 (acetyl K27) antibody 1:1,000 (Abcam, ab177178), rabbit anti-RNA polymerase II CTD repeat YSPTSPS (phospho S5) antibody 1:1,000 (Abcam, ab5131), mouse anti-GFP Tag antibody 1:1,000 (ThermoFisher Scientific, A-11120). After three washes with 1x PBS-T, the embryos were incubated with secondary antibodies for 2 hours at room temperature. The secondary antibodies include Goat anti-Mouse IgG (H+L) secondary antibody, Alexa Fluor Plus 488 1:1,000 (ThermoFisher Scientific, A32723), goat anti-rabbit-IgG-Atto647N 1:1,000 (Sigma-aldrich, 40839) and goat anti-mouse-IgG-Atto594 1:1,000 (Sigma-aldrich, 76085). All antibodies were diluted with blocking solution (1x PBS-T, 10% Bovine Serum Albumin). After this step, embryos were washed three times with 1x PBS-T before proceeding with either DAPI staining and mounting or treatment with Click-iT RNA Alexa Fluor 594imaging kit (ThermoFisher Scientific, C10330) according to the manufacturer’s protocol. Samples were mounted in ProLong™ Diamond Antifade Mountant (ThermoFisher Scientific, P36965) or 1% low melt agarose (AmericanBio, CAS: 9012–36-6); and examined using a confocal fluorescence microscope (Leica TCS SP8) and a Stimulated emission depletion (STED) microscope (Leica TCS SP8 Gated STED 3x super resolution microscope). Samples shown in Figure 1E, S2A and S2B were mounted in 1% low melt agarose and the rest of the fixed imaging samples were mounted in ProLong™ Diamond Antifade Mountant. Sequential imaging is used to avoid spectral bleedthrough in experiments involving multi-fluorescent staining. Fluorescence minus one (FMO) control is performed to configure image acquisition setting. In Click-iT labeled imaging analysis, Triptolide or α-amanitin treated samples will be used as a negative control for optimizing acquisition setting. DAPI staining is performed on all imaging samples for proper staging for embryos with comparable nuclei stages (Figure S2A). Embryos with comparable nuclei stages within the same developmental stages are imaged and compared accordingly. The reported number of imaged nuclei comes from a minimal of three independent embryos. Live embryos are mounted in 0.4% low melt agarose (AmericanBio, CAS: 9012–36-6) and all live imaging is performed at monitored temperature of 28°C. Images were processed and quantified with Bitplane Imaris, Image-J software. Figure panels display maximum projections, unless specified as a single focal plane image for better presentation of co-localization across different channels.
Western blot
Ten embryos (H3, H2B n=5; H2A, H4) were manually deyolked, snap frozen in liquid nitrogen and boiled at 95 °C for 5 min in 15 µL of water, 7.5 µL of 4x NuPAGE LDS Sample Buffer (ThermoFisher Scientific), 3 µL DTT (Sigma-Aldrich). Samples were run on 4–12% polyacrylamide NuPAGE Bis-Tris gels (ThermoFisher Scientific) for 45 min at 180 V and wet electrotransferred onto a nitrocellulose membrane (GE LifeSciences) for 70 min at 30 V. Membranes were incubated in blocking solution (5% milk in PBS-T) for 2 h. Then primary antibodies were diluted in blocking solution and incubated with the membrane overnight at 4°C Anti-H 3 1:10,000 (ab1791; Abcam), H4 1:1,000 (ab10158; Abcam), H2A 1:1,000 (ab18255; Abcam), H2B 1:3,000 (ab1790; Abcam), Actin 1:5,000 (ab8227, Abcam). Secondary antibody Goat Anti-Rabbit IgG Antibody, (H+L) HRP conjugate (AP307P; Millipore) was incubated with the membrane at 1:10,000 for 1 h at RT. Membranes were analyzed by chemiluminescent detection and X-ray film (E3012, Denville Scientific).
RNA-seq and Click-iT-seq analysis and normalization
Total RNA from 20 embryos per condition at indicated time point/developmental stage were snap frozen in Liquid Nitrogen and the RNA was extracted using Trizol reagent (Invitrogen). Samples were treated with Epicentre Ribo-Zero Gold, to deplete ribosomal RNA, or subject to pull-down by oligo dT beads, to enrich for poly(A)+ RNA. TruSeq Illumina RNA sequencing libraries were constructed and samples were multiplexed and sequenced on Illumina HiSeq (High output) machines to produce 75-nt single-end reads by the Yale Center for Genome Analysis.
Raw reads were mapped to zebrafish GRCz10 genome sequence using STAR v2.5.3 (Dobin et al., 2013) with parameters --alignEndsType Local and –sjdbScore 2. Genomic sequence index for STAR was built including exon-junction coordinates from Ensembl v90 (Aken et al., 2017). Read counts per gene were computed by summing the total number of reads overlapping at least 10 nucleotides of the gene annotation. Gene models were constructed by merging all overlapping transcript isoforms of each gene. For miR-430, reads overlapping the locus on chromosome 4 from coordinate 28,738,727 to 28,754,891 were counted as miR-430 cluster reads. All reads mapping to all zebrafish genes, including reads mapping to multiple loci in the zebrafish genome, were kept (Table S6). To compute read counts per gene, each locus where a read was mapped was assigned a weight equal to 1 divided by the total number of loci to which the read was mapped to. Biological Replicates for Click-iT-seq experiments in all conditions are combined since they are highly correlated. For RPM calculation on gene tracks, RNA reads from regular RNA-Seq experiments (Fig. S1J) were normalized to the total number of reads mapped to the zebrafish genome per million. For experiments involving Click-iT-seq reads were normalized by mitochondrial reads mapping to the mitochondrial protein coding genes, i.e. RPM = Reads per millions mapped reads on mitochondrial protein coding genes (Fig. 3G; 4D; 5A and G; 6H and Fig. S1J; S6D and E; S8G; S9G; S10G; S11E). Mitochondrial RNAs provides a valuable internal control as shown by the Neugebauer lab (Heyn et al., 2014), because i) it continues to be transcribed during the MZT (Heyn et al., 2014), ii) these RNAs are easily labeled with Click-iT, and iii)they can be used as an internal control because the mitochondrial RNA Pol II is not inhibited by the concentrations of α-amanitin used in this study (Menon, 1971; Tsai et al., 1971; Wintersberger, 1970).
Determination of zygotic and maternal-zygotic genes
To calculate per gene RPKMs, the number of reads mapped to each gene from the Click-iT RNA-seq experiment were summed and normalized by gene length and the total number of reads mapped to the mitochondrial protein-coding genes, unless otherwise specified. Intron regions were defined as genic regions that are not covered by any extended exon (exon extending 15nt on both ends) on the same or any other gene. Only uniquely mapped reads were used for intron analysis. All zygotic and maternal zygotic genes were defined using criteria in Table S1. Genes in each category must satisfy all the criteria in the column.
The criteria are detailed as follows:
Zygotically expressed genes from previous studies. The union of all identified zygotically expressed zebrafish genes reported by the Neugebauer lab (Heyn et al., 2014) and the Giraldez lab (Lee et al., 2013).
WT 4h Click-iT compared to WT 2h mRNA-seq R0. This comparison was designed to distinguish between zygotic and maternal zygotic genes. Zygotic genes are expected to be enriched by Click-iT RNA-seq at 4 hpf compared to RiboZero purified maternal mRNAs at 2 hpf measured by mRNA-seq. In this comparison, read counts from the Click-iT RNA-seq experiment were normalized to RPKMs using the total exonic reads in the sample (Figures S1B and S1E).
Exon RPKM in WT 4h Click-iT (normalized by total). To define additional high confidence zygotic and maternal zygotic genes, a high Click-iT RPKM cut-off was applied. This is aimed to avoid potential background from maternal mRNAs purified by Click-iT. Cut-off of 10 RPKM was determined by minimum expression of zygotic genes identified in previous studies (Figure S1A).
WT 4h Click-iT compared to triptolide 4h Click-iT. Zygotic and maternal zygotic genes are expected to have higher exon and intron RPKM in WT embryos compared to triptolide treated embryos (Figures S1B–S1C and S1E–S1F). Intron signal is more sensitive than exon signal as most maternally deposited mRNAs are spliced and the introns are degraded early on (Lee et al., 2013). In this comparison, exonic and intronic read counts were normalized to RPKMs using the total reads mapping to mitochondrial protein-coding genes. As the overall intron RPKMs are ~4–10 fold lower than exon RPKMs (Figure S1F), a 30 RPKM intron cut-off was used corresponding to ~7-fold decrease to the minimum RPKM cutoff used for exons.
WT 4h compared to triptolide 4h in mRNA-seq R0 on exon. The additional zygotic and maternal zygotic candidates were further restricted by mRNA-seq as zygotically expressed genes were expected to have greater exon expression in WT embryos compared to embryos treated with triptolide.
WT 4h compared to triptolide 4h in mRNA-seq R0 on intron. Zygotically expressed genes were expected to have greater intron expression as newly transcribed zygotically expressed genes are spliced and detectable in WT embryos, unless the gene has no intron or the intron is small, hence this condition is only applied if the intron length is >= 500bp.
Identification of zygotically activated genes
For Click-iT RNA-sequencing assays in which ZGA factors were overexpressed (P300, BRD4), a gene was considered to be activated in the overexpression condition if the gene had at least 4-fold increase in exon or intron RPKM in the overexpression condition relative to triptolide or α-amanitin treated embryos at the same stage. For Click-iT RNA-sequencing assays involving chemical or genetic treatment (chk1, Pateamine A+ Cycloheximide), genes were considered to be activated in the wildtype or treated embryos if those genes had at least 4-fold increase in exon RPKM or intron in the condition relative to the same condition treated with triptolide or α-amanitin. The fold increase was calculated after adding 0.1 RPKM to genes in both conditions in the comparison for a more stringent filter for genes with low RPKM, which effectively sets a 0.3 RPKM cut off. For biplots created in this study, a small 0.1 RPKM was added to the expression of each gene in both conditions to allow the display of genes with zero counts in any condition. For biplots comparing gene expression in chk1 or PatA+CHX treated embryos, 0.01 RPKM was added to each gene given that these embryos have lower gene expression due to the fewer number cells and DNA template per embryo.
ChIP-seq analysis of histone marks
Previously published ChIP-seq data [GSE32483] of H3K27ac, H3K4me3 and H3K4me1 marks at dome stage (Bogdanovic et al., 2012) were realigned to the zebrafish GRCz10 genome using Bowtie v1.1.2 (Langmead et al., 2009) using parameters -v 3 --best --strata --all --chunkmbs 1000 -m 2000. Histone mark signal for each gene was calculated by the total number of reads mapped to the gene body region and 1,000 nt upstream of the transcription start site, and normalized by the total number of reads aligned the genome and the length of the gene body plus 1,000 nt upstream. Histone mark signal per Kilobase (RPKM) for each gene was reported and used for the correlation with gene transcription level. The gene length for miR-430 is 17164nt = 16164 + 1000nt. For RPM calculation on gene tracks, ChIP-seq reads were normalized to the total number of reads mapped to the zebrafish genome per million, i.e. RPM = Reads per million mapped reads to the zebrafish genome (Fig. 5A and Fig. S8G).
Heatmap
Heatmaps were created using R 3.3.3 and package gplots. Fold change of gene expression between different conditions was first taken base 2 logarithm and then capped at −5 to 5. Genes with no expression in one of the conditions in the comparison were assigned infinite fold change and capped by the value mentioned above. Genes with no expression in both of the conditions were taken as no change between conditions.
Filtering and alignment of ribosome profiling reads
The Illumina TruSeq index adaptor sequence was trimmed from raw reads by aligning its sequence, requiring 100% match of the first five base pairs and a minimum global alignment score of 60 (Matches: 5, Mismatches: −4, Gap opening: −7, Gap extension: −7, Cost-free ends gaps). Trimmed reads were then depleted of rRNA, tRNA, snRNA, snoRNA and misc_RNA from Ensembl and RepeatMasker annotations using strand-specific alignment performed with STAR 2.6.1c (Dobin et al., 2013) with the following non-default parameters: alignEndsType Local seedSearchStartLmaxOverLread 0.8 outReadsUnmapped Fastx outSAMtype None. Filtered reads were aligned strand-specifically to the zebrafish GRCz11 genome assembly using STAR with the following non-default parameters: alignEndsType EndToEnd seedSearchStartLmaxOverLread 0.8 and the exon-junction coordinates from Ensembl r92 (Cunningham et al., 2019).
Calculating mRNA translation rates
Translation rate was calculated by counting the number of ribo-seq reads per kilobase per million reads (RPKM) for each effective coding sequence. Effective CDSs exclude the first and last three codons and are shifted 12 nt upstream to position each read at the ribosome P-site location, as described in Bazzini et al (Bazzini et al., 2014). Using the effective CDS of each transcript allows for computation of translation rate from actively translating ribosomes. Reads overlapping effective CDSs by a minimum of 10 nucleotides, and matching up to five times in the genome (each mapping site counting 1/n, n = number of mapping sites) were included. Replicates for each time-point were combined. To restrict reads to bona fide ribosome protected fragments, only fragments of length 27, 28 and 29 were kept for time-points 2 hpf (AGS000372) and 5 hpf (AGS000372). All lengths were kept for 0 hpf sample (AGS000069) in absence of translation frame observed on metagene analysis.
QUANTIFICATION AND STATISTICAL ANALYSIS
Statistics
No statistical methods were used to predetermine sample size. No data were excluded from the analyses. The experimental findings were verified by independent experimental replicates as indicated in figure legends and text. The experiments were not randomized and investigators were not blinded to allocation during experiments and outcome assessment. Box and whisker plots are presented with the box extending from 25th to 75th percentiles and the line in the middle of the box represents the median; and whiskers representing the minimum to maximum value. The mean and error plot are represented with the mean values and s.d. error bars. For unpaired two-tailed t-test was performed and P values were calculated with Prism (GraphPad Software, La Jolla, CA, USA). Rank correlation independence test was performed and P values were calculated for the comparison between transcription level and histone mark signal.
Supplementary Material
Movie S1. CRISPR-dCas9 labeled miR-430 locus in live zebrafish embryos over cell cycle. Related to Figure 1.
Shown are nuclei from live zebrafish embryo injected with dCas9–3xGFP (green) and 2 sgRNA targeting miR-430 locus. Frames were acquired every 1 minute.
Movie S2. Tracing miR-430 transcription in vivo visualized by MBmiR430 from wild type embryos developing from 32- to 512-cell stage. Related to Figure 1.
Shown are nuclei from live zebrafish embryo injected with MBmiR430 (red) and Alexa Fluor® 488 histone H1 (green). Inset traces an example nucleus (highlighted by a white square box) in both red and green channel. MBmiR430 signals are highlighted by white arrows in the confocal images. Developmental stages are indicated on top. Frames were acquired every 2 minute.
Supplementary Table 1. Determination of zygotic and maternal-zygotic genes. Related to Figure S1 and STAR Methods.
Supplementary Table 2. Gene expression calls for all zygotic and maternal zygotic genes from Click-iT-seq. Related to Figures 2, 4–6.
Supplementary Table 3. Number of activated genes with more than 4 fold difference between different experimental conditions. Related to Figure 2, 4–6.
Supplementary Table 4. Gene expression calls from Click-iT-seq in haploid and diploid embryos. Related to Figure 3.
Supplementary Table 5. Gene expression calls from Click-iT-seq for the genes represented in the heatmap shown in figure 6F. Related to Figure 6.
Supplementary Table 6. Summary and mapping statistics of high-throughput sequencing experiments. Related to STAR Methods.
Highlights:
Live imaging reveals that the first zygotic transcription is stochastic in zebrafish
Transcriptional competency depends on developmental time independent of cell division
P300 and Brd4 activity are necessary for genome activation and zygotic development
P300 and BRD4 are sufficient to trigger premature genome activation
Acknowledgments
We thank K. Bishop for technical help; K. Bilguvar, S. Mane and C. Castaldi for sequencing support; C. Hendry, C. Kontur, V Tornini, and all the members of the Giraldez laboratory for critical reading of the manuscript, intellectual and technical support. JL Gomez-Skarmeta and JR Martinez-Morales for sharing ATAC-seq before publication. David Gonzalez, Al Mennone and Joerg Bewersdorf for mentorship in image analysis. The imaging work was supported in part by NIH grant S10 OD020142. This research was supported by the Fonds de Recherche du Québec - Santé (postdoctoral fellowship to JDB), the Surdna Foundation and the Yale Genetics Venture Fund (postdoctoral fellowship to LM), and the National Institute of Health (grants R01 HD074078, GM103789, GM102251, GM101108 and GM081602, R35 GM122580, 4DNucleome program to AJG). MAMM was supported by Programa de Movilidad en Areas de Investigación priorizadas por la Consejería de Igualdad, Salud y Políticas Sociales de la Junta de Andalucía and Ramon y Cajal program from Ministerio de Ciencia, Innovación y Universidades of the Spanish government (RYC-2017–23041). The Giraldez lab is supported by the Howard Hughes Medical Institute Faculty Scholar program, and was supported by the Pew Scholars Program in the Biomedical Sciences, March of Dimes 1-FY12–230, the Yale Scholars Program and Whitman fellowship funds provided by E. E. Just, Lucy B. Lemann, Evelyn and Melvin Spiegel, The FIG. Keffer Hartline and Edward F. MacNichol, Jr. of the Marine Biological Laboratory in Woods Hole, MA to AJG.
Footnotes
Publisher's Disclaimer: This is a PDF file of an unedited manuscript that has been accepted for publication. As a service to our customers we are providing this early version of the manuscript. The manuscript will undergo copyediting, typesetting, and review of the resulting proof before it is published in its final citable form. Please note that during the production process errors may be discovered which could affect the content, and all legal disclaimers that apply to the journal pertain.
Declaration of Interests
The authors declare no competing financial interests.
DATA AND SOFTWARE AVAILABILITY
Data availability
Input raw reads are publicly accessible in the Sequence Read Archive under SRP184786. To facilitate data download, internal to lab (AGx) and SRA (SRx) IDs are listed in Table S6 and at https://data.giraldezlab.org. All other relevant data are available from corresponding authors upon reasonable request.
References
- Aken BL, Achuthan P, Akanni W, Amode MR, Bernsdorff F, Bhai J, Billis K, Carvalho-Silva D, Cummins C, Clapham P, et al. (2017). Ensembl 2017. Nucleic acids research 45, D635–d642. [DOI] [PMC free article] [PubMed] [Google Scholar]
- Akkers RC, van Heeringen SJ, Jacobi UG, Janssen-Megens EM, Francoijs KJ, Stunnenberg HG, and Veenstra GJ (2009). A hierarchy of H3K4me3 and H3K27me3 acquisition in spatial gene regulation in Xenopus embryos. Dev Cell 17, 425–434. [DOI] [PMC free article] [PubMed] [Google Scholar]
- Almouzni G, and Wolffe AP (1995). Constraints on transcriptional activator function contribute to transcriptional quiescence during early Xenopus embryogenesis. The EMBO journal 14, 1752–1765. [DOI] [PMC free article] [PubMed] [Google Scholar]
- Amodeo AA, Jukam D, Straight AF, and Skotheim JM (2015). Histone titration against the genome sets the DNA-to-cytoplasm threshold for the Xenopus midblastula transition. Proceedings of the National Academy of Sciences of the United States of America 112, E1086–1095. [DOI] [PMC free article] [PubMed] [Google Scholar]
- Artley JK, Braude PR, and Johnson MH (1992). Gene activity and cleavage arrest in human pre-embryos. Hum Reprod 7, 1014–1021. [DOI] [PubMed] [Google Scholar]
- Bazzini AA, Johnstone TG, Christiano R, Mackowiak SD, Obermayer B, Fleming ES, Vejnar CE, Lee MT, Rajewsky N, Walther TC, et al. (2014). Identification of small ORFs in vertebrates using ribosome footprinting and evolutionary conservation. The EMBO journal 33, 981–993. [DOI] [PMC free article] [PubMed] [Google Scholar]
- Beaudoin JD, Novoa EM, Vejnar CE, Yartseva V, Takacs CM, Kellis M, and Giraldez AJ (2018). Analyses of mRNA structure dynamics identify embryonic gene regulatory programs. Nature structural & molecular biology 25, 677–686. [DOI] [PMC free article] [PubMed] [Google Scholar]
- Blythe SA, and Wieschaus EF (2016). Establishment and maintenance of heritable chromatin structure during early Drosophila embryogenesis. eLife 5. [DOI] [PMC free article] [PubMed] [Google Scholar]
- Bogdanovic O, Fernandez-Minan A, Tena JJ, de la Calle-Mustienes E, Hidalgo C, van Kruysbergen I, van Heeringen SJ, Veenstra GJ, and Gomez-Skarmeta JL (2012). Dynamics of enhancer chromatin signatures mark the transition from pluripotency to cell specification during embryogenesis. Genome research 22, 2043–2053. [DOI] [PMC free article] [PubMed] [Google Scholar]
- Bogdanovic O, Smits AH, de la Calle Mustienes E, Tena JJ, Ford E, Williams R, Senanayake U, Schultz MD, Hontelez S, van Kruijsbergen I, et al. (2016). Active DNA demethylation at enhancers during the vertebrate phylotypic period. Nature genetics 48, 417–426. [DOI] [PMC free article] [PubMed] [Google Scholar]
- Boo K, Bhin J, Jeon Y, Kim J, Shin HJ, Park JE, Kim K, Kim CR, Jang H, Kim IH, et al. (2015). Pontin functions as an essential coactivator for Oct4-dependent lincRNA expression in mouse embryonic stem cells. Nature communications 6, 6810. [DOI] [PMC free article] [PubMed] [Google Scholar]
- Bordeleau ME, Cencic R, Lindqvist L, Oberer M, Northcote P, Wagner G, and Pelletier J (2006). RNA-mediated sequestration of the RNA helicase eIF4A by Pateamine A inhibits translation initiation. Chemistry & biology 13, 1287–1295. [DOI] [PubMed] [Google Scholar]
- Campos EI, and Reinberg D (2009). Histones: annotating chromatin. Annual review of genetics 43, 559–599. [DOI] [PubMed] [Google Scholar]
- Chen J, Wu J, and Hong Y (2016). The morpholino molecular beacon for specific RNA visualization in vivo. Chemical communications (Cambridge, England) 52, 3191–3194. [DOI] [PubMed] [Google Scholar]
- Chiang CM (2016). Phospho-BRD4: transcription plasticity and drug targeting. Drug discovery today Technologies 19, 17–22. [DOI] [PMC free article] [PubMed] [Google Scholar]
- Collart C, Allen GE, Bradshaw CR, Smith JC, and Zegerman P (2013). Titration of four replication factors is essential for the Xenopus laevis midblastula transition. Science (New York, NY) 341, 893–896. [DOI] [PMC free article] [PubMed] [Google Scholar]
- Collart C, Smith JC, and Zegerman P (2017). Chk1 Inhibition of the Replication Factor Drf1 Guarantees Cell-Cycle Elongation at the Xenopus laevis Mid-blastula Transition. Developmental cell 42, 82–96.e83. [DOI] [PMC free article] [PubMed] [Google Scholar]
- Cunningham F, Achuthan P, Akanni W, Allen J, Amode MR, Armean IM, Bennett R, Bhai J, Billis K, Boddu S, et al. (2019). Ensembl 2019. Nucleic acids research 47, D745–d751. [DOI] [PMC free article] [PubMed] [Google Scholar]
- Dahl JA, Jung I, Aanes H, Greggains GD, Manaf A, Lerdrup M, Li G, Kuan S, Li B, Lee AY, et al. (2016). Broad histone H3K4me3 domains in mouse oocytes modulate maternal-to-zygotic transition. Nature 537, 548–552. [DOI] [PMC free article] [PubMed] [Google Scholar]
- De Iaco A, Planet E, Coluccio A, Verp S, Duc J, and Trono D (2017). DUX-family transcription factors regulate zygotic genome activation in placental mammals. Nature genetics 49, 941–945. [DOI] [PMC free article] [PubMed] [Google Scholar]
- Dekens MP, Pelegri FJ, Maischein HM, and Nusslein-Volhard C (2003). The maternal-effect gene futile cycle is essential for pronuclear congression and mitotic spindle assembly in the zebrafish zygote. Development (Cambridge, England) 130, 3907–3916. [DOI] [PubMed] [Google Scholar]
- Dobin A, Davis CA, Schlesinger F, Drenkow J, Zaleski C, Jha S, Batut P, Chaisson M, and Gingeras TR (2013). STAR: ultrafast universal RNA-seq aligner. Bioinformatics (Oxford, England) 29, 15–21. [DOI] [PMC free article] [PubMed] [Google Scholar]
- Du Z, Zheng H, Huang B, Ma R, Wu J, Zhang X, He J, Xiang Y, Wang Q, Li Y, et al. (2017). Allelic reprogramming of 3D chromatin architecture during early mammalian development. Nature 547, 232–235. [DOI] [PubMed] [Google Scholar]
- Edgar BA, and Datar SA (1996). Zygotic degradation of two maternal Cdc25 mRNAs terminates Drosophila’s early cell cycle program. Genes & development 10, 1966–1977. [DOI] [PubMed] [Google Scholar]
- Edgar BA, Kiehle CP, and Schubiger G (1986). Cell cycle control by the nucleocytoplasmic ratio in early Drosophila development. Cell 44, 365–372. [DOI] [PubMed] [Google Scholar]
- Edgar BA, and Schubiger G (1986). Parameters controlling transcriptional activation during early Drosophila development. Cell 44, 871–877. [DOI] [PubMed] [Google Scholar]
- Fang F, Xu Y, Chew KK, Chen X, Ng HH, and Matsudaira P (2014). Coactivators p300 and CBP maintain the identity of mouse embryonic stem cells by mediating long-range chromatin structure. Stem cells (Dayton, Ohio) 32, 1805–1816. [DOI] [PubMed] [Google Scholar]
- Ferree PL, Deneke VE, and Di Talia S (2016). Measuring time during early embryonic development. Seminars in cell & developmental biology 55, 80–88. [DOI] [PMC free article] [PubMed] [Google Scholar]
- Filippakopoulos P, Qi J, Picaud S, Shen Y, Smith WB, Fedorov O, Morse EM, Keates T, Hickman TT, Felletar I, et al. (2010). Selective inhibition of BET bromodomains. Nature 468, 1067–1073. [DOI] [PMC free article] [PubMed] [Google Scholar]
- Gilbert LA, Larson MH, Morsut L, Liu Z, Brar GA, Torres SE, Stern-Ginossar N, Brandman O, Whitehead EH, Doudna JA, et al. (2013). CRISPR-mediated modular RNA-guided regulation of transcription in eukaryotes. Cell 154, 442–451. [DOI] [PMC free article] [PubMed] [Google Scholar]
- Giraldez AJ (2010). microRNAs, the cell’s Nepenthe: clearing the past during the maternal-to-zygotic transition and cellular reprogramming. Current opinion in genetics & development 20, 369–375. [DOI] [PMC free article] [PubMed] [Google Scholar]
- Giraldez AJ, Mishima Y, Rihel J, Grocock RJ, Van Dongen S, Inoue K, Enright AJ, and Schier AF (2006). Zebrafish MiR-430 promotes deadenylation and clearance of maternal mRNAs. Science (New York, NY) 312, 75–79. [DOI] [PubMed] [Google Scholar]
- Gotoh T, Kishimoto T, and Sible JC (2011). Phosphorylation of Claspin is triggered by the nucleocytoplasmic ratio at the Xenopus laevis midblastula transition. Developmental biology 353, 302–308. [DOI] [PubMed] [Google Scholar]
- Guo H, Zhu P, Yan L, Li R, Hu B, Lian Y, Yan J, Ren X, Lin S, Li J, et al. (2014). The DNA methylation landscape of human early embryos. Nature 511, 606–610. [DOI] [PubMed] [Google Scholar]
- Hammitzsch A, Tallant C, Fedorov O, O’Mahony A, Brennan PE, Hay DA, Martinez FO, Al-Mossawi MH, de Wit J, Vecellio M, et al. (2015). CBP30, a selective CBP/p300 bromodomain inhibitor, suppresses human Th17 responses. Proceedings of the National Academy of Sciences of the United States of America 112, 10768–10773. [DOI] [PMC free article] [PubMed] [Google Scholar]
- Han M, and Grunstein M (1988). Nucleosome loss activates yeast downstream promoters in vivo. Cell 55, 1137–1145. [DOI] [PubMed] [Google Scholar]
- Harrison MM, and Eisen MB (2015). Transcriptional Activation of the Zygotic Genome in Drosophila. Current topics in developmental biology 113, 85–112. [DOI] [PubMed] [Google Scholar]
- Harrison MM, Li XY, Kaplan T, Botchan MR, and Eisen MB (2011). Zelda binding in the early Drosophila melanogaster embryo marks regions subsequently activated at the maternal-to-zygotic transition. PLoS genetics 7, e1002266. [DOI] [PMC free article] [PubMed] [Google Scholar]
- Harvey SA, Sealy I, Kettleborough R, Fenyes F, White R, Stemple D, and Smith JC (2013). Identification of the zebrafish maternal and paternal transcriptomes. Development (Cambridge, England) 140, 2703–2710. [DOI] [PMC free article] [PubMed] [Google Scholar]
- Hay DA, Fedorov O, Martin S, Singleton DC, Tallant C, Wells C, Picaud S, Philpott M, Monteiro OP, Rogers CM, et al. (2014). Discovery and optimization of small-molecule ligands for the CBP/p300 bromodomains. Journal of the American Chemical Society 136, 9308–9319. [DOI] [PMC free article] [PubMed] [Google Scholar]
- Hendrickson PG, Dorais JA, Grow EJ, Whiddon JL, Lim JW, Wike CL, Weaver BD, Pflueger C, Emery BR, Wilcox AL, et al. (2017). Conserved roles of mouse DUX and human DUX4 in activating cleavage-stage genes and MERVL/HERVL retrotransposons. Nature genetics 49, 925–934. [DOI] [PMC free article] [PubMed] [Google Scholar]
- Heyn P, Kircher M, Dahl A, Kelso J, Tomancak P, Kalinka AT, and Neugebauer KM (2014). The earliest transcribed zygotic genes are short, newly evolved, and different across species. Cell reports 6, 285–292. [DOI] [PubMed] [Google Scholar]
- Hnisz D, Abraham BJ, Lee TI, Lau A, Saint-Andre V, Sigova AA, Hoke HA, and Young RA (2013). Super-enhancers in the control of cell identity and disease. Cell 155, 934–947. [DOI] [PMC free article] [PubMed] [Google Scholar]
- Hug CB, Grimaldi AG, Kruse K, and Vaquerizas JM (2017). Chromatin Architecture Emerges during Zygotic Genome Activation Independent of Transcription. Cell 169, 216–228.e219. [DOI] [PubMed] [Google Scholar]
- Iturbide A, and Torres-Padilla ME (2017). Starting embryonic transcription for the first time. Nature genetics 49, 820–821. [DOI] [PubMed] [Google Scholar]
- Jao CY, and Salic A (2008). Exploring RNA transcription and turnover in vivo by using click chemistry. Proc Natl Acad Sci U S A 105, 15779–15784. [DOI] [PMC free article] [PubMed] [Google Scholar]
- Jao LE, Wente SR, and Chen W (2013). Efficient multiplex biallelic zebrafish genome editing using a CRISPR nuclease system. Proceedings of the National Academy of Sciences of the United States of America 110, 13904–13909. [DOI] [PMC free article] [PubMed] [Google Scholar]
- Jevtic P, and Levy DL (2015). Nuclear size scaling during Xenopus early development contributes to midblastula transition timing. Current biology : CB 25, 45–52. [DOI] [PMC free article] [PubMed] [Google Scholar]
- Jiang L, Zhang J, Wang JJ, Wang L, Zhang L, Li G, Yang X, Ma X, Sun X, Cai J, et al. (2013). Sperm, but not oocyte, DNA methylome is inherited by zebrafish early embryos. Cell 153, 773–784. [DOI] [PMC free article] [PubMed] [Google Scholar]
- Jinek M, Chylinski K, Fonfara I, Hauer M, Doudna JA, and Charpentier E (2012). A programmable dual-RNA-guided DNA endonuclease in adaptive bacterial immunity. Science (New York, NY) 337, 816–821. [DOI] [PMC free article] [PubMed] [Google Scholar]
- Joseph SR, Palfy M, Hilbert L, Kumar M, Karschau J, Zaburdaev V, Shevchenko A, and Vastenhouw NL (2017). Competition between histone and transcription factor binding regulates the onset of transcription in zebrafish embryos. eLife 6. [DOI] [PMC free article] [PubMed] [Google Scholar]
- Judson RL, Babiarz JE, Venere M, and Blelloch R (2009). Embryonic stem cell-specific microRNAs promote induced pluripotency. Nature biotechnology 27, 459–461. [DOI] [PMC free article] [PubMed] [Google Scholar]
- Jukam D, Shariati SAM, and Skotheim JM (2017). Zygotic Genome Activation in Vertebrates. Developmental cell 42, 316–332. [DOI] [PMC free article] [PubMed] [Google Scholar]
- Kaaij LJT, van der Weide RH, Ketting RF, and de Wit E (2018). Systemic Loss and Gain of Chromatin Architecture throughout Zebrafish Development. Cell Rep 24, 1–10.e14. [DOI] [PMC free article] [PubMed] [Google Scholar]
- Kane DA, Hammerschmidt M, Mullins MC, Maischein HM, Brand M, van Eeden FJ, Furutani-Seiki M, Granato M, Haffter P, Heisenberg CP, et al. (1996). The zebrafish epiboly mutants. Development (Cambridge, England) 123, 47–55. [DOI] [PubMed] [Google Scholar]
- Ke Y, Xu Y, Chen X, Feng S, Liu Z, Sun Y, Yao X, Li F, Zhu W, Gao L, et al. (2017). 3D Chromatin Structures of Mature Gametes and Structural Reprogramming during Mammalian Embryogenesis. Cell 170, 367–381.e320. [DOI] [PubMed] [Google Scholar]
- Kroeger PT Jr., Poureetezadi SJ, McKee R, Jou J, Miceli R, and Wingert RA (2014). Production of haploid zebrafish embryos by in vitro fertilization. Journal of visualized experiments : JoVE. [DOI] [PMC free article] [PubMed]
- Langmead B, Trapnell C, Pop M, and Salzberg SL (2009). Ultrafast and memory-efficient alignment of short DNA sequences to the human genome. Genome biology 10, R25. [DOI] [PMC free article] [PubMed] [Google Scholar]
- Lee HJ, Lowdon RF, Maricque B, Zhang B, Stevens M, Li D, Johnson SL, and Wang T (2015). Developmental enhancers revealed by extensive DNA methylome maps of zebrafish early embryos. Nature communications 6, 6315. [DOI] [PMC free article] [PubMed] [Google Scholar]
- Lee MT, Bonneau AR, and Giraldez AJ (2014). Zygotic genome activation during the maternal-to-zygotic transition. Annual review of cell and developmental biology 30, 581–613. [DOI] [PMC free article] [PubMed] [Google Scholar]
- Lee MT, Bonneau AR, Takacs CM, Bazzini AA, DiVito KR, Fleming ES, and Giraldez AJ (2013). Nanog, Pou5f1 and SoxB1 activate zygotic gene expression during the maternal-to-zygotic transition. Nature 503, 360–364. [DOI] [PMC free article] [PubMed] [Google Scholar]
- Leichsenring M, Maes J, Mossner R, Driever W, and Onichtchouk D (2013). Pou5f1 transcription factor controls zygotic gene activation in vertebrates. Science (New York, NY) 341, 1005–1009. [DOI] [PubMed] [Google Scholar]
- Li XY, Harrison MM, Villalta JE, Kaplan T, and Eisen MB (2014). Establishment of regions of genomic activity during the Drosophila maternal to zygotic transition. eLife 3. [DOI] [PMC free article] [PubMed] [Google Scholar]
- Liang HL, Nien CY, Liu HY, Metzstein MM, Kirov N, and Rushlow C (2008). The zinc-finger protein Zelda is a key activator of the early zygotic genome in Drosophila. Nature 456, 400–403. [DOI] [PMC free article] [PubMed] [Google Scholar]
- Lindell TJ, Weinberg F, Morris PW, Roeder RG, and Rutter WJ (1970). Specific inhibition of nuclear RNA polymerase II by alpha-amanitin. Science (New York, NY) 170, 447–449. [DOI] [PubMed] [Google Scholar]
- Lindeman LC, Andersen IS, Reiner AH, Li N, Aanes H, Ostrup O, Winata C, Mathavan S, Muller F, Alestrom P, et al. (2011). Prepatterning of developmental gene expression by modified histones before zygotic genome activation. Developmental cell 21, 993–1004. [DOI] [PubMed] [Google Scholar]
- Liu X, Wang C, Liu W, Li J, Li C, Kou X, Chen J, Zhao Y, Gao H, Wang H, et al. (2016). Distinct features of H3K4me3 and H3K27me3 chromatin domains in pre-implantation embryos. Nature 537, 558–562. [DOI] [PubMed] [Google Scholar]
- Liu Y, Luo D, Zhao H, Zhu Z, Hu W, and Cheng CH (2013). Inheritable and precise large genomic deletions of non-coding RNA genes in zebrafish using TALENs. PloS one 8, e76387. [DOI] [PMC free article] [PubMed] [Google Scholar]
- Lorch Y, LaPointe JW, and Kornberg RD (1987). Nucleosomes inhibit the initiation of transcription but allow chain elongation with the displacement of histones. Cell 49, 203–210. [DOI] [PubMed] [Google Scholar]
- Low WK, Dang Y, Schneider-Poetsch T, Shi Z, Choi NS, Merrick WC, Romo D, and Liu JO (2005). Inhibition of eukaryotic translation initiation by the marine natural product pateamine A. Molecular cell 20, 709–722. [DOI] [PubMed] [Google Scholar]
- Lu F, Liu Y, Inoue A, Suzuki T, Zhao K, and Zhang Y (2016). Establishing Chromatin Regulatory Landscape during Mouse Preimplantation Development. Cell 165, 1375–1388. [DOI] [PMC free article] [PubMed] [Google Scholar]
- Lu X, Li JM, Elemento O, Tavazoie S, and Wieschaus EF (2009). Coupling of zygotic transcription to mitotic control at the Drosophila mid-blastula transition. Development (Cambridge, England) 136, 2101–2110. [DOI] [PMC free article] [PubMed] [Google Scholar]
- Lund E, and Dahlberg JE (1992). Control of 4–8S RNA transcription at the midblastula transition in Xenopus laevis embryos. Genes & development 6, 1097–1106. [DOI] [PubMed] [Google Scholar]
- Lund E, Liu M, Hartley RS, Sheets MD, and Dahlberg JE (2009). Deadenylation of maternal mRNAs mediated by miR-427 in Xenopus laevis embryos. RNA (New York, NY) 15, 2351–2363. [DOI] [PMC free article] [PubMed] [Google Scholar]
- Ma H, Naseri A, Reyes-Gutierrez P, Wolfe SA, Zhang S, and Pederson T (2015). Multicolor CRISPR labeling of chromosomal loci in human cells. Proceedings of the National Academy of Sciences of the United States of America 112, 3002–3007. [DOI] [PMC free article] [PubMed] [Google Scholar]
- Menon IA (1971). Differential effects of -amanitin on RNA polymerase activity in nuclei and mitochondria. Canadian journal of biochemistry 49, 1395–1398. [DOI] [PubMed] [Google Scholar]
- Messerschmidt DM, Knowles BB, and Solter D (2014). DNA methylation dynamics during epigenetic reprogramming in the germline and preimplantation embryos. Genes Dev 28, 812–828. [DOI] [PMC free article] [PubMed] [Google Scholar]
- Moreno-Mateos MA, Vejnar CE, Beaudoin JD, Fernandez JP, Mis EK, Khokha MK, and Giraldez AJ (2015). CRISPRscan: designing highly efficient sgRNAs for CRISPR-Cas9 targeting in vivo. Nature methods 12, 982–988. [DOI] [PMC free article] [PubMed] [Google Scholar]
- Murphy PJ, Wu SF, James CR, Wike CL, and Cairns BR (2018). Placeholder Nucleosomes Underlie Germline-to-Embryo DNA Methylation Reprogramming. Cell 172, 993–1006.e1013. [DOI] [PubMed] [Google Scholar]
- Newport J, and Kirschner M (1982a). A major developmental transition in early Xenopus embryos: I. characterization and timing of cellular changes at the midblastula stage. Cell 30, 675–686. [DOI] [PubMed] [Google Scholar]
- Newport J, and Kirschner M (1982b). A major developmental transition in early Xenopus embryos: II. Control of the onset of transcription. Cell 30, 687–696. [DOI] [PubMed] [Google Scholar]
- Nien CY, Liang HL, Butcher S, Sun Y, Fu S, Gocha T, Kirov N, Manak JR, and Rushlow C (2011). Temporal coordination of gene networks by Zelda in the early Drosophila embryo. PLoS genetics 7, e1002339. [DOI] [PMC free article] [PubMed] [Google Scholar]
- Potok ME, Nix DA, Parnell TJ, and Cairns BR (2013). Reprogramming the maternal zebrafish genome after fertilization to match the paternal methylation pattern. Cell 153, 759–772. [DOI] [PMC free article] [PubMed] [Google Scholar]
- Pradeepa MM (2017). Causal role of histone acetylations in enhancer function. Transcription 8, 40–47. [DOI] [PMC free article] [PubMed] [Google Scholar]
- Prioleau MN, Huet J, Sentenac A, and Mechali M (1994). Competition between chromatin and transcription complex assembly regulates gene expression during early development. Cell 77, 439–449. [DOI] [PubMed] [Google Scholar]
- Schneider-Poetsch T, Ju J, Eyler DE, Dang Y, Bhat S, Merrick WC, Green R, Shen B, and Liu JO (2010). Inhibition of eukaryotic translation elongation by cycloheximide and lactimidomycin. Nature chemical biology 6, 209–217. [DOI] [PMC free article] [PubMed] [Google Scholar]
- Schultz RM, Davis W Jr., Stein P, and Svoboda P (1999). Reprogramming of gene expression during preimplantation development. J Exp Zool 285, 276–282. [DOI] [PubMed] [Google Scholar]
- Schulz KN, and Harrison MM (2018). Mechanisms regulating zygotic genome activation. Nature reviews Genetics. [DOI] [PMC free article] [PubMed]
- Stadler MR, Haines JE, and Eisen MB (2017). Convergence of topological domain boundaries, insulators, and polytene interbands revealed by high-resolution mapping of chromatin contacts in the early Drosophila melanogaster embryo. Elife 6. [DOI] [PMC free article] [PubMed] [Google Scholar]
- Stapel LC, Zechner C, and Vastenhouw NL (2017). Uniform gene expression in embryos is achieved by temporal averaging of transcription noise. Genes & development 31, 1635–1640. [DOI] [PMC free article] [PubMed] [Google Scholar]
- Subramanyam D, Lamouille S, Judson RL, Liu JY, Bucay N, Derynck R, and Blelloch R (2011). Multiple targets of miR-302 and miR-372 promote reprogramming of human fibroblasts to induced pluripotent stem cells. Nature biotechnology 29, 443–448. [DOI] [PMC free article] [PubMed] [Google Scholar]
- Tadros W, and Lipshitz HD (2009). The maternal-to-zygotic transition: a play in two acts. Development (Cambridge, England) 136, 3033–3042. [DOI] [PubMed] [Google Scholar]
- ten Bosch JR, Benavides JA, and Cline TW (2006). The TAGteam DNA motif controls the timing of Drosophila pre-blastoderm transcription. Development (Cambridge, England) 133, 1967–1977. [DOI] [PubMed] [Google Scholar]
- Titov DV, Gilman B, He QL, Bhat S, Low WK, Dang Y, Smeaton M, Demain AL, Miller PS, Kugel JF, et al. (2011). XPB, a subunit of TFIIH, is a target of the natural product triptolide. Nature chemical biology 7, 182–188. [DOI] [PMC free article] [PubMed] [Google Scholar]
- Toyama R, Rebbert ML, Dey A, Ozato K, and Dawid IB (2008). Brd4 associates with mitotic chromosomes throughout early zebrafish embryogenesis. Developmental dynamics : an official publication of the American Association of Anatomists 237, 1636–1644. [DOI] [PMC free article] [PubMed] [Google Scholar]
- Tsai MJ, Michaelis G, and Criddle RS (1971). DNA-dependent RNA polymerase from yeast mitochondria. Proceedings of the National Academy of Sciences of the United States of America 68, 473–477. [DOI] [PMC free article] [PubMed] [Google Scholar]
- Vastenhouw NL, Zhang Y, Woods IG, Imam F, Regev A, Liu XS, Rinn J, and Schier AF (2010). Chromatin signature of embryonic pluripotency is established during genome activation. Nature 464, 922–926. [DOI] [PMC free article] [PubMed] [Google Scholar]
- Vejnar CE, Moreno-Mateos MA, Cifuentes D, Bazzini AA, and Giraldez AJ (2016). Optimized CRISPR-Cas9 System for Genome Editing in Zebrafish. Cold Spring Harbor protocols 2016. [DOI] [PubMed] [Google Scholar]
- Whiddon JL, Langford AT, Wong CJ, Zhong JW, and Tapscott SJ (2017). Conservation and innovation in the DUX4-family gene network. Nature genetics 49, 935–940. [DOI] [PMC free article] [PubMed] [Google Scholar]
- Wiekowski M, Miranda M, and DePamphilis ML (1993). Requirements for promoter activity in mouse oocytes and embryos distinguish paternal pronuclei from maternal and zygotic nuclei. Developmental biology 159, 366–378. [DOI] [PubMed] [Google Scholar]
- Wintersberger E (1970). DNA-dependent RNA polymerase from mitochondria of a cytoplasmic “petite” mutant of yeast. Biochemical and biophysical research communications 40, 1179–1184. [DOI] [PubMed] [Google Scholar]
- Workman JL, and Kingston RE (1998). Alteration of nucleosome structure as a mechanism of transcriptional regulation. Annual review of biochemistry 67, 545–579. [DOI] [PubMed] [Google Scholar]
- Yonaha M, Chibazakura T, Kitajima S, and Yasukochi Y (1995). Cell cycle-dependent regulation of RNA polymerase II basal transcription activity. Nucleic acids research 23, 4050–4054. [DOI] [PMC free article] [PubMed] [Google Scholar]
- Zamir E, Kam Z, and Yarden A (1997). Transcription-dependent induction of G1 phase during the zebra fish midblastula transition. Molecular and cellular biology 17, 529–536. [DOI] [PMC free article] [PubMed] [Google Scholar]
- Zhang B, Zheng H, Huang B, Li W, Xiang Y, Peng X, Ming J, Wu X, Zhang Y, Xu Q, et al. (2016). Allelic reprogramming of the histone modification H3K4me3 in early mammalian development. Nature 537, 553–557. [DOI] [PubMed] [Google Scholar]
- Zhang M, Kothari P, Mullins M, and Lampson MA (2014a). Regulation of zygotic genome activation and DNA damage checkpoint acquisition at the mid-blastula transition. Cell cycle (Georgetown, Tex) 13, 3828–3838. [DOI] [PMC free article] [PubMed] [Google Scholar]
- Zhang Y, Vastenhouw NL, Feng J, Fu K, Wang C, Ge Y, Pauli A, van Hummelen P, Schier AF, and Liu XS (2014b). Canonical nucleosome organization at promoters forms during genome activation. Genome research 24, 260–266. [DOI] [PMC free article] [PubMed] [Google Scholar]
Associated Data
This section collects any data citations, data availability statements, or supplementary materials included in this article.
Supplementary Materials
Movie S1. CRISPR-dCas9 labeled miR-430 locus in live zebrafish embryos over cell cycle. Related to Figure 1.
Shown are nuclei from live zebrafish embryo injected with dCas9–3xGFP (green) and 2 sgRNA targeting miR-430 locus. Frames were acquired every 1 minute.
Movie S2. Tracing miR-430 transcription in vivo visualized by MBmiR430 from wild type embryos developing from 32- to 512-cell stage. Related to Figure 1.
Shown are nuclei from live zebrafish embryo injected with MBmiR430 (red) and Alexa Fluor® 488 histone H1 (green). Inset traces an example nucleus (highlighted by a white square box) in both red and green channel. MBmiR430 signals are highlighted by white arrows in the confocal images. Developmental stages are indicated on top. Frames were acquired every 2 minute.
Supplementary Table 1. Determination of zygotic and maternal-zygotic genes. Related to Figure S1 and STAR Methods.
Supplementary Table 2. Gene expression calls for all zygotic and maternal zygotic genes from Click-iT-seq. Related to Figures 2, 4–6.
Supplementary Table 3. Number of activated genes with more than 4 fold difference between different experimental conditions. Related to Figure 2, 4–6.
Supplementary Table 4. Gene expression calls from Click-iT-seq in haploid and diploid embryos. Related to Figure 3.
Supplementary Table 5. Gene expression calls from Click-iT-seq for the genes represented in the heatmap shown in figure 6F. Related to Figure 6.
Supplementary Table 6. Summary and mapping statistics of high-throughput sequencing experiments. Related to STAR Methods.