

Abstract
A growing number of studies support a tendency toward preferential host switching, by parasites and pathogens, over relatively short phylogenetic distances. This suggests that a host switch is more probable if a potential host is closely related to the original host than if it is a more distant relative. However, despite its importance for the health of humans, livestock, and wildlife, the detailed dynamics of preferential host switching have, so far, been little studied. We present an empirical test of two theoretical models of preferential host switching, using observed phylogenetic distributions of host species for RNA viruses of three mammal orders (primates, carnivores, and ungulates). The analysis focuses on multihost RNA virus species, because their presence on multiple hosts and their estimated ages of origin indicate recent host switching. Approximate Bayesian computation was used to compare observed phylogenetic distances between hosts with those simulated under the theoretical models. The results support a decreasing sigmoidal model of preferential host switching, with a strong effect from increasing phylogenetic distance, on all three studied host phylogenies. This suggests that the dynamics of host switching are fundamentally similar for RNA viruses of different mammal orders and, potentially, a wider range of coevolutionary systems.
Keywords: Coevolution, parasitism, phylogenetics
Viruses with RNA genomes are major agents of infectious disease in humans (Taylor et al. 2001; Holmes and Rambaut 2004), livestock, and wildlife (Cleaveland et al. 2001). Therefore, the study of their infection dynamics is important for human health (Jones et al. 2008), livestock economics, and environmental conservation (Cleaveland et al. 2001). However, we still know relatively little about the evolutionary factors affecting host identity and range (the type and number of host species exploited) among viruses (Longdon et al. 2011), and pathogens and parasites in general (Perlman and Jaenike 2003). RNA viruses are widely distributed among mammal species, suggesting an ancient origin (Holmes 2008). Furthermore, it has recently been shown that RNA viruses have left “fossils” dating to millions of years ago, in the form of endogenous viral elements integrated into host genomes (reviewed by Holmes 2011). Previously, matching phylogenetic branching patterns for some extant RNA viruses and their hosts had been thought to suggest a similarly ancient history for living viral strains, characterized by cospeciation with their hosts over hundreds of thousands, to millions, of years (reviewed by Holmes 2003). However, the majority of RNA viruses appear to have high rates of mutation, indicating an age in the order of hundreds of years for most extant virus taxa below the family level (Holmes 2003, 2008).
This apparent discrepancy can be explained by a model of “preferential host switching” (Charleston and Robertson 2002), in which a virus is more likely to successfully colonize a new host species if this is a close relative of the original host than if it is a more distant relative (for similar concepts in the earlier literature, see Jermy 1984; Menken 1996, e.g.). In this model, switches to phylogenetically distant hosts are possible, but are considered less probable than switches between more closely related host species. Such preferential host switching is expected because barriers to infection will depend on the physiological similarity between original and potential host species (Poulin 2005); factors that can depend strongly on host phylogeny. This is, in turn, because phylogenetic distance represents a general proxy for physiological and ecological similarity, due to the evolutionary inheritance of traits such as suitability for parasite replication (Ohishi et al. 2010), immune defenses (Longdon et al. 2011), nutrient quality (Poulin and Mouillot 2003; Poulin 2005), and body size (Clayton et al. 2003a; Bush and Clayton 2006). (We acknowledge that species‐specific differences in pathogen susceptibility are likely to lead to natural variation around this overall trend, e.g., Harder and Osterhaus 1997; Poulin and Mouillot 2003; Poulin 2005.) In some cases preferential host switching may also be promoted by phylogenetic covariance in the opportunity for infection, for example, if recently diverged host species tend to have overlapping geographic ranges (Poulin and Mouillot 2003; Davies and Pedersen 2008; but see also Daszak et al. 2001).
Since preferential host switching was proposed for primate lentiviruses (Charleston and Robertson 2002), it has been suggested as a general characteristic of viral infection dynamics (Holmes 2008) and as a wider evolutionary phenomenon: documented in phylogenetic studies of fleas (Siphonaptera, Insecta) (Krasnov et al. 2004), jumping plant‐lice (Psylloidea, Insecta) (Percy et al. 2004), and brood‐parasitic indigobirds (Vidua, Passeriformes) (Sorenson et al. 2004); and in experimental studies of sigma viruses (Longdon et al. 2011), Spiroplasma bacteria (Tinsley and Majerus 2007), lice (Phthiraptera, Insecta) (Clayton et al. 2003a), and nematodes (Allantonematidae, Tylenchida) (Perlman and Jaenike 2003). However, the detailed dynamics of preferential host switching have been relatively little studied. In particular, theoretical models describing the probability of host switching with genetic distance between potential hosts (Charleston and Robertson 2002; Engelstädter and Hurst 2006) have not previously been tested empirically, and the extent to which similar parameters of preferential host switching hold across different host phylogenies has not, until now, been investigated.
Two possible models of preferential host switching will be considered here. Both models have been proposed before now (Charleston and Robertson 2002; Engelstädter and Hurst 2006), but it has not previously been possible to test or compare them using real host‐pathogen association data. The first, exponential, model is based on the simple notion that a parasite or pathogen colonizing a new host will have reduced fitness on that host if it represents a dissimilar physiological environment to that of its original host (as introduced above). The second, sigmoidal, model derives from the idea that there will be a certain tolerance of pathogens to new environments, within which they may remain optimally or near‐optimally fit, but beyond which the combination of multiple factors’ deviation from the environment to which the parasite has adapted will become too much and fitness will rapidly decline. These two models can neatly be described by an exponential and half of a Gaussian (sigmoidal) function, respectively (see eq. 2, below). A potential example of a pathogen with a phylogenetically restricted, tolerable host range and infrequent host switches beyond this range (as predicted by the sigmoidal host‐switching model) is Influenza A virus. This is apparently more easily transmitted between bird species (the reservoir hosts) than to other animals, due to adaptation of virus subtypes to host‐specific surface receptors (Webster et al. 1992; Dugan et al. 2008; Bandín and Dopazo 2011; Gambaryan et al. 2012). On the other hand, a pathogen that appears to show an immediate reduction in infectivity with increasing phylogenetic distance from the original host (as predicted by the exponential host‐switching model) is measles virus, MV. For this virus, frequency of wild transmission appears considerably higher among humans, the natural hosts, than to nonhuman primates (de Swart 2009) and, even more so, to other mammals such as rodents (Dörig et al. 1994; Wyde et al. 2000).
Evolutionary histories of host‐pathogen association have often been investigated using cophylogenetic analysis (comparisons of host and pathogen phylogenies, e.g., Charleston and Robertson 2002). However, potential reconstruction of historical host switches using this method is complicated by the finding that both cospeciation and preferential host switching predict similar branching patterns between host and pathogen phylogenies (Charleston and Robertson 2002). Current methods of cophylogenetic analysis (implemented in programs such as TreeMap (Charleston and Robertson 2002) and Jane (Conow et al. 2010)) are designed to test hypotheses of cospeciation, and the reconstructions they produce are expected to decrease in optimality as the actual incidence of cospeciation declines (Percy et al. 2004). To overcome the above complications, this study takes an alternative approach, and reconstructs the dynamics of preferential host switching among 38 recorded “multihost” RNA viruses of mammals, on phylogenies of their primate, carnivore, and ungulate hosts.
Multihost pathogens use multiple host species, often as definitive hosts on which they are able to complete their life cycle and reproduce (Banks and Paterson 2005) (here, the term “pathogen” is used for simplicity, though the arguments apply to both pathogens and parasites). Although most pathogens are likely to experience some level of species barrier (giving reduced infectivity among individuals of an unusual host species), the majority of pathogens may have the potential to infect multiple host species (Woolhouse et al. 2001). Two alternative evolutionary processes have generally been suggested to explain the presence of a pathogen species on multiple hosts (Banks and Paterson 2005). One process involves association by evolutionary descent, in which divergent host species inherit a pathogen that does not, itself, speciate (referred to, e.g., as failure to speciate (Johnson et al. 2003; Banks and Paterson 2005; Clayton et al. 2003b) or to diverge (Conow et al. 2010)). The other process involves association by colonization, in which one parasite population switches host, but does not speciate from a population maintained on the original host (which we refer to here as incomplete host switching, after Clayton et al. 2003b). Failure to speciate and incomplete host switching are comparable to the cophylogenetic events for single‐host parasites of, respectively, cospeciation (which involves association by descent; but with parasite speciation) and host switching (which involves association by colonization; but with either parasite speciation or extinction of the parasite population on the original host (Clayton et al. 2003b)). However, we note that currently available cophylogenetic methods are able to fully reconstruct only one of these theoretical events for multihost parasites (failure to speciate, which can be reconstructed by the software package Jane 3 (Conow et al. 2010)). For extant RNA viruses, failure to speciate is ruled out by their young age relative to their host species (as implied by current estimates of substitution rates for the majority of RNA viruses (Holmes 2003) and discussed below). This leaves host switching—in this case incomplete, that is, without virus speciation—as the most probable evolutionary mechanism for the spread of a given RNA virus species to multiple host species. The distribution of RNA viruses on the phylogenies of their mammal hosts, therefore, provides a record of host‐switching dynamics that allows us to test alternative theoretical models of preferential host switching.
To achieve this, approximate Bayesian computation (ABC) is used to test the fit of the two models of preferential host switching to the observed distributions of multihost RNA viruses on the phylogenies of their mammal hosts (primates, carnivores, and terrestrial ungulates). This method is also used to estimate the value of a parameter describing the decay in the probability of host‐switching success with increasing phylogenetic distance between current and potential hosts (details below). The results support a decreasing sigmoidal (Gaussian) function for the probability of a successful host switch given phylogenetic distance, with a strong effect from phylogenetic distance between species on the host phylogeny.
Material and Methods
DATA SOURCES
Records of host species exploited by RNA viruses were taken from the Global Mammal Parasite Database (GMPD) (Nunn and Alitzer 2005), a large compilation of wild host‐parasite/pathogen associations documented in the scientific literature. This database covers three major mammal groups: nonhuman primates, carnivores, and terrestrial ungulates. Corresponding host phylogenies, of Primates, Carnivora and Cetartiodactyla, were downloaded from the 10kTrees project (Arnold et al. 2010), which provides up‐to‐date Bayesian phylogenies for these mammal orders. For each order, the 50% majority rule consensus of 10,000 phylogenies sampled from the Bayesian Markov Chain Monte Carlo (MCMC) tree search (excluding burn‐in), was used in our main analyses (for details of phylogenetic reconstruction methods see Arnold et al. 2010). A second analysis, which used 1000 phylogenies sampled from the MCMC chain (again excluding burn‐in), was conducted to test whether the results were robust to phylogenetic uncertainty (details below). The dataset of host associations was then restricted to those RNA virus species recorded on more than one host species represented in a 10kTrees phylogeny.
Some extant RNA viruses have been suggested to have unusually low substitution rates and old evolutionary origins, making cospeciation with their host species a possibility (reviewed by Holmes 2003) and potentially introducing failure to speciate as an explanation for the host distribution of widespread parasites. Of these, one (simian foamy virus, see Switzer et al. 2005) appeared in the primary dataset. Because this study is concerned with the dynamics of host switching (rather than “failure to speciate” events), this virus was excluded from the final dataset. Had there been any unidentified failures to speciate, among the multihost viruses that were included in our analyses, they could potentially bias our conclusions. However, host‐virus associations over the time scales of mammal species divergence (generally, in the order of millions of years, e.g., dos Reis et al. 2012) have been rejected or considered less probable than recent host switches for the remaining viruses in our dataset.
These comprised: the caliciviruses reptilian crotalus‐1, feline calicivirus, and San Miguel sea lion virus (Smith et al. 1998; Etherington et al. 2006); the coronaviruses canine coronavirus, and feline infectious peritonitis (Gorbalenya 2008); the retroviruses feline leukemia virus, feline immunodeficiency virus, and simian T‐lymphotropic virus‐1 and ‐L (Van Brussel et al. 1999; Switzer et al. 2006; López et al. 2009; Roelke et al. 2009); rabies virus (Jackson and Charleston 2004); the morbilliviruses measles virus, canine distemper virus, phocine distemper virus, and dolphin morbillivirus (Harder and Osterhaus 1997; Haffar et al. 1999; Furuse et al. 2010; Wertheim and Kosakovsky Pond 2011, though see Ohishi et al. 2010); vaccinia virus (Tryland et al. 1998); foot‐and‐mouth disease virus (Tully and Fares 2008); the orbiviruses bluetongue virus and epizootic hemorrhagic disease virus (Biek 2007; Carpi and Holmes 2010); chikungunya virus (Volk et al. 2010); the alphaviruses mayaro virus and semliki forest virus (Gould et al. 2010; Forrester et al. 2012); the flaviviruses dengue virus‐2, Japanese encephalitis virus, St. Louis encephalitis virus, West Nile virus, yellow fever virus, and Zika virus (Auguste et al. 2009; Weaver and Vasilakis 2009; Misra and Kalita 2010; May et al. 2011; Haddow et al. 2012); Zaire ebolavirus (Grard et al. 2011); influenza A virus‐2 (Xu et al. 2012); simian immunodeficiency virus‐agm (Wertheim and Worobey 2007, 2009), the orthobunyaviruses Bakau and Bunyamwera, although these have been relatively little studied (Yakondo et al. 2007; Lambert and Lanciotti 2008); human respiratory syncytial virus (Köndgen et al. 2008; Gaunt et al. 2011); human parainfluenza virus‐3 (Collins 2010); rotavirus A (Ghosh et al. 2011); and the rubulaviruses human parainfluenza virus‐2 and ‐5, although the age and evoloutionary origins of such paramyxoviruses require further study (Drexler et al. 2012).
The final dataset of 228 host‐virus associations is shown in the Supporting Information (Table S1). Numbers of multihost RNA virus species recorded for the three mammal orders were 22 for the primates, 12 for carnivores, and 4 for terrestrial ungulates. The effectiveness of the ABC method given these different virus sample sizes was tested by cross‐validation, as detailed below.
SAMPLING CONSIDERATIONS
We considered a number of potential sources of sampling bias in the recorded distributions of multihost RNA viruses on their host phylogeny. One potential problem for the identification of multihost viruses, and multihost parasites in general, is the accurate designation of species (e.g., Van Regenmortel 2011). For example, lumping of distinct parasite populations with different hosts into a single species might lead to overestimation of the number of host species exploited. To minimize this possible effect, the dataset was screened to ensure all included viruses were classified to the species level. We also note that the recent age of origin inferred for the majority of extant RNA viruses (Holmes 2003) suggests that any distinct strains, incorrectly lumped within the same species, would still represent very closely related lineages that achieved their current host range by host switches (the subject of this study).
Another potential sampling issue is that relevant host‐parasite associations, present in the wild, might not be recorded in the database (Nunn and Alitzer 2005). To test for such sampling bias, we measured sampling effort for each species of virus, or host, included in the dataset and checked for a relationship with the number of recorded hosts. As in previous studies of host range (e.g., Nunn et al. 2004), we estimated sampling effort using the number of citations for a given species in a comprehensive database of published articles, in this case the Web of Science (Web of Knowledge 2012). The number of citations for each virus was non‐normally distributed for the viruses of primates and carnivores (primates: Shapiro–Wilk W= 0.317, P < 0.0001; carnivores: W= 0.676, P= 0.0005; ungulates: W= 0.982, P= 0.911). Similarly, the average number of citations per host (calculated for each multihost virus) was non‐normally distributed for primates (primates: W= 0.812, P= 0.0008; carnivores: W= 0.946, P= 0.588; ungulates: W= 0.996, P= 0.987). Therefore, nonparametric Spearman's rank correlations were performed. Neither the number of citations for each virus, nor the average number of citations per host, was significantly correlated with the number of host species recorded for a given virus (virus citations, primates: P= 0.964; carnivores: P= 0.964; ungulates P= 0.667, average host citations, primates: P= 0.843; carnivores: P= 0.604; ungulates: P= 0.5).
Finally, any phylogenetic bias in sampling effort for different species of parasite and host might affect the phylogenetic distribution of recorded hosts for a multihost RNA virus. Two tests were performed to assess whether measures of sampling effort for virus or host species were significantly correlated with the average phylogenetic distance between hosts (as measured by the HSD“host switch distance” statistic, detailed below). Spearman's rank correlations indicated that the sampling effort for each virus was not significantly correlated with HSD, for viruses of primates (P= 0.341), carnivores (P= 0.439) or ungulates (P= 0.083). Nor was the average number of citations per host species significantly correlated with HSD (primates: P= 0.126; carnivores: P= 0.72; ungulates: P= 0.75). Furthermore, HSD was found to be normally distributed for all viruses of all three mammal orders (primates: W= 0.945, P= 0.254; carnivores: W= 0.178, P= 0.904; ungulates: W= 0.998, P= 0.995). Consequently, the main analyses were performed without any transformation or correction of HSD.
MEASURING HOST SWITCH DISTANCE
A measure of phylogenetic distance between the host species exploited by a given multihost RNA virus was used to estimate host switch distances. Specifically, host switch distance (HSD) was estimated, for each virus, as the average phylogenetic distance between each pair (i, j) of host species of that virus:
 |
(1) |
where dij is the midbranch distance between two host species i and j, and n is the number of host species. The midbranch distance between two hosts is calculated as dij=Dij ‐ (Ai + Aj)/2, where Dij is the patristic distance between host leaves i and j, and Ai (resp. Aj) is the length of the branch incident to host leaf i (resp. j). HSD is similar to previously proposed measures of phylogenetic host specificity (Poulin and Mouillot 2003; Poulin, Krasnov, and Mouillot 2011), but considers distances between branch midpoints rather than distances between leaves. Branch midpoints were used to model host switch events from a “take‐off” site, at an unknown point along the branch to one of the host leaves, to a “landing” site, at an unknown point along the branch to another host leaf. Although this was the biologically motivated method of calculation, simulated phylogenetic distances between leaves were similarly distributed to those calculated between midbranch points (data not shown). HSD was not found to be significantly correlated with the number of hosts for viruses of primates (linear correlation P= 0.194), carnivores (P= 0.065), or ungulates (P= 0.295), suggesting that this measure of interhost phylogenetic distance is comparable for multihost viruses with different numbers of hosts (two hosts, three hosts, etc.). HSD values for each virus were then summarized by the mean, variance, skewness, and kurtosis, calculated separately among the viruses of primates, carnivores, and ungulates. This provided four summary statistics for each host phylogeny, which could then be compared with similar statistics calculated for the data simulated under the theoretical models of preferential host switching (as described below).
Mathematical Models of Preferential Host Switching
We tested two theoretical models for the probability of a successful host switch at a given distance between species on the host phylogeny. These represent exponential (Charleston and Robertson 2002; Engelstädter and Hurst 2006), versus sigmoidal (Engelstädter and Hurst 2006), functions for the decline in host switch probability with phylogenetic distance, respectively:
| (2) |
where  and
and  give the probability of a successful host switch between species i and j on the host phylogeny (which may have occurred either from i to j, or from j to i), γ
 is a constant for the host phylogeny (which can be viewed as the probability of successful infection where dij= 0 (Engelstädter and Hurst 2006)), dij is the phylogenetic distance between species i and j (as described above), and β is a positive parameter that scales the decay in host switch probability as dij increases. Under both models (Fig. 1), the maximum possible probability of a host switch is given by the value of γ (achieved if dij= 0). With a given value of β, the probability of a successful host switch decreases toward zero as phylogenetic distance increases, reaching
  when dij=β (Engelstädter and Hurst 2006). As the decay parameter β decreases, the probability of a host switch at a given phylogenetic distance declines. Overall, both models describe a decrease in the probability of a successful host switch as phylogenetic distance increases. However, with a given β value, the sigmoidal function (Fig. 1B) shows a smaller initial decline in host switch probability (when phylogenetic distances are small) followed by a steeper decline toward a host switch probability of zero (as the distance between host species becomes relatively large), compared with the exponential function (Fig. 1A) (as discussed below). We use 2 as the base of the exponent for consistency with previously proposed forms (Engelstädter and Hurst 2006), noting that changing the base is equivalent to scaling the β value.
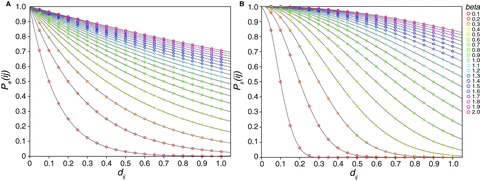
Figure 1.
Theoretical probability ( or
or  ) of a successful host switch, at a given phylogenetic distance (dij), under an exponential (A) or sigmoidal model (B) of preferential host switching (eq. 2). The parameter β determines the decay in the probability of a successful host switch as phylogenetic distance increases. The maximum probability of a successful host switch corresponds to the constant γ of equation 2, here equal to 1. The illustrated phylogenetic distances (measured as average substitutions per site) cover the range of interspecies distances shown within the studied host phylogenies (see Fig. 2).
DATA SIMULATION
Host switches were simulated, under the two theoretical models of preferential host switching, using a MATLAB (version 7.13.0.564, The Mathworks Inc. 2011) program written for the purpose (Text S1). Simulations were performed separately for the three consensus phylogenies (Primates, Carnivora, and Cetartiodactyla). The patristic distance matrix corresponding to each phylogeny was used to derive a matrix of the midbranch distances (dij) between each possible pair of hosts (as described above). The probability of host switch success under each of the two models (probability  for the exponential model or
  for the sigmoidal model) was then calculated for each possible pair of host species, with values of the decay parameter β ranging from 0.01 to 2 in steps of 0.01. For sampling purposes, host switch probabilities (for a given phylogeny and with a given β value) were then normalized by dividing the probability calculated for each possible host pair by the total probability of host switching (the sum probability over all possible pairs of species). A random sampling procedure was then used to sample interhost phylogenetic distances, according to the normalized probability of each possible host switch. Sampling from the normalized probabilities (rather than non‐normalized values) removes the effect of the phylogenetic constant γ (the probability of infection at a phylogenetic distance, dij, of zero), and ensures that a phylogenetic distance is sampled at every iteration. This is suitable for comparison with our observed data, which records only the presence of a pathogen (rather than recording absence vs. presence of each pathogen across all potential hosts, e.g.). Each sampled distance dij provides an estimate of host switch distance, HSD, where
  (eq. 1). The sample size was set to match the recorded number of viruses for each host order (22 for Primates, 12 for Carnivora, and 4 for Cetartiodactyla). Four summary statistics were then calculated for each sample. These were the mean value of the HSD statistic (Fig. 2), and its variance, skewness, and kurtosis (Figs. S1–S3). The use of these different sample sizes allowed us to test whether ABC could distinguish between simulations, with different models and parameter values, given sample sizes comparable to the numbers of viruses actually recorded in databases of host‐pathogen associations, such as that used in our study. The sampling procedure was repeated 1000 times for each unique combination of host phylogeny, model, and β value, and the calculated summary statistics (HSD mean, variance, skewness, and kurtosis) were output for ABC.
Figure 2.
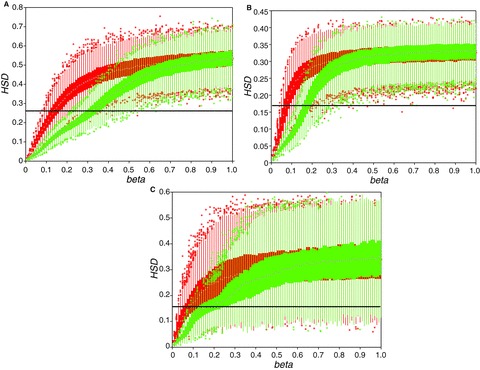
Mean host switch distance (HSD) (eq. 1) values, simulated under an exponential (red) or sigmoidal (green) model of preferential host switching (eq. 2). Simulations were conducted separately on the phylogenies of primates (A), carnivores (B), and terrestrial ungulates (C), across a range of values of the probability decay parameter β (eq. 2). Boxplot midpoints (black circles) show the median statistic value for 1000 simulations, box ends show the 25th and 75th percentiles, and whiskers extend to marked outliers. Reference line (black) shows the mean value of HSD calculated across the observed RNA virus‐host associations.
This procedure was also repeated using the average pairwise phylogenetic distance calculated on 1000 phylogenies sampled from the MCMC chain (rather than the consensus phylogeny, which was used in the main analyses). Taking the average pairwise distances, across the sampled phylogenies, approximately weights them by the relevant clade posterior probabilities. This allows us to test whether the main results (based on the consensus phylogeny) were robust to phylogenetic uncertainty, by comparison against the results based on average phylogenetic distance (across the range of topologies present in the MCMC sample).
APPROXIMATE BAYESIAN COMPUTATION
Data simulated under the two models of preferential host switching were compared with the observed phylogenetic distributions of multihost RNA viruses using ABC, as implemented in the R package abc (Csilléry 2012). ABC allows model and parameter selection, and estimation of support for a selected model or parameter, under complex biological models for which computation of the likelihood function may be impracticable (Csilléry et al. 2010). This is achieved by comparing summary statistics for observed data with similar statistics calculated for the simulated data. These comparisons are based on a rejection method, which repeatedly samples from the simulated statistics, accepting parameter values for a given simulation if the distance from the observed statistic is below a set threshold (which determines the proportion of accepted simulations). Accepted parameter values can be viewed as a sample from an approximate posterior probability distribution for that parameter. Regression techniques may then be applied to improve the estimates of distance between statistic values, and to produce a weighted and corrected approximation of the parameter posterior. Average posterior probabilities can then be calculated for different models, over the range of simulated parameter values, and compared using Bayes factors (Csilléry 2012). Bayesian confidence (or, credible) intervals were calculated from each estimated posterior probability distribution, giving the interval within which there is a 95% probability that the parameter value lies.
For each RNA virus in the dataset, the observed phylogenetic distribution of its hosts was summarized using the mean phylogenetic distance HSD (as described above), and three further summary statistics for HSD: its variance, skewness, and kurtosis. These statistics (mean, variance, skewness, and kurtosis) are widely used to summarize biological data (e.g., Dowd 2007), and their effectiveness in model and parameter selection was tested using an ABC cross‐validation procedure, also implemented in the abc package. Cross‐validation for model and parameter selection was also performed to select the best performing ABC method and tolerance level, and to evaluate performance. Cross‐validation for “model” selection repeatedly samples from the simulated data and records the percentage of samples for which the simulation model is correctly identified, based on the simulated summary statistics. Cross‐validation for “parameter” selection repeatedly samples from the simulated data and calculates the prediction error for a given parameter (the sum of squared differences between true and estimated values divided by the variance (Csilléry 2012)). Based on cross‐validation for parameter selection, the main analyses were performed using a linear regression method to improve posterior probability estimation (Csilléry 2012) and reduce estimation error (relative to the simpler rejection method). Based on cross‐validation for parameter selection, we used a tolerance level of 0.05 (rather than the tested alternatives of 0.005 or 0.5), which gave the greatest model selection accuracy with the ABC method and simulation set chosen for the main analyses (parameter prediction error was found to be relatively independent of tolerance level, as illustrated in Fig. S4). The ABC procedure was performed first on the full simulation set (across all β values) and then on the subset of simulations with  0.4, over which the models can be clearly distinguished while covering a relatively wide range of β values (Figs. 2, S1–S3) as confirmed by cross‐validation (see results below).
Results
Model selection with ABC (Csilléry 2012) supported the sigmoidal model of preferential host switching, over the exponential model, for all three studied host phylogenies. Mean posterior probabilities for the sigmoidal model were 0.925 for primates, 0.528 for carnivores, and 0.629 for ungulates; whereas posterior probabilities for the exponential model were 0.075 for primates, 0.472 for carnivores, and 0.371 for ungulates. Bayes factor comparisons of these posterior probabilities (Kass and Raftery 1995) indicate positive support for the sigmoidal model, over the exponential model, among the multihost RNA viruses of primates (Bayes factor = 12.4), but only weak support among those of ungulates (Bayes factor = 1.7) and carnivores (Bayes factor = 1.1). For all three host phylogenies, ABC selected a relatively low value for the parameter β, indicating a strong effect of host phylogenetic distance (HSD) on the probability of a successful host switch. The modal β value with 95% Bayesian confidence intervals on the posterior probability distribution for this parameter was 0.29 [0.25, 0.37] for the primates, 0.18 [0.15, 0.27] for carnivores, and 0.15 [0.1, 0.37] for ungulates.
A second set of analyses, conducted using the average pairwise distance between species (across 1000 phylogenies sampled from the Bayesian MCMC chain), gave similar results to those based on the majority rule consensus phylogenies (above). These supported the sigmoidal model (posterior probabilities: primates 0.908, carnivores 0.535, ungulates 0.641) over the exponential model (posterior probabilities: primates 0.092, carnivores 0.466, ungulates 0.359) and returned relatively low estimates for parameter β (primates 0.3 [0.25, 0.37], carnivores 0.17 [0.14, 0.27], ungulates 0.15 [0.1, 0.38]). This suggests that the main results, based on the consensus phylogenies, are fairly robust to phylogenetic uncertainty.
Figure 1 illustrates modeled relationships between phylogenetic distance and the probability of a successful host switch. Given levels of β between 0.1 and 0.3 (as selected for the three host phylogenies), the best supported sigmoidal model indicates, first, that very low phylogenetic distances (below approximately 0.05 substitutions per site) present very little barrier to host switching. Then, with increasing phylogenetic distance, there is a relatively steep decline in the probability of a successful host switch, nearing zero as phylogenetic distances increase above approximately 0.25–0.8 substitutions per site. Figure 2 illustrates the average host switch distance (HSD) returned by computer simulation on each host phylogeny. With the β parameter value selected using ABC (for the given host phylogeny), the average phylogenetic distance of a simulated host switch under the best supported sigmoidal model is markedly lower than that expected under the exponential model (given the same value of β).
Cross‐validation for model selection, using the simulated host switch data, confirmed that the simulation model and β parameter value could be effectively estimated from the summary statistics for each host phylogeny. This indicates that ABC model selection was effective with each of the three sample sizes used for calculation of the HSD summary statistics (which corresponded to the number of observed host‐virus associations, of 22 for primates, 12 for carnivores, and 4 for ungulates). The sigmoidal model was correctly selected in 88% of the sampled simulations on the primate phylogeny, 61% on the carnivore phylogeny, and 70% on the ungulate phylogeny. The exponential model was correctly selected in 74% of sampled simulations for primates, 84% for carnivores, and 61% for ungulates. Cross‐validation for parameter selection indicated that the prediction error (Csilléry 2012) for the β parameter was very low for the simulations on the primate phylogeny (error = 0.05), for which the sample of virus species was largest. Prediction error was higher, for carnivores (error = 0.12) and ungulates (error = 0.31), which had lower sample sizes. However, error plots illustrate that estimated parameter values (within the relevant Bayesian confidence intervals) are approximately linearly related to true parameter values, showing no evidence for prediction bias (Fig. S4). This indicates that relatively large samples of host‐virus associations allow for more effective model and parameter testing, but that even relatively small samples can provide information on host‐switching dynamics.
Discussion
Our survey of the RNA viruses of mammals recorded in the GMPD (Nunn and Alitzer 2005) found a total of 38 multihost RNA virus species, collectively infecting 228 wild hosts among the primates, carnivores, or terrestrial ungulates. Of the RNA viruses recorded in the GMPD, multihost viruses represented 96% of the total among primates, 32% among carnivores, and 44% among ungulates. Of these recorded multihost viruses, 42% had just two hosts and 82% had fewer than seven hosts, although a few virus species infected relatively large numbers of host species. The most extreme examples in the dataset were canine distemper virus (Morbillivirus, Paramyxoviridae) with 30 carnivore hosts, yellow fever virus (Flavivirus, Flaviviridae) with 26 primate hosts, and Bluetongue virus and Epizootic hemorrhagic disease virus (Orbivirus, Reoviridae) each with four ungulate hosts; all viruses noted for their unusually broad host ranges (Harder and Osterhaus 1997; Purse et al. 2005; Chambers 2010; MacLachlan and Guthrie 2010; de Almeida et al. 2012).
Comparison of two theoretical models of preferential host switching (eq. 2) using ABC supported a sigmoidal model, over an exponential model, with a strong effect from phylogenetic distance for the three studied host phylogenies. This suggests that the decay in host switch probability is initially shallow, before proceeding steeply as phylogenetic distance increases. It is noteworthy that our tests across three mammal phylogenies (primates, carnivores and ungulates) all supported the same theoretical model and similarly strong effects from phylogenetic distance. These results suggest that strong preferential host switching, with a sigmoidal decay in the probability of a successful host switch as phylogenetic distance increases, may be a general characteristic of infection dynamics among mammal RNA viruses.
This result feeds into our understanding of the coevolutionary dynamics of host switching by parasites and pathogens, potentially generalizing across many different coevolutionary systems (see below). Although it has long been held that the success of host switching diminishes with phylogenetic distance between current and nascent hosts, it has not previously been possible to test particulars of this decay. Our work suggests that ecological arguments of a certain “tolerable range” of host environment are indeed reflected in a sigmoidal reduction in host‐switching success with increasing phylogenetic distance.
This agrees with previous experimental observations from a wide range of host and parasite taxa. First, it has been observed that small phylogenetic distances (such as those between sister species, or within a subgenus (Perlman and Jaenike 2003) or genus (Tinsley and Majerus 2007)) can present very low barriers to host switching. Second, a number of recent studies suggest that the distribution of pathogens and parasites on the phylogeny of their hosts is affected by the phylogenetic distance between the host species (Charleston and Robertson 2002; Clayton et al. 2003a; Perlman and Jaenike 2003; Poulin and Mouillot 2003; Krasnov et al. 2004; Percy et al. 2004; Sorenson et al. 2004; Tinsley and Majerus 2007; Longdon et al. 2011). Third, it has been suggested that host switches over very large phylogenetic distances are comparatively rare. For example, few pathogens or parasites have hosts in difference orders or classes (Gifford et al. 2005; Woolhouse and Gowtage‐Sequeria 2005) and very few infect hosts in different phyla (Poulin and Mouillot 2003).
Although the sigmoidal host‐switching model had the highest posterior probability (compared with the exponential model) for all three studied orders, and is consistent with previous suggestions (as described above), Bayes factor support was weaker for the smaller carnivore and ungulate datasets than for the larger primate dataset. This suggests that the generality of the sigmoidal host‐switching model should be corroborated as more host‐virus association data becomes available for nonprimate groups.
Our ABC parameter selection supported a relatively low value of the model parameter β, which scales the decay in host switch probability with increasing phylogenetic distance between current and potential hosts. Increasing values of β indicate a declining effect of phylogenetic distance. However, the average host switch distance modeled with a particular β value depends on the distribution of branch lengths on the host phylogeny (Fig. 2). Thus, the significant point is not the selected value of the β parameter per se, but that the value supported for each phylogeny falls in the range where phylogenetic distance strongly affects the distribution of simulated host switches. This suggests that the dynamics of host switching by mammal RNA viruses have been strongly affected by host phylogeny.
Although our analysis focused on the decay parameter β describing the probability of a successful host switch at a given phylogenetic distance, the models of host switching also contain a parameter γ, which represents the probability of infection within the original host species (Engelstädter and Hurst 2006). Our ABC procedure could perhaps be extended to incorporate estimates of γ, based on statistics describing intrahost pathogen infectivity (e.g., see Tinsley and Majerus 2007), though it is not yet clear how informative this would be. Here we have tested two simple models that could be compared with the available data. Of course, simply finding that one model is better supported than another does not mean that that model is the correct one in all cases: however, we regard this as an important first step in understanding the general dynamics of host switching by RNA viruses. Furthermore, the ABC methods used here could be applied to other models as they arise.
In summary, we present a novel empirical test of two theoretical models of preferential host switching and the model parameter that scales the predicted decay in host switch probability. Comparison of observed and computer simulated host phylogenetic distributions for mammal RNA viruses, using ABC, supports a strong sigmoidal decay in the probability of a successful host switch as phylogenetic distance on the host phylogeny increases. The same model, with similar decay parameter values, is supported for all three studied host phylogenies (primates, carnivores, and ungulates). This suggests that the supported model is applicable across mammal RNA viruses, and may generalize to a wider range of coevolutionary systems. These findings provide an insight into the dynamics of host switching, an evolutionary factor thought be responsible for a majority (Holmes and Rambaut 2004) of emerging and re‐emerging infectious disease.
Associate Editor: S. Remold
Supporting information
Table S1. Recorded mammal hosts of RNA viruses, as used in this study.
Text S1. Matlab program for data simulation.
Figure S1. Variance among the simulated HSD statistics, otherwise annotated as for Figure 2.
Figure S2. Skewness among the simulated HSD statistics, otherwise annotated as for Figure 2.
Figure S3. Kurtosis among the simulated HSD statistics, otherwise annotated as for Figure 2.
Figure S4. Prediction error for model parameter β (eq. 2) determined using an approximate Bayesian computation cross‐validation procedure (Csilléry 2012) for simulated host switches on the phylogenies of primates (A), carnivores (B), and ungulates (C).
Supporting info item
ACKNOWLEDGMENTS
This work was supported by an Australian Research Council Grant, DP1094891, which we gratefully acknowledge. We also thank the curators of the 10kTrees project for granting us early access to their phylogenies of Carnivora and Cetartiodactyla.
LITERATURE CITED
- Arnold, C. , Matthews L. J., and Nunn C. L.. 2010. The 10kTrees website: a new online resource for primate phylogeny. Evol. Anthropol. 19:114–118. [Google Scholar]
- Auguste, A. J. , Pybus O. G., and Carrington C. V. F.. 2009. Evolution and dispersal of St. Louis encephalitis virus in the Americas. Infect. Genet. Evol. 9:709–715. [DOI] [PubMed] [Google Scholar]
- Bandín, I. , and Dopazo C. P.. 2011. Host range, host specificity and hypothesized host shift events among viruses of lower vertebrates. Vet. Res. 42:67. [DOI] [PMC free article] [PubMed] [Google Scholar]
- Banks, J. C. , and Paterson A. M.. 2005. Multi‐host parasite species in cophylogenetic studies. Int. J. Parasitol. 35:741–746. [DOI] [PubMed] [Google Scholar]
- Biek, R. 2007. Evolutionary dynamics and spatial genetic structure of epizootic hemorrhagic disease virus in the eastern United States. Infect. Genet. Evol. 7:651–655. [DOI] [PubMed] [Google Scholar]
- Bush, S. E. , and Clayton D. H.. 2006. The role of body size in host specificity: reciprocal transfer experiments with feather lice. Evolution 60:2158–2167. [PubMed] [Google Scholar]
- Carpi, G. , and Holmes E. C.. 2010. The evolutionary dynamics of bluetongue virus. J. Mol. Evol. 70:583–592. [DOI] [PubMed] [Google Scholar]
- Chambers, T. J. 2010. Flaviviruses: general features. Pp. 77–87 in Mahy B. W. J. and Van Regenmortel M. H. V., eds. Desk encyclopedia of human and medical virology. Elsevier Academic Press, Oxford , U.K . [Google Scholar]
- Charleston, M. A. , and Robertson D. L.. 2002. Preferential host switching by primate lentiviruses can account for phlyogenetic similarity with the primate phylogeny. Syst. Biol. 51:528–535. [DOI] [PubMed] [Google Scholar]
- Clayton, D. H. , Bush S. E., Goates B. M., and Johnson K. P.. 2003a. Host defense reinforces host‐parasite coevolution. Proc. Natl. Acad. Sci. USA 100:15694–15699. [DOI] [PMC free article] [PubMed] [Google Scholar]
- Clayton, D. H. , Al‐Tamimi S., and Johnson K. P. 2003b. The ecological basis of coevolutionary history. Pp. 310–342 in M Page R. D., ed. Tangled trees. University of Chicago Press, Chicago . [Google Scholar]
- Cleaveland, S. , Laurenson M. K., and Taylor L. H.. 2001. Diseases of humans and their domestic mammals: pathogen characteristics, host range and the risk of emergence. Philos. Trans. R. Soc. Lond. B 356:991–999. [DOI] [PMC free article] [PubMed] [Google Scholar]
- Collins, P. L. 2010. Identification of simian agent 10 as human parainfluenza virus type 3 suggests transmission of a human virus to an African monkey. J. Virol. 84:13068–13070. [DOI] [PMC free article] [PubMed] [Google Scholar]
- Conow, C. , Fielder D., Ovadia Y., and Libeskind‐Hadas R.. 2010. Jane: a new tool for the cophylogeny reconstruction problem. Algorithms Mol. Biol. 5:16. [DOI] [PMC free article] [PubMed] [Google Scholar]
- Csilléry, K. 2012. abc: an R package for approximate Bayesian computation (ABC). Methods Ecol. Evol. 3:475–479. [Google Scholar]
- Csilléry, K. , Blum G. B., Gaggiotti O. E., and François O.. 2010. Approximate Bayesian computation (ABC) in practice. Trends Ecol. Evol. 25:410–418. [DOI] [PubMed] [Google Scholar]
- Daszak, P. , Cunningham A. A., and Hyatt A. D.. 2001. Anthropogenic environmental change and the emergence of infectious diseases in wildlife. Acta Trop. 78:103–116. [DOI] [PubMed] [Google Scholar]
- Davies, J. , and Pedersen A. B.. 2008. Phylogeny and geography predict pathogen community similarity in wild primates and humans. Proc. R. Soc. Lond. B 275:1695–1701. [DOI] [PMC free article] [PubMed] [Google Scholar]
- de Almeida, M. A. , Dos Santos E., da Cruz Cardoso J., da Fonseca D. F., Noll C. A., Silveira V. R., Maeda A. Y., de Souza R. P., Kanamura C., and Brasil R. A.. 2012. Fever outbreak affecting Alouatta populations in southern Brazil (Rio Grande do Sul State), 2008–2009. Am. J. Primatol. 74:68–76. [DOI] [PubMed] [Google Scholar]
- de Swart, R. L. 2009. Measles studies in the Macaque model. Curr. Top. Microbiol. Immunol. 330:55–72. [DOI] [PMC free article] [PubMed] [Google Scholar]
- Dörig, R. E. , Marcil A., and Richardson C. D.. 1994. CD46, a primate‐specific receptor for measles virus. Trends Microbiol. 2:312–318. [DOI] [PubMed] [Google Scholar]
- dos Reis, M. , Inoue J., Hasegawa M., Asher R., Donoghue P. C. J., and Ziheng Y.. 2012. Phylogenomic datasets provide both precision and accuracy in estimating the timescale of placental mammal phylogeny. Proc. R. Soc. Lond. B 279:3491–3500. [DOI] [PMC free article] [PubMed] [Google Scholar]
- Dowd, M. 2007. Bayesian statistical data assimilation for ecosystem models using Markov Chain Monte Carlo. J. Marine Syst. 68:439–456. [Google Scholar]
- Drexler, J. F. , Corman V. M., Müller A., Maganga G. D., Vallo P., Binger T., Gloza‐Rausch F., Rasche A., Yordanov S., Seebens A., et al 2012. Bats host major mammalian paramyxoviruses. Nat. Commun. 3 796. [DOI] [PMC free article] [PubMed] [Google Scholar]
- Dugan, V. G. , Chen R., Spiro D. J., Sengamalay N., Zaborsky J., Ghedin E., Nolting J., Swayne D. E., Runstadler J. A., Happ G. M., et al 2008. The evolutionary genetics and emergence of avian influenza viruses in wild birds. PLoS Pathog. 4:e1000076. [DOI] [PMC free article] [PubMed] [Google Scholar]
- Engelstädter, J. , and Hurst G. D. D.. 2006. The dynamics of parasite incidence across host species. Evol. Ecol. 20:603–616. [Google Scholar]
- Etherington, G. J. , Ring S. M., Charleston M. A., Dicks J., Rayward‐Smith V. J., and Roberts I. N.. 2006. Tracing the origin and co‐phylogeny of the caliciviruses. J. Gen. Virol. 87:1229–1235. [DOI] [PubMed] [Google Scholar]
- Forrester, N. L. , Palacios G., Tesh R. B., Savji N., Guzman H., Sherman M., Weaver S. C., and Lipkin W. I.. 2012. Genome‐scale phylogeny of the Alphavirus genus suggests a marine origin. J. Virol. 86:2729–2738. [DOI] [PMC free article] [PubMed] [Google Scholar]
- Furuse, Y. , Suzuki A., and Oshitani H.. 2010. Origin of measles virus: divergence from rinderpest virus between the 11th and 12th centuries. Virol. J. 7:52. [DOI] [PMC free article] [PubMed] [Google Scholar]
- Gambaryan, A. S. , Matrosovich T. Y., Philipp J., Munster V. J., Fouchier R. A. M., Cattoli G., Capua I., Krauss S. L., Webster R. G., Banks J., et al 2012. Receptor‐binding profiles of H7 subtype influenza viruses in different host species. J. Virol. 86:4370–4379. [DOI] [PMC free article] [PubMed] [Google Scholar]
- Gaunt, E. R. , Jansen R. R., Poovorawan Y., Templeton K. E., Toms G. L., and Simmonds P.. 2011. Molecular epidemiology and evolution of human respiratory syncytial virus and human metapneumovirus. PLoS One 6:e17427. [DOI] [PMC free article] [PubMed] [Google Scholar]
- Ghosh, S. , Gatheru Z., Nyangao J., Adachi N., Urushibara N., and Kobayashi N.. 2011. Full genomic analysis of a simian SA11‐like G3P[2] rotavirus strain isolated from an asymptomatic infant: identification of novel VP1, VP6 and NSP4 genotypes. Infect. Genet. Evol. 11:57–63. [DOI] [PubMed] [Google Scholar]
- Gifford, R. , Kabat P., Martin J., Lynch C., and Tristem M.. 2005. Evolution and distribution of class II‐related endogenous retroviruses. J. Virol. 79:6478–6486. [DOI] [PMC free article] [PubMed] [Google Scholar]
- Gorbalenya, A. E. 2008. Genomics and evolution of the Nidovirales. Pp. 15–28 in Perlman S., Gallagher T., and Snijder E. J., eds. Nidoviruses. ASM Press, Washington , DC . [Google Scholar]
- Gould, E. A. , Coutard B., Malet H., Morin B., Jamal S., Weaver S., Gorbalenya A., Moureau G., Baronti C., Delogu I., et al 2010. Understanding the alphaviruses: recent research on important emerging pathogens and progress towards their control. Antivir. Res. 87:111–124. [DOI] [PMC free article] [PubMed] [Google Scholar]
- Grard, G. , Biek R., Muyembe Tamfum J.‐J., Fair J., Wolfe N., Formenty P., Paweska J., and Leroy E.. 2011. Emergence of divergent Zaire ebola virus strains in Democratic Republic of the Congo on 2007 and 2008. J. Infect. Dis. 204:S776–S784. [DOI] [PMC free article] [PubMed] [Google Scholar]
- Haddow, A. D. , Schuh A. J., Yasuda C. Y., Kasper M. R., Heang V., Huy R., Guzman H., Tesh R. B., and Weaver S. C.. 2012. Genetic characterization of Zika virus strains: geographic expansion of the Asian lineage. PLoS Negl. Trop. Dis. 6:e1477. [DOI] [PMC free article] [PubMed] [Google Scholar]
- Haffar, A. , Libeau G., Moussa A., Cécile M., and Diallo A.. 1999. The matrix protein gene sequence analysis reveals close relationship between peste des petits ruminants virus (PPRV) and dolphin morbillivirus. Virus Res. 64:69–75. [DOI] [PubMed] [Google Scholar]
- Harder, T. C. and Osterhaus A. D. M. E.. 1997. Canine distemper virus—a morbillivirus in search of new hosts? Trends Microbiol. 5:120–124. [DOI] [PubMed] [Google Scholar]
- Holmes, E. C. 2003. Molecular clocks and the puzzle of RNA virus origins. J. Virol. 77:3893–3897. [DOI] [PMC free article] [PubMed] [Google Scholar]
- Holmes, E. C. . 2008. Evolutionary history and phylogeography of human viruses. Annu. Rev. Microbiol. 62:307–328. [DOI] [PubMed] [Google Scholar]
- Holmes, E. C. . 2011. The evolution of endogenous viral elements. Cell Host Microbe 10:368–377. [DOI] [PMC free article] [PubMed] [Google Scholar]
- Holmes, E. C. , and Rambaut A.. 2004. Viral evolution and the emergence of SARS coronavirus. Philos. Trans. R. Soc. Lond. B 359:1059–1065. [DOI] [PMC free article] [PubMed] [Google Scholar]
- Jackson, A. P. , and Charleston M. A.. 2004. A cophylogenetic perspective of RNA‐virus evolution. Mol. Biol. Evol. 21:45–57. [DOI] [PubMed] [Google Scholar]
- Jermy, T. 1984. Evolution of insect/host plant relationships. Am. Nat. 124:609–630. [Google Scholar]
- Johnson, K. P. , Adams R. J., Page R. D. M., and Clayton D. H.. 2003. When do parasites fail to speciate in response to host speciation? Syst. Biol. 52:37–47. [DOI] [PubMed] [Google Scholar]
- Jones, E. K. , Patel N. G., Levy M. A., Storeygard A., Balk D., Gittleman J. L., and Daszak P.. 2008. Global trends in emerging infectious diseases. Nature 451:990–994. [DOI] [PMC free article] [PubMed] [Google Scholar]
- Kass, R. E. , and Raftery A. E.. 1995. Bayes factors. J. Am. Stat. Assoc. 90:773–795. [Google Scholar]
- Köndgen, S. , Kühl H., N'Goran P. K., Walsh P. D., Schenk S., Ernst N., Biek R., Formenty P., Mätz‐Rensing K., Schweiger B., et al 2008. Pandemic human viruses cause decline of endangered great apes. Curr. Biol. 18:260–264. [DOI] [PubMed] [Google Scholar]
- Krasnov, B. R. , Shenbrot G. I., Khokhlova I. S., and Poulin R.. 2004. Relationship between parasite abundance and the taxonomic distance among a parasite's host species: an example with fleas parasitic on small mammals. Int. J. Parasitol. 34:1289–1297. [DOI] [PubMed] [Google Scholar]
- Lambert, A. J. , and Lanciotti R. S.. 2008. Molecular characterization of medically imoprtant viruses of the genus Orthobunyavirus . J. Gen. Virol. 89:2580–2585. [DOI] [PubMed] [Google Scholar]
- Longdon, B. , Hadfield J. D., Webster C. L., Obbard D. J., and Jiggins F. M.. 2011. Host phylogeny determines viral persistence and replication in novel hosts. PLoS Pathog. 7:1–9. [DOI] [PMC free article] [PubMed] [Google Scholar]
- López, G. , López‐Parra M., Fernández L., Martínez‐Granados C., Martínez F., Meli M. L., Gil‐Sánchez J. M., Viqueira N., Díaz‐Portero M. A., et al 2009. Management measures to control a feline leukemia virus outbreak in the endangered Iberian lynx. Anim. Conserv. 12:173–182. [Google Scholar]
- MacLachlan, N. J. , and Guthrie A. J.. 2010. Re‐emergence of bluetongue, African horse sickness, and other Orbivirus diseases. Vet. Res. 41:35. [DOI] [PMC free article] [PubMed] [Google Scholar]
- May, F. J. , Davis C. T., Tesh R. B., and Barrett A. D. T.. 2011. Phylogeography of West Nile virus: from the cradle of evolution in Africa to Eurasia, Australia and the Americas. J. Virol. 85:2964–2974. [DOI] [PMC free article] [PubMed] [Google Scholar]
- Menken, S. B. J. 1996. Pattern and process in the evolution of insect‐plant associations: Yponomeuta as an example. Entomol. Exp. Appl. 80:297–305. [Google Scholar]
- Misra, U. K. , and Kalita J.. 2010. Overview: Japanese encephalitis. Prog. Neurobiol. 91:108–120. [DOI] [PubMed] [Google Scholar]
- Nunn, C. L. , and Alitzer S.. 2005. Global Mammal Parasite Database (GMPD). Available at http://www.mammalparasites.org.
- Nunn, C. L. , and Alitzer S.. 2005. The Global Mammal Parasite Database: an online resource for infectious disease records in wild primates. Evol. Anthropol. 14:1. [Google Scholar]
- Nunn, C. L. , Altizer S., Sechrest W., Jones K. E., Barton R. A., and Gittleman J. L.. 2004. Parasites and the evolutionary diversification of primate clades. Am. Nat. 164:S90–S103. [DOI] [PubMed] [Google Scholar]
- Ohishi, K. , Ando A., Suzuki R., Takishita K., Kawato M., Katsumata E., Ohtsu D., Okutsu K., Tokutake K., et al 2010. Host‐virus specificity of morbilliviruses predicted by structural modeling of the marine mammal SLAM, a receptor. Comp. Immunol. Microb. 33:227–241. [DOI] [PubMed] [Google Scholar]
- Percy, D. M. , Page R. D. M., and Cronk Q. C. B.. 2004. Plant‐insect interactions: double‐dating associated insect and plant lineages reveals asynchronous radiations. Syst. Biol. 53:120–127. [DOI] [PubMed] [Google Scholar]
- Perlman, S. J. and Jaenike J.. 2003. Infection success in novel hosts: an experimental and phylogenetic study of Drosophila‐parasitic nematodes. Evolution 57:544–557. [DOI] [PubMed] [Google Scholar]
- Poulin, R. 2005. Relative infection levels and taxonomic distances among the host species used by a parasite: insights into parasite specialization. Parasitology 130:109–115. [DOI] [PubMed] [Google Scholar]
- Poulin, R. , and Mouillot D.. 2003. Parasite specialization from a phylogenetic perspective: a new index of host specificity. Parasitology 126:473–480. [DOI] [PubMed] [Google Scholar]
- Poulin, R. , Krasnov B. R., and Mouillot D.. 2011. Host specificity in phylogenetic and geographic space. Trends Parasitol. 27:355–361. [DOI] [PubMed] [Google Scholar]
- Purse, B. V. , Mellor P. S., Rogers D. J., Samuel A. R., Mertens P. P. C., and Baylis M.. 2005. Climate change and the recent emergence of bluetongue in Europe. Nat. Rev. Microbiol. 3:171–181. [DOI] [PubMed] [Google Scholar]
- Roelke, M. E. , Brown M. A., Troyer J. L., Winterbach H., Winterbach C., Hemson G., Smith D., Johnson R. C., Pecon‐Slattery J., Roca A. L., et al 2009. Pathological manifestations of feline immunodeficiency virus (FIV) infection in wild African lions. Virology 390:1–12. [DOI] [PMC free article] [PubMed] [Google Scholar]
- Smith, A. W. , Skilling D. E., Cherry N., Mead J. H., and Matson D. O.. 1998. Calicivirus emergence from ocean reservoirs: zoonotic and interspecies movements. Emerg. Infect. Dis. 4:13–20. [DOI] [PMC free article] [PubMed] [Google Scholar]
- Sorenson, M. D. , Balakrishnan C. N., and Payne R. B.. 2004. Clade‐limited colonization in brood parasitic finches (Vidua spp.). Syst. Biol. 53:140–153. [DOI] [PubMed] [Google Scholar]
- Switzer, W. M. , Salemi M., Shanmugam V., Gao F., Cong M., Kuiken C., Bhullar V., Beer B. E., Vallet D., Gautier‐Hion A., et al 2005. Ancient co‐speciation of simian foamy viruses and primates. Nature 434:376–380. [DOI] [PubMed] [Google Scholar]
- Switzer, W. M. , Qari S. H., Wolfe N. D., Burke D. S., Folks T. M., and Heneine W.. 2006. Ancient origin and molecular features of the novel human T‐lymphotropic virus type 3 revealed by complete genome analysis. J. Virol. 80:7427–7438. [DOI] [PMC free article] [PubMed] [Google Scholar]
- Taylor, L. H. , Latham S. M., and Woolhouse M. E. J.. 2001. Risk factors for human disease emergence. Philos. Trans. R. Soc. Lond. B 356:983–989. [DOI] [PMC free article] [PubMed] [Google Scholar]
- Tinsley, M. C. , and Majerus M. E. N.. 2007. Small steps or giant leaps for male‐killers? Phylogenetic constraints to male‐killer host shifts. BMC Evol. Biol. 7:238. [DOI] [PMC free article] [PubMed] [Google Scholar]
- Tryland, M. , Sandvik T., Arnemo J. M., Stuve G., Olsvik O., and Traavik T.. 1998. Antibodies against orthopoxviruses in wild carnivores from Fennoscandia. J. Wildl. Dis. 34:443–450. [DOI] [PubMed] [Google Scholar]
- Tully, D. C. , and Fares M. A.. 2008. The tale of a modern animal plague: tracing the evolutionary history and determining the time‐scale for foot and mouth disease virus. Virology 382:250–256. [DOI] [PubMed] [Google Scholar]
- Van Brussel, M. V. , Salemi M., Liu H.‐F., Goubau P., Desmyter J., and Vandamme A.M.. 1999. The discovery of two new divergent STLVs has implications for the evolution and epidemiology of HTLVs. Rev. Med. Virol. 9:155–170. [DOI] [PubMed] [Google Scholar]
- Van Regenmortel, M. H. V. 2011. Virus species. Pp. 3–20 in Tibayreng M., ed. Genetics and evolution of infectious diseases. Elsevier, London . [Google Scholar]
- Volk, S. M. , Chen R., Tsetsarkin K. A., Adams A. P., Garcia T. I., Sall A. A., Nasar F., Schuh A. J., Holmes E. C., Higgs S., et al 2010. Genome‐scale phylogenetic analyses of Chikungunya virus reveal independent emergences of recent epidemics and various evolutionary rates. J. Virol. 84:6497–6504. [DOI] [PMC free article] [PubMed] [Google Scholar]
- Weaver, S. C. , and Vasilakis N.. 2009. Molecular evolution of dengue viruses: contributions of phylogenetics to understanding the history and epidemiology of the preeminent arboviral disease. Infect. Genet. Evol. 9:523–540. [DOI] [PMC free article] [PubMed] [Google Scholar]
- Web of Knowledge . 2012. Thompson Reuters. Available at http://apps.webofknowledge.com
- Webster, R. G. , Bean W. J., Gorman O. T., Chambers T. M., and Kawaoka Y.. 1992. Evolution and ecology of influenza A virus. Microbiol. Rev. 56:152–179. [DOI] [PMC free article] [PubMed] [Google Scholar]
- Wertheim, J. O. , and Kosakovsky Pond S. L.. 2011. Purifying selection can obscure the ancient age of viral lineages. Mol. Biol. Evol. 28:3355–3365. [DOI] [PMC free article] [PubMed] [Google Scholar]
- Wertheim, J. O. , and Worobey M.. 2007. A challenge to the ancient origin of SIVagm based on African green monkey mitochondrial genomes. PLoS Pathog. 3:e95. [DOI] [PMC free article] [PubMed] [Google Scholar]
- Wertheim, J. O. , and Worobey M.. 2009. Dating the age of the SIV lineages that gave rise to HIV‐1 and HIV‐2. PLoS Comput. Biol. 5:e1000377. [DOI] [PMC free article] [PubMed] [Google Scholar]
- Woolhouse, M. E. J. , and Gowtage‐Sequeria S.. 2005. Host range and emerging and reemerging pathogens. Emerg. Infect. Dis. 11:1842–1847. [DOI] [PMC free article] [PubMed] [Google Scholar]
- Woolhouse, M. E. J. , Taylor L. H., and Haydon D. T.. 2001. Population biology of multihost pathogens. Science 292:1109–1111. [DOI] [PubMed] [Google Scholar]
- Wyde, P. R. , Stittelaar K. J., Osterhaus A. D. M. E., Guzman E., and Gilbert B. E.. 2000. Use of cotton rats for preclinical evaluation of measles vaccines. Vaccine 19:42–53. [DOI] [PubMed] [Google Scholar]
- Xu, J. , Davis C. T., Christman M. C., Rivailler P., Zhong H., Donis R. O., and Lu G.. 2012. Evolutionary history and phylodynamics of Influenza A and B neuroaminidase (NA) genes inferred from large‐scale sequence analysis. PLoS One 7:e38665. [DOI] [PMC free article] [PubMed] [Google Scholar]
- Yakondo, E. N. , Gribaldo S., Finance C., Le Faou A., and Rihn B. H.. 2007. Molecular characterization of African orthobunyaviruses. J. Gen. Virol. 88:1761–1766. [DOI] [PubMed] [Google Scholar]
Associated Data
This section collects any data citations, data availability statements, or supplementary materials included in this article.
Supplementary Materials
Table S1. Recorded mammal hosts of RNA viruses, as used in this study.
Text S1. Matlab program for data simulation.
Figure S1. Variance among the simulated HSD statistics, otherwise annotated as for Figure 2.
Figure S2. Skewness among the simulated HSD statistics, otherwise annotated as for Figure 2.
Figure S3. Kurtosis among the simulated HSD statistics, otherwise annotated as for Figure 2.
Figure S4. Prediction error for model parameter β (eq. 2) determined using an approximate Bayesian computation cross‐validation procedure (Csilléry 2012) for simulated host switches on the phylogenies of primates (A), carnivores (B), and ungulates (C).
Supporting info item