

Abstract
Background
About one‐third of women have urinary incontinence (UI) and up to one‐tenth have faecal incontinence (FI) after childbirth. Pelvic floor muscle training (PFMT) is commonly recommended during pregnancy and after birth for both preventing and treating incontinence.
This is an update of a Cochrane Review previously published in 2017.
Objectives
To assess the effects of PFMT for preventing or treating urinary and faecal incontinence in pregnant or postnatal women, and summarise the principal findings of relevant economic evaluations.
Search methods
We searched the Cochrane Incontinence Specialised Register, which contains trials identified from the Cochrane Central Register of Controlled Trials (CENTRAL), MEDLINE, MEDLINE In‐Process, MEDLINE Epub Ahead of Print, CINAHL, ClinicalTrials.gov, WHO ICTRP, and handsearched journals and conference proceedings (searched 7 August 2019), and the reference lists of retrieved studies.
Selection criteria
We included randomised or quasi‐randomised trials in which one arm included PFMT. Another arm was no PFMT, usual antenatal or postnatal care, another control condition, or an alternative PFMT intervention.
Populations included women who, at randomisation, were continent (PFMT for prevention) or incontinent (PFMT for treatment), and a mixed population of women who were one or the other (PFMT for prevention or treatment).
Data collection and analysis
We independently assessed trials for inclusion and risk of bias. We extracted data and assessed the quality of evidence using GRADE.
Main results
We included 46 trials involving 10,832 women from 21 countries. Overall, trials were small to moderately‐sized. The PFMT programmes and control conditions varied considerably and were often poorly described. Many trials were at moderate to high risk of bias. Two participants in a study of 43 pregnant women performing PFMT for prevention of incontinence withdrew due to pelvic floor pain. No other trials reported any adverse effects of PFMT.
Prevention of UI: compared with usual care, continent pregnant women performing antenatal PFMT probably have a lower risk of reporting UI in late pregnancy (62% less; risk ratio (RR) 0.38, 95% confidence interval (CI) 0.20 to 0.72; 6 trials, 624 women; moderate‐quality evidence). Antenatal PFMT slightly decreased the risk of UI in the mid‐postnatal period (more than three to six months' postpartum) (29% less; RR 0.71, 95% CI 0.54 to 0.95; 5 trials, 673 women; high‐quality evidence). There was insufficient information available for the late postnatal period (more than six to 12 months) to determine effects at this time point (RR 1.20, 95% CI 0.65 to 2.21; 1 trial, 44 women; low‐quality evidence).
Treatment of UI: compared with usual care, there is no evidence that antenatal PFMT in incontinent women decreases incontinence in late pregnancy (very low‐quality evidence), or in the mid‐(RR 0.94, 95% CI 0.70 to 1.24; 1 trial, 187 women; low‐quality evidence), or late postnatal periods (very low‐quality evidence). Similarly, in postnatal women with persistent UI, there is no evidence that PFMT results in a difference in UI at more than six to 12 months postpartum (RR 0.55, 95% CI 0.29 to 1.07; 3 trials; 696 women; low‐quality evidence).
Mixed prevention and treatment approach to UI: antenatal PFMT in women with or without UI probably decreases UI risk in late pregnancy (22% less; RR 0.78, 95% CI 0.64 to 0.94; 11 trials, 3307 women; moderate‐quality evidence), and may reduce the risk slightly in the mid‐postnatal period (RR 0.73, 95% CI 0.55 to 0.97; 5 trials, 1921 women; low‐quality evidence). There was no evidence that antenatal PFMT reduces the risk of UI at late postpartum (RR 0.85, 95% CI 0.63 to 1.14; 2 trials, 244 women; moderate‐quality evidence). For PFMT started after delivery, there was uncertainty about the effect on UI risk in the late postnatal period (RR 0.88, 95% CI 0.71 to 1.09; 3 trials, 826 women; moderate‐quality evidence).
Faecal incontinence: eight trials reported FI outcomes. In postnatal women with persistent FI, it was uncertain whether PFMT reduced incontinence in the late postnatal period compared to usual care (very low‐quality evidence). In women with or without FI, there was no evidence that antenatal PFMT led to a difference in the prevalence of FI in late pregnancy (RR 0.64, 95% CI 0.36 to 1.14; 3 trials, 910 women; moderate‐quality evidence). Similarly, for postnatal PFMT in a mixed population, there was no evidence that PFMT reduces the risk of FI in the late postnatal period (RR 0.73, 95% CI 0.13 to 4.21; 1 trial, 107 women, low‐quality evidence).
There was little evidence about effects on UI or FI beyond 12 months' postpartum. There were few incontinence‐specific quality of life data and little consensus on how to measure it.
Authors' conclusions
This review provides evidence that early, structured PFMT in early pregnancy for continent women may prevent the onset of UI in late pregnancy and postpartum. Population approaches (recruiting antenatal women regardless of continence status) may have a smaller effect on UI, although the reasons for this are unclear. A population‐based approach for delivering postnatal PFMT is not likely to reduce UI. Uncertainty surrounds the effects of PFMT as a treatment for UI in antenatal and postnatal women, which contrasts with the more established effectiveness in mid‐life women.
It is possible that the effects of PFMT might be greater with targeted rather than mixed prevention and treatment approaches, and in certain groups of women. Hypothetically, for instance, women with a high body mass index (BMI) are at risk of UI. Such uncertainties require further testing and data on duration of effect are also needed. The physiological and behavioural aspects of exercise programmes must be described for both PFMT and control groups, and how much PFMT women in both groups do, to increase understanding of what works and for whom.
Few data exist on FI and it is important that this is included in any future trials. It is essential that future trials use valid measures of incontinence‐specific quality of life for both urinary and faecal incontinence. In addition to further clinical studies, economic evaluations assessing the cost‐effectiveness of different management strategies for FI and UI are needed.
Keywords: Female, Humans, Pregnancy, Exercise Therapy, Exercise Therapy/methods, Fecal Incontinence, Fecal Incontinence/epidemiology, Fecal Incontinence/prevention & control, Fecal Incontinence/therapy, Pelvic Floor, Postnatal Care, Pregnancy Complications, Pregnancy Complications/epidemiology, Pregnancy Complications/prevention & control, Pregnancy Complications/therapy, Prenatal Care, Puerperal Disorders, Puerperal Disorders/epidemiology, Puerperal Disorders/prevention & control, Puerperal Disorders/therapy, Randomized Controlled Trials as Topic, Urinary Incontinence, Urinary Incontinence/epidemiology, Urinary Incontinence/prevention & control, Urinary Incontinence/therapy
Plain language summary
How effective is pelvic floor muscle training undertaken during pregnancy or after birth for preventing or treating incontinence?
Review question
To assess whether performing pelvic floor muscle training (PFMT) during pregnancy or after birth reduces incontinence.
Background
More than one‐third of women experience unintentional (involuntary) loss of urine (urinary incontinence) in the second and third trimesters of pregnancy, and about one‐third leak urine in the first three months after giving birth. About one‐quarter of women have some involuntary loss of flatus (wind) or faeces (anal incontinence) in late pregnancy, and one‐fifth leak flatus or faeces one year after birth. Managing incontinence after pregnancy is not only important for the individuals themselves but can also have considerable costs to individuals and for healthcare systems.
PFMT is commonly recommended by health professionals during pregnancy and after birth to prevent and treat incontinence. The muscles are strengthened and kept strong with regular PFMT. Muscles are contracted several times in a row, more than once a day, several days a week and continued indefinitely.
How up‐to‐date is this review?
The evidence is current to 7 August 2019.
Study characteristics
We included 46 trials involving 10,832 women from 21 countries. The studies included pregnant women or women who had delivered their baby within the last three months, and who reported leakage of urine, faeces, both urine or faeces, or no leakage. They were allocated randomly to receive PFMT (either to try to prevent incontinence or as a treatment for incontinence) or not, and the effects were compared.
Study funding sources
Twenty‐five studies were publicly funded, one of which received grants from both public and private sources. Three studies received no funding and 18 did not declare their funding sources.
Key results
Pregnant women without urine leakage who did PFMT to prevent leakage: women probably report less urine leakage in late pregnancy and the risk is slightly less at three to six months after childbirth. There was not enough information to determine whether these effects continued beyond the first year after the baby's birth.
Women with urine leakage, pregnant or after birth, who did PFMT as a treatment: there is no evidence that doing PFMT during pregnancy reduced leakage in late pregnancy or in the year following childbirth.
Women with or without urine leakage (mixed group), pregnant or after birth, who did PFMT to either prevent or treat leakage: women who began exercising during pregnancy probably have slightly less leakage in late pregnancy which may continue up to six months after birth. There is no evidence of effect at one year following birth. For women who started exercising after delivery, the effect on leakage one year after birth was uncertain.
Leakage of faeces: only eight studies had evidence about leakage of faeces. One year after delivery, it was uncertain if PFMT helped decrease leakage of faeces in women who started exercising following childbirth. For women with or without leakage of faeces (mixed group) who started PFMT while pregnant, there was no evidence of a difference in faeces leakage in late pregnancy; for those who started PFMT after delivery there was no evidence of a decrease in leakage up to one year after birth.
There was little information about how PFMT may affect leakage‐related quality of life. There were two reports of pelvic floor pain but no other harmful effects of PFMT were noted.
There was no evidence about whether or not PFMT was cost‐effective.
Quality of the evidence
Overall, studies were small and most had design problems, including limited details on how women were randomly allocated into groups and poor reporting of measurements. Some of the problems were expected because it was impossible to blind health professionals or women to whether they were exercising or not. The PFMT differed considerably between studies and was often poorly described. The quality of the evidence was generally low to moderate.
Summary of findings
Summary of findings 1. Antenatal pelvic floor muscle training compared to control for prevention of urinary and faecal incontinence.
| Antenatal pelvic floor muscle training compared to control for prevention of urinary and faecal incontinence | ||||||
|
Patient or population: pregnant women who were continent when randomised Setting: hospital or outpatient settings in Canada, Italy, Mexico, Norway, Spain, Thailand, Turkey, UK and USA Intervention: antenatal PFMT Comparison: control (no PFMT or usual care) | ||||||
| Outcomes | Anticipated absolute effects* (95% CI) | Relative effect (95% CI) | No of participants (studies) | Quality of the evidence (GRADE) | Comments | |
| Risk with control | Risk with antenatal PFMT | |||||
| Urinary incontinence in late pregnancy | 421 per 1000 | 160 per 1000 (84 to 303) | RR 0.38 (0.20 to 0.72) | 624 (6 RCTs) | ⊕⊕⊕⊝ MODERATE1 | |
| Urinary incontinence mid‐postnatal period (> 3 to 6 months) | 251 per 1000 | 179 per 1000 (136 to 239) | RR 0.71 (0.54 to 0.95) | 673 (5 RCTs) | ⊕⊕⊕⊕ HIGH | |
| Urinary incontinence late postnatal period (> 6 to 12 months) | 440 per 1000 | 528 per 1000 (286 to 972) | RR 1.20 (0.65 to 2.21) | 44 (1 RCT) | ⊕⊝⊝⊝ LOW2 | |
| Faecal incontinence in late pregnancy | ‐ | ‐ | ‐ | (0 studies) | ‐ | Not reported. |
| Faecal incontinence mid‐postnatal period (> 3 to 6 months) | ‐ | ‐ | ‐ | (0 studies) | ‐ | Not reported. |
| Faecal incontinence late postnatal period (> 6 to 12 months) | ‐ | ‐ | ‐ | (0 studies) | ‐ | Not reported. |
| Urinary incontinence‐specific quality of life (ICIQ‐SF) Scale from: 0 to 10 (higher worse) | Mean 2.66, SD 4.1 | Mean 0.24, SD 1.2 | MD 2.42 lower (3.32 lower to 1.52 lower) | 152 (1 RCT) | ⊕⊕⊕⊝ MODERATE3 | Measured in the late postnatal period (> 6 to 12 months). Upper and lower limits of the CI of summary statistic suggest clinical importance in ICIQ‐SF (Nyström 2015). |
| Faecal incontinence‐specific quality of life | ‐ | ‐ | ‐ | (0 studies) | ‐ | Not reported. |
| Adverse events | ‐ | ‐ | ‐ | ‐ | ‐ | No events reported. |
| *The risk in the intervention group (and its 95% confidence interval) is based on the assumed risk in the comparison group and the relative effect of the intervention (and its 95% CI). CI: confidence interval; ICIQ‐SF: International Consultation on Incontinence‐Short Form; MD: mean difference; PFMT: pelvic floor muscle training; RCT: randomised controlled trial; RR: risk ratio; SD: standard deviation. | ||||||
| GRADE Working Group grades of evidence High quality: further research is very unlikely to change our confidence in the estimate of effect. Moderate quality: further research is likely to have an important impact on our confidence in the estimate of effect and may change the estimate. Low quality: further research is very likely to have an important impact on our confidence in the estimate of effect and is likely to change the estimate. Very low quality: we are very uncertain about the estimate. | ||||||
1Downgraded one level for serious inconsistency (substantial statistically significant heterogeneity; I² = 78%).
2Downgraded two levels for very serious imprecision (single, small trial with wide confidence interval, including benefit no effect, and possible harm).
3Downgraded one level for serious imprecision (single trial, fewer than 400 participants).
The outcome measures relate to the presence of incontinence symptoms rather than absence. Symptoms of urinary and faecal incontinence were measured based on self‐report.
Summary of findings 2. Antenatal pelvic floor muscle training compared to control for treatment of urinary and faecal incontinence.
| Antenatal pelvic floor muscle training compared to control for treatment of urinary and faecal incontinence | ||||||
|
Patient or population: pregnant women who were incontinent when randomised Setting: health services or obstetric clinics in Brazil, Canada, the Netherlands and Turkey Intervention: antenatal PFMT Comparison: control (usual care) | ||||||
| Outcomes | Anticipated absolute effects* (95% CI) | Relative effect (95% CI) | No of participants (studies) | Quality of the evidence (GRADE) | Comments | |
| Risk with control | Risk with antenatal PFMT | |||||
| Urinary incontinence in late pregnancy | 776 per 1000 | 543 per 1000 (341 to 877) | RR 0.70 (0.44 to 1.13) | 345 (3 RCTs) | ⊕⊝⊝⊝ VERY LOW1,2,3 | |
| Urinary incontinence mid‐postnatal period (> 3‐6 months) | 528 per 1000 | 496 per 1000 (369 to 654) | RR 0.94 (0.70 to 1.24) | 187 (1 RCT) | ⊕⊕⊝⊝ LOW4,5 | |
| Urinary incontinence late postnatal period (> 6‐12 months) | 232 per 1000 | 116 per 1000 (30 to 448) | RR 0.50 (0.13 to 1.93) | 869 (2 RCTs) | ⊕⊝⊝⊝ VERY LOW6,7,8 | |
| Faecal incontinence in late pregnancy | ‐ | ‐ | ‐ | (0 studies) | ‐ | Not reported. |
| Faecal incontinence mid‐postnatal period (> 3‐6 months) | ‐ | ‐ | ‐ | (0 studies) | ‐ | Not reported. |
| Faecal incontinence late postnatal period (> 6‐12 months) | ‐ | ‐ | ‐ | (0 studies) | ‐ | Not reported. |
| Urinary incontinence‐specific quality of life (ICIQ‐SF) Scale from: 0 to 10 (higher worse) | Mean 4.7, SD 5.6 | Mean 1.2, SD 2.5 | MD 3.5 lower (6.13 lower to 0.87 lower) | 41 (1 RCT) | ⊕⊕⊕⊝ MODERATE9 | Measured in late pregnancy. MD suggests clinically important effect but the upper limit of the CI is close to no effect. |
| Faecal incontinence‐specific quality of life | ‐ | ‐ | ‐ | (0 studies) | ‐ | Not reported. |
| Adverse events | ‐ | ‐ | ‐ | ‐ | ‐ | No events reported. |
| *The risk in the intervention group (and its 95% confidence interval) is based on the assumed risk in the comparison group and the relative effect of the intervention (and its 95% CI). CI: confidence interval; ICIQ‐SF: International Consultation on Incontinence‐Short Form; MD: mean difference; PFMT: pelvic floor muscle training; RCT: randomised controlled trial; RR: risk ratio; SD: standard deviation. | ||||||
| GRADE Working Group grades of evidence High quality: further research is very unlikely to change our confidence in the estimate of effect. Moderate quality: further research is likely to have an important impact on our confidence in the estimate of effect and may change the estimate. Low quality: further research is very likely to have an important impact on our confidence in the estimate of effect and is likely to change the estimate. Very low quality: we are very uncertain about the estimate. | ||||||
1Downgraded one level due to serious risk of bias (one trial with heavy weighting in the pooled estimate at high risk).
2 Downgraded one level for inconsistency (substantial statistically significant heterogeneity; I² = 71%).
3 Downgraded one level for imprecision (fewer than 400 participants, wide confidence interval).
4Downgraded one level due to serious risk of bias.
5Downgraded one level for imprecision (single trial, fewer than 400 participants).
6Downgraded one level due to very serious risk of bias.
7Downgraded one level for inconsistency (considerable statistically significant heterogeneity; I² = 94%).
8Downgraded one level for imprecision (wide confidence interval).
9Downgraded one level due to serious imprecision (single trial, fewer than 400 participants, wide confidence interval).
The outcome measures relate to the presence of incontinence symptoms rather than absence. As this comparison addresses the effect of PFMT for treatment of existing continence symptoms, the data are "negative," that is continuing incontinence rather than cure. Symptoms of urinary and faecal incontinence were measured based on self‐report.
Summary of findings 3. Antenatal pelvic floor muscle training compared to control for mixed prevention and treatment of urinary and faecal incontinence.
| Antenatal pelvic floor muscle training compared to control for mixed prevention and treatment of urinary and faecal incontinence | ||||||
|
Patient or population: pregnant women, some of who were incontinent symptoms and some who were not when randomised Setting: health services, obstetric clinics or hospitals in Brazil, Canada, China, France, Italy, Norway, Poland, UK or USA Intervention: antenatal PFMT Comparison: control (no PFMT, usual care or unspecified control) | ||||||
| Outcomes | Anticipated absolute effects* (95% CI) | Relative effect (95% CI) | No of participants (studies) | Quality of the evidence (GRADE) | Comments | |
| Risk with control | Risk with antenatal PFMT | |||||
| Urinary incontinence in late pregnancy | 565 per 1000 | 441 per 1000 (361 to 531) | RR 0.78 (0.64 to 0.94) | 3307 (11 RCTs) | ⊕⊕⊕⊝ MODERATE1 | RR suggests clinically important effect but the upper limit of the CI suggests lack of clinical importance. The substantial statistically significant heterogeneity is more likely due to imprecision in estimating the magnitude, rather than direction of effect, because the upper and lower limits of the CI suggest benefit. |
| Urinary incontinence mid‐postnatal period (> 3 to 6 months) | 363 per 1000 | 265 per 1000 (200 to 352) | RR 0.73 (0.55 to 0.97) | 1921 (5 RCTs) | ⊕⊝⊝⊝ LOW2,3 | RR suggests clinically important effect but the upper limit of the CI suggests lack of clinical importance. |
| Urinary incontinence late postnatal period (> 6 to 12 months) | 448 per 1000 | 381 per 1000 (282 to 511) | RR 0.85 (0.63 to 1.14) | 244 (2 RCTs) | ⊕⊕⊕⊝ MODERATE4 | |
| Faecal incontinence in late pregnancy | 59 per 1000 | 38 per 1000 (21 to 67) | RR 0.64 (0.36 to 1.14) | 910 (3 RCTs) | ⊕⊕⊕⊝ MODERATE5 | |
| Faecal incontinence mid‐postnatal period (> 3 to 6 months) | ‐ | ‐ | ‐ | (0 studies) | ‐ | Not reported. |
| Faecal incontinence late postnatal period (> 6 to 12 months) | ‐ | ‐ | ‐ | (0 studies) | ‐ | Not reported. |
| Urinary incontinence‐specific quality of life (ICIQ‐SF) Scale from: 0 to 10 (higher worse) | Mean 2.1, SD 3.3 | Mean 1.9, SD 3.7 | MD 0.20 lower (1.2 lower to 0.80 higher) | 190 (1 RCT) | ⊕⊕⊕⊝ MODERATE6 | Measured in the late postnatal period (> 6 to 12 months). MD and CI suggest lack of clinically important effect. |
|
Faecal incontinence‐specific quality of life (CRAIQ‐7) 7 items (higher score worse) |
Mean 5, SD 11.7 | Mean 2.4, SD 11.3 | MD 2.60 lower (7.84 lower to 2.64 higher) | 74 (1 RCT) |
⊕⊕⊝⊝ LOW7,8 | Measured in the early postnatal period (0 to 3 months). |
| Adverse events | ‐ | ‐ | ‐ | ‐ | ‐ | No events reported. |
| *The risk in the intervention group (and its 95% confidence interval) is based on the assumed risk in the comparison group and the relative effect of the intervention (and its 95% CI). CI: confidence interval; CRAIQ‐7: Colorectal‐Anal Impact Questionnaire; ICIQ‐SF: International Consultation on Incontinence‐Short Form; MD: mean difference; PFMT: pelvic floor muscle training; RCT: randomised controlled trial; RR: risk ratio; SD: standard deviation. | ||||||
| GRADE Working Group grades of evidence High quality: further research is very unlikely to change our confidence in the estimate of effect. Moderate quality: further research is likely to have an important impact on our confidence in the estimate of effect and may change the estimate. Low quality: further research is very likely to have an important impact on our confidence in the estimate of effect and is likely to change the estimate. Very low quality: we are very uncertain about the estimate. | ||||||
1Downgraded one level due to serious inconsistency (substantial statistically significant heterogeneity; I² = 79%).
2Downgraded one level due to serious risk of selection bias (no information about random allocation concealment in three trials carrying more than 50% of weighting in the pooled estimate).
3Downgraded one level for serious imprecision (substantial statistically significant heterogeneity; I² = 65%).
4 Downgraded one level due to serious imprecision (fewer than 400 participants, wide CI).
5Downgraded one level due to serious imprecision (wide CI that includes appreciable harm and appreciable benefit).
6Downgraded one level due to serious imprecision (fewer than 400 participants, wide CI).
7Downgraded one level due to serious risk of attrition bias.
8Downgraded one level due to serious imprecision (single trial, fewer than 400 participants, wide CI).
The outcome measures relate to the presence of incontinence symptoms rather than absence. For those comparisons that addressed the effect of PFMT for treatment of existing continence symptoms, the data were "negative," that is continuing incontinence rather than cure. Symptoms of urinary and faecal incontinence were measured based on self‐report.
Summary of findings 4. Postnatal pelvic floor muscle training compared to control for treatment of urinary and faecal incontinence.
| Postnatal pelvic floor muscle training compared to control for treatment of urinary and faecal incontinence | ||||||
|
Patient or population: postnatal women who were incontinent when randomised Setting: health services or obstetric clinics in Canada, Republic of Korea, New Zealand and UK Intervention: postnatal PFMT Comparison: control (no PFMT or usual care) | ||||||
| Outcomes | Anticipated absolute effects* (95% CI) | Relative effect (95% CI) | No of participants (studies) | Quality of the evidence (GRADE) | Comments | |
| Risk with control | Risk with postnatal PFMT | |||||
| Urinary incontinence late postnatal period (> 6 to 12 months) | 724 per 1000 | 398 per 1000 (210 to 775) | RR 0.55 (0.29 to 1.07) | 696 (3 RCTs) | ⊕⊕⊝⊝ LOW1,2 | |
| Faecal incontinence late postnatal period (> 6 to 12 months) | 137 per 1000 | 93 per 1000 (33 to 266) | RR 0.68 (0.24 to 1.94) | 620 (2 RCTs) | ⊕⊝⊝⊝ VERY LOW3,4,5 | |
|
Urinary incontinence‐specific quality of life
(BFLUTS) 34 items (higher score worse) |
Mean 21.22, SD 2.11 | Mean 19.56, SD 1.88 | MD 1.66 lower (3.51 lower to 0.19 higher) | 18 (1 RCT) | ⊕⊕⊝⊝ LOW6,7 | Measured at 8 weeks' post‐treatment |
| Faecal incontinence‐specific quality of life | ‐ | ‐ | ‐ | (0 studies) | ‐ | Not reported |
| Adverse events | ‐ | ‐ | ‐ | ‐ | ‐ | No events reported. |
| *The risk in the intervention group (and its 95% confidence interval) is based on the assumed risk in the comparison group and the relative effect of the intervention (and its 95% CI). BFLUTS: British Female Lower Urinary Tract Symptoms questionnaire; CI: confidence interval; MD: mean difference; PFMT: pelvic floor muscle training; RCT: randomised controlled trial; RR: risk ratio; SD: standard deviation. | ||||||
| GRADE Working Group grades of evidence High quality: further research is very unlikely to change our confidence in the estimate of effect. Moderate quality: further research is likely to have an important impact on our confidence in the estimate of effect and may change the estimate. Low quality: further research is very likely to have an important impact on our confidence in the estimate of effect and is likely to change the estimate. Very low quality: we are very uncertain about the estimate. | ||||||
1Downgraded one level due to very serious risk of bias (two trials with 90% of weighting in pooled estimate at high risk).
2Downgraded one level for inconsistency (considerable statistically significant heterogeneity; I² = 90%).
3Downgraded one level due to very serious risk of bias (two trials with 100% of weighting in pooled estimate at high risk).
4Downgraded one level for inconsistency (substantial statistically significant heterogeneity; I² = 74%).
5Downgraded one level for imprecision (wide confidence interval, with appreciable harm and appreciable benefit).
6Downgraded one level due to very serious risk of selection bias.
7Downgraded one level for imprecision (fewer than 400 participants, wide CI).
The outcome measures relate to the presence of incontinence symptoms rather than absence. As this comparison addresses the effect of PFMT for treatment of existing continence symptoms, the data are "negative," that is continuing incontinence rather than cure. Symptoms of urinary and faecal incontinence were measured based on self‐report.
Summary of findings 5. Postnatal pelvic floor muscle training compared to control for mixed prevention and treatment of urinary and faecal incontinence.
| Postnatal pelvic floor muscle training compared to control for mixed prevention and treatment of urinary and faecal incontinence | ||||||
|
Patient or population: postnatal women some of whom had incontinent symptoms and some of whom had not when randomised Setting: health services or hospitals in Australia, Brazil, Canada, China and Switzerland Intervention: postnatal PFMT Comparison: control (no PFMT or usual care) | ||||||
| Outcomes | Anticipated absolute effects* (95% CI) | Relative effect (95% CI) | No of participants (studies) | Quality of the evidence (GRADE) | Comments | |
| Risk with control | Risk with postnatal PFMT | |||||
| Urinary incontinence late postnatal period (> 6 to 12 months) | 294 per 1000 | 212 per 1000 (115 to 400) | RR 0.88 (0.71 to 1.09) | 826 (3 RCTs) | ⊕⊕⊕⊝ MODERATE1 | |
| Faecal incontinence late postnatal period (> 6 to 12 months) | 54 per 1000 | 39 per 1000 (7 to 226) | RR 0.73 (0.13 to 4.21) | 107 (1 RCT) | ⊕⊕⊝⊝ LOW2,3 | |
|
Urinary incontinence‐specific quality of life (IIQ‐7) Scale from: 0 to 100 (higher worse) |
Mean 3.2, SD 8.4 | Mean 3.7, SD 5.6 | MD 0.50 higher (5.53 lower to 6.53 higher) | 23 (1 RCT) | ⊕⊕⊝⊝ LOW4,5 | Measured after the 16 week intervention. |
|
Faecal incontinence‐specific quality of life (FIQOL scale) 29 items, 4 domain scores, each item scored 1‐5 (higher better) |
‐ | ‐ | ‐ | 170 (2 RCTs) |
‐ | Measured at 3 months' postpartum. There were no reported differences between the groups in either study. |
| Adverse events | ‐ | ‐ | ‐ | ‐ | ‐ | No events reported. |
| *The risk in the intervention group (and its 95% confidence interval) is based on the assumed risk in the comparison group and the relative effect of the intervention (and its 95% CI). CI: confidence interval; FIQOL: Faecal incontinence quality of life; PFMT: pelvic floor muscle training; RCT: randomised controlled trial; RR: risk ratio. | ||||||
| GRADE Working Group grades of evidence High quality: further research is very unlikely to change our confidence in the estimate of effect. Moderate quality: further research is likely to have an important impact on our confidence in the estimate of effect and may change the estimate. Low quality: further research is very likely to have an important impact on our confidence in the estimate of effect and is likely to change the estimate. Very low quality: we are very uncertain about the estimate. | ||||||
1Downgraded one level due to inconsistency (substantial statistically significant heterogeneity; I² = 75%).
2Downgraded one level due to serious risk of selection bias.
3Downgraded one level for imprecision (fewer than 400 participants, wide CI).
4Downgraded one level due to serious risk of selection bias.
5Downgraded one level for imprecision (fewer than 400 participants, wide CI).
The outcome measures relate to the presence of incontinence symptoms rather than absence. For those comparisons that address the effect of PFMT for treatment of existing continence symptoms, the data are "negative," that is continuing incontinence rather than cure. Symptoms of urinary and faecal incontinence were measured based on self‐report.
Background
Description of the condition
Accumulating epidemiological evidence suggests that women who have had a baby are at increased risk of developing urinary incontinence (UI). It seems that both pregnancy and delivery are risk factors (Foldspang 1999; Milsom 2017; Rortveit 2003a; Rortveit 2003b; Viktrup 2006). Similarly, these women seem to be at greater risk of faecal incontinence (FI), particularly those who have had vaginal deliveries (Eason 2002; MacArthur 2001; Pollack 2004; Sultan 1999).
Urinary incontinence (UI)
Urinary incontinence (involuntary leakage of urine) is a common problem amongst adults living in the community (Milsom 2017). It is more frequent in women, and pregnancy or the postnatal period may be the first time many women experience UI. Stress urinary incontinence (involuntary urine leakage with physical exertion) and urgency urinary incontinence (involuntary leakage associated with, or immediately following, a sudden compelling need to void) are the two most common types of urine leakage in women. Many women have symptoms of both stress and urgency urinary incontinence. This is called mixed urinary incontinence. Of these types, stress urinary incontinence is most commonly associated with pregnancy and the postnatal period, although there is a small but significant increase in risk of urgency urinary incontinence (Milsom 2017).
It seems that the prevalence of UI increases during pregnancy (particularly in the second trimester) and then gradually decreases during the first postpartum year (Milsom 2017). Variation is evident in prevalence estimates of all types of UI during pregnancy, but this may be as high as 58%, with stress urinary incontinence affecting about 31% of nulliparous women and 42% of parous women (Wesnes 2007). The prevalence of persistent UI in the first three months following delivery is approximately 30% (Thom 2010).
Findings from moderate‐ to large‐sized cohorts of women suggest that factors associated with a greater risk of postpartum UI are: parity (Milsom 2017); higher maternal body mass index (BMI) (Durnea 2017; Gyhagen 2013; Pizzoferrato 2014; Quiboeuf 2016; Svare 2014); age (Quiboeuf 2016); UI before or during pregnancy (Durnea 2017; Gartland 2016; Pizzoferrato 2014; Svare 2014); vaginal delivery (Gartland 2016; Gyhagen 2013); operative vaginal deliveries or perineal or anal sphincter trauma (Durnea 2017; Gartland 2012; Svare 2014); high birthweight of the baby (Gyhagen 2013; Pizzoferrato 2014; Wesnes 2017). These associations have been observed anywhere between four to six months' postpartum through to 12 to 20 years following first delivery (Gartland 2012; Gyhagen 2013; Pizzoferrato 2014; Wesnes 2017).
There are significant healthcare resource implications associated with the management of UI. Coyne 2014 estimated the costs of stress urinary incontinence in the American healthcare system and found that the average annual direct medical cost of Ul was $1433 (USD 2007) per patient. This demonstrates the importance of understanding the most efficient strategies of managing UI in a healthcare context.
Faecal incontinence (FI)
Faecal incontinence (involuntary loss of solid or liquid stool) is less common than UI, but is particularly distressing both psychologically and physically (Johanson 1996). Women may also experience involuntary loss of flatus (wind). The term anal incontinence is used to encompass involuntary loss of faeces or flatus.
The prevalence of FI is difficult to estimate as the definition of this condition varies between studies, different assessment tools are used and because women may be reluctant to admit to FI (MacArthur 2013). In addition, variation is also apparent in the time points at which FI is measured during pregnancy and following delivery and in which groups of women (e.g. primiparous versus multiparous). For the purpose of this review, FI was considered a generic term that encompassed involuntary loss of solid stool, liquid stool, flatus, or a combination of these.
Some form of FI may be present during pregnancy in first‐time mothers, with a prevalence anywhere up to 12% to 35% for flatal incontinence and 2.0% to 9.5% for loss of formed stool (Johannessen 2016; Svare 2016). Persistent symptoms at three months' postpartum may be 19% to 46% for flatus and 2.4% to 8.0% for the involuntary loss of formed stool (Brown 2012; Signorello 2000). In the longer term, these rates seem to persist, with about 31% of primiparous women reporting involuntary loss of flatus at six and 12 years after delivery and 9% to 12% reporting loss of formed stool (MacArthur 2013). One systematic review suggested that the aetiological factor most strongly associated with postpartum FI is a third‐ or fourth‐degree rupture of the external anal sphincter (Bols 2010).
Faecal incontinence is also associated with significant resource use, with average direct costs being estimated at $2353 annually per patient (USD 2010) (Xu 2012). There are also potential indirect costs associated with both UI and FI. For example, Xu 2012 also estimated productivity losses of $1549 per patient annually in the US population (USD 2010). This highlights the need to identify strategies that are efficient from both the perspective of the patient and the healthcare system.
Description of the intervention
Pelvic floor muscle training (PFMT) refers to the performance of repeated voluntary contractions of the pelvic floor muscles (PFM), according to a protocol that outlines the frequency, intensity and progression of exercises, as well as the duration of the training period. A PFMT programme typically includes one or more sets of exercises per day, performed on at least several days of the week, for at least eight weeks. It is recommended that initial training be followed by maintenance PFM exercises to ensure duration of effect in the longer term (Bø 2004; Mørkved 2014).
In many countries, it is common for women to receive information about, and encouragement to perform, some PFM exercises during pregnancy and after delivery. During pregnancy, information on PFMT may be received from a health professional or obtained from other sources (e.g. leaflets and websites), but this advice may not lead to effective training if the exercise parameters and behaviour are insufficient. Nevertheless, we continued to use the term PFMT to make the review easier to read.
For women who are continent during pregnancy, PFMT is undertaken to prevent leakage. Women who develop symptoms of incontinence during pregnancy or postpartum may be referred to a health professional specifically for treatment and supervision of exercise.
Prevention of urinary and faecal incontinence with pelvic floor muscle training (PFMT)
Prevention is primary, secondary or tertiary prevention (Hensrud 2000). Primary prevention aims to remove the causes of a disease. As an example, a trial that compares two obstetric practices (e.g. liberal versus restrictive episiotomy policies) and the effect on the prevalence of postnatal incontinence amongst previously continent women is a primary prevention trial. Secondary prevention aims to detect asymptomatic dysfunction and treat it early to stop progression. A trial that compares a treatment to improve the muscular supports of the bladder with no treatment in postnatal women who had weak PFM but no UI symptoms is classified as a secondary prevention trial. Tertiary prevention is the treatment of existing symptoms to prevent progression of disease.
Clinically, it may be difficult to screen all potential trial participants to see if a disease process is either absent altogether or present but asymptomatic. In addition, with a condition such as incontinence there might be more than one factor that could contribute to development of the problem, for example denervation, fascial deficits and poor muscle function. It is impractical to screen for all possible factors and, in many cases, there are no reliable or valid clinical tests available. Consequently, prevention trials may enrol people purely on the basis of the absence of symptoms. This is commonly the case in incontinence studies and the findings of these studies are probably a combination of primary and secondary prevention effects. This review makes no attempt to distinguish between primary and secondary effects and considers them together.
Treatment of urinary and faecal incontinence with pelvic floor muscle training (PFMT)
PFMT for the treatment of UI was popularised by Arnold Kegel (Kegel 1948). However, in one review of the literature prior to 1949, Bø 2004 identified several records of the use of PFM exercise. PFMT was principally recommended in the treatment of stress and mixed urinary incontinence but was increasingly part of treatment offered to women with urgency urinary incontinence. The use of PFMT in the treatment of UI is based on two functions of the PFM: support of the pelvic organs and a contribution to the sphincteric closure mechanism of the urethra. More detail about how PFMT might work to treat UI can be found in the background to a previous Cochrane Review of PFMT (Dumoulin 2018).
PFMT is used in the treatment of FI, although there are fewer studies of its effectiveness than for UI. Theoretically, the external anal sphincter muscle (which is continuous with the puborectalis muscle component of the PFM) could be trained in a similar way and it is unclear whether it is possible for people to know the difference between a voluntary external anal sphincter contraction and a voluntary PFM contraction (Norton 2012).
PFMT is recommended as a first‐line therapy for UI (Abrams 2017; Dumoulin 2018). However, a wide range of options is available to treat UI and FI, including conservative interventions (PFM rehabilitation including use of electrical stimulation and biofeedback), lifestyle interventions, bladder training, anti‐incontinence devices, pharmaceutical interventions and surgery.
How the intervention might work
There are a variety of plausible reasons why PFMT might help prevent UI. For example, trained muscle might be less prone to injury and previously trained muscle might be easier to retrain after damage as the appropriate motor patterns are already learned. It may be that previously trained muscle has a greater reserve of strength so that injury to the muscle itself, or its nerve supply, does not cause sufficient loss of muscle function to reach the threshold where reduced urethral closure pressure results in leakage. During pregnancy, training the PFM might help to counteract the increased intra‐abdominal pressure caused by the growing fetus, the hormonally‐mediated reduction in urethral closure pressure, and the increased laxity of fascia and ligaments in the pelvic area. A similar rationale might be used to support the use of PFMT to improve the function of the external anal sphincter and thus prevent FI.
Essentially, a PFMT programme may be prescribed for women to:
increase strength (the maximum force generated by a muscle in a single contraction);
increase endurance (ability to contract repetitively, or to sustain a single contraction over time);
co‐ordinate muscle activity (such as the precontraction of PFM prior to a rise in intra‐abdominal pressure, or to suppress urgency); or
address a combination of these (Bø 2014).
However, based on the plausible reasons above, strength training tends to be emphasised for pregnant and postnatal women. Characteristic features of strength training include low numbers of repetitions with high loads, and one way to increase load is to increase the amount of voluntary effort with each near maximal voluntary contraction (Bø 2014).
There is a subgroup of women where there are particular uncertainties about whether the intervention might work and how it might work (Hilde 2013). These are women with avulsion (separation) of the PFM from the pelvic wall or other major defects in the PFM that are palpated or seen on imaging (e.g. ultrasound, magnetic resonance imaging). It is possible that these women might benefit from PFMT after the birth, helping the injury 'heal' (Hilde 2013). However, it is also possible that PFMT does not assist the return of function if the muscle no longer has the attachments that anatomically enable it to compress and lift the urethra with a muscle contraction.
Why it is important to do this review
Urinary and faecal incontinence are experienced by many women during pregnancy and following childbirth and can have a significant impact on quality of life (Handa 2007; Rogers 2017). In addition to the individual burden of managing incontinence, there are also significant healthcare resource implications associated with the management of both UI and FI. It is important to consider which management strategies are the most efficient use of resources from the perspective of the healthcare system. There are direct costs borne by women, such as buying continence products, laundry costs and visits to a general practitioner or continence service. Less direct, but no less important costs for women may include the social or physical activity limits they adopt to prevent embarrassment of leakage in public. Preventing or treating the condition with PFMT is likely to incur considerable cost to health services because supervised (e.g. several one‐to‐one contacts with a health professional) conservative therapies such as PFMT are more expensive than usual care (Wagner 2017). However, cost‐effectiveness modelling of non‐surgical treatments for stress urinary incontinence in women found more intensive forms of PFMT were likely to be worthwhile (Imamura 2010). It is unclear if PFMT would offer greater value for money to prevent the condition than treat it.
Although PFMT is recommended as the first choice of conservative management for incontinence, uncertainties about its effectiveness in antenatal and postnatal women remain (Dumoulin 2017), such as whether PFMT might be more effective if targeted to specific groups, or more effective as a prevention or treatment intervention. Also, with increasing pressure on constrained healthcare budgets worldwide, it is important to clarify whether the intervention offers value for money to ensure efficient allocation of resources.
Since the last update of this review in 2017 (Woodley 2017), other systematic reviews have been published that address the effects of PFMT during pregnancy and after delivery for the prevention and treatment of UI and the effects of antenatal PFMT on labour and delivery outcomes (Davenport 2018; Saboia 2018; Schreiner 2018).
Objectives
To assess the effects of pelvic floor muscle training (PFMT) in the prevention or treatment of urinary incontinence (UI) and faecal incontinence (FI) in pregnant or postnatal women; and summarise the principal findings of relevant economic evaluations.
Methods
Criteria for considering studies for this review
Types of studies
We included randomised controlled trials (including cluster and cross‐over trials) and quasi‐randomised studies (e.g. allocation by alternation). We excluded other forms of controlled clinical trials.
Types of participants
We included trials that recruited antenatal (i.e. pregnant) or postnatal women (i.e. women immediately following delivery or women with persistent urinary or faecal incontinence symptoms up to three months after their most recent delivery). Women could be with or without urinary, faecal, or both urinary and faecal incontinence symptoms at recruitment.
We compared three populations of women:
prevention trials in antenatal women who were continent when randomised;
treatment trials in antenatal or postnatal women who were incontinent when randomised;
mixed prevention and treatment trials in antenatal or postnatal women where some women had incontinence symptoms and some did not when randomised.
We paid close attention to the distinction between treatment and prevention trials because the effect of PFMT might differ for these two purposes. For the trials that recruited antenatal or postnatal women, whether they had symptoms of incontinence or not, the PFMT intervention was a prevention strategy for the non‐symptomatic women and treatment for symptomatic women. The two effects could not be distinguished in these trials.
Types of interventions
One arm of all eligible trials included a PFMT programme to improve the function of the PFM, the external anal sphincter or both. PFMT was a programme of repeated voluntary PFM contractions, although this was a limited definition compared with the fuller ideal (Dumoulin 2018). We considered all types of PFMT, including variations in the purpose and timing of PFMT (e.g. PFMT for strengthening, PFMT for urgency suppression), ways of teaching PFMT, types of contractions (fast or sustained), and number of contractions.
Acceptable control interventions were usual antenatal and postnatal care, placebo treatment or no treatment. Usual antenatal or postnatal care in many countries included advice about PFMT. We included studies in which the control group had, or might have, received PFMT advice providing the PFMT arm was more intensive in some way than the control arm. For example, in the PFMT arm, women were taught the exercises by a health professional, whereas usual care involved distribution of a leaflet about PFMT on the postnatal wards.
We included trials in which PFMT was combined with other physical therapy modalities such as biofeedback, electrical stimulation or multi‐modal exercise programmes. Studies where advice on strategies for symptoms of urgency and frequency (but without a scheduled voiding regimen characteristic of bladder training) were also eligible for inclusion.
We excluded trials in which PFMT was combined with another stand‐alone therapy such as bladder training, drug therapy (e.g. anticholinergic drug) or herbal medicine; and trials of electrical stimulation (without PFMT). We also excluded trials if they did not report UI or FI as this suggests that the intervention was not being tested for its effect on UI or FI.
We assessed the following comparisons.
-
Antenatal PFMT versus no PFMT, usual care or other control condition for the:
primary or secondary prevention of incontinence;
treatment of incontinence;
mixed prevention or treatment of incontinence (i.e. treating a mixed population with PFMT).
-
Postnatal PFMT versus no PFMT, usual care, or other control condition for the:
treatment of incontinence;
mixed prevention or treatment of incontinence.
Types of outcome measures
With regards to prevention, it seemed that the most appropriate measure of outcome was the self‐reported absence of urinary or faecal incontinence symptoms. For treatment, a wider range of outcomes was considered significant, although the self‐reporting of cure or improvement in urinary or faecal incontinence symptoms was thought to be of most importance. These outcomes are the opposite of each other, being either the presence or absence of incontinence symptoms. For consistency throughout the review, we chose to report the presence of incontinence symptoms rather than the absence. For the comparisons that addressed the effect of PFMT for treatment of existing continence symptoms, readers should be aware that the data were 'negative' i.e. continuing incontinence rather than curing it.
Primary outcomes
Self‐reported urinary or faecal incontinence.
Urinary incontinence‐specific quality of life (e.g. International Consultation on Incontinence Questionnaire (ICIQ; 4 items, higher score worse), Incontinence Impact Questionnaire (IIQ; 30 items, higher score worse), Urogenital Distress Inventory (UDI; 19 items, higher score worse) (Avery 2004; Avery 2007; Shumaker 1994).
Faecal incontinence‐specific quality of life (e.g. Faecal Incontinence Quality of Life questionnaire (FIQOL; 29 items, 4 domain scores, each item scored 1‐5, higher score better) (Rockwood 2000).
Secondary outcomes
Self‐reported severity of incontinence (e.g. Incontinence Index score, slight, moderate or severe (Sandvik 1993)).
Number of urinary or faecal incontinence episodes.
Loss of urine under stress test (e.g. cough or pad test).
Self‐reported measures of pelvic floor dysfunction (e.g. UDI‐6)
Other self‐reported well‐being measures
Adverse effects, particularly discomfort or pain associated with PFMT.
Labour and delivery outcome (e.g. type of delivery, perineal trauma, episiotomy, length of second stage) for women who did antenatal PFMT.
While not outcomes per se, we also extracted data on two particular variables that might help explain variations in PFMT effect:
PFM function (e.g. electromyography, vaginal or anal squeeze pressures);
treatment adherence (e.g. surrogates such as class attendance, and more direct measures such as home exercise frequency).
Search methods for identification of studies
We imposed no restrictions, unless otherwise stated, on language of publication, publication status (i.e. full publication, grey literature, etc.) or any other restrictions on the searches described below.
Electronic searches
Search for clinical effectiveness studies
We identified relevant trials from the Cochrane Incontinence Specialised Register. For more details of the search methods used to build the Specialised Register, please see the Group's webpages where details of the Register's development (from inception) and the most recent searches performed to populate the Register can be found. To summarise, the Register contains trials identified from the Cochrane Central Register of Controlled Trials (CENTRAL), MEDLINE, MEDLINE In‐Process, MEDLINE Epub Ahead of Print, ClinicalTrials.gov, WHO ICTRP, Be Part of Research, and handsearching of journals and conference proceedings. Many of the trials in the Cochrane Incontinence Specialised Register are also contained in CENTRAL.
The terms used to search the Cochrane Incontinence Specialised Register are given in Appendix 1.
Date of the most recent search of the Register for this review: 7 August 2019.
Search for economic evaluations
We performed additional searches for the brief economic commentary (BEC). We searched:
NHS EED on the Centre for Reviews and Dissemination (CRD) website (covering from the earliest record in NHS EED, dating from 1968, up to and including 31 December 2014 when their coverage ended) (date of search: 30 January 2020).
As NHS EED is no longer actively updated, we performed additional searches of the following databases to identify eligible studies added to these databases from 1 January 2015 onwards (date of search: 29 January 2020):
MEDLINE on OvidSP (covering 1 January 1946 to January Week 3 2020); and
Embase (on OvidSP) (covering 1 January 1974 to 2020 Week 4).
Details of the searches that were performed, including date restrictions to ensure the searches complied with current Cochrane methods guidance, can be found in Appendix 2 (Shemilt 2019).
Searching other resources
We searched for other possible relevant studies in the reference lists of relevant articles.
Data collection and analysis
Selection of studies
Two review authors assessed all potentially eligible studies without prior consideration of the results. We resolved any disagreements by discussion. Where these were not resolved, a third review author had final responsibility. We included only randomised or quasi‐randomised controlled trials, and excluded trials that made comparisons other than those prespecified.
Data extraction and management
Two review authors independently undertook data extraction onto a proforma and cross‐checked them. We resolved any differences by discussion. Where trial data were possibly collected but not reported, or data were reported in a form that could not be used in the formal comparisons, we sought further clarification from the trialists. We processed all included trial data as described in the Cochrane Handbook for Systematic Reviews of Interventions (Higgins 2011).
Assessment of risk of bias in included studies
Two review authors independently assessed the risk of bias of the included trials using Cochrane's 'Risk of bias' tool (Higgins 2011). We considered random sequence generation, allocation concealment, blinding of participants and personnel, blinding of outcome assessment, incomplete outcome data and other bias and deemed each category at low, high or unclear risk of bias. Where there was insufficient information to make a clear decision, we rated trials as 'unclear risk.' We resolved any disagreements by discussion.
Allocation (selection bias)
When considering random sequence bias, we assessed whether the method used to generate the allocation sequence in each study would allow an assessment of whether it produced comparable groups. We assessed the method as:
low risk of bias: any truly random process such as computer‐generated random number sequences;
high risk of bias: any non‐random process such as allocation by birth date or bed number;
unclear risk of bias.
For assessing allocation concealment, we determined the methods to conceal allocation to interventions prior to assignment and whether intervention allocation could have been foreseen in advance or during recruitment, or changed after assignment. We assessed the methods as:
low risk of bias: all forms of remote or web‐based allocation and sequentially numbered, sealed and opaque envelopes;
high risk of bias: open random allocation, envelopes where not all the above criteria were met (not sequentially numbered, unsealed, non‐opaque), all methods of alternation;
unclear risk of bias.
Blinding (performance bias and detection bias)
We did not have any criteria for performance bias as it was not considered feasible due to the nature of the intervention to blind the personnel or participants to group allocation. It is likely that this lack of blinding would unfortunately influence the results of the review.
We did not have any criteria for detection bias as it was not considered feasible to blind participants to the assessment of the two a priori outcomes of this review (prevalence of incontinence and incontinence quality of life) as both were self‐reported. We assessed blinding separately for other outcomes, such as the pad test and PFM function measures.
Incomplete outcome data (attrition bias)
For each outcome, we described the completeness of data, including attrition and exclusions from the analysis. In making a judgement about attrition bias, we considered the:
proportion of the total sample lost to follow‐up and the adequacy of any imputation methods used for missing data;
similarity in proportion of losses by group;
whether reasons were provided for losses and whether these differed by group;
if participants were analysed in the group to which they were assigned.
We assessed the methods as:
low risk of bias: trials with 10% or less loss to follow‐up and without a differential loss to follow‐up;
high risk of bias: trials with more than 20% loss to follow‐up without appropriate imputation methods or trials in which participants were not analysed in the group to which they were randomised;
unclear risk of bias: when the proportion of dropouts was between 10% and 20% without appropriate imputation methods (with no major differential or lack of similar reasons between groups) or when there was no reporting of losses to follow‐up.
Selective reporting (reporting bias)
For each included trial, we determined the possibility of selective outcome reporting bias and described what we found based on the following criteria:
low risk of bias: it was clear that all of the trial's prespecified outcomes were reported;
high risk of bias: not all of the trial's prespecified outcomes were reported, a primary outcome was not prespecified, outcomes of interest to the review, and for which data were collected, were reported incompletely and so could not be used;
unclear risk of bias: a lack of detail in reporting made it difficult to assess whether all prespecified outcomes were presented.
Other bias
For each included study, we described any important concerns we had about other possible sources of bias that had not previously been considered in the categories above. In particular, we looked for a declaration of conflict of interest and the funding source.
Measures of treatment effect
For categorical outcomes, we related the numbers reporting an outcome to the numbers at risk in each group to derive a risk ratio (RR) or standardised mean difference (SMD) and its 95% confidence interval (CI). For continuous variables, we used means and standard deviations (SD) to derive mean differences (MD).
Where a trial took measures at two time points within a single category (e.g. at eight and 12 months after delivery), we used the data from the longer time period. If data were available for specific time points but could not be combined or entered into RevMan, we reported these data in the text.
Unit of analysis issues
The primary unit of analysis was per women randomised. For the meta‐analysis of multi‐arm studies, we combined the data from the PFMT intervention arms for comparison with the control arm. We calculated the mean and SD for the combined data according to the Cochrane Handbook for Systematic Reviews of Interventions (Higgins 2011).
Dealing with missing data
Where possible, we analysed trial data according to the intention‐to‐treat (ITT) principle; that is by the randomised groups and irrespective of whether women received treatment according to their randomised allocation. We did not impute missing outcome data.
Assessment of heterogeneity
We assessed the extent of heterogeneity in three ways: visual inspection of data plots, Chi² test for heterogeneity (Chi² test, P < 0.10) and the I² statistic (Higgins 2011). We sought and discussed possible explanations for heterogeneity through subgroup analysis. Heterogeneity was considered using the following ranges (Higgins 2011):
0% to 40%: might not be important;
30% to 60%: may represent moderate heterogeneity;
50% to 90%: may represent substantial heterogeneity;
75% to 100%: considerable heterogeneity.
Assessment of reporting biases
To minimise reporting bias, we undertook a comprehensive search for eligible trials and were vigilant for duplication of data.
Had data allowed, we would have generated funnel plots to examine the possibility of small study bias, including publication bias.
Data synthesis
We used the Mantel‐Haenszel methods with a fixed‐effect model approach in the meta‐analyses in this review, unless statistically significant heterogeneity (Chi² test, P < 0.10) suggested a more conservative random‐effects model was indicated. Where possible, data from different studies were pooled using a fixed‐effect model.
Subgroup analysis and investigation of heterogeneity
In each comparison, we used subgroup analysis to demonstrate the effect of the type of control comparison on outcome. The subgroups were:
PFMT versus no PFMT;
PFMT versus unspecified control (i.e. the trialist gave insufficient information about the control condition to classify it as one of the others);
PFMT versus usual care.
The final subgroup explored differences in intensity of PFMT:
PFMT (more intensive, e.g. addition of biofeedback) versus PFMT (less intensive).
Sensitivity analysis
Sensitivity analysis with respect to trial quality was planned, as there is some evidence that the adequacy of randomisation (sequence generation and allocation concealment) may have an impact on the findings of a meta‐analysis (Moher 1998). However, there were insufficient trials and too many other potential causes of heterogeneity to make this useful.
Incorporating economics evidence
Following the search outlined in the Search methods for identification of studies, we developed a brief economic commentary (BEC) to summarise the availability and principal findings of the full economic evaluations that assess pelvic floor muscle training for the prevention and treatment of urinary and faecal incontinence in antenatal and postnatal women (Shemilt 2019). This BEC encompassed full economic evaluations (i.e. cost‐effectiveness analyses, cost‐utility analyses and cost‐benefit analyses), conducted as part of a single empirical study like a randomised controlled trial, a model based on a single such study, or a model based on several such studies.
Summary of findings and assessment of the certainty of the evidence
We used the five GRADE considerations (study limitations, inconsistency of effect, imprecision, indirectness and publication bias) to assess the quality of the body of evidence as it related to the studies that contributed data to the meta‐analyses for the prespecified outcomes (Atkins 2004). We used the methods and recommendations described in the Cochrane Handbook for Systematic Reviews of Interventions using GRADEpro GDT software (GRADEpro GDT; Higgins 2011). We justified all decisions to downgrade the quality of studies using footnotes and made comments to aid the reader's understanding of the review where necessary.
We created 'Summary of findings' tables for antenatal PFMT, using the following outcomes:
urinary incontinence in late pregnancy;
urinary incontinence mid‐postnatal period;
urinary incontinence late postnatal period;
faecal incontinence in late pregnancy;
faecal incontinence mid‐postnatal period;
faecal incontinence late postnatal period;
urinary incontinence‐specific quality of life;
faecal incontinence‐specific quality of life;
adverse events.
For antenatal PFMT trials, we assessed the evidence in late pregnancy (postintervention effect) and the mid‐ and late‐postnatal periods (durability of effect postdelivery).
We created 'Summary of findings' tables for postnatal PFMT, using the following outcomes:
urinary incontinence late postnatal period;
faecal incontinence in late pregnancy;
urinary incontinence‐specific quality of life;
faecal incontinence‐specific quality of life;
adverse events.
In postnatal training trials, we assessed the evidence in the late postnatal period (sustained postintervention effect).
Results
Description of studies
Results of the search
Search for clinical effectiveness studies
The flow of literature through the assessment process is shown in the PRISMA flowchart (Figure 1).
1.
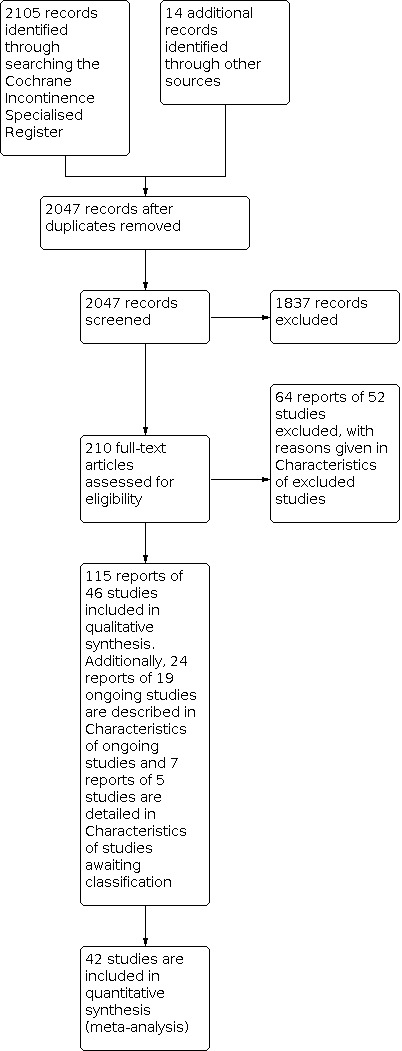
PRISMA study flow diagram ‐ search for clinical effectiveness studies
The previous version of the review included 94 reports of 38 studies (Woodley 2017). The search update yielded 831 titles and abstracts and 121 records were obtained for further assessment. We included 21 reports from eight new studies. The updated review now synthesises data from 115 reports of 46 studies that randomised 10832 women (5478 : pelvic floor muscle training (PFMT), 5354 controls) from 21 countries.
Sixty‐four reports of 52 studies were excluded from the update and reasons are given in the Characteristics of excluded studies. In addition, 19 studies were classified as ongoing (see Characteristics of ongoing studies) and five require further assessment to determine eligibility (see Characteristics of studies awaiting classification).
Four papers were published in Chinese and the data were extracted by translators for screening and further analysis (Kou 2013; Liu 2011; Sun 2015; Wen 2010).
Search for economic evaluations
Our search for economic evaluations yielded 416 records which were screened; 13 appeared to meet the eligibility criteria for the review and the full‐text articles were retrieved. No published economic evaluations were found, but one protocol for an ongoing economic evaluation being conducted alongside a randomised controlled trial (RCT) was identified (Moossdorf‐Steinhauser 2019). The PRISMA flow diagram showing the literature assessment process is given in Figure 2.
2.
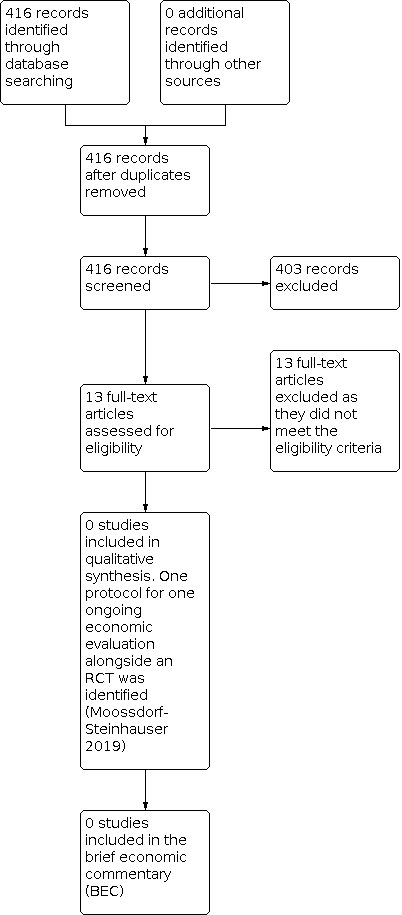
PRISMA study flow diagram ‐ search for economic evaluations for the BEC
Included studies
The review includes 46 trials and further details are provided in the Characteristics of included studies. Thirty‐eight of the 46 studies were included in the previous version of this review (Ahlund 2013; Assis 2015; Barakat 2011; Bø 2011; Chiarelli 2002; Cruz 2014; Dinc 2009; Dokmeci 2008; Dumoulin 2004; Ewings 2005; Fritel 2015; Frost 2014; Frumenzio 2012; Gaier 2010; Glazener 2001; Gorbea 2004; Hilde 2013; Hughes 2001; Kim 2012; Ko 2011; Kocaoz 2013; Kou 2013; Liu 2011; Meyer 2001; Miquelutti 2013; Mørkved 2003; Peirce 2013; Pelaez 2014; Reilly 2002; Sampselle 1998; Sangsawang 2016; Skelly 2004; Sleep 1987; Stafne 2012; Stothers 2002; Wen 2010; Wilson 1998; Woldringh 2007). The remaining eight included studies are new to this update (Dufour 2019; Hyakutake 2018; Oakley 2016; Sacomori 2019; Sut 2016; Szumilewicz 2019; Torsdatter Markussen 2017; Yang 2017).
Twenty‐five of the 46 included studies were publicly funded (university or national research funds or charitable trust), and one received grants from both public and private sources (Glazener 2001). Three studies did not receive any specific funding (Ahlund 2013; Barakat 2011; Kim 2012). Eighteen studies did not declare funding sources (Assis 2015; Bø 2011; Dokmeci 2008; Frost 2014; Frumenzio 2012; Gaier 2010; Gorbea 2004; Hughes 2001; Kim 2012; Kocaoz 2013; Kou 2013; Liu 2011; Pelaez 2014; Sacomori 2019; Skelly 2004; Stothers 2002; Wen 2010; Yang 2017). Twenty‐one trials declared no conflicts of interest (Ahlund 2013; Bø 2011; Chiarelli 2002; Dinc 2009; Dokmeci 2008; Dufour 2019; Fritel 2015; Glazener 2001; Hilde 2013; Hyakutake 2018; Ko 2011; Miquelutti 2013; Oakley 2016; Peirce 2013; Pelaez 2014; Sangsawang 2016; Stafne 2012; Sut 2016; Szumilewicz 2019; Torsdatter Markussen 2017; Yang 2017). The remaining 25 trials did not report conflicts of interest.
In all, 42 of the 46 trials contributed data to one or more meta‐analysis.
Design
The majority of the included studies in this review (41 of 46) were two‐arm parallel group RCTs investigating the impact of PFMT on urinary and/or faecal incontinence in pregnant and postnatal women. Of the five included studies that were not of this design, one was classified as a quasi‐RCT (Kocaoz 2013), one as a cluster‐RCT (Sacomori 2019), while three utilised a three‐arm study design (Assis 2015; Dumoulin 2004; Yang 2017). One‐to‐one allocation ratio was the predominant method of randomisation, employed in all but two studies (Peirce 2013; Szumilewicz 2019).
Eight trials were primary or secondary prevention trials (i.e. none of the women had incontinence symptoms at the start of training) (Barakat 2011; Gaier 2010; Gorbea 2004; Kocaoz 2013; Pelaez 2014; Reilly 2002; Sangsawang 2016; Stothers 2002). Two trials provided subgroup data for women continent at randomisation (Mørkved 2003; Sampselle 1998). All 10 investigated the effect of beginning PFMT antenatally. Nine were treatment trials (i.e. all women had incontinence symptoms at the start of training). These investigated the effects of beginning PFMT antenatally and postnatally (Ahlund 2013; Cruz 2014; Dinc 2009; Dumoulin 2004; Glazener 2001; Kim 2012; Skelly 2004; Wilson 1998; Woldringh 2007). Twenty‐nine were mixed prevention or treatment trials as some women did, and others did not, have incontinence symptoms at the start of training. These trials investigated the effects of starting PFMT antenatally or postnatally (Assis 2015; Bø 2011; Chiarelli 2002; Dokmeci 2008; Dufour 2019; Ewings 2005; Fritel 2015; Frost 2014; Frumenzio 2012; Hilde 2013; Hughes 2001; Hyakutake 2018; Ko 2011; Kou 2013; Liu 2011; Meyer 2001; Miquelutti 2013; Mørkved 2003; Oakley 2016; Peirce 2013; Sacomori 2019; Sampselle 1998; Sleep 1987; Stafne 2012; Sut 2016; Szumilewicz 2019; Torsdatter Markussen 2017; Wen 2010; Yang 2017).
The primary reference for eight trials was a conference abstract (Cruz 2014; Dokmeci 2008; Frost 2014; Frumenzio 2012; Gaier 2010; Hughes 2001; Skelly 2004; Stothers 2002). No further published reports were found for seven of these eight trials and one trialist kindly provided additional data from a thesis (Hughes 2001). One‐to‐one randomisation was assumed (the numbers in the intervention (139 women) and control (129 women) groups suggested this was likely) for one trial so that data could be used in the meta‐analysis (Skelly 2004).
Sample size
Four trials were small, with fewer than 25 women per comparison group (Dufour 2019; Dokmeci 2008; Dumoulin 2004; Kim 2012). Fourteen were of moderate size, with between 25 and 50 women per group (Ahlund 2013; Assis 2015; Barakat 2011; Cruz 2014; Dinc 2009; Frumenzio 2012; Gorbea 2004; Hyakutake 2018; Oakley 2016; Sampselle 1998; Sangsawang 2016; Stothers 2002; Sut 2016; Torsdatter Markussen 2017). Twenty‐four trials allocated more than 50 women per group (Bø 2011; Chiarelli 2002; Ewings 2005; Fritel 2015; Frost 2014; Gaier 2010; Glazener 2001; Hilde 2013; Hughes 2001; Ko 2011; Kocaoz 2013; Kou 2013; Liu 2011; Meyer 2001; Miquelutti 2013; Mørkved 2003; Pelaez 2014; Reilly 2002; Sacomori 2019; Sleep 1987; Stafne 2012; Wen 2010; Woldringh 2007; Yang 2017). Three of these were large, with more than 300 women per comparison group (Chiarelli 2002; Glazener 2001; Stafne 2012). Two were very large trials of more than 500 women per group (Hughes 2001; Sleep 1987).
Setting
Women were recruited from various health services including antenatal and urology clinics, outpatient physiotherapy clinics, gynaecology and obstetric departments, and hospital settings in the following 21 countries: Australia (Chiarelli 2002), Brazil (Assis 2015; Cruz 2014; Miquelutti 2013; Sacomori 2019), Canada (Dumoulin 2004; Dufour 2019; Hyakutake 2018; Skelly 2004; Stothers 2002), China (Ko 2011; Kou 2013; Liu 2011; Wen 2010; Yang 2017), England (Ewings 2005; Glazener 2001; Reilly 2002; Sleep 1987), France (Fritel 2015), Ireland (Peirce 2013), Italy (Frumenzio 2012; Gaier 2010), Mexico (Gorbea 2004), the Netherlands (Woldringh 2007), New Zealand (Glazener 2001; Wilson 1998), Norway (Bø 2011; Hilde 2013; Mørkved 2003; Stafne 2012; Torsdatter Markussen 2017), Poland (Szumilewicz 2019), Republic of Korea (Kim 2012), Scotland (Glazener 2001), Spain (Barakat 2011; Pelaez 2014), Sweden (Ahlund 2013), Switzerland (Meyer 2001), Thailand (Sangsawang 2016), Turkey (Dinc 2009; Dokmeci 2008; Kocaoz 2013; Sut 2016), and the USA (Frost 2014; Oakley 2016; Sampselle 1998).
Participant characteristics
Parity (number of births)
Eight studies did not report parity or gravidity (Cruz 2014; Frost 2014; Frumenzio 2012; Kocaoz 2013; Kou 2013; Skelly 2004; Stothers 2002; Wen 2010). Trials that investigated the effects of antenatal PFMT for prevention of urinary incontinence recruited only continent women in their first pregnancy or having their first baby (or both). Treatment trials recruited women having their first or subsequent baby and had symptoms of urinary or faecal incontinence. In the mixed prevention and treatment studies, whether women were recruited antenatally or postnatally, the women were having their first or subsequent baby and did or did not have urinary or faecal incontinence symptoms. In the trials with mixed parity samples, it is unknown if parity was comparable in seven trials (Cruz 2014; Frumenzio 2012; Kocaoz 2013; Kou 2013; Skelly 2004; Stothers 2002; Yang 2017). It was not comparable in one trial (Barakat 2011).
Age
Participant age was variously described, although six trials did not report this (Cruz 2014; Dokmeci 2008; Frost 2014; Peirce 2013; Sacomori 2019; Skelly 2004). Three trials reported an age range, with women aged between their early 20s to early 40s (Kou 2013; Stothers 2002; Wen 2010). In two trials, about 50% to 60% of the women were aged 20 to 29 years (Chiarelli 2002; Ewings 2005). Median age was about 28 years in two trials (Hughes 2001; Reilly 2002), and 36 years in another trial (Dumoulin 2004). In the remaining 31 studies, the mean age was in the early 20s (Miquelutti 2013), mid to late 20s for 17 trials (Assis 2015; Dinc 2009; Fritel 2015; Gaier 2010; Gorbea 2004; Kocaoz 2013; Liu 2011; Meyer 2001; Mørkved 2003; Oakley 2016; Pelaez 2014; Sampselle 1998; Sangsawang 2016; Sleep 1987; Sut 2016; Wilson 1998; Yang 2017), and early 30s for 14 trials (Ahlund 2013; Barakat 2011; Bø 2011; Dufour 2019; Frumenzio 2012; Glazener 2001; Hilde 2013; Hyakutake 2018; Kim 2012; Ko 2011; Stafne 2012; Szumilewicz 2019; Torsdatter Markussen 2017; Woldringh 2007). Age was comparable at baseline between groups in 34 trials but was unclear in the other 12 (Cruz 2014; Dokmeci 2008; Dufour 2019; Frumenzio 2012; Hyakutake 2018; Kou 2013; Meyer 2001; Peirce 2013; Sacomori 2019; Skelly 2004; Stothers 2002; Wen 2010).
Weight
Twenty‐seven of the 46 trials reported body weight or body mass index (BMI). For the women recruited antenatally, mean or median BMI was in the low to mid 20s (Barakat 2011; Bø 2011; Fritel 2015; Gaier 2010; Hughes 2001; Ko 2011; Miquelutti 2013; Mørkved 2003; Oakley 2016; Pelaez 2014; Reilly 2002; Sangsawang 2016; Stafne 2012; Szumilewicz 2019; Woldringh 2007), or high 20s (Sut 2016). Two trials reported that mean body weight in kilograms was in the mid 60s on average (Assis 2015, 67 kg; Gorbea 2004, 66 kg). Another two studies recruited antenatal women with a BMI in the overweight or obese range, accounting for 30% of participants in one (Kocaoz 2013) and all participants in the other (Torsdatter Markussen 2017). In three trials that recruited postnatal women with persistent incontinence symptoms, the mean or median BMI was in the normal range (Ahlund 2013; Dumoulin 2004; Kim 2012). BMI was about 26 kg/m² in two mixed treatment and prevention studies which recruited women postnatally (Hilde 2013; Yang 2017), and approximately 30% of women in two further trials had a BMI in the overweight or obese range (Chiarelli 2002; Ewings 2005). BMI or body weight was comparable at baseline between groups for all of these trials, although two trials noted that weight gain in pregnancy differed significantly between the groups, being greater in either the PFMT group or in the control group (Barakat 2011; Gorbea 2004).
Type of delivery
Some details on delivery were given by 14 of 19 trials that began PFMT after delivery. In nine of these trials, all women delivered vaginally (Chiarelli 2002; Frost 2014; Hilde 2013; Kim 2012; Liu 2011; Peirce 2013; Sleep 1987; Wen 2010; Yang 2017). In Chiarelli 2002, all women had a forceps or ventouse delivery, while the proportion with instrumental delivery varied in two others (about 39% in Peirce 2013 and 69% in Yang 2017); the types of delivery appeared comparable across the PFMT and control groups in these trials. In three trials, some women had a caesarean section (about 8% in Glazener 2001, 18% in Wilson 1998 and 41% in Sacomori 2019), with the proportion of caesarean sections being similar in both the PFMT and control groups for all trials. Glazener 2001 also reported that about 14% of women in both the PFMT and control groups had assisted vaginal deliveries. Women in the study by Dufour 2019 delivered vaginally or by caesarean section, but the proportions were not reported. In the remaining small trial by Meyer 2001, it was unclear if all 107 women delivered vaginally, but it was reported that 30% of PFMT group and 16% of control group women had forceps delivery; this difference was not "statistically significant" (P = 0.10).
For the trials in which PFMT began antenatally, it is possible that the type of delivery was affected by PFMT. For these trials, the type of delivery was a possible confounder of the postnatal incontinence outcome but may itself be an outcome of importance. A short summary of the data is given here. The data are also reported in more detail in the analysis. Some details on the type of delivery, by group, were given by only 15 of the 27 trials in which PFMT began antenatally. In 12 trials, the delivery type was similar across both comparison groups (Barakat 2011; Fritel 2015; Frost 2014; Hughes 2001; Hyakutake 2018; Ko 2011; Miquelutti 2013; Mørkved 2003; Reilly 2002; Sampselle 1998; Stothers 2002; Woldringh 2007). However, in two trials, there seemed to be fewer vaginal deliveries in the PFMT group (Dinc 2009; Gorbea 2004), and in one trial a significantly greater number of vaginal deliveries (P = 0.018) in the PFMT group (Sut 2016). Miquelutti 2013 reported a "statistically significantly" longer duration of delivery in the PFMT group (mean difference (MD) 9.48, 95% confidence interval (CI) 0.32 to 18.64; P < 0.05).
Exclusion criteria
The most common exclusion criterion (in 33 trials) was a comorbidity that contraindicated exercise in pregnancy or made PFMT difficult (or both), or might have altered the outcome of training, such as serious medical or neuromuscular conditions. Twelve trials excluded women with high‐risk pregnancies (Bø 2011; Dokmeci 2008; Fritel 2015; Gorbea 2004; Ko 2011; Meyer 2001; Miquelutti 2013; Mørkved 2003; Sangsawang 2016; Stafne 2012; Sut 2016; Torsdatter Markussen 2017). Eighteen trials included women with singleton pregnancies or excluded women with twins, or other multiple pregnancies or births (Ahlund 2013; Barakat 2011; Bø 2011; Cruz 2014; Fritel 2015; Gorbea 2004; Hilde 2013; Liu 2011; Meyer 2001; Miquelutti 2013; Mørkved 2003; Pelaez 2014; Sangsawang 2016; Stafne 2012; Stothers 2002; Sut 2016; Torsdatter Markussen 2017; Wen 2010). Nine trials excluded women if the baby was stillborn or was very ill or died after birth (Chiarelli 2002; Ewings 2005; Glazener 2001; Hilde 2013; Mørkved 2003; Peirce 2013; Sacomori 2019; Sleep 1987; Stafne 2012). Five trials excluded women if language difficulties meant it was difficult to seek informed consent (Chiarelli 2002; Dumoulin 2004; Ewings 2005; Peirce 2013; Woldringh 2007). An additional 10 trials outlined language requirements as part of their inclusion criteria (Bø 2011; Cruz 2014; Dufour 2019; Fritel 2015; Hilde 2013; Hyakutake 2018; Oakley 2016; Peirce 2013; Pelaez 2014; Sacomori 2019). Four trials specifically excluded women who experienced pain with a PFM contraction (Dinc 2009; Ko 2011; Mørkved 2003; Sangsawang 2016). One trial excluded women who were unable to perform a PFM contraction as assessed with electromyography (Szumilewicz 2019).
Pelvic floor muscle training regimens and control interventions
The PFMT and control interventions are described in the Characteristics of included studies (overview) and in Table 6 (details of exercise parameters and adherence).
1. Pelvic floor muscle training programmes and adherence.
| Study ID | Voluntary pelvic floor muscle contraction confirmed? | PFMT parameters | PFMT supervision | Control comparison | Adherence | Notes |
|
Ahlund 2013 (treatment trial) |
Vaginal palpation performed by study midwife: after randomisation and at each of the 3 visits to midwife (PFMT and control groups). | PFMT started with 3 fast contractions, followed by 3 sets of 8‐12 slow velocity, near maximal contractions, 6‐sec hold; 7 days per week for 6 months. Received written instructions on PFMT, but no information provided on PFMT progression. | Visit to the study midwife every 6th week (3 times during study period). | Usual care: written information describing PFM anatomy and PFMT. Received instructions on how to correctly perform PFM contraction (vaginal palpation) from midwife. | Women in the PFMT group were asked at each midwife visit how often they did PFMT; results not reported. | PFMT in lying or sitting positions. |
|
Assis 2015 (prevention trial) |
Perineometry (at 1st meeting), but unclear by whom (PFMT group). | 5‐10 slow PFM contractions with 6‐sec hold, rest 6 sec between contractions with 3 rapid contractions at the end (as per Mørkved 2003). Daily PFMT in 4 positions, and 1 group (27 women) had 5 supervised sessions with a physiotherapist. Received manual of home PFMT exercises and asked to complete an exercise diary. | Supervised PFMT (27 women): received up to 5 monthly supervised exercise sessions with physiotherapist (22, 26, 30, 34, 38 weeks' gestation). Unsupervised PFMT (27 women): trained to perform PFMT by physiotherapist (1 session). | Did not receive intervention and did not exercise. | Not reported, although it stated that no dropouts occurred throughout the duration of the study due to all women in the PFMT group complying with the exercise protocol. | PFMT in a variety of positions including left side lying, sitting, reclined sitting, sitting with legs crossed, standing. Translation (Portuguese). |
|
Barakat 2011 (prevention trial) |
Not reported. | PFMT included in the 7‐ to 8‐min cool‐down period as part of a 35‐ to 45‐min exercise session, 3 days per week for duration of pregnancy (potential mean of 85 sessions in total). No specific details provided about PFMT programme. | Group exercise classes, supervised by a qualified fitness specialist, with the assistance of an obstetrician. | Not reported. | Adherence to PFMT was 90%. | General exercises targeted major muscles of arms and abdomen to promote good posture and prevent low back pain, and in the 3rd trimester strengthen the muscles of labour and PF. 1 session of aerobic dance per week. Accompanied by music. |
|
Bø 2011 (mixed prevention and treatment trial) |
Participants did not have individual assessment of correct voluntary PFM contraction (due to pragmatic nature of study). Instructors were trained in how to explain a correct PFM contraction. | PFMT included as part of 15‐min strength training session within a 60‐min group exercise class. PFMT: 3 sets of 8‐12 maximal contractions, 6‐ to 8‐sec hold; strong verbal motivation to perform close to maximum PFM contractions. Women encouraged to participate in at least 2 out of 3 fitness classes per week for 12 weeks. Daily PFMT at home: 3 sets of 8‐12 close to maximum PFM contractions. Also encouraged to be physically active for at least 30 min per day. Received a specific PFMT brochure. | Group exercise classes, 2 or 3 per week for 12 weeks, led by certified aerobic instructors. Instructors were taught by a physiotherapist with > 20 years of experience in assessing, treating and researching women with PF dysfunction. | Usual antenatal care. | Mean adherence to exercise classes was 17.2 out of a possible 24 sessions. 40% (21/52) of women attended at least 80% of sessions. | PFMT integrated into aerobic dance class (accompanied by music): 5‐min warm‐up; 30‐min low‐impact aerobics; 15‐min strength training (including PFMT); 5‐min stretching and relaxation. PFMT in a variety of position including sitting, kneeling and standing. Informed of deep abdominal muscle co‐contraction during maximal PFM contraction. |
|
Chiarelli 2002 (mixed prevention and treatment trial) |
Visual inspection of perineum (PFMT group). | Maximum of 6 voluntary PFM contractions per set; 3‐6 sec hold; 3 sets per day; for 8 weeks. | PFMT taught 1‐to‐1 with physiotherapist. 1 (20 min) contact in hospital, and another (30 min) 8 weeks later at home or hospital. | Routine postnatal care; usual postnatal leaflet given; invitation to join postnatal class on ward; no restriction on PFMT if recommended by other health professional. | 84% (292/348) of women in the PFMT group and 58% (189/328) of controls were performing PFMT at "adequate" level at 3 months' postpartum. | Women were "asked if they were performing their PF exercises." |
|
Cruz 2014 (treatment trial) |
Not reported. | 5‐6 biweekly sessions. No specific details provided about PFMT. | Supervised by a physiotherapist. | Similar unsupervised PFMT at home. | Not reported. | Conference abstract. |
|
Dinc 2009 (treatment trial) |
Vaginal digital palpation (both PFMT and control groups). | Progressive PFMT programme. Level 1: 3 sets of 10 near maximal contractions; 3‐sec hold, 3‐sec rest; quick contraction, 1‐sec hold, 1‐sec rest; twice daily. Level 2: 3 sets of 10 near maximal contractions; 5‐sec hold, 5‐sec rest; quick contraction, 2‐sec hold, 2‐sec rest; twice daily. Level 3: 3 sets of 15 near maximal contractions; 10‐sec hold, 10‐sec rest; quick contraction, 2‐sec hold, 2‐sec rest; 3 per day. |
Trained by a researcher on how to do PFMT in accordance with booklet of PFM exercises. | Usual care: instructed on how to perform a correct PFM contraction, but did not receive training about exercises. | Not reported. | In 2nd stage of study, 68% of women in study group were contracting the proper muscle group. The rest were given more training and reassessed 1 week later. |
|
Dokmeci 2008 (mixed prevention and treatment trial) |
Not reported. | Not reported. | Not reported. | Not reported. | Not reported. | Conference abstract. |
| Dufour 2019 (mixed prevention and treatment trial) | Vaginal digital palpation (both PFMT and control groups), to instruct and ensure correct performance of PFM contraction. Performed by two of the investigators. | Recommended to undertake 3 sets of 10 exercises, 3‐4 times a week, for the duration of the intervention period (12 to 16 weeks). As per Mørkved et al 2014, but specific PFMT exercises not stated. In addition, used the iBall (a mobile health device) in conjunction with PFMT. | Supervised individual PFMT at initial session. “Booster” email at the mid‐point of the intervention reminding of benefits of postpartum PFMT and features of the iBall. | PFMT only, without the use of the iBall device. | Not reported. Implied within the discussion that there was a lack of adherence. | No information on the specific PMFT exercises and positions these were performed in |
|
Dumoulin 2004 (treatment trial) |
Not reported. | 8‐12 close to maximal voluntary PFM contraction per set; 6‐ to 8‐sec hold each with 3‐4 fast contractions at the end of each contraction; 6‐sec rest between contractions; 3 sets per day; 5 days per week; for 8 weeks. Also taught 'the knack' (voluntary PFM contraction prior to hard cough and maintained through cough until abdominal wall relaxed). | PFMT taught 1‐to‐1 with physiotherapist. Weekly physiotherapy appointments for 8 consecutive weeks. | Same number of physiotherapy contacts for relaxation massage of back and extremities; asked not to do PFMT at home. | Not reported. | In addition to PFMT 15 min of electrical stimulation (biphasic rectangular form, 50 Hz, pulse width 250 msec, duty cycle 6 sec on and 18 sec off for 1st 4 weeks, then 8 sec on and 24 sec off for next 4 weeks, at maximal tolerated current intensity) and 25 min of electromyographic biofeedback per appointment. |
|
Ewings 2005 (mixed prevention and treatment trial) |
Not reported. | 6 months. | PFMT taught 1‐to‐1 with physiotherapist in hospital. Invitation to attend PFMT class at 2 and 4 months postnatally. | Standard care including verbal promotion of PFMT and leaflet on PFMT. | Of 117 women in the PFMT group, 114 were visited by the physiotherapist in hospital, 21 attended the 2‐month PFMT group, and 5 attended the 4‐month group. | ‐ |
|
Fritel 2015 (mixed prevention and treatment trial) |
Vaginal digital palpation at each session (possibly by physiotherapist, but not stated; PFMT group). | 1 session per week (20‐30 min), total of 8 sessions between 6th and 8th month of pregnancy. Also 'the knack' (voluntary PFM contraction prior to increasing intra‐abdominal pressure). Provided with written information on PF anatomy and PFMT, and encouraged to perform daily PFMT at home, 10‐20 contractions. | Individually supervised by a physiotherapist or midwife at each session. In total, 37 different therapists (all trained by the same specialist physiotherapist) were involved in delivering the exercises. | Usual care, including written information on PF anatomy and PFMT (encouraged to perform daily at home, 10‐20 PFM contractions). | 69.3% (97/140) of women in the PFMT group completed all planned sessions, and 82.8% (116/140) completed at least 1 session (4‐8, median 8). At the end of pregnancy, women in both groups reported a similar frequency and duration of PFMT (including number of contractions). PFMT was performed daily at home by 4.3% (6/140) of PFMT women and 10.6% (15/142) of controls, at the end of pregnancy. | PFMT performed in standing (5 min) and lying (10 min). |
|
Frost 2014 (mixed prevention and treatment trial) |
Not reported. | Standard postpartum discharge instructions plus written and verbal instructions for PFMT. | Not reported. | Standard postpartum discharge instructions. | Not reported. | Conference abstract. |
|
Frumenzio 2012 (mixed prevention and treatment trial) |
Not reported. | 2 weekly session of Kegel exercises; 8 weeks. Daily home exercises (20 min) and stretching. | Not reported. | Did not receive any PFMT, no other details provided. | Not reported. | Conference abstract. |
|
Gaier 2010 (prevention trial) |
Not reported. | 12‐week PFMT programme. | PFMT supervised by a physiotherapist and midwife. | Routine care and PFM exercises, customary instruction at intake visit. | Not reported. | Conference abstract. |
|
Glazener 2001 (treatment trial) |
Not reported. | 8‐10 sessions of fast and slow voluntary PFM contraction per day with aim of 80‐100 per day; for up to 8 months. | PFMT taught 1‐to‐1 with nurse, health visitor or continence advisor. Visited at home at 5, 7 and 9 months' postnatally. | Usual antenatal and postnatal care that may have included advice on PFMT. | 78% (218/278) of women in the PFMT group and 48% (118/244) of controls had done some PFMT in the 11th postnatal month. Mean (SD) number of voluntary PFM contractions per day at 12 months' postnatal: PFMT group 20 (29) and controls 5 (15). | Frequency and urgency strategies added if needed at 7 or 9 months postnatally. 52.7% (394/747) of women at 6 years' follow‐up and 70.1% (471/672) of women at 12 years' follow‐up completed a questionnaire. About 50% of women in PFMT and control groups were performing any PFMT at both time points. Daily PFMT was undertaken by 6% (17/263) of PFMT women compared to 12% (29/253) of control women at 6 years; and 7% (15/227) of PFMT group compared to 8% (20/241) of control women at 12 years. |
|
Gorbea 2004 (prevention trial) |
Surface electromyography (electrodes either side of anus; PFMT group). | 10 voluntary PFM contraction; 8‐sec hold followed by 3 fast, 1‐sec contractions; 6‐sec rest between contractions; for up to 20 weeks. Asked to complete an exercise diary. | PFMT taught 1‐to‐1 with physiotherapist. Clinic appointments (1 hour each) weekly for 8 weeks, then weekly telephone calls. | Requested not to do PFMT during pregnancy or postnatally. | 63% attended all 8 physiotherapy appointments, 21% attended 7 appointments. | Electromyographic biofeedback at each appointment. |
|
Hilde 2013 (mixed prevention and treatment trial) |
Vaginal digital palpation (PFMT and control groups). | Progressive supervised PFM training programme (as per Mørkved 1997) for 16 weeks. Daily PFMT at home, 3 sets of 8‐12 close to maximal contractions. Customary written information on discharge from postnatal ward. Asked to complete an exercise diary. | Supervised exercise class from 6 weeks' postpartum, led by an experienced physiotherapist, once per week for 16 weeks. Class attendance was documented. | Usual care. Received customary written information on discharge from postnatal ward. At 6 weeks were instructed on how to perform a correct PFM contraction (verified with vaginal digital palpation). | 96% (72/75) of women in the PFMT group who completed the trial adhered to 80% of the class and daily home training. In the control group (retrospective questioning), 16.5% reported performing daily PFMT at home ≥ 3 times per week. | 4% (7/175) of women were unable to perform a voluntary PFM contraction at baseline. At baseline (6 weeks' postpartum) more women in the control group were performing PFMT ≥ 3 times or more per week. |
|
Hughes 2001 (mixed prevention and treatment trial) |
Vaginal digital palpation (PFMT and control groups). | Daily; for up to 11 months. | 1 individual session with physiotherapist, and 1 group PFMT session led by physiotherapist at 22‐25 weeks' gestation with maximum of 6 women per group. | Usual antenatal and postnatal care that may have included advice on PFMT (personal communication). | 79% (461/586) of women in PFMT group attended group PFMT session (personal communication). | 3.5% (16/460) of women who attended group PFMT session could not perform a voluntary PFM contraction after teaching, and 2.8% (13/460) of women could contract but not sustain a contraction (personal communication). Conference abstract. |
|
Hyakutake 2018 (mixed prevention and treatment trial) |
Not performed. | PFMT 3 times daily at home starting with 5 contractions (1‐sec hold), progressing to 10 contractions (10‐sec hold), for the rest of their lives. Educated on the benefits of PFMT, how to increase awareness of their perineum and perform PFMT. Provided with a take‐home pack and encouraged to contact a local PF physiotherapist. | A single 2‐hour physician‐led pelvic floor workshop. | Routine prenatal care with their existing maternity care provider (midwife, family physician or obstetrician). Not specifically stated but likely to have received advice on PFMT. | 58.34% of women in the PFMT group and 22.9% of controls had done PFMT at least daily. | Possible additions to PFMT such as vaginal cones or weights and the use on a mobile app were suggested. |
|
Kim 2012 (treatment trial) |
Perineometer (vaginal probe) used to ensure PFM contraction and assess control of contraction in both PFMT and control groups. Unclear if this was performed every session with the PFMT women. | 20 maximal voluntary PFM contractions, 10‐sec hold, 3 times per week; for 8 weeks (as part of a class), and daily at home. Progressed by changing position (prone, sitting and standing). Initial session included information on PFM anatomy and function. Also provided with a booklet which included a training programme and an exercise diary. | Supervised training sessions (1‐hour duration) with a specialist physiotherapist (23 in total, unclear if individual contacts or group classes). | Usual care. Received the same information and demonstration session as PFMT group and instructions on how to correctly perform PFM contraction (perineometer). Unsupervised, daily PFMT for 8 weeks. | Not reported. | PFMT integrated with trunk stabilisation exercises (progressive abdominal strengthening, bridging, and side‐bridge). |
|
Ko 2011 (mixed prevention and treatment trial) |
Observation of inward movement of perineum during contraction (PFMT group). | 3 repetitions of 8 PFM contractions, 6‐sec hold each, 2‐min rest between repetitions; repeated twice daily at home with additional training in groups once per week for 45 min for 12 weeks. Asked to complete an exercise diary. | Group training sessions (10 women) supervised by a physiotherapist once per week for 12 weeks. | Regular antenatal care and the customary written postpartum instructions that did not include PFMT from the hospital. Not discouraged from performing PFMT on their own. |
> 80% attended every training session and 0 were absent more than twice. At 35 gestational weeks, 87% of PFMT group reported practice of PFMT ≥ 75% of the time. |
Group training was performed in sitting and standing positions with legs apart to emphasise specific strength training of the PFM and relaxation of other muscles. |
|
Kocaoz 2013 (prevention trial) |
Observation of inward movement of perineum or digital vaginal palpation, or both (PFMT group). Vaginal digital palpation used to teach PFM contraction in 23.5% (16/68) of women. | 3 sets of 10 maximal voluntary PFM contractions at level 3 (2‐sec hold, 2‐sec rest for strength; 10‐sec hold, 10‐sec rest for endurance); 3 sessions per day during pregnancy and postpartum. Women received education about the anatomy and functions of the PFM and PFMT (unclear from whom) and were asked to complete an exercise diary (including progressions). | Exercise compliance was checked at every hospital visit (9‐10 visits on average, over a minimum of 12 weeks), and pregnant women were called once per month to encourage regular exercise. | Not instructed to do PFMT. Once data collection complete, controls received PFMT and a brochure with the relevant information during the 12th week home visit. | Women asked to record the number of times they did their exercises. No data reported. | Vaginal digital palpation was refused by 52/68 women due to concerns about pregnancy, cultural/religious reasons. Unclear if women progressed through levels 1‐3 or started at level 3, whether they did 3 sets of 10 exercises per day or 3 sets of 10 exercises 3 times per day, or how the sets were divided between endurance and strength training. |
|
Kou 2013 (mixed prevention and treatment trial) |
Not reported. | PFM (Kegel) exercises undertaken 2‐3 times per day for 20‐30 min or 150‐200 contractions (3‐sec hold then relax), performed until 12 months' postpartum. Biofeedback used twice per week (no further details available). | Not reported who supervised the programme, or the number and type of contacts with health professional(s). | Usual care: received standard postpartum information. | Not reported. | Translation (Chinese). |
|
Liu 2011 (mixed prevention and treatment trial) |
Not reported. | PFMT 2‐3 times per day, 15‐30 min each set (4‐ to 6‐sec hold, 10‐sec relaxation), started after birth and continued for ≥ 10 weeks. | Exercises taught by experienced midwives who also supervised the programme (number and type of contacts/visits unclear). | Usual care: standard postpartum information. Unclear if this included PFMT. | Not reported. | Translation (Chinese). Positions of exercises included supine, sitting or any other position, with legs slightly separated, with instructions to contract anus, vaginal and urinary tract while breathing in, and to relax with expiration. |
|
Meyer 2001 (mixed prevention and treatment trial) |
Not reported. | Up to 8 months; no details of PFMT provided. Each clinic session was followed by 20 min of biofeedback and 15 min of electrical stimulation. | 12 sessions (6 weeks) with a physiotherapist between 2 and 10 months postnatally. | No intervention. Women received PFMT education after 3rd assessment at 10 months' postpartum. | Not reported. | In addition to PFMT, 20 min of biofeedback and 15 min of electrical stimulation (vaginal electrode, biphasic rectangular waveform, pulse width 200‐400 msec, frequency 50 Hz, intensity 15‐15 mA, contraction time 6 sec, rest time 12 sec) per appointment. |
|
Miquelutti 2013 (mixed prevention and treatment trial) |
Instructed on correct contraction, but not verified (due to pragmatic nature of study). | PFMT (maximal rapid and sustained PFM contractions) performed as part of a class (50 min) for a median of 5 (range 2‐10) sessions between 18‐24 weeks' to 36‐38 weeks' gestation. Provided with an exercise guide and asked to do daily PFMT at home (30 rapid, 20 sustained (10‐sec hold) contractions), as well as 30‐min daily aerobic exercise (no specific examples provided). Received standard antenatal education and asked to complete an exercise diary. | Supervised by a trained study physiotherapists on a monthly basis. Either group or individual training sessions, depending on the number of women present. | Usual care: received standard antenatal and postnatal education (on labour, breastfeeding and pain relief) by trained physiotherapy, nursing and medial staff. | Analysis of adherence in intervention group was not possible as women failed to complete or return their exercise diaries. | PFMT performed in standing and sitting position. PFMT integrated into non‐aerobic exercise programme designed to reduce back pain. Included abdominal, stretching and relaxation exercises and exercises designed to promote venous return. |
|
Mørkved 2003 (mixed prevention and treatment) |
Vaginal digital palpation and observation of perineum (both PFMT and control groups). | 8‐12 near maximal voluntary PFM contractions; 6‐ to 8‐sec hold each, 3‐4 fast contractions at the end of each contraction; 6‐sec rest between contractions; twice daily at home; for ≤ 8 months. Also asked to attend weekly 60‐min PFMT class for 12 weeks. Women asked to complete an exercise diary. | Group training session (10‐15 women), once per week for 12 weeks, supervised by physiotherapists (5 in total). | Usual antenatal and postnatal care that may have included advice on PFMT. Correct PFM contraction verified. Not discouraged from doing PFMT on their own. | 19% (28/148) of PFMT women attended less than half the 12 weekly PFMT classes and did not return training diaries. | During exercise class voluntary PFM contraction undertaken in a range of body positions (lying, sitting, kneeling and standing with legs apart). PFMT interspersed with abdominal, back and thigh muscle exercises (accompanied by music). 62% (188/280) of women completed a questionnaire at 6‐year follow‐up, and 45% of women in both the former PFMT and control groups were doing PFMT at least weekly. |
|
Oakley 2016 (mixed prevention and treatment trial) |
Vaginal digital palpation (both PFMT and control groups), electromyography, and anorectal manometry used to confirm absence or presence of PFM contraction. Performed by two of the investigators. | Four PFMT sessions (60 min), every 2 weeks, beginning at 6 weeks’ postpartum (i.e. weeks 6, 8 10 and 12) combined with behavioural therapy. PF and core muscle neuromuscular, strength and endurance techniques; PF and rectus diastasis protection techniques. Home exercise component, and women also received routine postnatal care with their primary obstetrician and gynaecologist. | Unclear if a group or 1‐to‐1 session. | Usual care, with included routine postnatal care from their see primary obstetrician and gynaecologist. | Not reported | Independent to the study, 54.0% (combined groups) reported not receiving any instructions on PFMT and/or behavioural therapy; 46.0% received behavioural therapy and 16.0% had received instruction on PFMT from other health professionals. No differences were noted between groups. |
|
Peirce 2013 (mixed prevention and treatment trial) |
Contraction assessed with anal biofeedback as part of training session (by obstetrician or specialist nurse); PFMT group. | Sets of 10 PFM contractions (Kegel exercises), 5‐sec hold; 10‐sec rest between contractions; twice daily for 5 min with biofeedback; for 3 months. Standard postpartum education by midwives or physiotherapists, including written information. Women asked to complete an exercise diary. | Biofeedback (electromyographic) training provided at initial session, but no further contact with health professionals. | Usual care: "conventional PFM training," but no details provided. Women asked to complete an exercise diary. | Poor adherence defined as performing < 70% of the intended home exercise sessions. 7/30 women in the PFMT group reported poor adherence. | The portable biofeedback machines were programmed to the electromyography setting with the work period set to 10 contractions (5‐sec duration) with a 10‐sec rest between each contraction. PFMT for treatment of FI. |
|
Pelaez 2014 (prevention trial) |
Instructed on correct contraction, but not formally verified. Women were asked to test themselves at home by stopping the flow of urine, vaginal digital palpation or using a mirror to observe the perineum (PFMT group). | PFMT programme, 3 times per week; for ≥ 22 weeks. Started with 1 set of 8 contractions increasing to 100; divided into different sets of slow (6 sec) and fast (5 as fast as possible) contractions. Unclear if this progression related to class or home exercises. Daily PFMT at home, 100 contractions in different sets. Received standard antenatal education about PFM. | Group training sessions (8‐12 women) designed and supervised by a physical activity and sport sciences graduate; 55‐ to 60‐min duration (10 min of PFMT); 70‐78 sessions in total. | Usual care: follow‐up by midwives, standard information about PFMT. Women were not asked not to do PFMT. | All women included in analysis attended ≥ 80% of exercise sessions. | PFMT integrated into supervised exercise programme; 30 min low‐impact aerobics including general strength training, PFMT and cool down (stretching, relaxation or massage); sometimes accompanied by music. PFMT in a variety of positions. Women wore heart rate monitors to control exercise intensity. |
|
Reilly 2002 (prevention trial) |
Unclear, but seems likely as physiotherapists gave individualised programmes to those unable to follow exercise regimen due to inability to do voluntary PFM contraction (PFMT group). | 8‐12 voluntary PFM contractions; 6‐sec hold each; 2‐min rest between each set of contractions; 3 sets of 8‐12 contractions twice daily; for about 20 weeks (as described by Bø 1995). Also asked to do voluntary PFM contraction with every cough and sneeze, and complete an exercise diary. | About 5 (monthly) contacts with physiotherapist between 20 weeks' gestation and delivery. | Usual antenatal and postnatal care that may have included advice on PFMT. Women appeared to have had same number of clinic visits as the PFMT group, and were asked if doing PFMT at each of these visits. | 43% (52/120) of women in the PFMT group did not return an exercise diary; 11% (13/120) completed < 28 days of PFMT; and 46% (55/120) completed ≥ 28 days. When asked postnatally, 28% (33/120) of PFMT women and 34% (37/110) of controls were doing occasional or no PFMT. | If unable to follow PFMT regimen then individualised programme until able to do so. 71% (164/230) of women completed a telephone questionnaire at 8‐year follow‐up, and 68.4% of women were doing PFMT, with 38% stating they were doing PFMT twice or more per week. |
|
Sacomori 2019 (mixed prevention and treatment trial) |
Assessed PFM muscles using visual inspection (PFMT group). | PFMT at home, 10 sets of up to 10‐sec holds (contraction starts lightly and intensifies until a maximal contraction is reached) [Strength and endurance]. Five (1 sec) fast and strong contractions [Strength]. Also taught to perform the “knack”, before and during a sneeze or cough. PFMT performed twice daily at home. Received verbal and written educational information about PF anatomy, physiology, PF dysfunction and PFMT. | One 1‐to‐1 session with a “pelvic floor specialist” who “was certified to participate in the study only after demonstrating total competence and understanding of the execution of PFM assessment and PFMT”. | No PFMT. Women did not receive any kind of intervention or PFMT as this is usual clinical practice in Brazil. | 55 (85.1%) women reported overall adherence to PFMT. 22 (32.3%) performed exercises 1‐2 times per week and 33 (49.3%) did so 3‐7 times per week. 33 (49.3%) performed both strength and endurance training, 14 (20.9%) only strength training and 10 (14.9%) focused only on endurance training. 21 (31.3%) performed PFMT for 3 months postpartum, others for around 2 months 38 (39.2%) multiparous and 23 (31.9%) primiparous women adhered to PFMT | Researchers made up to ten attempts to contact participants by phone for follow‐up at 3 months’ postpartum. |
|
Sampselle 1998 (mixed prevention and treatment trial) |
Yes, but unclear how or by whom (PFMT group). | PFMT tailored to individual ability. 30 maximal or near maximal voluntary PFM contraction per day; for ≤ 17 months. | Not reported. | Usual antenatal and postnatal care; no systematic PFMT programme. | At 35 weeks' gestation, 85% of women in the PFMT group reported to be doing PFMT 75% of the time. At 1 year, PFMT adherence reported to vary between 62% and 90%. | ‐ |
|
Sangsawang 2016 (treatment trial) |
Assessed by ability to stop or slow the flow of urine for 1‐2 sec (PFMT group). | 20 sets of PFM exercises, twice daily, at least 5 days per week, for 6 weeks. 1 set of PFM exercises was 1 slow contraction (10‐sec hold), followed by 10 fast contractions; no progression in number of contractions per set. Also received a handbook with information on stress UI, PFM function, instructions on PFMT and a urinary diary. | Supervised group sessions (4‐5 women) with a midwife; 45 min; once every 2 weeks for 6 weeks (3 sessions in total). | Usual care: from health professionals, obstetricians or midwives. Did not receive information about UI and received no training support about performing correct PFM exercises. | No women were excluded for failing to perform the PFMT for < 28 (of approximately 42) days. | PFMT performed in various positions including lying down, sitting and standing. |
|
Skelly 2004 (treatment trial) |
Not reported. | Not reported. | "One to one teaching about pelvic floor exercises." | "Conventional care (hand‐out information about pelvic muscle exercises)." | Not reported. | Conference abstract. |
|
Sleep 1987 (mixed prevention and treatment trial) |
Not reported. | As for controls with additional section in leaflet recommending a specific exercise each week that integrated voluntary PFM contraction with usual activities of daily living; up to 3 months. Asked to complete a daily exercise diary for 4 weeks. | 1‐to‐1 session with midwife co‐ordinator each postnatal day in hospital. | Usual antenatal and postnatal care including PFMT leaflet; might include PFMT at antenatal class or postnatal class on ward (or both); instructed to do voluntary PFM contraction as often as remembered and mid‐stream urine stop. | At 10 days postnatally, 78% of PFMT group and 68% of controls were doing some PFMT; with 58% of PFMT group and 42% of controls doing some PFMT at 3 months. | ‐ |
|
Stafne 2012 (mixed prevention and treatment trial) |
Vaginal digital palpation (PFMT group). | 8‐12 near maximal voluntary PFM contractions; 6‐ to 8‐sec hold each with 3 fast contractions at the end of each contraction. Asked to perform PFM exercises as part of a 45‐min home programme at least twice per week or a weekly 60‐min exercise class (or both). Received written information including brochure with an evidence‐based PFMT programme, and asked to complete an exercise diary. | Group training sessions (8‐15 women) supervised by physiotherapist, 60 min, once per week for 12 weeks | Usual care: received customary information from midwife or GP. Also given a detailed information brochure including evidence‐based PFMT programme. Women were not discouraged from exercising. | Adherence to the general exercise protocol (exercising ≥ 3 days per week, moderate to high intensity) was 55% (217/397) in the PFMT group and 10% (36/365) in the control group. 67% of the PFMT group performed PFMT ≥ 3 times per week compared to 40% in the control group | PFMT integrated into standardised exercise programme: 30‐ to 35‐min low‐impact aerobics; 20‐ to 25‐min strengthening exercises (including PFMT, 3 sets of 10 reps); 5‐ to 10‐min stretching and relaxation. PFMT performed in a variety of positions, with legs apart to emphasise specific strengthening of the PFM. |
|
Stothers 2002 (prevention trial) |
Not reported. | 12 contractions, 3 times daily. | Seen twice monthly throughout pregnancy, and every 3 months postnatally for 1 year. | "Other (placebo) including no pelvic floor exercises." | Not reported. | Conference abstract. |
| Sut 2016 (mixed prevention and treatment trial) | Not reported. Instructions provided on how to perform exercises but did not report if correct performance of contractions were confirmed. | Home PFMT programme. Instructed to contract PFM by “pulling inward as with urine or gas output” and hold for 10 sec. Then relax completely after 10sec of contraction. Three sets of 10 exercises, 3 times daily at home. | Participants instructed by a researcher on how to perform Kegel exercises. Participants in the PFMT group were called by telephone at two‐week intervals to remind to perform exercises. | No intervention: “no instruction was given to the patients in the control group”. | Not reported | Participants instructed that bladder must be emptied prior to exercise, with exercises done in supine or sitting (bending the legs at the knee). |
| Szumilewicz 2019 (mixed prevention and treatment trial) | Correct contraction confirmed by EMG biofeedback (PFMT groups). | Progressive PFMT for 5‐10 min as part of strength training within a 60‐min group exercise class. Week 1 (quick flicks): 5 x 10 short contractions with 30‐sec rest between sets (5 min). Week 2 (stacking): a/a but each repetition contains 3 increasingly stronger contractions. Week 3 (endurance): a/a, maintaining a sustained hold and gradually extending from 3 to 10 sec), before slowly relaxing, 3 x 10, 30‐sec rest between sets (10 min). Week 4 (high‐intensity): a/a, maintaining hold until feeling tired, then 3 x 5 pulsating ticks before relaxing. 5 repetitions max hold, 10 sec between repetitions, 30 sec between sets. Week 5 (complex activation): 5 quick maximal contractions, with 5‐sec rest between contractions, 5 repetitions, (10‐sec hold, 10 sec pause) sustained for 60 sec then relax. 3 times, 30‐sec rest between sets. Week 6 (maintenance): performance of regular tasks as for week 4. 5 repetitions in series, with 10‐sec rest between, maintenance of maximal hold (> 10 sec) Extended with short pulsating contractions, at least 2 sets with 30‐sec rest between sets. Women encouraged to attend 3 sessions per week for 6 weeks. | Supervised exercise sessions led by a certified pregnancy and postnatal exercise specialist whose competencies met the European educational standard for this profession. The principle researcher checked the quality of exercise programme implementation once every 2 weeks. | No PFMT. | Email and phone contact were used to ensure adherence. The exercise specialist checked and registered attendance for each session. “On average, women from the experimental group attended 13±3 exercise sessions (from a maximum of 18), which constituted 71±19% of the planned exercise program.” | “During the study, participants were lying supine with hips flexed and knees bent to approximately 90° |
|
Torsdatter Markussen 2017 (mixed prevention and treatment trial) |
Digital vaginal palpation to ensure correct PFM contraction by a gynaecologist, and instruction provided on correct PFM contraction (PFMT and control groups). | PFMT included as part of resistance training (25 min) within a 60‐min group exercise class or individual session. PFMT consisted of 3 x 10 reps of 6‐8 sec sustained maximum contractions, followed by 3‐5 quick contractions, with 1 min rest between sets. Women encouraged to attend 3 sessions per week from study inclusion to delivery, and to do the same programme at home at least once per week, and daily home PFMT (same parameters as above). All were invited to attend a 30 min motivational interview session at the beginning of the training period and received a standardised pamphlet containing general advice including PFMT | Supervised by a physiotherapist. | Usual care which consisted of 8 routine prenatal visits to midwife and/or general practitioner and a routine ultrasound at 8 weeks. Women were not told to restrain from exercise, physical activity or PFMT. Received standardised pamphlet containing general advice including PFMT. | Performance of home PFMT ≥ 3 times per week: 70% (n= 14) of PFMT and 52% (n = 12) of control women at late pregnancy; 50% (n =9) of PFMT and 41% (n = 9) of control women at 3 months’ postpartum. Median number of PFM contractions daily was 20 (min‐max 0‐80) in the PFMT group, and 12.5 (min‐max 3‐60) in the control group at 3 months’ postpartum. | PFMT could be performed in standing, kneeling on all fours or sitting (based on personal preference, progression of skill or improved strength). Women were instructed to “pull up and hold the pelvic floor, hold, hold, hold! Release slowly”. |
|
Wen 2010 (mixed prevention and treatment trial) |
Assessment of PFM strength and contraction by an obstetrician (PFMT group; no further details) | Anal contraction; 3‐sec hold (while inhaling) followed by relaxation with 3‐5 faster contractions at the end of each contraction; 15‐30 min each set; twice daily; 6‐8 weeks. | Exercises taught by experienced midwives but unclear who supervised the programme of the number and type of contacts/visits. | Usual care: no other details provided other than "conventional guidance." | Not reported. | PFMT performed in a variety of positions including lying down, sitting or standing. Translation (Chinese). |
|
Wilson 1998 (treatment trial) |
Not reported. | Mix of fast and slow voluntary PFM contractions 8‐10 times per day with aim of 80‐100 voluntary PFM contraction daily; up to 9 months. | 1‐to‐1 sessions with physiotherapist at 3, 4, 6 and 9 months postnatally. | Usual PFMT as taught in antenatal and postnatal classes. | Mean (95% CI) number of daily voluntary PFM contraction at 12 months' postnatally was 86 (69‐104) in the PFMT group and 35 (30 to 40) in the control group. | Perineometry for biofeedback at each appointment. Mean time to teach PFMT to the PFMT group was 32 (95% CI 30 to 34) min. |
| Woldringh 2007 (treatment trial) | Observation and palpation of perineal body by physiotherapists. Women also encouraged to practice self‐palpation (PFMT group). | Not reported. At each visit, women were asked about the frequency and duration of PFMT. | 1‐to‐1 30‐min sessions with physiotherapist. 4 in total: 3 antenatally and 1 at 6 weeks postnatally. In total, 25 physiotherapists (specialised in PFMT) were involved in delivering the exercises. | Usual antenatal and postnatal care including advice on PFMT; nearly two‐thirds received some instruction on PFMT. Women were also asked the same questions about frequency and duration of PFMT as the PFMT group | At 35 weeks' gestation, 6% reported no PFMT, 17% reported some PFMT, 40% were doing PFMT at low intensity and 37% were exercising intensively in the PFMT group vs 36% reported no PFMT, 25% reported some PFMT, 26% were doing PFMT at low intensity and 14% were exercising intensively in the control group. | ‐ |
|
Yang 2017 (mixed prevention and treatment trial) |
Digital vaginal palpation to ensure correct PFM contraction (PFMT group). | PFMT (1): PFMT performed at home, 2‐3 times per day, as described by Jonasson and colleagues 1989. Instructed to shrink hypogastria, perineum and anal muscles for 5 sec while inhaling; relax while exhaling for 5 sec. PFMT (2): In addition to PFMT, this group also received electrical stimulation for 30 min, 3 times per week beginning at 6 weeks’ postpartum (approximately 15 sessions in total). | PFMT (1): One 1‐to‐1 PFMT at 2 days’ postpartum, taught by specialised staff members (each training session went for 20 min with the exercises performed 6 times per min). PFMT (2): As above plus 1‐to‐1 supervised sessions of electrical stimulation with specialised training staff. | No PFMT, unclear if instructed not to perform PFMT. At 2 hours postpartum, two specialised training staff provided 1 hour of routine postpartum guidance. | Three cases failed to complete the PFMT in accordance with the prescribed frequency and timing in the training group. | Kegel exercises were performed in supine, legs unbent, hands placed at sides. |
CI: confidence interval; FI: faecal incontinence; min: minute; PF: pelvic floor; PFM: pelvic floor muscle; PFMT: pelvic floor muscle training; SD: standard deviation; sec: second; UI: urinary incontinence.
First, the PFMT programmes were classified by their possible physiological effect(s) (strength, endurance, co‐ordination or a combination), based on the described exercise parameters. Second, the amount of contact or supervision from health professionals (low fewer than five contacts; moderate six to 12 contacts; high more than 12 contacts); confirmation of a correct PFM contraction and nature of the control interventions were examined. Third, adherence data were considered to assess whether exercise behaviour was likely to support a physiological effect. Trials were classified according to whether they provided data for both the intervention and control groups, the intervention group only, or neither group. The likely impact of the exercise programmes on PFM function and the clinical difference between the intervention and control conditions are considered in the Discussion.
We categorised 14 trials as providing strength training and nine as probably strength training trials. Fourteen trials clearly provided exercise parameters that favoured strength training; short duration contractions of maximal or near maximal effort and a relatively small number of repetitions (Ahlund 2013; Bø 2011; Dinc 2009; Dumoulin 2004; Hilde 2013; Kim 2012; Kocaoz 2013; Miquelutti 2013; Mørkved 2003; Sacomori 2019; Sampselle 1998; Stafne 2012; Szumilewicz 2019; Torsdatter Markussen 2017). The exercise protocol described by Bø 1995 was the PFM strength training protocol on which the trials by Bø 2011, Mørkved 2003, and Dumoulin 2004 were based. Supervised treatment duration was only six to eight weeks in the trials by Dumoulin 2004, Kim 2012 and Szumilewicz 2019, and this might have been insufficient for muscle hypertrophy to be established. In addition to strength training, three studies (Dumoulin 2004, Sacomori 2019, Szumilewicz 2019) included some co‐ordination type training. Women were encouraged to perform voluntary PFM contraction in conjunction with rises in intra‐abdominal pressure, such as with coughing or sneezing, also known as 'the knack' (Miller 2008). Kim 2012 included trunk stabilisation exercises. With regard to contact with health professionals, this was low in three trials (fewer than five contacts) (Ahlund 2013; Miquelutti 2013, Sacomori 2019), moderate (six to 12 contacts) in four (Dumoulin 2004; Kocaoz 2013; Mørkved 2003; Stafne 2012), and high (more than 12 contacts) in five (Bø 2011; Hilde 2013; Kim 2012; Szumilewicz 2019; Torsdatter Markussen 2017). Six trials stated that PFMT was supervised in an exercise class (Bø 2011; Hilde 2013; Mørkved 2003; Stafne 2012; Szumilewicz 2019; Torsdatter Markussen 2017). Eleven trials confirmed a correct voluntary PFM contraction prior to training (Ahlund 2013; Dinc 2009; Hilde 2013; Kim 2012; Kocaoz 2013; Mørkved 2003; Sacomori 2019; Sampselle 1998; Stafne 2012; Szumilewicz 2019; Torsdatter Markussen 2017). Six of these also confirmed a correct contraction in the control group along with provision of usual antenatal and postnatal care (Ahlund 2013; Dinc 2009; Hilde 2013; Kim 2012; Mørkved 2003; Torsdatter Markussen 2017). In the remaining eight trials, the control conditions were no PFMT (Sacomori 2019), or usual care, which may or may not have included PFMT or no PFMT as controls were asked not to train (Bø 2011; Dumoulin 2004; Kocaoz 2013; Miquelutti 2013; Sampselle 1998; Stafne 2012; Szumilewicz 2019). With regard to adherence, seven trials reported some information about exercise behaviour and five of these compared group exercise classes and home PFMT versus usual care (Bø 2011; Hilde 2013; Mørkved 2003; Stafne 2012; Torsdatter Markussen 2017). The other two trials with adherence data compared standardised instruction and home PFMT with usual care (Sampselle 1998), or no PFMT (Sacomori 2019). In Stafne 2012, 67% of the PFMT group performed home PFMT at least three times per week compared to 40% of controls in late pregnancy. At six months' postpartum, Hilde 2013 found that 96% of the PFMT group who completed the trial adhered to 80% of the class and daily home training, whereas 16.5% of controls reported daily PFMT at home, three or more times per week. At three months' postpartum Torsdatter Markussen 2017 reported adherence to the home PFMT (three times a week) was nine women in each group (91 women randomised). The other four trials reported data only for the intervention group, with adherence to PFMT of about 50% (Sacomori 2019), 70% (Bø 2011) and 80% (Mørkved 2003), or 85% of PFMT women doing PFMT 75% of the time (Sampselle 1998).
Nine trials described PFMT programmes that were characteristic of strength training but did not mention loading (effort) (Assis 2015; Chiarelli 2002; Dufour 2019; Gorbea 2004; Hyakutake 2018; Ko 2011; Peirce 2013; Reilly 2002; Sut 2016). Three trials referenced the exercise protocols of other authors. Reilly 2002 cited Bø 1995 (strength and load training), Ko 2011 cited Reilly 2002 and Dufour 2019 cited Mørkved 2014 (strength training). The supervised treatment duration was only six to eight weeks in two trials (Chiarelli 2002; Hyakutake 2018), and this may have been insufficient for muscle hypertrophy to be established. In addition to strength training, women undertook some co‐ordination type training, daily biofeedback or participated in a weekly exercise class supervised by a physiotherapist (Dufour 2019; Ko 2011; Peirce 2013; Reilly 2002). In three trials, the control groups did not exercise (Assis 2015; Gorbea 2004; Sut 2016). In the other six trials, controls were randomised to usual care which may or may not have included PFMT (Chiarelli 2002; Ko 2011; Hyakutake 2018; Peirce 2013; Reilly 2002) or PFMT (Dufour 2019). A correct PFM contraction for women in the exercise group was confirmed in six of the nine trials (Assis 2015; Chiarelli 2002; Dufour 2019; Gorbea 2004; Ko 2011; Peirce 2013). Only one of the control groups appeared to have confirmation of a correct contraction (Dufour 2019). With regard to adherence, five of the nine trials reported some information about exercise behaviour (Chiarelli 2002; Gorbea 2004; Ko 2011; Peirce 2013; Reilly 2002). Seven trials offered individual supervision (Assis 2015; Chiarelli 2002; Dufour 2019; Gorbea 2004; Peirce 2013; Reilly 2002; Sut 2016). Two offered one or more group sessions (Hyakutake 2018; Ko 2011). At three months' postpartum, Chiarelli 2002 reported that more women in the PFMT group (84%) compared to controls (58%) were doing "adequate" PFMT. Similarly, in Reilly 2002, about 75% of the PFMT group and 66% of the control group were doing more than occasional or no PFMT (27.5% in the PFMT group and 34% in the control group reported occasional or no PFMT). During the antenatal intervention period, nearly half the women in the PFMT group exercised for 28 days or more (which is approximately once per week over 20 weeks). The other three trials reported data only for the intervention group, with two reporting that over 80% of women attended most or all supervised visits (Gorbea 2004; Ko 2011). Ko 2011 and Peirce 2013 reported that more than three‐quarters of women in the PFMT group completed 70% or more of the prescribed exercise.
There was insufficient detail in the other 23 trials to classify them as providing strength or endurance training.
Seven trials provided some information about PFMT but could not be categorised (Glazener 2001; Kou 2013; Liu 2011; Pelaez 2014; Sangsawang 2016; Wen 2010; Wilson 1998). None had any description of effort (i.e. load). Supervised treatment was only six to eight weeks in two trials and this might have been insufficient for muscle hypertrophy to be established if strengthening was intended (Sangsawang 2016; Wen 2010). Five of the seven trials included variously described mixes of fast and slow contractions with relatively large numbers of sets (eight to 10 per day) and few repetitions per set (about 10) or exercise sets of 15‐ to 30‐minute duration (Glazener 2001; Pelaez 2014; Sangsawang 2016; Wen 2010; Wilson 1998). Overall, all appeared to recommend a large number of contractions per day (more than 100) or a minimum of 30 minutes of PFMT per day. The programmes might have affected strength or endurance, or both, depending on the number of contractions performed daily and the amount of voluntary effort with each contraction. The amount of contact with healthcare providers varied. In two trials, women participated in group exercise sessions, either three groups over a period of six weeks or a total of 70 to 80 groups over 22 weeks (Pelaez 2014; Sangsawang 2016). In another two trials, women had one‐to‐one sessions with health professionals, with three or four visits spread over eight to nine months (Glazener 2001; Wilson 1998). In three trials, the number and duration of contacts with healthcare providers was unknown (Kou 2013; Liu 2011; Wen 2010), although it is possible this was twice per week in the trial that included biofeedback (Kou 2013). Only three trials mention confirmation of correct PFM contraction, being verified by an obstetrician or by the women themselves using self‐palpation, mirror observation of the perineum or mid‐stream urine stoppage (Pelaez 2014; Sangsawang 2016; Wen 2010). In all trials, the control group received usual care that may have included advice or opportunities to do PFMT (e.g. in an antenatal class), with the exception of Sangsawang 2016, where women received usual care but no information on urinary incontinence or PFMT. Four trials provided some adherence data. The women in the trials by Glazener 2001 and Wilson 1998 were supervised individually and performed significantly more voluntary PFM contractions per day at 12 months' postpartum in the PFMT groups. The mean number of contractions was 20 (standard deviation (SD) 29) and 86 (95% CI 69 to 104) per day in PFMT women, and 5 (SD 15) and 35 (95% CI 30 to 40) per day in control women. Glazener 2001 followed up women for six years after the index delivery. Similar proportions of women in both groups were doing some PFMT, 50% (132/263) in the intervention group and 50% (127/253) in the control group. The other two trials offered group supervision and reported adherence data for the training groups only. Pelaez 2014 reported that all PFMT women attended at least 80% of the exercise sessions (approximately 70 to 78 in total). In the trial by Sangsawang 2016, it appeared that all women had done PFMT for 28 days (of 42 in total).
Sixteen trials did not specify any details of the PFMT received by intervention group (Barakat 2011; Cruz 2014; Dokmeci 2008; Ewings 2005; Fritel 2015; Frost 2014; Frumenzio 2012; Gaier 2010; Hughes 2001; Meyer 2001; Oakley 2016; Skelly 2004; Sleep 1987; Stothers 2002; Woldringh 2007; Yang 2017). Eight of these were conference abstracts (Cruz 2014; Dokmeci 2008; Frost 2014; Frumenzio 2012; Gaier 2010; Hughes 2001; Skelly 2004; Stothers 2002). Five trials mentioned that women were asked to do daily PFMT at home (Fritel 2015; Frumenzio 2012; Hughes 2001; Stothers 2002; Yang 2017). One trial asked women to complete a daily exercise diary (Sleep 1987). Most trials provided one or more one‐to‐one supervisory sessions with a health professional, two invited women to one or two additional group sessions (Ewings 2005; Hughes 2001). Barakat 2011 provided PFMT within approximately 85 exercise classes over the course of pregnancy. Five trials confirmed a correct PFM contraction either by vaginal digital palpation or observation and palpation of the perineal body (Fritel 2015; Hughes 2001; Oakley 2016; Woldringh 2007; Yang 2017). The control conditions were: no PFMT (Frumenzio 2012; Meyer 2001; Stothers 2002), usual care (which may or may not have included advice on PFMT) (Frost 2014; Gaier 2010; Hughes 2001; Oakley 2016; Skelly 2004; Yang 2017), usual care that included advice about PFMT (Ewings 2005; Sleep 1987; Woldringh 2007), and PFMT at home (Cruz 2014; Fritel 2015). In two trials, the control condition was unclear (Barakat 2011; Dokmeci 2008). In five of the 16 trials, no information was provided about adherence, or the number of contacts with health professionals in either the intervention or control groups (Cruz 2014; Dokmeci 2008; Frost 2014; Frumenzio 2012; Gaier 2010). All were abstracts. Six of the 16 trials provided some information about exercise behaviour (Barakat 2011; Ewings 2005; Fritel 2015; Hughes 2001; Sleep 1987; Woldringh 2007). Three trials reported adherence data for both the intervention and control groups (Fritel 2015; Sleep 1987; Woldringh 2007). In the trial by Fritel 2015, 69% of women in the PFMT group completed all eight supervised weekly exercise sessions and 83% completed at least one. Fewer women in the PFMT group (4.3%) compared to controls (10.6%) were doing daily exercise at home at the end of pregnancy. Woldringh 2007 reported that 37% of the PFMT women were exercising intensively, compared to 14% of controls, at 36 weeks' gestation. Similarly, at three months' postpartum, Sleep 1987 reported that more women in the PFMT group (58%) compared to controls (42%) were doing some PFMT. The other three trials provided data only for the intervention group (Barakat 2011; Ewings 2005; Hughes 2001). Barakat 2011 reported "adherence to training in the experimental group was 90%" (a mean of 85 sessions in total) and Hughes 2001 (personal communication) observed that 79% of women assigned to PFMT attended the single group training session. In contrast, Ewings 2005 invited PFMT women to attend a class at two and four months postnatally and, of the 117 women, only 18% attended at two months and 4% attended at four months.
Outcome measures
Thirty‐one of the 46 trials clearly stated the primary outcome(s) of interest in the trial. In 17 trials, it was self‐reported urinary incontinence (Assis 2015; Bø 2011; Chiarelli 2002; Cruz 2014; Ewings 2005; Fritel 2015; Glazener 2001; Gorbea 2004; Hilde 2013; Ko 2011; Kou 2013; Mørkved 2003; Pelaez 2014; Reilly 2002; Sangsawang 2016; Skelly 2004; Stafne 2012). Three used the International Consultation on Incontinence Questionnaire‐Short Form (ICIQ‐SF) (Cruz 2014; Fritel 2015; Pelaez 2014). Three trials used loss of urine under stress test (Dumoulin 2004; Kocaoz 2013; Stothers 2002). One trial used the Bristol Female Lower Urinary Tract Symptoms (BFLUTS; 34 question tool, higher score worse) questionnaire, quality of life domain (Kim 2012). One trial used the Faecal Incontinence Quality of Life (FIQOL) questionnaire (Oakley 2016). One trial combined data from a urinary diary and questionnaire to give an incontinence severity score (Woldringh 2007). One trial used the unspecified "urinary condition score" (Liu 2011). Three trials used a measure of PFM performance (Ahlund 2013; Sut 2016; Szumilewicz 2019). One used PFMT adherence (Sacomori 2019). One used PFMT knowledge (Hyakutake 2018). One trial used the occurrence of traumatic tears and use of episiotomy (Gaier 2010). One trial used weight gain during pregnancy (Torsdatter Markussen 2017).
While there was some consistency in the choice of outcome measures by trialists, the differences in the measures or the way the data were reported limited the possibilities for combining results from individual trials.
Some trials measured outcomes at more than one time point, usually in trials where PFMT began antenatally. There were some differences in the timing of outcome measures but, for the meta‐analysis, timing seemed to fall into the following clinical categories:
late pregnancy (from 20 weeks' gestation up to delivery);
early postnatal (zero to three months after delivery);
mid‐postnatal (more than three to six months after delivery);
late postnatal (more than six to 12 months after delivery);
medium term (more than one to five years after index delivery);
long‐term (more than five to 10 years after index delivery); and
very long‐term (more than 10 years after index delivery).
Only three trials reported long‐term results after the first year (Glazener 2001; Mørkved 2003; Reilly 2002).
Excluded studies
Fifty‐two trials were excluded for the following reasons. More information can be found in the Characteristics of excluded studies.
Thirty‐eight studies did not collect any urinary or faecal incontinence outcome data (Agur 2005; Assis 2013; Barakat 2014; Barakat 2016; Barakat 2018; Brik 2019; Dias 2011; Dias 2018; Dieb 2017; Domingues 2015; Dougherty 1989; El‐Shamy 2018; Golmakani 2015; Hou 2010; Huang 2014; Iervolino 2017; Lekskulchai 2014; Leon‐Larios 2017; Li 2010; Liu 2013; Mahmoodi 2014; Min 2019; Morin 2015; Nielsen 1988; Norton 1990; Oblasser 2016; Okido 2015; Perales 2015; Perales 2016; Pourkhiz 2017; Ruiz 2013; Santos‐Rocha 2015; Siva 2014; Teymuri 2018; Thorp 1994; Wang 2014; Wilson 2015; Zhu 2012). Two studies recruited postnatal women more than three months after their most recent delivery (Johannessen 2017; Khorasani 2017).
Three trials compared the Epi‐No device versus control (Dannecker 2004; Dietz 2014; Kamisan Atan 2016). The women were recruited in very late pregnancy (33 to 37 weeks' gestation) and the primary purpose of the intervention was prevention of perineal trauma. In one trial, it seemed women did PFM contractions with the Epi‐No device in the vagina (Dannecker 2004). However, this was unclear in the other two (Dietz 2014; Kamisan Atan 2016).
Six trials included PFMT as part of an intervention but the actual comparisons were active versus sham magnetic stimulation (Culligan 2005), one type of feedback versus another (Fynes 1999; Mahony 2004), PFMT plus episiotomy versus caesarean section (Taskin 1996) and PFMT plus Chinese herbal medicine (Chen 2018; Han 2018). Another trial compared abdominal exercise with no abdominal exercise (Gouldthorpe 2003).
One study was excluded because of internal inconsistencies and data discrepancies (Mason 2010). We contacted the study authors for clarification but so far have not received a response.
One trial was listed in a trials register but there was no report of this trial available. There was no response to a letter sent to the principal investigator (Mason 1999).
Risk of bias in included studies
We have provided details for each trial in the Characteristics of included studies. A summary of the risk of bias for each individual trial is presented in Figure 3, while Figure 4 summarises the risk of bias across all trials included in the review.
3.
'Risk of bias' summary: review authors' judgements about each risk of bias item for each included study.
4.
'Risk of bias' graph: review authors' judgements about each risk of bias item presented as percentages across all included studies.
Due to the brevity of reporting, it was difficult to assess the eight trials that were published as conference abstracts (Cruz 2014; Dokmeci 2008; Frost 2014; Frumenzio 2012; Gaier 2010; Hughes 2001; Skelly 2004; Stothers 2002). In addition, one of these abstracts did not report sample size (Skelly 2004). However, one‐to‐one randomisation was assumed.
Three trials deliberately randomised different numbers to invention and control groups. For Peirce 2013 this ratio was 1:3, and Szumilewicz 2019 used 1:2. Wilson and colleagues randomised just over 100 women to the control and individual treatment groups, with the individual treatment group being further randomised into three groups: PFMT only, PFMT with vaginal cones and vaginal cones only (Wilson 1998).
Of the 46 included trials, 28 reported an a priori power calculation (Ahlund 2013; Assis 2015; Barakat 2011; Chiarelli 2002; Dinc 2009; Dumoulin 2004; Fritel 2015; Glazener 2001; Gorbea 2004; Hilde 2013; Hyakutake 2018; Kim 2012; Ko 2011; Meyer 2001; Miquelutti 2013; Mørkved 2003; Oakley 2016; Peirce 2013; Pelaez 2014; Reilly 2002; Sacomori 2019; Sangsawang 2016; Sleep 1987; Stafne 2012; Sut 2016; Szumilewicz 2019; Torsdatter Markussen 2017; Woldringh 2007). Two of the trials without a power calculation was a pilot trial (Dufour 2019; Ewings 2005).
Allocation
Random sequence generation
Twenty‐seven trials provided enough information on random sequence generation for us to be reasonably sure that they had a low risk of bias (Assis 2015; Barakat 2011; Bø 2011; Chiarelli 2002; Cruz 2014; Dumoulin 2004; Ewings 2005; Fritel 2015; Glazener 2001; Gorbea 2004; Hilde 2013; Hughes 2001; Hyakutake 2018; Miquelutti 2013; Mørkved 2003; Oakley 2016; Peirce 2013; Pelaez 2014; Reilly 2002; Sampselle 1998; Sangsawang 2016; Stafne 2012; Szumilewicz 2019; Torsdatter Markussen 2017; Wilson 1998; Woldringh 2007; Yang 2017). Seventeen trials provided insufficient information for a judgement to be made and therefore these trials were at unclear risk of bias (Ahlund 2013; Dinc 2009; Dokmeci 2008; Dufour 2019; Frost 2014; Frumenzio 2012; Gaier 2010; Ko 2011; Kou 2013; Liu 2011; Meyer 2001; Sacomori 2019; Skelly 2004; Sleep 1987; Stothers 2002; Sut 2016; Wen 2010). Two trials were categorised as high risk of bias (Kim 2012; Kocaoz 2013). Kocaoz 2013 used methods suggestive of alternation and Kim 2012 provided participants with an envelope from which they drew one of two cards.
Allocation concealment
Twenty studies reported adequate allocation concealment and were at low risk of bias (Ahlund 2013; Bø 2011; Chiarelli 2002; Cruz 2014; Dumoulin 2004; Ewings 2005; Fritel 2015; Gorbea 2004; Hilde 2013; Hyakutake 2018; Miquelutti 2013; Mørkved 2003; Oakley 2016; Peirce 2013; Reilly 2002; Sacomori 2019; Sampselle 1998; Sangsawang 2016; Stafne 2012; Torsdatter Markussen 2017). Two trials were at high risk of bias, being unable to adequately conceal randomisation (Kim 2012; Kocaoz 2013). The remaining 26 trials were at unclear risk of bias as insufficient information (e.g. not described or stated "randomised") was provided.
Blinding
Blinding of participants and therapists
Given the nature of the intervention, it was not feasible for the included trials to blind the treatment provider or participants to group allocation and so all 46 trials were at high risk of performance bias. The difficulty of blinding exercise‐based interventions is a common problem.
Blinding of outcome assessment
Because the two main outcomes of interest in this review, urinary incontinence and incontinence‐specific quality of life, are self‐reported, these are unblinded measures. As a result, all 46 trials were deemed to be at high risk of detection bias. Blinded outcome assessment should be possible for some secondary outcomes, such as pad testing, and 13 trials attempted this (Bø 2011; Chiarelli 2002; Cruz 2014; Dumoulin 2004; Fritel 2015; Glazener 2001; Hilde 2013; Kim 2012; Mørkved 2003; Reilly 2002; Sampselle 1998; Stothers 2002; Torsdatter Markussen 2017).
Incomplete outcome data
Based on the criteria for assessment of attrition bias reported in the methods, 17 trials were at low risk of attrition bias (Assis 2015; Chiarelli 2002; Dufour 2019; Dumoulin 2004; Gaier 2010; Gorbea 2004; Hilde 2013; Kim 2012; Ko 2011; Meyer 2001; Mørkved 2003; Oakley 2016; Peirce 2013; Pelaez 2014; Sangsawang 2016; Stothers 2002; Sut 2016). Another 12 were at unclear risk (Ahlund 2013; Bø 2011; Barakat 2011; Ewings 2005; Frumenzio 2012; Kou 2013; Liu 2011; Reilly 2002; Skelly 2004; Sleep 1987; Stafne 2012; Wen 2010) with two of these being abstracts (Frumenzio 2012; Skelly 2004). The remaining 17 trials were at high risk. All trials appeared to analyse participants in the groups to which they were assigned.
Selective reporting
All outcomes appeared to have been reported in the majority of trials, with 36 trials assessed at low risk of bias for this domain. Eight trials were at high risk of bias. Six of these did not report all of the prespecified outcome measures (Ahlund 2013; Assis 2015; Bø 2011; Dokmeci 2008; Frumenzio 2012; Gaier 2010). Of these, two did not state the a priori primary outcome measure (Dokmeci 2008; Frumenzio 2012). A further two were at high risk due to not presenting data relating to self‐reported urinary incontinence, which could reasonably be expected to be an outcome of trials in this area (Frost 2014; Kocaoz 2013). Three of these were conference abstracts (Dokmeci 2008; Frost 2014; Frumenzio 2012). Two trials were at unclear risk of bias as it was uncertain if selective reporting had taken place (Skelly 2004; Stothers 2002).
Other potential sources of bias
We considered 26 trials to be free of issues (such as conflict of interest) that could put them at risk of other bias. We considered the risk of other bias as unclear for 20 trials (Ahlund 2013; Cruz 2014; Dokmeci 2008; Dufour 2019; Frost 2014; Frumenzio 2012; Gaier 2010; Gorbea 2004; Hughes 2001; Kou 2013; Liu 2011; Miquelutti 2013; Oakley 2016; Pelaez 2014; Sampselle 1998; Skelly 2004; Sleep 1987; Stothers 2002; Szumilewicz 2019; Wen 2010).
Effects of interventions
See: Table 1; Table 2; Table 3; Table 4; Table 5
There were some data available to explore whether PFMT is better than usual antenatal and postnatal care, or no treatment, for the prevention or treatment of urinary and faecal incontinence. The primary analysis investigated the prevalence of urinary and faecal incontinence. Data for outcomes of secondary interest (in 'Other data' tables) are only briefly discussed to give an indication of whether the findings were broadly consistent with the pooled data, or not. All but five trials contributed data to the forest plots (Ahlund 2013; Dokmeci 2008; Frost 2014; Liu 2011; Oakley 2016).
The 'Summary of findings' tables present the selected outcomes for each of the five main comparisons.
Antenatal PFMT compared to control for prevention of urinary and faecal incontinence: Table 1.
Antenatal PFMT compared to control for treatment of urinary and faecal incontinence: Table 2.
Antenatal PFMT compared to control for mixed prevention and treatment of urinary and faecal incontinence: Table 3.
Postnatal PFMT compared to control for treatment of urinary and faecal incontinence: Table 4.
Postnatal PFMT compared to control for mixed prevention and treatment of urinary and faecal incontinence: Table 5.
Antenatal pelvic floor muscle training for prevention of incontinence
Ten trials reported antenatal PFMT for prevention of incontinence (Barakat 2011; Gaier 2010; Gorbea 2004; Kocaoz 2013; Mørkved 2003; Pelaez 2014; Reilly 2002; Sampselle 1998; Sangsawang 2016; Stothers 2002). Seven recruited nulliparous or primiparous or primigravid women during pregnancy (Gaier 2010; Gorbea 2004; Mørkved 2003; Pelaez 2014; Reilly 2002; Sampselle 1998; Sangsawang 2016). The other three recruited "pregnant women" or both primiparous and multiparous women (Barakat 2011; Kocaoz 2013; Stothers 2002). All women were continent at recruitment.
In all 10 trials, PFMT began during pregnancy. Controls were asked not to do PFMT, did not receive instruction on PFMT, received usual care that might have included information on PFMT, or the control condition was not specified (Barakat 2011; Gaier 2010; Gorbea 2004; Kocaoz 2013; Mørkved 2003; Pelaez 2014; Reilly 2002; Sampselle 1998; Sangsawang 2016; Stothers 2002).
Two of these trials were mixed prevention and treatment trials but published or unpublished data were available for women who were continent at recruitment (Mørkved 2003; Sampselle 1998). In Sampselle 1998, 54/72 women were continent based on a standing stress test at 20 weeks' gestation. After dropouts, there were unpublished data from 37 previously continent women (16 PFMT and 21 controls). Mørkved 2003 published data for 207/301 women who were continent before pregnancy and at 20 weeks' gestation. After dropouts, there were data from 193 previously continent women (94 PFMT and 99 controls). Neither trial was powered to find differences in the previously continent subgroup, as the subgroup sizes were small.
Primary outcomes
Self‐reported urinary or faecal incontinence
Women randomised to PFMT are probably about 62% less likely to report urinary incontinence in late pregnancy compared to controls (risk ratio (RR) 0.38, 95% confidence interval (CI) 0.20 to 0.72; 6 trials, 624 women, random‐effects, I² = 78%, T² = 0.44; moderate‐quality evidence; Analysis 1.1). There was statistically significant heterogeneity in this comparison and in both subgroups (PFMT versus no PFMT, PFMT versus usual care). A random‐effects model was used because of the heterogeneity. Two trials appeared to contribute most to the heterogeneity (Gorbea 2004; Pelaez 2014), and both found many fewer cases of urinary incontinence in the intervention than control groups. Gorbea 2004 was the only trial that specifically asked controls not to do PFMT during pregnancy. In addition, as none of the PFMT women reported urinary incontinence in late pregnancy, the point estimate and CIs were perhaps less stable given there were no events in one of the two comparison groups. In Pelaez 2014, the PFMT was very intensive and of longer duration than other trials in the same subgroup. The intervention included three supervised exercise classes per week for at least 22 weeks and 80% of women attended the maximum number of classes.
1.1. Analysis.
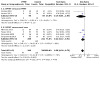
Comparison 1: Antenatal pelvic floor muscle training (PFMT) versus control for prevention of incontinence, Outcome 1: Urinary incontinence in late pregnancy
Compared to controls, PFMT women were about 62% less likely to report urinary incontinence in the early postnatal period (RR 0.38, 95% CI 0.17 to 0.83; 5 trials, 439 women, random‐effects, I² = 74%, T² = 0.55; Analysis 1.2). There was statistically significant heterogeneity in this comparison, as well as in one subgroup (PFMT versus usual care), which included the trial by Pelaez 2014 (see above).
1.2. Analysis.
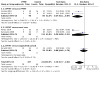
Comparison 1: Antenatal pelvic floor muscle training (PFMT) versus control for prevention of incontinence, Outcome 2: Urinary incontinence early postnatal period (0‐3 months)
PFMT women had a slightly decreased risk of urinary incontinence than controls in the mid‐postnatal period (three to six months), although the difference in risk had reduced to 29% (RR 0.71, 95% CI 0.54 to 0.95; 5 trials, 673 women, fixed‐effect, I² = 0%; high‐quality evidence; Analysis 1.3). Overall, the pooled estimate favoured PFMT.
1.3. Analysis.
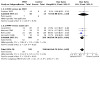
Comparison 1: Antenatal pelvic floor muscle training (PFMT) versus control for prevention of incontinence, Outcome 3: Urinary incontinence mid‐postnatal period (> 3‐6 months)
Data from one study provided no evidence of a difference in risk of urinary incontinence between PFMT women and women in the control group at 12 months' postpartum (RR 1.20, 95% CI 0.65 to 2.21; 1 trial; 44 women Analysis 1.4; low‐quality evidence).
1.4. Analysis.
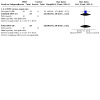
Comparison 1: Antenatal pelvic floor muscle training (PFMT) versus control for prevention of incontinence, Outcome 4: Urinary incontinence late postnatal period (> 6‐12 months)
Two trials measured urinary incontinence at greater than five years (Mørkved 2003; Reilly 2002; seeTable 6). The pooled data provided no evidence that the earlier effectiveness of PFMT persisted in the long term (RR 1.07, 95% CI 0.77 to 1.48; 2 trials, 352 women, fixed‐effect, I² = 25%; Analysis 1.5). Reilly 2002 found that 68.4% of women randomised to the intervention group were still performing PFMT, with 38% doing PFMT at least twice per week after eight years. Mørkved 2003 reported that the same number of women in the PFMT and control groups (45%) were exercising at least weekly, six years after the primary study. The lack of evidence of a difference in prevalence rates of incontinence in these three trials suggests that perhaps PFMT may not be effective in the long term. There could be three immediately plausible explanations for this. The women may have stopped exercising, they may have had subsequent pregnancies or, as shown by Mørkved 2003, women were performing similar PFMT regimens regardless of which group they had initially been randomised.
1.5. Analysis.
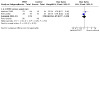
Comparison 1: Antenatal pelvic floor muscle training (PFMT) versus control for prevention of incontinence, Outcome 5: Urinary incontinence long term (> 5 years)
None of the 10 trials reported data on the risk of either antenatal or postpartum faecal incontinence.
Urinary incontinence‐specific quality of life
Reilly 2002 (King's Health Questionnaire) and Pelaez 2014 ( International Consultation on Incontinence Questionnaire‐Short Form (ICIQ‐SF)) were the only two trials to mention incontinence‐specific quality of life. Pelaez 2014 reported that there was probably a difference between the two groups in favour of PFMT (mean difference (MD) ‐2.42, 95% CI ‐3.32 to ‐1.52; 2 trials, 152 women; moderate‐quality evidence; Analysis 1.6; lower score indicates better incontinence‐specific quality of life). Reilly 2002 did not report their data but stated there was no difference between the groups on any of the eight subscales.
1.6. Analysis.
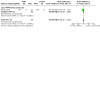
Comparison 1: Antenatal pelvic floor muscle training (PFMT) versus control for prevention of incontinence, Outcome 6: Urinary incontinence‐specific quality of life
Faecal incontinence‐specific quality of life
Not reported.
Secondary outcomes
Self‐reported severity of incontinence
Seven of the 10 trials reported some data on symptom severity, such as frequency or amount of urine leakage (Barakat 2011; Gorbea 2004; Pelaez 2014; Reilly 2002; Sampselle 1998; Sangsawang 2016; Stothers 2002; Analysis 1.7). The choice of measures (many of these of unknown validity) or the ways of reporting these were highly variable and data reporting was often incomplete. Two of the most recent trials used individual item scores from the ICIQ‐SF; frequency (item 3) and amount of leakage (item 4) (Barakat 2011; Pelaez 2014). There was a consistent pattern of effect in favour of PFMT, when compared to usual care, for frequency, amount and other urinary incontinence severity indices in two trials (Pelaez 2014; Sangsawang 2016).
1.7. Analysis.
Comparison 1: Antenatal pelvic floor muscle training (PFMT) versus control for prevention of incontinence, Outcome 7: Severity of incontinence
| Severity of incontinence | |||||
| Study | Measure of | Outcome measure | PFMT data | Control data | Difference |
| PFMT versus no PFMT | |||||
| Stothers 2002 | Frequency of leakage | Leakage episodes in 5 days | Mean 3.4, SD not reported, n = 7 at 6 months postpartum | Mean 6.0, SD not reported, n = 8 at 6 months postpartum | Not calculable |
| Amount of leakage | Volume of urine loss (g) on stress test with standardised bladder volume | Mean 18, SD not reported, n = ? at 6 months postpartum | Mean 38, SD not reported, n = ? at 6 months postpartum | Not calculable | |
| Other leakage severity | Not measured | ||||
| PFMT versus usual care | |||||
| Gorbea 2004 | Frequency of leakage | Less than weekly, weekly or daily UI (not clear if self‐reported or from urinary diary) | 4 less than weekly, 2 weekly and none with daily leakage, n = 38 at 6 weeks postpartum | 6 less than weekly, 8 weekly and 2 with daily leakage, n = 34 at 6 weeks postpartum | Not calculated as validity/reliability of this measure not known |
| Other leakage severity | Grade I, II or III leakage, where I=l oss of urine with coughing or lifting, II = urine leakage when walking, and III = urine leakage when upright | 6 grade I, and none with grade II or III leakage, n = 38 at 6 weeks postpartum | 10 grade I, 6 grade II, and none grade III leakage, n = 34 at 6 weeks postpartum | Not calculated as validity/reliability of this measure not known | |
| Pelaez 2014 | Frequency of leakage | Self‐reported leakage frequency categorised as never, once a week, 2‐3 times a week, once a day, several times a day, all the time (item 3, ICIQ‐SF) | 60 never, 3 once a week, n = 63 at 36‐40 weeks gestation | 54 never, 18 once a week, 9 2‐3 times a week, 7 once a day, 1 several times a day, n = 89 | Author reported P value 0.0001 |
| Amount of leakage | Self‐reported amount of leakage categorised as none, small, moderate, large (item 4, ICIQ‐SF) | 60 none, 3 small, n = 63 at 36‐40 weeks gestation | 54 report none, 27 a small, 5 moderate, 3 large, n=89 | Author reported P value 0.0001 | |
| Symptom bother | Symptom impact, numbered VAS (0‐10, 10 worse) (item 5, ICIQ‐SF) | Mean 0.10, SD 0.64, n = 63 | Mean 0.97, SD 1.8, n = 89 | Mean difference ‐0.87 (95% CI ‐1.28 to ‐0.46) | |
| Reilly 2002 | Incontinence‐specific quality of life | King's Health Questionnaire | Not reported | Not reported | "No difference between the study groups on any of the 8 scales, and all mean scores were low" |
| Other leakage severity | Mild, moderate or severe UI (not clear how categorised) | 19 mild, 3 moderate and 1 severe, n = 74 at 3 months postpartum | 30 mild, 5 moderate and 1 severe, n = 74 at 3 months post partum | Not calculated as validity/reliability of this measure not known | |
| Sampselle 1998 | Frequency of leakage | Not measured | |||
| Amount of leakage | Not measured | ||||
| Other leakage severity | Average score from questionnaire re urine leakage with gentle cough, hard cough, sneeze and laugh scored 0 for none, 1 for dampness, 2 for wetness and 3 for soaked | Mean 0.30, standard deviation 0.44, n = 16 at 12 months postpartum | Mean 0.32, standard deviation 0.41, n = 21 at 12 months postpartum | Not calculated as validity/reliability of this measure not known | |
| Sangsawang 2016 | Frequency of leakage | Bladder diary, number of leakages per week | Mean 12.4, SD 5.3, n = 9 of 33 at 38 weeks gestation | Mean 23.1, SD 5.7, n = 16 of 30 at 38 weeks gestation | Mean difference ‐8.9 (95% CI ‐13.7 to ‐4.0) |
| Amount of leakage | Self‐reported: none, small (drops), moderate (wetting underwear), large (wetting outer clothing) | None 24, small 2, moderate 4, large 3 | None 14, small 2, moderate 8, large 6 | Author reported P value 0.03 | |
| Other leakage severity | Perceived severity on VAS (0‐10, 10 worse) | Mean 5.0, SD 0.9, n = 9 of 33 | Mean 6.3, SD 1.2, n = 16 of 30 | Mean difference ‐2.0 (95% CI ‐3.4 to ‐0.6) | |
| PFMT versus unspecified control | |||||
| Barakat 2011 | Frequency of leakage | Self‐reported leakage frequency categorised as never, once a week, 2‐3 times a week, once a day, several times a day, all the time (item 3, ICIQ‐SF) | 24 never, 5 once a week, 2 2‐3 times a week, 2 once a day, 1 several times a day, n = 34 | 22 never, 5 once a week, 1 2‐3 times a week, 2 once a day, 3 several times a day, n = 33 | Author reported P value > 0.05 |
| Amount of leakage | Self‐reported amount of leakage categorised as none, small, moderate, large (item 4, ICIQ‐SF) | Not reported | Not reported | ||
| Other leakage severity | |||||
Number of urinary or faecal incontinence episodes
None of the trials reported number of urinary or faecal incontinence episodes.
Loss of urine under stress test
Three trials reported whether women were continent or not based on a stress test (positive cough or one‐hour pad test) (Gorbea 2004; Kocaoz 2013; Reilly 2002). Women in the PFMT group were less likely to be incontinent in late pregnancy (RR 0.36, 95% CI 0.19 to 0.70; 1 trial, 102 women; Kocaoz 2013; Analysis 1.8) or in the early postnatal period (RR 0.09, 95% CI 0.02 to 0.47; 2 trials, 174 women, fixed‐effect, I² = 0%; Gorbea 2004; Kocaoz 2013; Analysis 1.9) when compared with no treatment controls. There was no evidence of a difference between PFMT versus usual care groups in the early postnatal period (RR 0.88, 95% CI 0.33 to 2.29; 1 trial, 148 women; Reilly 2002; Analysis 1.9).
1.8. Analysis.
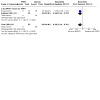
Comparison 1: Antenatal pelvic floor muscle training (PFMT) versus control for prevention of incontinence, Outcome 8: Loss of urine under stress test late pregnancy
1.9. Analysis.
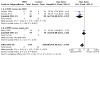
Comparison 1: Antenatal pelvic floor muscle training (PFMT) versus control for prevention of incontinence, Outcome 9: Loss of urine under stress test early postnatal period (0‐3 months)
Self‐reported measures of pelvic floor dysfunction
None of the trials reported this outcome.
Other self‐reported well‐being measures
Two trials used the 36‐Item Short‐Form Health Survey (SF‐36) (Barakat 2011; Reilly 2002). In the general health domain, Reilly 2002 reported that the PFMT group scored significantly higher than the control group at three months' postpartum (MD 7.2, 95% CI 2.36 to 12.04), while Barakat 2011 found that women in the PFMT group were more likely to rate their health as very good (18/34 women in the PFMT group versus 9/33 women in the control group) (Analysis 1.10).
1.10. Analysis.
Comparison 1: Antenatal pelvic floor muscle training (PFMT) versus control for prevention of incontinence, Outcome 10: Other self‐reported well‐being measures
| Other self‐reported well‐being measures | ||||
| Study | Outcome measure | PFMT data | Control data | Difference |
| PFMT versus usual care | ||||
| Reilly 2002 | SF‐36, general health scale (0‐100, 100 better) | Mean 84.4, SD 13.5, n = 76 | Mean 77.2, SD 16.3, n = 72 | Mean difference 7.2 (95% CI 2.36 to 12.04) |
| PFMT versus unspecified control | ||||
| Barakat 2011 | Maternal perception of health status (presume an item derived from SF‐36). Rated as very bad, somewhat bad, good or very good | 1 very bad, 14 good, 18 very good, n=34 | 1 very bad, 5 somewhat bad, 18 good, 9 very good, n=33 | |
Adverse effects
In one trial, two of 43 PFMT women withdrew due to pelvic floor pain (Stothers 2002). Barakat 2011 stated "there were no exercise‐related injuries experienced during pregnancy." No other trial reported whether there were adverse effects or not.
Labour and delivery outcome
Five trials reported delivery outcome (Barakat 2011; Gaier 2010; Gorbea 2004; Reilly 2002; Stothers 2002). However, the data by Stothers 2002 were not reported by group. Three trials reported the number of caesarean sections (Barakat 2011; Gorbea 2004; Reilly 2002). There was no evidence of a difference between PFMT and control groups in any of these trials (RR 1.28, 95% CI 0.89 to 1.85; 3 trials, 373 women, fixed‐effect, I² = 49%; Analysis 1.11). Two trials reported type of vaginal delivery (normal or instrumental) (Barakat 2011; Reilly 2002). Two trials reported perineal trauma (Barakat 2011; Gaier 2010). There were no apparent differences between groups for either outcome (Analysis 1.12).
1.11. Analysis.
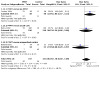
Comparison 1: Antenatal pelvic floor muscle training (PFMT) versus control for prevention of incontinence, Outcome 11: Delivery outcome: caesarean section
1.12. Analysis.
Comparison 1: Antenatal pelvic floor muscle training (PFMT) versus control for prevention of incontinence, Outcome 12: Delivery outcome: other
| Delivery outcome: other | ||||
| Study | Outcome measure | PFMT data | Control data | Difference |
| PFMT versus no control | ||||
| Stothers 2002 | Type of delivery | 73.3% vaginal, 26.7% caesarean; not reported per group | ||
| PFMT versus usual care | ||||
| Gaier 2010 | Number with episiotomy | 2 of 65 | 6 of 62 | Relative risk 0.32 (95% CI 0.07 to 1.52) |
| Perineal trauma | 0.5% | 4.2% | Unable to calculate | |
| Reilly 2002 | Type of delivery | 78 normal vaginal, 13 ventouse, 8 forceps, n = 120 | 72 normal vaginal, 22 ventouse, 2 forceps, n = 110 | Relative risk for normal vaginal delivery 0.99 (95% CI 0.82 to 1.20) Relative risk for assisted vaginal delivery 0.80 (95% CI 0.47 to 1.36) |
| PFMT versus unspecified control | ||||
| Barakat 2011 | Type of delivery | 20 normal vaginal, 7 assisted vaginal, n = 34 | 18 normal vaginal, 5 assisted vaginal, n = 33 | Relative risk for normal vaginal delivery 1.08 (95% CI 0.71 to 1.64) Relative risk for assisted vaginal delivery 1.36 (95% CI 0.48 to 3.86) |
| Perineal trauma | 22 intact perineum, 6 grade 1 tear, 5 grade 2 tear, 1 grade 3 tear, n = 34 | 19 intact perineum, 6 grade 1 tear, 8 grade 2 tear, 0 grade 3 tear, n = 33 | Relative risk for perineal tear 0.83 (95% CI 0.45 to 1.52) | |
Pelvic floor muscle function
Three trials measured PFM function (Gaier 2010; Gorbea 2004; Reilly 2002). However, Gaier 2010 reported no data. Measures were electromyography and vaginal squeeze pressure (Gorbea 2004; Reilly 2002). The lack of explanation of the type of electromyography and unusual presentation of the data in Gorbea 2004 made it difficult to interpret the findings. In Reilly 2002, there was no evidence that mean vaginal squeeze pressure was any greater in the PFMT group than the control group (MD 1.00, 95% CI ‐1.31 to 3.31; Analysis 1.13). Gaier 2010 reported significantly higher PFM strength in women doing PFMT. However, it was unclear how this was measured and the data were not given in the conference abstract.
1.13. Analysis.
Comparison 1: Antenatal pelvic floor muscle training (PFMT) versus control for prevention of incontinence, Outcome 13: Pelvic floor muscle function
| Pelvic floor muscle function | ||||
| Study | Outcome measure | PFMT data | Control data | Difference |
| PFMT versus no PFMT | ||||
| Gorbea 2004 | No or minimal contraction on electromyography. Not clear what type of electromyography or how categorised | 14 of 14 at 6 weeks postpartum | 10 of 12 at 6 weeks postpartum | Not calculated as validity/reliability of this measure not known |
| PFMT versus usual care | ||||
| Gaier 2010 | PFM strength (measure not reported) | Significantly higher in the training group at 12 weeks after delivery (P < 0.05) | ||
| Reilly 2002 | Vaginal squeeze pressure (need unit of measurement), early post‐natal | Mean 11.5, SD 7.8, n = 68 | Mean 10.5, SD 5.5, n = 64 | Mean difference 1.0 (95% CI ‐1.31 to 3.31) |
Antenatal pelvic floor muscle training for treatment of incontinence
Four trials reported antenatal PFMT for treatment of incontinence (Cruz 2014; Dinc 2009; Skelly 2004; Woldringh 2007). Two trials recruited primiparous and multiparous women (Dinc 2009; Woldringh 2007). Two trials reported as abstracts did not state parity (Cruz 2014; Skelly 2004). In all four trials, the control group received usual care.
Primary outcomes
Self‐reported urinary or faecal incontinence
There was no evidence of any difference in risk of urinary incontinence in late pregnancy (RR 0.70, 95% CI 0.44 to 1.13; 3 trials, 345 women, random‐effects, I² = 71%, T² = 0.11; very low‐quality evidence; Analysis 2.1). As this comparison showed statistically significant heterogeneity, we used a random‐effects model to provide a more conservative estimate (Analysis 2.1).
2.1. Analysis.
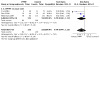
Comparison 2: Antenatal pelvic floor muscle training (PFMT) versus control for treatment of incontinence, Outcome 1: Urinary incontinence late pregnancy
There were no evidence of differences in the early (RR 0.75, 95% CI 0.37 to 1.53; 2 trials, 292 women, random‐effects, I² = 65%, T² = 0.19; Analysis 2.2), or mid‐(RR 0.94, 95% CI 0.70 to 1.24; 1 trial, 187 women; low‐quality evidence; Analysis 2.3) postnatal periods.
2.2. Analysis.
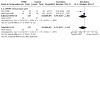
Comparison 2: Antenatal pelvic floor muscle training (PFMT) versus control for treatment of incontinence, Outcome 2: Urinary incontinence early postnatal period (0‐3 months)
2.3. Analysis.
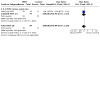
Comparison 2: Antenatal pelvic floor muscle training (PFMT) versus control for treatment of incontinence, Outcome 3: Urinary incontinence mid‐postnatal period (> 3‐6 months)
Two trials measured urinary incontinence in the late postnatal period. A random‐effects model was used because of statistically significant heterogeneity in this comparison; there is no a evidence of a difference between groups (RR 0.50, 95% CI 0.13 to 1.93; 2 trials, 869 women; Skelly 2004; Woldringh 2007; random‐effects, I² = 94%, T² = 0.89; very low‐quality evidence; Analysis 2.4). Skelly 2004 was available only as a conference abstract with limited data on which to base a 'Risk of bias' assessment and about half of the women randomised appeared to have urinary incontinence symptoms pre‐pregnancy. In Woldringh 2007, at 35 weeks' gestation about two‐thirds of women in the control group were doing some form of PFMT, compared to 94% in the PFMT group. These, or other unknown reasons, could have contributed to the observed heterogeneity.
2.4. Analysis.
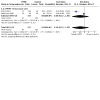
Comparison 2: Antenatal pelvic floor muscle training (PFMT) versus control for treatment of incontinence, Outcome 4: Urinary incontinence late postnatal period (> 6‐12 months)
None of the four trials reported data on the prevalence of either antenatal or postpartum faecal incontinence.
Urinary incontinence‐specific quality of life
Two trials used a validated incontinence‐specific quality of life measure (Cruz 2014, ICIQ‐SF; Woldringh 2007, Incontinence Impact Questionnaire; (IIQ)). Cruz 2014 found that PFMT women probably have better quality of life in late pregnancy (MD ‐3.50, 95% CI ‐6.13 to ‐0.87; 1 trial, 41 women, moderate‐quality evidence; Analysis 2.5; lower score better). Woldringh 2007 categorised IIQ scores, which meant that it was not possible to interpret these data.
2.5. Analysis.

Comparison 2: Antenatal pelvic floor muscle training (PFMT) versus control for treatment of incontinence, Outcome 5: Urinary incontinence‐specific quality of life
Faecal incontinence‐specific quality of life
Not reported.
Secondary outcomes
Self‐reported severity of incontinence
Woldringh 2007 reported on leakage severity, but the validity of this measure is unknown (Analysis 2.6).
2.6. Analysis.
Comparison 2: Antenatal pelvic floor muscle training (PFMT) versus control for treatment of incontinence, Outcome 6: Severity of incontinence
| Severity of incontinence | |||||
| Study | Measure of | Outcome measure | PFMT data | Control data | Difference |
| PFMT versus usual care | |||||
| Woldringh 2007 | Frequency of leakage | 7‐day urinary diary | Not reported | Not reported | |
| Amount of leakage | Not measured | ||||
| Other leakage severity | A combination of data from a 7‐day bladder diary and a questionnaire (PRAFAB, Vierhout 1990) (0‐10; 0 to 4 mild UI, 5 to 10 moderate to severe UI) | 9 with moderate to severe leakage, n = 65 at 12 months postpartum | 8 with moderate to severe leakage, n = 99 at 12 months postpartum | Not calculated as validity/reliability of this measure not known | |
Number of urinary or faecal incontinence episodes
None of the trials reported number of urinary or faecal incontinence episodes.
Loss of urine under stress test
None of the trials reported loss of urine under stress test.
Self‐reported measures of pelvic floor dysfunction
Woldringh 2007 reported IIQ data but the difference between groups was not able to be calculated (Analysis 2.7).
2.7. Analysis.
Comparison 2: Antenatal pelvic floor muscle training (PFMT) versus control for treatment of incontinence, Outcome 7: Self‐reported measures of pelvic floor dysfunction
| Self‐reported measures of pelvic floor dysfunction | ||||
| Study | Outcome measure | PFMT data | Control data | Difference |
| PFMT versus usual care | ||||
| Woldringh 2007 | IIQ. Data dichotomised into impact versus no impact in four subscales ‐ impact on social relations, impact on emotional health, impact on recreational activities, and impact on physical activities (not clear how this was done) | Impact on social relations 2, on emotional health 11, on recreational activities 10, and on physical activities 4, n = 65 at 12 months postpartum | Impact on social relations 5, on emotional health 14, on recreational activities 10, and on physical activities 7, n = 99 at 12 months postpartum | Not calculated as validity/reliability of this measure not known |
Other self‐reported well‐being measures
None of the trials reported this outcome.
Adverse effects
None of the trials reported on adverse effects.
Labour and delivery outcome
None of the trials reported this outcome.
Pelvic floor muscle function
Cruz 2014 found no difference between the groups in maximal vaginal squeeze pressure in the third trimester (Analysis 2.8).
2.8. Analysis.
Comparison 2: Antenatal pelvic floor muscle training (PFMT) versus control for treatment of incontinence, Outcome 8: Pelvic floor muscle function
| Pelvic floor muscle function | ||||
| Study | Outcome measure | PFMT data | Control data | Difference |
| PFMT versus usual care | ||||
| Cruz 2014 | Maximal vaginal squeeze pressure, in cm water (Peritron) | Mean 29.8, SD 18.8, n = 20 in third trimester | Mean 24.2, SD 12.9, n = 21 in third trimester | Mean difference 5.6 (95% CI ‐4.32 to 15.52) |
Antenatal pelvic floor muscle training for mixed prevention and treatment of incontinence
Fifteen trials reported antenatal PFMT for mixed prevention and treatment of incontinence (Assis 2015; Bø 2011; Dokmeci 2008; Fritel 2015; Frumenzio 2012; Hughes 2001; Hyakutake 2018; Ko 2011; Miquelutti 2013; Mørkved 2003; Sampselle 1998; Stafne 2012; Sut 2016; Szumilewicz 2019; Torsdatter Markussen 2017). The control group consisted of usual care in nine trials (Bø 2011; Fritel 2015; Hughes 2001; Hyakutake 2018; Miquelutti 2013; Mørkved 2003; Sampselle 1998; Stafne 2012; Torsdatter Markussen 2017). There was no PFMT in four trials (Assis 2015; Ko 2011; Sut 2016; Szumilewicz 2019). Two did not specify the control group (Dokmeci 2008; Frumenzio 2012).
Eleven trials were in women who were delivering their first baby (Assis 2015; Bø 2011; Dokmeci 2008; Fritel 2015; Hughes 2001; Hyakutake 2018; Ko 2011; Miquelutti 2013; Mørkved 2003; Sampselle 1998; Szumilewicz 2019). Three recruited both primiparous and multiparous women (Stafne 2012; Sut 2016; Torsdatter Markussen 2017). Parity was not stated in Frumenzio 2012, which was an abstract.
Primary outcomes
Self‐reported urinary or faecal incontinence
Women randomised to PFMT probably have 22% less risk of urinary incontinence in late pregnancy (RR 0.78, 95% CI 0.64 to 0.94; 11 trials, 3307 women, random‐effects, I² = 79%, T² = 0.06; moderate‐quality evidence; Analysis 3.1). There was statistically significant heterogeneity in both subgroups (PFMT versus no exercise and PFMT versus usual care) in this comparison (Analysis 3.1). The point estimates favoured PFMT in all but four trials (Bø 2011; Fritel 2015; Szumilewicz 2019; Torsdatter Markussen 2017). In the seven trials where the point estimates favoured PFMT, there was considerable variation, with RR ranging from 0.07 to 0.93 (Assis 2015; Hughes 2001; Ko 2011; Miquelutti 2013; Mørkved 2003; Sampselle 1998; Stafne 2012). The data that appeared notably different, being markedly in favour of PFMT, were those from Assis 2015 for reasons unknown, although this was one of three trials in which controls were asked not to do PFMT. In the four trials where the point estimates did not favour PFMT, there were plausible explanations for no differences between the two groups. Participants in Bø 2011 were encouraged to attend at least two out of three possible exercise classes every week. These exercise classes were led by general fitness instructors who were taught by a physiotherapist how to deliver PFMT to women. It may be that the women in this trial considered the classes solely as general fitness and did not concentrate on the PFMT component. In Fritel 2015, the authors reported that, at the end of pregnancy, there was no difference in the frequency and duration of PFMT between groups, suggesting no difference in exercise adherence between the PFMT and usual care groups. In Torsdatter Markussen 2017, there was a differential dropout between groups (more from the PFMT group), similar PFMT adherence in the exercise and control groups and a noticeably different risk profile of the recruited population. The fourth, Szumilewicz 2019, was a small study that used 2:1 randomisation, with a three times per week exercise class for six weeks, led by an exercise specialist.
3.1. Analysis.
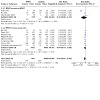
Comparison 3: Antenatal pelvic floor muscle training (PFMT) versus control for (mixed) prevention or treatment of incontinence, Outcome 1: Urinary incontinence late pregnancy
There was a difference in the risk of urinary incontinence between antenatal PFMT and control groups in the early postnatal period (RR 0.83, 95% CI 0.71 to 0.99; 6 trials, 806 women, fixed‐effect, I² = 0%, T² = 0.00; Analysis 3.2). PFMT may reduce the risk of urinary incontinence slightly in the mid‐postnatal period (RR 0.73, 95% CI 0.55 to 0.97; 5 trials, 1921 women, random‐effects, I² = 65%, T² = 0.06; low‐quality evidence; Analysis 3.3). There was no evidence of a difference between PFMT and control groups in the late postnatal period (RR 0.85, 95% CI 0.63 to 1.14; 2 trials, 244 women, fixed‐effect, I² = 0%; moderate‐quality evidence; Analysis 3.4).
3.2. Analysis.
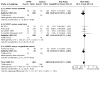
Comparison 3: Antenatal pelvic floor muscle training (PFMT) versus control for (mixed) prevention or treatment of incontinence, Outcome 2: Urinary incontinence early postnatal period (0‐3 months)
3.3. Analysis.
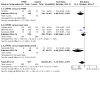
Comparison 3: Antenatal pelvic floor muscle training (PFMT) versus control for (mixed) prevention or treatment of incontinence, Outcome 3: Urinary incontinence mid‐postnatal period (> 3‐6 months)
3.4. Analysis.
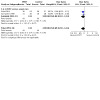
Comparison 3: Antenatal pelvic floor muscle training (PFMT) versus control for (mixed) prevention or treatment of incontinence, Outcome 4: Urinary incontinence late postnatal period (> 6‐12 months)
In the one trial with long‐term data (six years), there was no evidence of a difference between groups (RR 1.38, 95% CI 0.77 to 2.45; 1 trial, 188 women; Mørkved 2003; Analysis 3.5). Women in the control group were offered a description of the PFMT programme after the post‐treatment comparison and this and other events (such as subsequent births) may have contributed to a lack of difference.
3.5. Analysis.
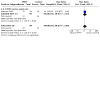
Comparison 3: Antenatal pelvic floor muscle training (PFMT) versus control for (mixed) prevention or treatment of incontinence, Outcome 5: Urinary incontinence long term (> 5 years)
Three trials collected data on faecal incontinence in late pregnancy (Bø 2011; Stafne 2012; Torsdatter Markussen 2017). Bø 2011 and Torsdatter Markussen 2017 also reported on faecal incontinence in the early postnatal period. There was probably no evidence of a difference between PFMT and usual care groups at late pregnancy (RR 0.64, 95% CI 0.36 to 1.14; 3 trials, 910 women, fixed‐effect, I² = 0%, T² = 0.00; moderate‐quality evidence; Analysis 3.6) or in the early postnatal period (RR 0.76, 95% CI 0.34 to 1.70; 2 trials, 130 women, fixed effect, I² = 0%, T² = 0.00; Analysis 3.7).
3.6. Analysis.
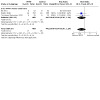
Comparison 3: Antenatal pelvic floor muscle training (PFMT) versus control for (mixed) prevention or treatment of incontinence, Outcome 6: Faecal incontinence late pregnancy
3.7. Analysis.
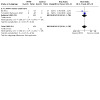
Comparison 3: Antenatal pelvic floor muscle training (PFMT) versus control for (mixed) prevention or treatment of incontinence, Outcome 7: Faecal incontinence early postnatal period (0‐3 months)
Urinary incontinence‐specific quality of life
Six trials used a validated urinary incontinence‐specific quality of life measure (Fritel 2015, ICIQ‐SF and Contilife (higher score better); Dokmeci 2008; Ko 2011; Sut 2016, IIQ‐7; Hughes 2001, BFLUTS questionnaire; Hyakutake 2018, Pelvic Floor Impact Questionnaire (PFIQ‐7), bladder score (Urinary Impact Questionnaire‐7)). While Dokmeci 2008 and Hughes 2001 used validated outcome measures, neither have reported the scores (Analysis 3.16).
3.16. Analysis.
Comparison 3: Antenatal pelvic floor muscle training (PFMT) versus control for (mixed) prevention or treatment of incontinence, Outcome 16: Other self‐reported well‐being measures
| Other self‐reported well‐being measures | ||||
| Study | Outcome measure | PFMT data | Control data | Difference |
| PFMT versus usual care | ||||
| Fritel 2015 | EuroQoL‐5D (0‐100, 100 better) | Mean 76.4, SD 20.4, n = 111 at end of pregnancy; Mean 82.8, SD 18.2, n = 105 at 0‐3 months postpartum; Mean 86.8, SD 13.1, n = 94 at > 6‐12 months postpartum | Mean 77.9, SD 16.3, n = 112 at end of pregnancy; Mean 80.4, SD 17.0, n = 107 at 0‐3 months postpartum; Mean 82.9, SD 14.8, n = 97 at > 6‐12 months postpartum | Late pregnancy, mean difference ‐1.50 (95% CI ‐6.35 to 3.35); 0‐3 months postpartum, mean difference 2.40 (95% CI ‐2.34 to 7.14); > 6‐12 months postpartum, mean difference 3.90 (95% CI ‐0.06 to 7.86) |
| Miquelutti 2013 | State Trait Anxiety Inventory (STAI) (20‐80; 50‐64 high, 65‐80 very high) | Trait anxiety 18 of 85 State anxiety 16 of 85 |
Trait anxiety 20 of 76 State anxiety 14 of 76 |
Trait anxiety, relative risk 0.80 (95% CI 0.46 to 1.40) State anxiety, relative risk 1.02 (95% CI 0.53 to 1.95) |
| Stafne 2012 | Psychological General Well‐being Index (PGWBI) (0‐110, 110 better) | Total score at end of pregnancy: Mean 79.5 (95% CI 78.5 to 80.6), n=389 | Total score at end of pregnancy: Mean 78.5 (95% CI 77.5 to 79.6), n = 361 | Mean difference 0.71 (95% CI ‐0.60 to 2.01) |
There was no evidence of a difference in urinary incontinence‐specific quality of life between antenatal PFMT and control groups in late pregnancy (standardised mean difference (SMD) ‐0.02, 95% CI ‐0.35 to 0.31; 3 trials, 584 women, random‐effects, I² = 71%, T² = 0.06; Analysis 3.8). Similarly, there was no evidence of a difference in urinary incontinence‐specific quality of life between antenatal PFMT and control groups in the early postnatal period (SMD ‐0.24, 95% CI ‐0.67 to 0.20; 4 trials, 645 women, random‐effects, I² = 84%, T² = 0.16; Analysis 3.9). A single trial found a statistically significant difference between the groups in the mid‐postnatal period (IIQ; MD ‐0.79, 95% CI ‐1.27 to ‐0.31; 300 women; Ko 2011; Analysis 3.10), and was the only trial to find statistically significant differences at the previous time points. Fritel 2015 (ICIQ‐SF) found no evidence of difference in urinary incontinence‐specific quality of life between PFMT and usual care groups in the late postnatal period (MD ‐0.20, 95% CI ‐1.20 to 0.81; 190 women, moderate‐quality evidence; Analysis 3.11).
3.8. Analysis.
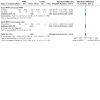
Comparison 3: Antenatal pelvic floor muscle training (PFMT) versus control for (mixed) prevention or treatment of incontinence, Outcome 8: Urinary incontinence‐specific quality of life late pregnancy
3.9. Analysis.
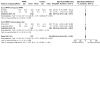
Comparison 3: Antenatal pelvic floor muscle training (PFMT) versus control for (mixed) prevention or treatment of incontinence, Outcome 9: Urinary incontinence‐specific quality of life early postnatal period (0‐3 months)
3.10. Analysis.
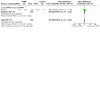
Comparison 3: Antenatal pelvic floor muscle training (PFMT) versus control for (mixed) prevention or treatment of incontinence, Outcome 10: Urinary incontinence‐specific quality of life mid postnatal period (> 3‐6 months)
3.11. Analysis.
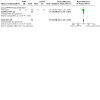
Comparison 3: Antenatal pelvic floor muscle training (PFMT) versus control for (mixed) prevention or treatment of incontinence, Outcome 11: Urinary incontinence‐specific quality of life late postnatal period (> 6‐12 months)
Faecal incontinence‐specific quality of life
A single trial that measured faecal incontinence‐specific quality of life using the bowel subscale (CRAIQ‐7) of the PFIQ‐7 found no evidence of a difference between the groups in the early postnatal period (MD ‐2.60, 95% CI ‐7.84 to 2.64; Hyakutake 2018; 74 women, low‐quality evidence; Analysis 3.12).
3.12. Analysis.
Comparison 3: Antenatal pelvic floor muscle training (PFMT) versus control for (mixed) prevention or treatment of incontinence, Outcome 12: Faecal incontinence‐specific quality of life early postnatal period (0‐3 months)
Secondary outcomes
Self‐reported severity of incontinence
Four trials reported some data on urinary symptom severity. None of the data suggested that PFMT was superior to control, or vice versa, at the primary endpoint of either early postpartum (Hughes 2001; Sut 2016; Torsdatter Markussen 2017), or 12 months' postpartum (Sampselle 1998; Analysis 3.13).
3.13. Analysis.
Comparison 3: Antenatal pelvic floor muscle training (PFMT) versus control for (mixed) prevention or treatment of incontinence, Outcome 13: Severity of incontinence
| Severity of incontinence | |||||
| Study | Measure of | Outcome measure | PFMT data | Control data | Difference |
| PFMT versus no PFMT | |||||
| Sut 2016 | UI | 3‐day voiding diary (24‐hour data) | Mean 0.3, SD 1.5, n = 30 late pregnancy; Mean 0.0, SD 0.0, n = 30 early postpartum | Mean 0.1, SD 0.3, n = 30 late pregnancy; Mean 0.1, SD 0.1, n=30 early postpartum | Mean difference 0.2 (95% CI ‐0.35 to 0.75) late pregnancy; not estimable for early postpartum |
| Urgency | 3‐day voiding diary (24‐hour data) | Mean 0.9, SD 1.2, n=30 late pregnancy; Mean 0.1, SD 0.3, n=30 early postpartum | Mean 1.1, SD 1.6, n = 30 late pregnancy; Mean 0.2, SD 0.7, n=30 early postpartum | Late pregnancy mean difference ‐0.2 (95% CI ‐0.92 to 0.52); Early postpartum mean difference ‐0.1 (95% CI ‐0.37 to 0.17) |
|
| Nocturia | 3‐day voiding diary (24‐hour data) | Mean 2.3, SD 1.8, n=30 late pregnancy; Mean 0.8, SD 0.9, n=30 early postpartum | Mean 1.5, SD 0.9, n = 30 late pregnancy; Mean 0.6, SD 0.6, n=30 early postpartum | Late pregnancy mean difference 0.8 (95% CI 0.08 to 1.52); Early postpartum mean difference 0.2 (95% CI ‐0.19 to 0.59) | |
| PFMT versus usual care | |||||
| Hughes 2001 | Frequency of leakage | Experiencing occasional or more than occasional urine leakage (not clear how measured) | 217 of 585 at 3 months postpartum | 210 of 584 at 3 months postpartum | Relative risk 1.03 (95% CI 0.89 to 1.20) |
| Amount of leakage | Experiencing a drop or more than a drop of urine leakage (not clear how measured) | 228 of 585 at 3 months postpartum | 234 of 584 at 3 months postpartum | Relative risk 0.97 (95% CI 0.84 to 1.12) | |
| Other leakage severity | Not measured | ||||
| Sampselle 1998 | Frequency of leakage | Not measured | |||
| Amount of leakage | Not measured | ||||
| Other leakage severity | Average score from questionnaire re urine leakage with gentle cough, hard cough, sneeze and laugh scored 0 for none, 1 for dampness, 2 for wetness and 3 for soaked | Mean 0.38, SD 0.56, n=22 at 12 months postpartum | Mean 0.42, SD 0.49, n = 24 at 12 months postpartum | Not calculated as validity/reliability of this measure not known | |
| Torsdatter Markussen 2017 | UI severity | Urinary Incontinence Severity Index | Mean 2.8, SD 2.0, n = 11 at late pregnancy Mean 3.0, SD 1.0, n = 7 at 3 months postpartum |
Mean 4.4, SD 1.8, n = 9 at late pregnancy Mean 2.1, SD 2.0, n = 7 at 3 months postpartum |
Mean difference 1.6 (95% CI ‐0.2 to 3.4) at late pregnancy Mean difference ‐0.9 (95% CI ‐2.7 to 0.9) at early postpartum |
| FI severity | St. Mark's score | Median 0, IQR 3, n = 19 at late pregnancy Median 0, IQR 4, n = 18 at 3 months postpartum |
Median 0.5, IQR 13, n = 22 at late pregnancy Median 0, IQR 15, n = 22 at 3 months postpartum |
||
One trial reported faecal incontinence symptom severity, with no difference in medians and interquartile ranges between groups (Torsdatter Markussen 2017; Analysis 3.13).
Number of urinary or faecal incontinence episodes
One trial reported the number of urinary incontinence episodes in 24 hours (derived from a three‐day voiding diary) and found there was no meaningful difference between the groups in late pregnancy (MD 0.20, 95% CI ‐0.35 to 0.75, 60 women). There were too few leakage events in 24 hours to estimate the difference in the early postpartum period (Sut 2016). No trials reported the number of faecal incontinence episodes.
Loss of urine under stress test
The single trial reporting pad test data (24 hour) found no difference between PFMT and usual care groups (Fritel 2015; Analysis 3.14).
3.14. Analysis.
Comparison 3: Antenatal pelvic floor muscle training (PFMT) versus control for (mixed) prevention or treatment of incontinence, Outcome 14: Loss of urine under stress test early postnatal period (0‐3 months)
| Loss of urine under stress test early postnatal period (0‐3 months) | ||||
| Study | Measure | PFMT | Control | Difference |
| PFMT versus usual care | ||||
| Fritel 2015 | 24‐hour pad test (g) | Mean 0.9, SD 1.6, n = 78 at 2 months postpartum | Mean 1.3, SD 3.3, n = 85 at 2 months postpartum | Mean difference ‐0.40 (95% CI ‐1.19 to 0.39) |
Self‐reported measures of pelvic floor dysfunction
Six trials used a range of validated pelvic floor dysfunction questionnaires:
IIQ‐7 (Szumilewicz 2019). Data presented as mean percentage change, so not included in the primary outcome forest plots.
Urogenital Distress Index‐Short Form (UDI‐6) (Dokmeci 2008; Hyakutake 2018; Ko 2011; Sut 2016);
Female Pelvic Floor questionnaire (bladder, bowel, prolapse and sex scores) (Fritel 2015);
Pelvic Organ Prolapse/Urinary Incontinence Sexual Questionnaire (PISQ; higher score better) (Dokmeci 2008);
Pelvic Floor Distress Inventory (includes pelvic organ prolapse, urinary and faecal incontinence) (Hyakutake 2018);
Pelvic Floor Impact Questionnaire‐Short Form (includes pelvic organ prolapse, urinary and faecal incontinence) (Hyakutake 2018);
There were no evidence of a difference between groups for the majority of these measures at different time points (Analysis 3.15).
3.15. Analysis.
Comparison 3: Antenatal pelvic floor muscle training (PFMT) versus control for (mixed) prevention or treatment of incontinence, Outcome 15: Self‐reported measures of pelvic floor dysfunction
| Self‐reported measures of pelvic floor dysfunction | ||||
| Study | Outcome measure | PFMT data | Control data | Difference |
| PFMT versus no PFMT | ||||
| Ko 2011 | UDI‐6 (0‐100, 100 worse) | Mean 3.44, SD 3.26, n = 150 in late pregnancy; Mean 0.81, SD 1.36, n = 150 at 0‐3 months postpartum; Mean 0.35, SD 0.84, n =150 at > 3‐6 months postpartum | Mean 4.66, SD 3.32, n = 150 in late pregnancy; Mean 1.54, SD 1.59, n = 150 at 0‐3 months postpartum; Mean 0.86, SD 1.14, n = 150 at > 3‐6 months postpartum | Mean difference ‐1.22 (95% CI ‐1.96 to ‐0.48) in late pregnancy; Mean difference ‐0.73 (95% CI ‐1.06 to ‐0.40) at 0‐3 months' postpartum; Mean difference ‐0.51 (95% CI ‐0.74 to ‐0.28) at > 3‐6 months postpartum |
| Sut 2016 | UDI‐6 (0‐100, 100 worse) |
Mean 46.9, SD 8.7, n = 30 in late pregnancy; Mean 34.1, SD 6.6, n = 30 at early postpartum | Mean 44.1, SD 8.7, n=30 in late pregnancy; Mean 34.0, SD 8.2, n=30 at 0‐3 months' postpartum | Mean difference 2.8 (95% CI ‐1.60 to 7.20) in late pregnancy; Mean difference 0.1 (95% CI ‐3.67 to 3.87) at 0‐3 months' postpartum |
| Overactive bladder questionnaire (OAB‐q) total score (0‐100, 100 better) |
Mean 85.7, SD 13.5, n = 30 in late pregnancy; Mean 97.2, SD 8.7, n = 30 at early postpartum | Mean 90.0, SD 13.6, n = 30 in late pregnancy; Mean 97.6, SD 6.3, n = 30 at 0‐3 months' postpartum | Mean difference ‐4.3 (95% CI ‐11.16 to 2.56) in late pregnancy; Mean difference ‐0.4 (95% CI ‐4.24 to 3.44) at 0‐3 months' postpartum | |
| Szumilewicz 2019 | IIQ‐7 (0‐100; 100 worse) | Mean percentage change 0.20, SD 7.58%, n = 70 in late pregnancy | Mean percentage change 0.12, SD 0.93%, n = 27 in late pregnancy | Mean difference 0.8 (95% CI ‐1.73 to 1.89) |
| PFMT versus usual care | ||||
| Fritel 2015 | Female Pelvic Floor Questionnaire (FPFQ) bladder score (0‐10, 10 worse) | Mean 1.7, SD 1.3, n = 112 in late pregnancy; Mean 0.8, SD 0.9, n = 105 at 0‐3 months postpartum; Mean 0.9, SD 1.1, n = 94 at > 6‐12 months postpartum | Mean 2.0, SD 1.4, n = 111 in late pregnancy; Mean 0.9, SD 1.0, n = 107 at 0‐3 months postpartum; Mean 1.0, SD 1.1, n = 97 at > 6‐12 months postpartum | Mean difference ‐0.30 (95% CI ‐0.65 to 0.05) in late pregnancy; Mean difference ‐0.10 (95% CI ‐0.36 to 0.16) at 0‐3 months postpartum; Mean difference ‐0.10 (95% CI ‐0.41 to ‐0.12) at > 6‐12 months postpartum |
| FPFQ bowel score (0‐10) | Mean 1.3, SD 1.1, n = 112 in late pregnancy; Mean 1.2, SD 1.2, n = 104 at 0‐3 months postpartum; Mean 1.0, SD 1.0, n = 94 at > 6‐12 months postpartum | Mean 1.4, SD 1.1, n = 112 in late pregnancy; Mean 1.4, SD 1.2, n = 107 at 0‐3 months postpartum; Mean 1.1, SD 1.0, n = 97 > 6‐12 months postpartum | Mean difference ‐0.10 (95% CI ‐0.39 to ‐0.19) in late pregnancy; Mean difference ‐0.20 (95% CI ‐0.52 to 0.12) at 0‐3 months postpartum; Mean difference ‐0.10 (95% CI ‐0.38 to 0.18) at > 6‐12 months postpartum | |
| Hughes 2001 | BFLUTs questionnaire: a negative effect on exercise in response to question "does incontinence affect physical activity?" | 47 of 585 at 6 months postpartum | 41 of 584 at 6 months postpartum | Relative risk 1.14 (95% CI 0.76 to 1.71) |
| Hyakutake 2018 | PFDI‐20 total score (20 items; 0‐300, 300 worse) | Mean 27.8, SD 31.6, n = 37 at 6 weeks postpartum | Mean 35.5, SD 37.7, n = 37 at 6 weeks postpartum | Mean difference ‐7.70 (95% CI ‐23.55 to 8.15) at 6 weeks postpartum |
| POPDI‐6 (prolapse subscale) (6 items; 0‐100, 100 worse) | Mean 6.6, SD 8.4, n = 37 at 6 weeks postpartum | Mean 5.9, SD 12.1, n = 37 at 6 weeks postpartum | Mean difference 0.70 (95% CI ‐4.05 to 5.45) at 6 weeks postpartum | |
| Mørkved 2003 | Sexual satisfaction at 6 years post‐delivery | 34 of 94 | 17 of 94 | Relative risk 2.00 (95% CI 1.20 to 3.32) |
| PFMT versus unspecified control | ||||
| Dokmeci 2008 | UDI‐6 (6 items; 0‐100, 100 worse) | No data | No data | Authors stated that there was a significant decrease in scores between first trimester and third trimester and between third trimester and 6 weeks postpartum |
| IIQ‐7 | No data | No data | ||
Three trials measured some aspect of sexual function in pregnancy, immediately postpartum and up to six years post‐index delivery (Dokmeci 2008; Fritel 2015; Mørkved 2003). Overall, there was no difference in sexual function or the proportion of women who were sexually active in late pregnancy and up to 12 months' postpartum (Dokmeci 2008; Fritel 2015). At six years, Mørkved 2003 found that PFMT women were twice as likely to report sexual satisfaction compared to controls (Analysis 3.15).
Other self‐reported well‐being measures
Three trials used some other self‐reported well‐being measure: State Trait Anxiety Inventory (Miquelutti 2013); Psychological General Wellbeing Index (Stafne 2012); and Euro‐QoL‐5D (Fritel 2015). There were no differences between groups for these measures of well‐being (Analysis 3.16).
Adverse effects
Three trials reported no adverse effects (Fritel 2015; Miquelutti 2013; Szumilewicz 2019).
Labour and delivery outcome
Eight trials reported the number of caesarean sections, with no evidence of a difference between PFMT and control groups (RR 0.91, 95% CI 0.77 to 1.08; 8 trials, 2030 women, fixed‐effect, I² = 28%; Bø 2011; Fritel 2015; Hyakutake 2018; Ko 2011; Miquelutti 2013; Mørkved 2003; Stafne 2012; Sut 2016; Analysis 3.17). Mørkved 2003 found no difference in the type of delivery, although women in the supervised antenatal PFMT group had a shorter second stage of labour. However, it is worth noting that fetal head circumference was also smaller in the PFMT group. Ko 2011 also reported rates of episiotomy among women and there was no evidence of a difference between the groups (RR 0.86, 95% CI 0.53 to 1.39).
3.17. Analysis.
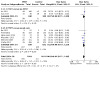
Comparison 3: Antenatal pelvic floor muscle training (PFMT) versus control for (mixed) prevention or treatment of incontinence, Outcome 17: Delivery outcome: caesarean section
Pelvic floor muscle function
PFM function was measured using perineometry, electromyography and vaginal digital palpation (Assis 2015; Dokmeci 2008; Fritel 2015; Mørkved 2003). In the three trials that reported data, point estimates favoured PFMT women over controls (Assis 2015; Fritel 2015; Mørkved 2003). There were differences in favour of PFMT in both trials that measured vaginal squeeze pressures (Analysis 3.19) (Assis 2015; Mørkved 2003).
3.19. Analysis.
Comparison 3: Antenatal pelvic floor muscle training (PFMT) versus control for (mixed) prevention or treatment of incontinence, Outcome 19: Pelvic floor muscle function
| Pelvic floor muscle function | ||||
| Study | Measure | PFMT | Control | Difference |
| PFMT versus no PFMT | ||||
| Assis 2015 | Perinometry, vaginal squeeze pressure (cm water), late pregnancy | Mean 9.45, SD 1.05, n = 58 | Mean 4.7, SD 1.7, n=29 | Mean difference 4.75 (95% CI 4.07 to 5.43) |
| Sut 2016 | Manometric perionometry, vaginal probe (reports as microvolts, likely cm water/Mercury) | Mean change 3.0, SD 2.5, n=30 baseline to late pregnancy; Mean change 6.4, SD 4.4, n = 30 baseline to early postpartum | Mean change ‐2.2, SD 5.2, n = 30 baseline to late pregnancy; Mean change ‐1.7, SD 6.1, n = 30 baseline to early postpartum | Late pregnancy mean difference 5.20 (95% CI 3.14 to 7.26); Early postpartum 8.10 (95% CI 5.41 to 10.79) |
| Szumilewicz 2019 | Electromyography with vaginal probe (microvolts) | Mean of 5 quick flicks, mean percentage change 11.0, SD 37.0, n = 70 baseline to late pregnancy Mean of 5 x 10 sec maximal contractions, mean percentage change 2.4, SD 27.0, n = 70 baseline to late pregnancy Mean of 1 x 60 sec static hold, mean percentage change 11.6, SD 74.0, n = 70 baseline to late pregnancy |
Mean of 5 quick flicks, mean percentage change 1.0, SD 26.0, n = 27 baseline to late pregnancy Mean of 5 x 10 sec maximal contractions, mean percentage change ‐4.0, SD 24.0, n = 27 baseline to late pregnancy Mean of 1 x 60 sec static hold, mean percentage change ‐3.0, SD 33.0, n = 27 baseline to late pregnancy |
|
| PFMT versus usual care | ||||
| Fritel 2015 | PFM strength, modified Oxford scale (0‐5, 5 better) | Mean 3.5, SD 1.5, n = 105 at 2 months postpartum | Mean 3.3, SD 1.3, n = 107 at 2 months postpartum | Mean difference 0.12 (95% CI ‐0.18 to 0.58) |
| Change in PFM strength, baseline to 2 months postpartum | Mean 0.08, SD 1.32, n = 101 | Mean ‐0.25, SD 1.11, n = 103 | Mean difference 0.33 (95% CI ‐0.00 to 0.66) | |
| Mørkved 2003 | Vaginal squeeze pressure (cm water) | Mean 29.5, 95% CI 26.8 to 32.2, n = 143 at 3 months postpartum | Mean 25.6, 95% CI 23.2 to 27.9, n = 146 at 3 months postpartum | Mean difference 3.90 (95% CI 0.35 to 7.45) |
| Torsdatter Markussen 2017 | Change in PFM strength, modified Oxford scale (0‐5, 5 better) | Median (min‐max) change 0 (‐2 to 2), n = 21, baseline to late pregnancy Median (min‐max) change 0 (‐4 to 2), n = 16, baseline to 3 months' postpartum |
Median (min‐max) change 0 (‐2 to 1), n = 19, baseline to late pregnancy Median (min‐max) change 0 (‐2 to 1), n = 21, baseline to 3 months' postpartum |
Changes in PFM were not significantly different between baseline and late pregnancy (P =0.36), and baseline and 3 months' postpartum (P = 0.44) |
| PFMT versus unspecified control | ||||
| Dokmeci 2008 | Electromyography with vaginal electrode | No data | No data | Authors stated that "Maximum pelvic floor strength was increased significantly between first and third visits in PFMT group, p=0.03 and between first and post‐partum visits in control group, p=0.03." |
Postnatal pelvic floor muscle training for treatment of incontinence
Five trials reported postnatal PFMT for treatment of incontinence and provided supervised PFMT beginning at three or more months' postpartum as treatment for women with persistent urinary incontinence symptoms after delivery (Ahlund 2013; Dumoulin 2004; Glazener 2001; Kim 2012; Wilson 1998). The control group received usual care or were asked not to do PFMT.
Primary outcomes
Self‐reported urinary or faecal incontinence
Women randomised to PFMT were about 22% less likely to have urinary incontinence after treatment compared to controls more than six and up to 12 months postdelivery (RR 0.78, 95% CI 0.69 to 0.87; 3 trials, 696 women, fixed‐effect). However, there was statistical heterogeneity in this comparison (I² = 90%). When the more conservative random‐effects model was used, the there was no evidence of a difference in outcome (RR 0.55, 95% CI 0.29 to 1.07; 696 women, I² = 90%, T² = 0.30; low‐quality evidence; Analysis 4.1).
4.1. Analysis.
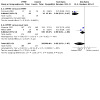
Comparison 4: Postnatal pelvic floor muscle training (PFMT) versus control for treatment of incontinence, Outcome 1: Urinary incontinence late postnatal period (> 6‐12 months)
Women in all three studies were recruited at three months or more postpartum. In the case of Dumoulin 2004, women were recruited after completing an incontinence questionnaire at their annual gynaecological visit, so it seems likely many were much more than three months' postpartum at trial entry. Therefore, after a further two months' intervention, it seemed likely the postintervention outcome was between six and 12 months' postdelivery for most. For this reason, a decision was made to present the data from the trial in the late postnatal category (greater than six to 12 months) along with that from Glazener 2001 and Wilson 1998, who both measured outcome 12 months postdelivery.
In addition to possible differences in timing of outcome measurement, there were other obvious dissimilarities between the three studies. In Dumoulin 2004, women randomised to the control group were specifically asked not to do any PFMT, while women in the control group in Glazener 2001 and Wilson 1998 received usual postnatal care and some did PFMT. Glazener 2001 reported a mean of 20 PFM contractions every day in the PFMT group versus five PFM contractions every day in the control group. A total of 86 (PFMT) versus 35 (control) were performed in the trial by Wilson 1998. The second difference was that Dumoulin 2004 employed a strengthening PFMT regimen, which incorporated electrical stimulation and biofeedback, while participants also had weekly contact with a physiotherapist for eight weeks. In contrast, Glazener 2001 and Wilson 1998 did not clearly aim their PFMT regimens at either strength or endurance and in both studies the intervention group had three or four contacts with health professionals over a six‐month period.
Glazener 2001 reported urinary incontinence prevalence at six years (RR 0.96, 95% CI 0.88 to 1.05; 1 trial, 516 women; Analysis 4.2) and 12 years after the index delivery (RR 1.03, 95% CI 0.94 to 1.12; 1 trial, 471 women; Analysis 4.3), with no evidence of a difference between PFMT and control group at either time‐point.
4.2. Analysis.
Comparison 4: Postnatal pelvic floor muscle training (PFMT) versus control for treatment of incontinence, Outcome 2: Urinary incontinence long term (> 5‐10 years)
4.3. Analysis.
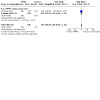
Comparison 4: Postnatal pelvic floor muscle training (PFMT) versus control for treatment of incontinence, Outcome 3: Urinary incontinence very long term (> 10 years)
Two trials reported data on the prevalence of faecal incontinence one year after delivery (Glazener 2001; Wilson 1998). There was statistically significant heterogeneity, therefore a random‐effects model was used to give a more conservative estimate of effect but there is no evidence of a difference between groups (RR 0.68, 95% CI 0.24 to 1.94, random‐effects, I² = 74%, T² = 0.42; 2 trials, 620 women; very low‐quality evidence; Analysis 4.4).
4.4. Analysis.
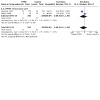
Comparison 4: Postnatal pelvic floor muscle training (PFMT) versus control for treatment of incontinence, Outcome 4: Faecal incontinence late postnatal period (> 6‐12 months)
Glazener 2001 reported no evidence of difference in the prevalence of faecal incontinence at six years (RR 0.95, 95% CI 0.60 to 1.50; 509 women; Analysis 4.5) and 12 years (RR 1.36, 95% CI 0.84 to 2.22; 1 trial, 468 women; Analysis 4.6) post‐index delivery. At both these time points, Glazener 2001 reported that about 50% of women in both the intervention and control groups were doing "any" PFMT. When questioned about performing daily PFMT, it was interesting to note that only 6% of the PFMT group were exercising daily, compared to 12% of the control group at six years' follow‐up. After 12 years, 7% of the intervention group and 8% of the control group were performing daily PFMT (Table 6).
4.5. Analysis.
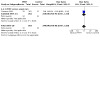
Comparison 4: Postnatal pelvic floor muscle training (PFMT) versus control for treatment of incontinence, Outcome 5: Faecal incontinence long term (> 5‐10 years)
4.6. Analysis.
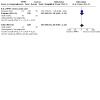
Comparison 4: Postnatal pelvic floor muscle training (PFMT) versus control for treatment of incontinence, Outcome 6: Faecal incontinence very long term (> 10 years)
Urinary incontinence‐specific quality of life
Two trials used incontinence‐specific quality of life measures (Dumoulin 2004 IIQ and UDI; Kim 2012 BFLUTS). Kim 2012 found no evidence of a difference between PFMT and usual care groups post‐treatment (MD ‐1.66, 95% CI ‐3.51 to 0.19; 18 women; low‐quality evidence; Analysis 4.7). Dumoulin 2004 reported an improvement in IIQ and UDI score in women who were doing PFMT compared with women who were randomised to the control (no PFMT) group (Analysis 4.10).
4.7. Analysis.
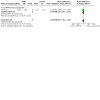
Comparison 4: Postnatal pelvic floor muscle training (PFMT) versus control for treatment of incontinence, Outcome 7: Urinary incontinence‐specific quality of life
4.10. Analysis.
Comparison 4: Postnatal pelvic floor muscle training (PFMT) versus control for treatment of incontinence, Outcome 10: Other self‐reported well‐being measures
| Other self‐reported well‐being measures | ||||
| Study | Outcome measure | PFMT data | Control data | Difference |
| Glazener 2001 | Hospital Anxiety and Depression Score ‐ anxiety score | Mean 6.1, 95% CI 5.6 to 6.5, n = 238 at 12 months | Mean 6.8, 95% CI 6.3 to 7.3, n = 219 at 12 months postpartum | Mean difference ‐0.79 (95% CI ‐1.43 to ‐0.05) |
Faecal incontinence‐specific quality of life
Not reported.
Secondary outcomes
Self‐reported severity of incontinence
All five treatment trials reported some data on incontinence severity, for instance frequency or amount of urine leakage. None of the measures, or the methods of reporting these, were common to the five trials. The data suggest that women randomised to PFMT with symptoms of urinary incontinence might have had less severe symptoms than women in the control groups but this was not a consistent or clear‐cut finding (Analysis 4.8).
4.8. Analysis.
Comparison 4: Postnatal pelvic floor muscle training (PFMT) versus control for treatment of incontinence, Outcome 8: Severity of incontinence
| Severity of incontinence | |||||
| Study | Measure of | Outcome measure | PFMT data | Control data | Difference |
| PFMT versus no PFMT | |||||
| Dumoulin 2004 | Frequency of leakage | Not measured | |||
| Amount of leakage | Change, in grams, in 20‐min pad test with standardised bladder volume | A: Median change 19.0, interquartile range 6.0 to 25.0, n = 23 after 9 weeks of PFMT B: Median change 8, interquartile range 4.0 to 2.35, n = 20 after 9 weeks of PFMT |
Median change 0, interquartile range ‐3.0 to 9.8, n = 19 after 9 weeks of control condition | Not calculable | |
| Other leakage | Change in VAS for perceived burden of incontinence (Stach‐Lempinen 2001) | A: Median change 3.0, interquartile range 2.0 to 4.0, n = 23 after 9 weeks of PFMT B: Median change 2.5, interquartile range 0.8 to 5.0, n = 20 after 9 weeks of PFMT |
Median change 0, interquartile range ‐0.1 to 0.02, n = 19 after 9 weeks of control condition | Not calculable | |
| PFMT versus usual care | |||||
| Ahlund 2013 | Incontinence score (0‐20, 20 worse) | ICIQ‐FLUTS | Median 4.0, range 0 to 15, n = 40 at 9 months postpartum | Median 4, range 0 to 12, n = 42 at 9 months postpartum | Not calculable |
| Voiding score (0‐12, 12 worse) | ICIQ‐FLUTS | Median 1.0, range 0 to 5, n = 40 at 9 months postpartum | Median 0.0, range 0 to 8, n = 42 at 9 months postpartum | Not calculable | |
| Incontinence score (0‐20, 20 worse) | ICIQ‐FLUTS | Median 4.0, range 0 to 15, n = 40 at 9 months postpartum | Median 4, range 0 to 12, n = 42 at 9 months postpartum | Not calculable | |
| Glazener 2001 | Frequency of leakage | Not measured | |||
| Amount of leakage | Using absorbent pads | 41 of 276 at 12 months postpartum | 55 of 245 at 12 months postpartum | Relative risk 0.66 (95% CI 0.46, 0.95) | |
| Other leakage severity | Visual analogue scale for severity of urine leakage | Mean 2.8, 95% CI 2.4 to 3.1, n = 142 at 12 months postpartum | Mean 3.6, 95% CI 3.1 to 4.0, n = 142 at 12 months postpartum | Mean difference ‐0.80 (95% CI ‐1.37 to ‐0.23) | |
| Kim 2012 | Urinary symptoms (? range) | BFLUTS | Mean 40.56, SD 5.36, n = 9 at between 8‐14 weeks postpartum | Mean 46.89, SD 3.62, n = 9 at between 8‐14 weeks postpartum | |
| Wilson 1998 | Frequency of leakage | Not measured | |||
| Amount of leakage | Urine loss on home pad test (Wilson et al 1989), in grams | Mean 2.1, 95% CI ‐0.3 to 4.5, n = 18 at 12 months postpartum | Mean 2.6, 95% CI 0.1 to 5.1, n = 82 at 12 months postpartum | Mean difference ‐0.50 (95% CI ‐3.81 to 2.81) | |
| Other leakage severity | Not measured | ||||
Number of urinary or faecal incontinence episodes
None of the trials reported number of urinary or faecal incontinence episodes.
Loss of urine under stress test
None of the trials reported loss of urine under stress test.
Self‐reported measures of pelvic floor dysfunction
One trial reported median and interquartile ranges for the UDI‐6 and IIQ‐7, with no differences between groups (Dumoulin 2004; Analysis 4.9).
4.9. Analysis.
Comparison 4: Postnatal pelvic floor muscle training (PFMT) versus control for treatment of incontinence, Outcome 9: Self‐reported measures of pelvic floor dysfunction
| Self‐reported measures of pelvic floor dysfunction | ||||
| Study | Outcome measure | PFMT data | Control data | Difference |
| Dumoulin 2004 | Change in UDI (maximum score 57) | A: Median change 4, interquartile range 1 to 10, n = 23 after 9 weeks PFMT B: Median change 7, interquartile range 3 to 8, n = 20 after 9 weeks PFMT |
Median change 0, interquartile range ‐2.3 to 6.5, n = 19 after 9 weeks of control condition | Not calculable |
| Change in IIQ (maximum score 90) | A: Median change 10, interquartile range 2 to 16, n = 23 after 9 weeks PFMT B: Median change 13, interquartile range 6 to 25, n = 20 after 9 weeks PFMT |
Median change 0.5, interquartile range ‐6.5 to 5.0, n = 19 after 9 weeks of control condition | Not calculable | |
Other self‐reported well‐being measures
Glazener 2001 used the Hospital Anxiety and Depression Scale to measure quality of life and found reduced anxiety in the PFMT group (Analysis 4.10).
Adverse effects
Dumoulin 2004 stated that none of the women in the PFMT group reported any adverse events (with PFMT or electrical stimulation).
Labour and delivery outcome
No trials reported this outcome.
Pelvic floor muscle function
One trial measured PFM function using a dynamometer and three trials reported vaginal squeeze pressure (Ahlund 2013; Dumoulin 2004; Kim 2012; Wilson 1998). Dynamometer findings favoured the PFMT group, as did the vaginal squeeze pressure readings in two trials (Ahlund 2013; Dumoulin 2004; Kim 2012; Analysis 4.11).
4.11. Analysis.
Comparison 4: Postnatal pelvic floor muscle training (PFMT) versus control for treatment of incontinence, Outcome 11: Pelvic floor muscle function
| Pelvic floor muscle function | ||||
| Study | Outcome measure | PFMT data | Control data | Difference |
| PFMT versus no PFMT | ||||
| Dumoulin 2004 | Maximal strength (Newtons, pelvic floor dynamometer, Dumoulin et al 2003) | A: Median change 0.7, range ‐0.2 to 2.3, n = 23 after 9 weeks PFMT B: Median change 0.5, range ‐0.6 to 2.5, n = 20 after 9 weeks PFMT |
Median change ‐0.5, range ‐1.7 to 1.0, n = 19 after 9 weeks PFMT | Not calculable |
| PFMT versus usual care | ||||
| Ahlund 2013 | Maximal voluntary contraction (cm mercury, perineometer) | Median 26.0, estimated range 7 to 49, n = 40 at 9 months postpartum | Median 18.2, estimated range 6 to 54, n = 42 at 9 months postpartum | Not calculable |
| Endurance (secs, continuous contraction until pressure=0) | Median 26.7, estimated range 1 to 65, n = 40 at 9 months postpartum | Median 23.4, estimated range 3 to 60, n = 42 at 9 months postpartum | Not calculable | |
| Oxford scale (0‐5; 0=no activity, 5=strong) | Median 4, estimated range 2 to 5, n = 40 at 9 months postpartum | Median 3, estimated range 2 to 5, n = 42 at 9 months postpartum | Not calculable | |
| Kim 2012 | Maximal squeeze pressure (mm mercury, perineometer) | Mean 25.78, SD 10.74, n = 9 at between 8‐14 weeks postpartum | Mean 8.11, SD 2.57, n = 9 at between 8‐14 weeks postpartum | Mean difference 17.67 (95% CI 10.46 to 24.88) |
| Holding time (sec, perineometer) | Mean 14.34, SD 3.08, n = 9 at between 8‐14 weeks postpartum | Mean 8.89, SD 2.10, n = 9 at between 8‐14 weeks postpartum | Mean difference 5.45 (95% CI 3.01 to 7.89) | |
| Wilson 1998 | Maximal vaginal squeeze pressure (cm water) | Mean 13.6, 95% CI 9.8 to 17.4, n = 19 at 12 months postpartum | Mean 13.1, 95% CI 11.3 to 14.9, n = 79 at 12 months postpartum | Mean difference 0.50 (95%CI ‐3.46 to 4.46) |
Postnatal pelvic floor muscle training for mixed prevention and treatment of incontinence
Fourteen trials reported postnatal PFMT for mixed prevention and treatment of incontinence (Chiarelli 2002; Dufour 2019; Ewings 2005; Frost 2014; Hilde 2013; Kou 2013; Liu 2011; Meyer 2001; Oakley 2016; Peirce 2013; Sacomori 2019; Sleep 1987; Wen 2010; Yang 2017). These randomised women to postnatal PFMT versus usual care with the exception of three, in which the controls were not instructed in exercise (Meyer 2001; Sacomori 2019; Yang 2017). The trials recruited previously nulliparous women during their first pregnancy (Meyer 2001), women having their first baby (Dufour 2019; Hilde 2013; Liu 2011; Oakley 2016; Peirce 2013), or postnatal women of mixed parity (Chiarelli 2002; Ewings 2005; Sacomori 2019; Sleep 1987; Yang 2017). Three trials did not report this information (Frost 2014; Kou 2013; Wen 2010).
Primary outcomes
Self‐reported urinary or faecal incontinence
Two trials reported data from the early postnatal period (Sacomori 2019; Yang 2017). One, a conference abstract, reported no usable data (Frost 2014). Women randomised to PFMT were about 46% less likely to report urinary incontinence early postpartum compared to controls (RR 0.54, 95% CI 0.44 to 0.66, fixed‐effects, I² = 0%, T² = 0.00, 2 trials, 321 women; Analysis 5.1). The controls in Sacomori 2019 and Yang 2017 did no PFMT but the level of contrast between PFMT and control groups in exercise supervision and prescription varied. In Sacomori 2019 (low contrast), women were asked to do home PFMT twice daily, with approximately 49% performing PFMT at least three times per week. Half of the PFMT women in Yang 2017 (low contrast) were also prescribed home exercises twice daily, while the other half (high contrast) received 15 sessions of one‐to‐one supervised PFMT in conjunction with electrical stimulation over five weeks.
5.1. Analysis.
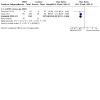
Comparison 5: Postnatal pelvic floor muscle training (PFMT) versus control for (mixed) prevention or treatment of incontinence, Outcome 1: Urinary incontinence early postnatal period (0‐3 months)
However, as reported in six trials with longer follow‐up (Chiarelli 2002; Ewings 2005; Hilde 2013; Kou 2013; Meyer 2001; Sleep 1987), there was no evidence of a difference in the risk of urinary incontinence in women randomised to postnatal PFMT or control group in the mid‐postnatal period, up to six months (RR 0.95, 95% CI 0.75 to 1.19, random‐effects, I² = 65%, T² = 0.04; 5 trials, 2800 women; Analysis 5.2). Likewise, there was no evidence of a difference in the risk in the late postnatal period (RR 0.88, 95% CI 0.71 to 1.09, fixed‐effect, I² = 50%, T² = 0.00; 3 trials, 826 women; moderate‐quality evidence; Analysis 5.3).
5.2. Analysis.
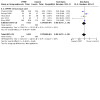
Comparison 5: Postnatal pelvic floor muscle training (PFMT) versus control for (mixed) prevention or treatment of incontinence, Outcome 2: Urinary incontinence mid‐postnatal period (> 3‐6 months)
5.3. Analysis.
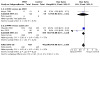
Comparison 5: Postnatal pelvic floor muscle training (PFMT) versus control for (mixed) prevention or treatment of incontinence, Outcome 3: Urinary incontinence late postnatal period (> 6‐12 months)
There was statistically significant heterogeneity in both the mid‐ and late‐postnatal comparisons. No details of the PFMT programmes were provided in three of the five trials contributing data to the mid‐postnatal comparison (Ewings 2005; Meyer 2001; Sleep 1987). In addition, there were other notable dissimilarities, including the risk profile of the recruited population (e.g. Chiarelli 2002), and the degree of contrast between PFMT and control groups in exercise supervision and prescription (e.g. Sleep 1987, low contrast; Kou 2013, high contrast). In the two trials with findings in favour of PFMT, the control groups were offered usual care, while the PFMT interventions were intensively supervised or enhanced with application of health behaviour theory (Chiarelli 2002; Kou 2013). In addition, Chiarelli 2002 recruited women who were potentially at increased risk of postnatal incontinence, such as those who had a large baby or a forceps delivery.
There was considerably less difference in PFMT and control groups in the other three trials for various reasons and none found a difference between the groups. All control groups received usual postnatal care that may have or did include information about PFMT. Ewings 2005 reported that 114/117 women randomised to PFMT received one‐to‐one instruction on PFMT, but only 21 attended one group class, with five attending both available classes. There was no difference between groups. Hilde 2013 randomised women to PFMT delivered in a weekly exercise class plus home exercise, versus a home exercise control condition. Both groups had a correct PFM contraction confirmed prior to training. Sleep 1987 randomised women within 24 hours of delivery to an individual daily session with a midwife co‐ordinator while in hospital and home exercise, versus usual care that included postnatal classes taken by an obstetric physiotherapist. At three months' postpartum, the proportion of women doing PFMT was reasonably similar (58% with PFMT and 42% with control).
Chiarelli 2002 and Kou 2013 also contributed data to the late postpartum comparison with the addition of that from Meyer 2001. Women in Meyer 2001 were randomised to either eight months of supervised PFM rehabilitation with a physiotherapist or no PFMT. Like Kou 2013, there was a high degree of contrast between the PFMT and control groups. However, unlike Kou 2013, Meyer 2001 found no difference between groups in the prevalence of urinary incontinence. Neither of these trials reported details of their randomisation procedures.
Two trials reported the prevalence of postnatal faecal incontinence (Meyer 2001; Sleep 1987). There was no little to no difference between PFMT and control groups in the early postnatal period (RR 0.93, 95% CI 0.51 to 1.67, 1609 women; Sleep 1987; Analysis 5.4). There was no evidence of a difference in the late postnatal period (RR 0.73, 95% CI 0.13 to 4.21, 107 women; low‐quality evidence; Analysis 5.5).
5.4. Analysis.
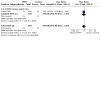
Comparison 5: Postnatal pelvic floor muscle training (PFMT) versus control for (mixed) prevention or treatment of incontinence, Outcome 4: Faecal incontinence early postnatal period (0‐3 months)
5.5. Analysis.
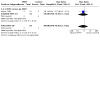
Comparison 5: Postnatal pelvic floor muscle training (PFMT) versus control for (mixed) prevention or treatment of incontinence, Outcome 5: Faecal incontinence late postnatal period (> 6‐12 months)
Urinary incontinence‐specific quality of life
Two of the 11 trials reported urinary incontinence‐specific quality of life data (Dufour 2019; Sacomori 2019). Data from Sacomori 2019 were not suitable for inclusion in the meta‐analysis (median and interquartile ranges) and showed no difference between groups (Analysis 5.9). Dufour 2019 found little to no difference between PFMT and controls (IIQ‐7; MD 0.50 higher, 95% CI 5.53 lower to 6.53 higher, 23 women; low quality evidence; Analysis 5.6).
5.9. Analysis.
Comparison 5: Postnatal pelvic floor muscle training (PFMT) versus control for (mixed) prevention or treatment of incontinence, Outcome 9: Self‐reported measures of pelvic floor dysfunction
| Self‐reported measures of pelvic floor dysfunction | |||||
| Study | Measure of | Outcome measure | PFMT data | Control data | Difference |
| PFMT plus versus PFMT | |||||
| Dufour 2019 | Distress associated with UI | UDI‐6 (0‐100, 100 worse) at mid‐postnatal period | Mean 7.3, SD 5.9, n = 13 | Mean 4.6, SD 6.0, n = 10 | Mean difference 2.7 (95% CI ‐8.90 to 2.89) |
| Yang 2017 | Pelvic organ prolapse | POP‐Q, stage 1 or 2 | 31 of 129 at 3 months postpartum | 32 of 60 at 3 months postpartum | Relative risk 0.45 (95% CI 0.31 to 0.66) |
| PFMT versus no PFMT | |||||
| Hilde 2013 | Pelvic organ prolapse | ICIQ‐Vag, bulging inside vagina (yes, no) | 8 of 87 at 6 months postpartum | 22 of 88 at 6 months postpartum | Mean difference 0.37 (95% CI 0.17 to 0.78) |
| Pelvic organ prolapse | ICIQ‐Vag, bulging outside vagina (yes, no) | 5 of 87 at 6 months postpartum | 6 of 88 at 6 months postpartum | Mean difference 0.84 (95% CI 0.27 to 2.66) | |
| Pelvic organ prolapse | POP‐Q, stage 1 or 2 | 61 of 87 at 6 months postpartum | 64 of 88 at 6 months postpartum | Mean difference 0.88 (95% CI 0.46 to 1.70) | |
| Meyer 2001 | Sexual function | Reduced vaginal response at 10 months postpartum | 5 of 51 | 13 of 56 | Relative risk 0.42 (95% CI 0.16 to 1.10) |
| Sacomori 2019 | UI specific quality of life | ICIQ‐SF (0‐21, 21 worse) | Median 0, IQR 0, n = 67 at 3 months postpartum | Median 0, IQR 0, n = 65 at 3 months postpartum | Not calculable |
| PFMT versus usual care | |||||
| Oakley 2016 | |||||
| Distress associated with UI | UDI‐6 (0‐100, 100 worse) at early‐postnatal period | Median 0.0, IQR 12.5, n = 27 at 12 weeks postpartum | Median 11.11, IQR 37.50, n = 23 at 12 weeks postpartum | Not calculable | |
| FI specific quality of life | FIQOL (29 items, 4 domain scores, each item scored 1‐5, higher better) | Lifestyle: Median 4.0, IQR 0.3, n = 27 at 12 weeks postpartum Coping/behaviour: Median 3.89, IQR 0.5, n = 27 at 12 weeks postpartum Depression/self perception: Median 3.89, IQR 0.5, n = 27 at 12 weeks postpartum Embarrassment: Median 4.0, IQR 0.0, n = 27 at 12 weeks postpartum |
Lifestyle: Median 4.0, IQR 0.1, n = 23 at 12 weeks postpartum Coping/behaviour: Median 3.89, IQR 0.4, n = 23 at 12 weeks postpartum Depression/self perception: Median 3.89, IQR 0.3, n = 23 at 12 weeks postpartum Embarrassment: Median 4.0, IQR 0.1, n = 23 at 12 weeks postpartum |
Not calculable | |
| Peirce 2013 | FI specific quality of life | FIQOL (29 items, 4 domain scores, each item scored 1‐5, higher better) | Lifestyle: no data; coping/behaviour: no data, depression/self perception: no data, embarrassment: no data, n = 30 at 3 months' postpartum |
Lifestyle: no data, coping/behaviour: no data, depression/self perception: no data, embarrassment: no data, n = 90 at 3 months' postpartum | Lifestyle P = 0.29, coping/behaviour P = 0.27, depression/self perception P = 089, embarrassment P = 0.51 |
| Sleep 1987 | |||||
| Sexual function | Attempted sexual intercourse within 3 months of delivery | 714 of 819 | 681 of 792 | Relative risk 1.01 (95% CI 0.98 to 1.05) | |
| Sexual function | Dyspareunia at 3 months postpartum | 167 of 819 | 154 of 792 | Relative risk 1.05 (95% CI 0.86 to 1.28) | |
5.6. Analysis.
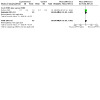
Comparison 5: Postnatal pelvic floor muscle training (PFMT) versus control for (mixed) prevention or treatment of incontinence, Outcome 6: Urinary incontinence‐specific quality of life
Faecal incontinence‐specific quality of life
Two of the 11 trials reported on faecal incontinence‐specific quality of life but the data (median and interquartile ranges and P values alone respectively) were not suitable for meta‐analysis (Oakley 2016; Peirce 2013). There were no reported differences between the groups in either study (Analysis 5.9).
Secondary outcomes
Self‐reported severity of incontinence
Five trials provided some self‐reported data on urinary incontinence symptom severity and there was no apparent consistent pattern of effect (Liu 2011; Sacomori 2019; Sleep 1987; Wen 2010; Yang 2017). None of the trials used the same measure and some of these were unvalidated (Analysis 5.7).
5.7. Analysis.
Comparison 5: Postnatal pelvic floor muscle training (PFMT) versus control for (mixed) prevention or treatment of incontinence, Outcome 7: Severity of incontinence
| Severity of incontinence | |||||
| Study | Measure of | Outcome measure | PFMT data | Control data | Difference |
| PFMT versus no PFMT | |||||
| Sacomori 2019 | Frequency of leakage | ICIQ‐SF, frequency domain (0‐5, 5 worse) | Median 0, IQR 0, n = 67 at 3 months postpartum | Median 0, IQR 0, n = 65 at 3 months postpartum | Median difference 0 |
| ICIQ‐SF, amount domain (0‐6, 6 worse) | Median 0, IQR 0, n = 67 at 3 months postpartum | Median 0, IQR 0, n = 65 at 3 months postpartum | Median difference 0 | ||
| ICIQ‐SF, influence of leakage on quality of life domain (0‐10, 10 worse) | Median 0, IQR 0, n = 67 at 3 months postpartum | Median 0, IQR 0, n = 65 at 3 months postpartum | Median difference 0 | ||
| Yang 2017 | Severity of UI | Continence severity score (number of leakage episodes per week; 0 = none, 1 = once or fewer times per week; 2 = 2‐3 times per week; 3 = 3‐7 times per week, 4 = >7 times per week, 5 = leaking all the time) | Scored 0 63 of 129, scored 1 52 of 129, scored 2 13 of 129, scored 3 1 of 129, scored 4 0 of 129, scored 5 0 of 129 | Scored 0 4 of 60, scored 1 4 of 60, scored 2 25 of 60, scored 3 25 of 60, scored 4 2 of 60, scored 5 0 of 60 | Relative risk, 0; 7.33 (95% CI 2.80 to 19.19), 1; 6.05 (95% CI 2.29 to 15.95), 2; 0.24 (95% CI 0.13 to 0.44), 3; 0.02 (95% CI 0.00 to 0.13), 4; 0.09 (95% CI 0.00 to 1.93), 5; not estimable |
| PFMT versus usual care | |||||
| Hilde 2013 | Amount of leakage | Pad test, 1 min with standardised bladder volume (positive test 2g or more) | Median 4.0, range 2.0 to 80.0, n = 87 at 6 months postpartum | Median 6.0, range 2.0 to 114.0, n = 88 at 6 months postpartum | Mann Whitney‐U 213.5, z‐value ‐0.13, p‐value 0.90 |
| Liu 2011 | Urinary condition score, not specified (lower score better; 3 months postpartum) | Mean 2.2, SD 0.2, n = 106 | Mean 2.8, SD 0.4, n = 86 | Mean difference ‐0.60 (95% CI ‐0.69 to ‐0.51) | |
| Urinary condition score, not specified (lower score better; 6 months postpartum) | Mean 2.0, SD 0.4, n = 106 | Mean 2.5, SD 0.4, n = 86 | Mean difference ‐0.50 (95% CI ‐0.61 to ‐0.39) | ||
| Oakley 2016 | Severity of FI | FISI (higher score worse) | Median 6.0, IQR 20.5, n = 27 at 12 weeks postpartum | Median 13.5, IQR 22.25, n = 23 at 12 weeks postpartum | Not calculable |
| Sleep 1987 | Frequency of leakage | Urine leakage once or more per week | 64 of 816 at 3 months postpartum | 57 of 793 at 3 months postpartum | Relative risk 1.09 (95% CI 0.77 to 1.54) |
| Amount of leakage | Using absorbent pads sometimes or always | 38 of 815 at 3 months postpartum | 43 of 793 at 3 months postpartum | Relative risk 0.86 (95% CI 0.56 to 1.32) | |
| Other leakage severity | Not measured | ||||
| Wen 2010 | Stress UI | Criteria from International Continence Society (0‐5, 5 worse) | Mean 2.84, SD 0.43, n = 75 at 6 months postpartum | Mean 2.50, SD 0.41, n = 73 at 6 months postpartum | Mean difference 0.34 (95% CI 0.20 to 0.48) |
| Criteria from International Continence Society (0‐5, 5 worse) | Mean 1.16, SD 0.38, n = 75 at 12 months postpartum | Mean 2.20, SD 0.39, n = 73 at 12 months postpartum | Mean difference ‐1.04 (95% CI ‐1.16 to ‐0.92) | ||
| Amount of leakage | Pad test (postive test more than 2g) | 7 of 75 at 12 months postpartum | 19 of 73 at 12 months postpartum | Relative risk 0.29 (95% CI 0.11 to 0.75) | |
One trial contained self‐reported data on faecal incontinence symptom severity at three months' postpartum (Oakley 2016). The median score favoured the PFMT group over the controls but it was not possible to calculate a difference (Analysis 5.7).
Number of urinary or faecal incontinence episodes
None of the trials reported number of urinary or faecal incontinence episodes.
Loss of urine under stress test
Three trials reported pad test data, with the same cut‐off for a positive test (2 g or more) at three months' postpartum (Yang 2017), or six months' postpartum (Hilde 2013; Wen 2010). Pooled data demonstrated no evidence of a difference in the risk of positive pad test between PFMT and controls (RR 0.83, 95% CI 0.60 to 1.13 3 trials; 512 women, fixed‐effect, I² = 63.4%; Analysis 5.8). Yang 2017 was the only one of the three trials to find fewer positive pad tests in the PFMT group, with plausible reasons for this difference being the different timing (three versus six months) measure and the comparator (no PFMT versus usual care).
5.8. Analysis.
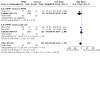
Comparison 5: Postnatal pelvic floor muscle training (PFMT) versus control for (mixed) prevention or treatment of incontinence, Outcome 8: Loss of urine under stress test postpartum
Self‐reported measures of pelvic floor dysfunction
Two trials used the UDI‐6 (Dufour 2019; Oakley 2016). Dufour 2019 found no difference between the two groups in the mid‐postnatal period. In Oakley 2016, the median score favoured the PFMT group over usual care at three months' postpartum but it was not possible to calculate a difference (Analysis 5.9).
Two trials used unvalidated measures of sexual function and neither found any difference between groups (Meyer 2001; Sleep 1987; Analysis 5.9).
Two trials reported data on pelvic organ prolapse symptoms or grading (Hilde 2013; Yang 2017). Yang 2017 found a difference in Pelvic Organ Prolapse‐Quantification (POP‐Q) (Stage 1 or 2) between PFMT and no PFMT at three months' postpartum but Hilde 2013 did not find any evidence of a difference between PFMT and usual care at six months postpartum (Analysis 5.9).
Other self‐reported well‐being measures
Two trials used other measures of well‐being: Sleep 1987 used a single unvalidated well‐being question and Oakley 2016 reported the mental and physical components of the SF‐12. There were no differences between the groups (Analysis 5.10).
5.10. Analysis.
Comparison 5: Postnatal pelvic floor muscle training (PFMT) versus control for (mixed) prevention or treatment of incontinence, Outcome 10: Other self‐reported well‐being measures
| Other self‐reported well‐being measures | |||||
| Study | Measure of | Outcome measure | PFMT data | Control data | Differnce |
| PFMT versus usual care | |||||
| Oakley 2016 | Health status measure | SF‐12, physical component score (0‐100, 100 better) | Mean 53.51, SD 4.63, n = 27 at 12 weeks postpartum | Mean 53.08, SD 5.92, n = 23 at 12 weeks postpartum | Mean difference 0.43 (95% CI ‐2.55 to 3.41) |
| SF‐12, mental component score (0‐100, 100 better) | Mean 51.36, SD 7.74, n = 27 at 12 weeks postpartum | Mean 52.79, SD 8.90, n = 23 at 12 weeks postpartum | Mean difference ‐1.43 (95% CI ‐6.09 to 3.23) | ||
| Sleep 1987 | General wellbeing | 5 point Likert scale in response to question "how are you feeling generally?" | 11 feeling not very well or not at all well, n = 816 at 3 months postpartum | 18 feeling not very well or not at all well, n = 793 at 3 months postpartum | Not calculated as validity/reliability of this measure not known |
Adverse effects
Three trials collected data on adverse events, with none reported (Hilde 2013; Peirce 2013; Yang 2017).
Labour and delivery outcome
No trials reported this outcome.
Pelvic floor muscle function
Four studies measured PFM function using the Oxford scale (Liu 2011; Oakley 2016; Wen 2010; Yang 2017). The outcomes at three, six and 12 months' postpartum were in favour of the PFMT group compared to no PFMT or usual care, although not all were statistically significantly different. Four trials assessed vaginal squeeze pressure at three, six, 10 and 12 months' postpartum (Hilde 2013; Kou 2013; Meyer 2001). Yang 2017, who included no PFMT controls, was the only study to find a statistically significant difference in favour of the PFMT group. Three trials measured anal pressure, in cm of water (Meyer 2001) or mmHg (Oakley 2016; Peirce 2013), and none found a difference in squeeze pressure between PFMT and control groups (Analysis 5.11).
5.11. Analysis.
Comparison 5: Postnatal pelvic floor muscle training (PFMT) versus control for (mixed) prevention or treatment of incontinence, Outcome 11: Pelvic floor muscle function
| Pelvic floor muscle function | ||||
| Study | Outcome measure | PFMT data | Control data | Difference |
| PFMT plus versus PFMT | ||||
| Yang 2017 | PF muscle strength (Oxford scale) (0‐5, 5 better) | Scored 0 or 1, 0 of 129, scored 2, 1 of 129; scored 3, 15 of 129; scored 4, 68 of 129, scored 5, 45 of 129 at 3 months postpartum | Scored 0 or 1, 0 of 60; scored 2, 21 of 60; scored 3, 28 of 60; scored 4, 10 of 60; scored 5, 1 of 60 at 3 months postpartum | Relative risk, 0; not estimable, 1; not estimable, 2; 0.02 (95% CI 0.00 to 0.16), 3; 0.25 (95% CI 0.14 to 0.43), 4; 3.16 (95% CI 1.76 to 5.70), 5; 20.93 (95% CI 2.95 to 148.27) |
| Maximal squeeze pressure (cm water) | PFMT only Mean 100.98, SD 15.97, n = 63 add to PFMT + ES Mean 111.75, SD 12.77, n = 69 Combined Mean 106.65, SD 15.30, n = 131 |
Mean 80.8, SD 16.01, n = 60 at 3 months postpartum | Combined (PFMT) mean difference 25.85 (95% CI 21.03 to 30.67) | |
| PFMT versus no PFMT | ||||
| Meyer 2001 | Strength, vaginal squeeze pressure, in cm water (manometer, 10 months postpartum) | Mean 33, SD 22, n = 51 | Mean 41, SD 27, n = 56 | Mean difference ‐8.0 (95%CI ‐17.3 to 1.3) |
| Mean anal squeeze pressure, in cm water (anorectal manometer, 10 months postpartum) | Mean 36, SD 20, n = 51 | Mean 43, SD 24, n = 56 | Mean difference ‐7.0 (95%CI ‐15.4 to 1.4) | |
| PFMT versus usual care | ||||
| Hilde 2013 | Resting pressure, vaginal squeeze pressure (cm water, manometer) | n = 87 at 6 months postpartum | n = 88 at 6 months postpartum | Mean difference 1.3 (95% CI ‐1.0 to 3.6, p=0.257), reported by authors |
| Strength, vaginal squeeze pressure (cm water, manometer) | n = 87 at 6 months postpartum | n = 88 at 6 months postpartum | Mean difference 3.3 (95% CI ‐1.4 to 8.0, p=0.172), reported by authors | |
| Endurance, vaginal squeeze pressure (cm sec, manometer) | n = 87 at 6 months postpartum | n = 88 at 6 months postpartum | Mean difference 29.8 (95% CI ‐10.6 to 70.2, p=0.148), reported by authors | |
| Kou 2013 | Resting pressure, vaginal squeeze pressure (cm water) | Mean 33.7, SD 15.8, n = 80 at 12 months postpartum | Mean 30.1, SD 15.3, n = 70 at 12 months postpartum | Mean difference 3.60 (95% CI ‐1.38 to 8.58) |
| Vaginal squeeze pressure (cm water) | Mean 86.5, SD 14.8, n = 80 at 12 months postpartum | Mean 60.4, SD 14.1, n = 70 at 12 months postpartum | Mean difference 26.10 (95% CI 21.47 to 30.73) | |
| Contraction time (sec) | Mean 5.9, SD 2.9, n = 80 at 12 months postpartum | Mean 4.1, SD 2.6, n = 70 at 12 months postpartum | Mean difference 1.80 (95% CI 0.92 to 2.68) | |
| Liu 2011 | PF tension (Oxford scale) (0‐5, 5 better) | Mean 3.95, SD 0.32, n = 106 at 3 months postpartum | Mean 3.02, SD 0.28, n = 86 at 3 months postpartum | Mean difference 0.93 (95% CI 0.34 to 1.52) |
| PF muscle tension (Oxford scale) (0‐5, 5 better) | Mean 4.73, SD 0.35, n = 106 at 6 months postpartum | Mean 3.25, SD 0.41, n = 86 at 6 months postpartum | Mean difference 1.48 (95% CI 1.37 to 1.59) | |
| PF muscle tension (Oxford scale) (0‐5, 5 better) | Mean 4.82, SD 0.38, n = 106 at 12 months postpartum | Mean 3.43, SD 0.39, n = 86 at 12 months postpartum | Mean difference 1.40 (95% CI 1.29 to 1.51) | |
| Oakley 2016 | PFMS (Oxford scale) (0‐5, 5 better) | Mean 2.44, SD 0.85, n = 27 at 12 weeks postpartum | Mean 2.09, SD 0.73, n = 23 at 12 weeks postpartum | Mean difference 0.35 (95% CI ‐0.09 to 0.79) |
| Anal resting maximal pressure (mm Hg, anorectal manometer) | Mean 68.55, SD 38.25, n = 27 at 12 weeks postpartum | Mean 88.67, SD 25.84, n = 23 at 12 weeks postpartum | Mean difference ‐20.12 (95% CI ‐38.00 to ‐2.24) | |
| Anal squeeze maximal pressure (mm Hg, anorectal manometer) | Mean 83.29, SD 47.27, n = 27 at 12 weeks postpartum | Mean 103.77, SD 33.64, n = 23 at 12 weeks postpartum | Mean difference ‐20.48 (95% CI ‐42.99 to 2.03) | |
| Mean anal resting pressure (mm Hg, anorectal manometer) | Mean 52.37, SD 27.41, n = 27 at 12 weeks postpartum | Mean 71.67, SD 21.97, n = 23 at 12 weeks postpartum | Mean difference ‐19.30 (95% CI ‐32.99 to ‐5.61) | |
| Mean anal squeeze pressure (mm Hg, anorectal manometer) | Mean 83.3, SD 38.56, n = 27 at 12 weeks postpartum | Mean 90.43, SD 24.11, n = 23 at 12 weeks postpartum | Mean difference ‐7.13 (95% CI ‐24.70 to 10.44) | |
| Peirce 2013 | Mean anal resting pressure (mm Hg, anorectal manometer) | Mean 39, SD 13, n = 30 at 3 months postpartum | Mean 43, SD 17, n = 90 at 3 months postpartum | Mean difference ‐4.00 (95% CI ‐9.83 to 1.83) |
| Mean anal squeeze pressure (mm Hg, anorectal manometer) | Mean 64, SD 17, n = 30 at 3 months postpartum | Mean 62, SD 23, n = 90 at 3 months postpartum | Mean difference 2.00 (95% CI ‐5.72 to 9.72) | |
| Wen 2010 | PFMS (Oxford scale) (0‐5, 5 better) | Mean 3.34, SD 0.35, n = 75 at 6 months postpartum | Mean 3.25, SD 0.41, n = 73 at 6 months postpartum | Mean difference 0.09 (95% CI ‐0.03 to 0.21) |
| PFMS (Oxford scale) (0‐5, 5 better) | Mean 4.56, SD 0.38, n = 75 at 12 months postpartum | Mean 3.46, SD 0.39, n = 73 at 12 months postpartum | Mean difference 1.10 (95% CI 0.98 to 1.22) | |
Discussion
Summary of main results
There are three possible ways of delivering pelvic floor muscle training (PFMT) interventions to women during pregnancy and in the postpartum period. The first way is to provide PFMT for women who have no symptoms when PFMT begins (i.e. prevention). The second is to prescribe PFMT for women who have already developed symptoms of incontinence (i.e. treatment). The third is to provide PFMT for all women regardless of whether they have urinary incontinence symptoms or not when PFMT begins (i.e. mixed prevention and treatment approach). Comparisons were drawn within the following three populations of women.
Women who were continent when randomised to intervention groups (prevention studies).
Women who were incontinent at randomisation (treatment studies).
Trials including a mixed population i.e. some women were continent and some women were incontinent at randomisation.
Primary or secondary prevention of incontinence
Summary data from six trials suggested that PFMT during pregnancy probably decreases urinary incontinence in late pregnancy compared to usual care. At between three months and up to six months following delivery (mid‐postnatal), summary data from five trials suggested that PFMT slightly decreased the risk of urinary incontinence compared to usual care. With only subgroup data from one small trial of 72 women, there were too few data from six months to one year after delivery (late postpartum) to comment meaningfully (Sampselle 1998). A single trial of 152 women suggested PFMT probably improves incontinence‐specific quality of life in late pregnancy compared to usual care. None of the trials reported data on faecal incontinence in late pregnancy, or in the mid‐ or late‐ postpartum periods (Table 1).
Treatment of incontinence
We found uncertain evidence about the effects of PFMT for treatment of urinary incontinence in antenatal and postnatal women. The uncertainty arose from the lack of precision in the pooled estimate of effect; the confidence intervals (CIs) for the summary statistic were generally wide and included a null effect.
Antenatal women
Based on summary data from three trials, we are uncertain whether PFMT decreased existing urinary incontinence in late pregnancy compared to usual care. Similarly, the effect of PFMT to treat antenatal urinary incontinence in the mid‐ and late postnatal periods is uncertain. Data from a single trial of 41 women suggested that PFMT probably improved incontinence‐specific quality of life in late pregnancy compared to usual care. None of the trials reported data on faecal incontinence in late pregnancy, or in the mid‐ and late postpartum periods in this comparison (Table 2). Evidence in this comparison was particularly weak, with all trials limited by incomplete reporting of intervention and control conditions and trial methods. Two trials in this comparison were reported only as conference abstracts.
Postnatal women
Summary data from three trials provide no evidence that PFMT to treat postnatal urinary incontinence results in a difference in urinary incontinence in the late postnatal period. We noted that two of the three trials that carried the greatest weighting in the pooled estimate compared PFMT (with limited supervision by a healthcare professional) with usual care and some women in the control groups were doing PFMT (Glazener 2001; Wilson 1998). There was no difference between groups in Wilson 1998 and close to no difference in Glazener 2001. In the third trial, Dumoulin 2004 compared a shorter and more intensively supervised PFMT intervention with no treatment and found a reduction in the risk of urinary incontinence in favour of PFMT. Based on the data from a single very small trial, there was no evidence of a difference in urinary incontinence‐specific quality of life with PFMT (Kim 2012). Based on summary data from two trials, we are uncertain whether PFMT reduces faecal incontinence in the late postnatal period compared to usual care (Table 4).
Trials with a mixed prevention and treatment approach
Antenatal women
Summary data from 11 trials suggested that, when delivered to a population of women with or without existing urinary incontinence symptoms, antenatal PFMT probably decreases the risk of urinary incontinence in late pregnancy. The three trials that compared PFMT to no training seemed to show a greater effect than the other eight trials that compared PFMT and usual care (Assis 2015; Ko 2011; Szumilewicz 2019). Summary data from the mid‐postnatal period also suggested that PFMT may reduce the risk of urinary incontinence slightly. Two trials reported data on urinary incontinence in the late postpartum period, and there was no evidence of a difference in urinary incontinence risk between PFMT and usual care. Similarly, there was no evidence that antenatal PFMT led to a difference in the prevalence of faecal incontinence in late pregnancy. There were no data for the prevalence of faecal incontinence in the mid‐ or late‐postnatal periods in this comparison.
A single trial found no evidence that antenatal PFMT led to a difference in urinary incontinence‐specific quality of life in the late postnatal period compared to usual care (Fritel 2015). However, it is important to note that, in Fritel 2015, women in both groups reported a similar frequency and duration of PFMT (including the number of contractions) at the end of pregnancy. This suggested that the lack of difference between groups was because the control group was routinely doing adequate PFMT, which was encouraging in terms of delivering PFMT to the general population. A single small trial showed no evidence of a difference between antenatal PFMT and usual care with respect to faecal incontinence‐specific quality of life (Hyakutake 2018; Table 3).
Postnatal women
Based on summary data from three trials, we were uncertain whether postnatal PFMT, delivered to a population of women with or without existing urinary incontinence symptoms, reduced the risk of urinary incontinence in the late postnatal period. Based on evidence from one small trial (Meyer 2001), there is no evidence that PFMT reduces faecal incontinence in the late postnatal period compared to no PFMT. A single trial found that postnatal PFMT may lead to no difference in urinary incontinence‐specific quality of life at 16 weeks following PFMT plus iBall compared to PFMT only (Table 5).
Overall completeness and applicability of evidence
The self‐report measures of urinary and faecal incontinence were considered the most important outcomes in this review. However, there was variability in the way urinary and faecal incontinence were defined, how the questions were asked, and how the data were presented. There were few urinary and faecal incontinence‐specific quality of life data and little agreement about a standard measure for each. Further, some trials only partially reported a score (e.g. one domain of several included in the total score), or a statement about difference or lack of it, sometimes with a P value, as these data were collected but not reported or only partially reported this is a form of reporting bias.
Unfortunately, faecal incontinence data were rarely collected in the prevention or mixed prevention and treatment trials; only eight studies presented data (Bø 2011; Glazener 2001; Hyakutake 2018; Meyer 2001; Sleep 1987; Stafne 2012; Torsdatter Markussen 2017; Wilson 1998), with three reporting on faecal incontinence‐specific quality of life (Hyakutake 2018; Oakley 2016; Peirce 2013). Being a less common event than urinary incontinence, larger trials are needed to accurately document the effect of PFMT on this outcome and more trials must collect these data to enable a more precise effect estimate based on pooled data.
The usefulness of evidence was somewhat reduced by the short durations of follow‐up after intervention. This was particularly problematic in the antenatal PFMT trials, where the outcome was either measured at the end of pregnancy or in the three months post birth. At three months' postpartum, there may not have been full resolution of many of the physiological changes associated with pregnancy and childbirth. A minimum follow‐up of six months postnatally is probably more useful to be sure how many cases of urinary or faecal incontinence are persistent. For treatment studies, while a postintervention measure is useful, data on the duration of effect (e.g. one year or longer) are needed. With regard to longer‐term follow‐up, only three studies provided data after five years (Glazener 2001; Mørkved 2003; Reilly 2002). Longer‐term data are difficult to interpret, as control groups may be offered a structured PFMT after the postintervention outcome is measured, women may have more children and so on. However, in the absence of longer‐term data about urinary and faecal incontinence and other variables (parity, bodyweight, etc.), there is an insufficient evidence base to begin to analyse and interpret.
Pregnancy and birth appear to be the most consistent and important factors associated with the development of urinary and faecal incontinence in women. Therefore, all women who have a child, or children, might be considered at risk of later incontinence. In addition, some women (such as those who have a connective tissue disorder, high body mass index (BMI) or an assisted delivery) might be at even greater risk (Durnea 2017; Svare 2014). The bulk of trials reviewed were undertaken in samples of antenatal women, principally those in their first pregnancy and most data were for urinary incontinence. The findings suggested that continent antenatal women benefited more from "structured" PFMT programmes (in terms of content and delivery) than women in usual care groups that may have incorporated some (or ad hoc) PFMT advice or teaching.
Trials of antenatal PFMT for mixed prevention and treatment also mostly recruited women having their first baby and showed a similar pattern of benefit of structured PFMT versus control conditions. However, the pooled data suggested less reduction in risk of urinary incontinence, upper CIs closer to one (i.e. no reduction in risk of urinary incontinence), and overall there was also more uncertainty about the effect.
Efforts to determine what value women, healthcare professionals and their professional organisations, provider and funding bodies give to this body of evidence about urinary incontinence prevention through structured and supervised antenatal PFMT (at least for first‐time mothers) are warranted. If the findings are considered sufficiently certain and of value, then changes to the current ad hoc delivery of PFMT advice in pregnancy within 'usual care' are needed.
We summarised data from all the trials. There were a few that we considered informed us enough about what was done in both PFMT and control groups that we were more confident in the estimate of differences in outcome. These were trials where sufficient information was provided about the intervention and control conditions such that it was possible to reach a judgement about:
the soundness of the physiology of the PFMT (i.e. whether the structured PFMT intervention was likely to strengthen muscle);
exercise behaviour in both groups (i.e. were both groups doing similar or quite different amounts of PFMT); and
the degree of contrast between the two groups (e.g. did the PFMT group attend many exercise classes while the control group had none (high contrast), or did the PFMT group have one instruction session and the controls had none (low contrast)) (see Table 6 and Potential biases in the review process (heterogeneity)).
Five trials contained the necessary amount of information (Chiarelli 2002; Hilde 2013; Reilly 2002; Stafne 2012; Torsdatter Markussen 2017). All were at low risk of selection bias and had moderate to large sample sizes. Three examined the effect of antenatal PFMT for prevention of urinary and faecal incontinence (Reilly 2002, primiparous women with bladder neck hypermobility) and mixed prevention and treatment (Stafne 2012 and Torsdatter Markussen 2017, healthy pregnant women, mixed parity), and two the effect of postnatal PFMT for mixed prevention and treatment of urinary and faecal incontinence (Chiarelli 2002, mixed parity, after ventouse or forceps delivery or baby weighing 4000 g or greater; Hilde 2013, primiparous women after vaginal delivery). Looking at the GRADE‐rated outcomes, data from these individual trials were consistent with the pooled estimates of effect, with the exception of Torsdatter Markussen 2017 at late pregnancy. Antenatal training appeared to have clinically important reductions in urinary incontinence in late pregnancy and between more than three to six months postnatally (Reilly 2002; Stafne 2012). The effect of postnatal training for mixed prevention and treatment may not be clinically important at more than three to six months after delivery for urinary incontinence (Chiarelli 2002; Hilde 2013). However, it is possible that women at higher risk of postnatal incontinence benefited more (Chiarelli 2002).
Quality of the evidence
Overall, the evidence was moderate, low or even very low‐quality (see Table 1; Table 2; Table 3; Table 4; Table 5). The most common reasons for downgrading the evidence were: imprecision, due to sample sizes less than 400 and wide CIs around the estimates of effect; inconsistency, because many of the meta‐analyses demonstrated statistically significant heterogeneity (Chi² test P < 0.10 or had an I² > 50%); and risk of bias (either overall or selection bias).
Some comparisons were downgraded for selection bias, arising from inadequate reporting of random sequence generation and random allocation. Most comparisons in the 'Summary of findings' tables were affected by more than one of the above and were usually downgraded once or twice.
We evaluated quality from the trial reports, which was limited when the only source of publication was from an abstract (see Included studies). In addition, abstracts reported few data.
The adequacy of reporting randomisation remains disappointing, as fewer than half of the included trials reported both random sequence generation and allocation concealment and 15/46 studies described neither. The nature of the intervention means it was not feasible to blind the treatment provider or participants to group allocation in any of the included trials. The difficulty of blinding exercise‐based interventions is unavoidable. Furthermore, it is impossible to blind either of the primary outcomes in the review because both were self‐reported (prevalence of urinary incontinence or faecal incontinence and incontinence‐specific quality of life). Approximately 80% of the trials (36/46) had a low risk of reporting bias but only just over half (26/46) were deemed to be low risk in terms of potential sources of other biases (Figure 3; Figure 4).
Based on the reported adequacy of randomisation, proportion and management of participant dropouts and withdrawals, and low risk of selective reporting or other biases, six trials appeared to be at low risk of bias (Chiarelli 2002; Dumoulin 2004; Hilde 2013; Mørkved 2003; Peirce 2013; Sangsawang 2016). However, this assessment did not take into account the quality of descriptions of the PFMT interventions or control conditions. If this was taken into account, the trial by Sangsawang 2016 would be downgraded, as the intervention was of short duration and insufficient information was provided to determine the likely physiological effect of the PFMT. Sensitivity analysis on the basis of trial quality was not considered appropriate in view of the small number of trials contributing to each comparison.
Potential biases in the review process
We combined data from a diverse set of studies. This may inevitably impact on the applicability of our findings to practice. We summarise below the issues related to the heterogeneity of the studies we used.
There were three notable sources of clinical heterogeneity. These were the variation in baseline characteristics (e.g. parity, type of delivery, type and duration of incontinence, if women were symptomatic when recruited), the PFMT programmes and the control care. To investigate the effects of baseline characteristics on treatment outcome would require an individual participant data meta‐analysis, which was beyond the scope of this review.
The content of PFMT programmes was often poorly described, and there was lack of information about PFMT and control conditions, PFMT content, and supervision of exercise programmes.
Half the trials provided insufficient information to be sure of the likely physiological effect of the exercise and just under half reported confirmation of a correct PFM contraction prior to training (see PFMT regimens and control interventions, Included studies and Table 6). Consequently, it was difficult to evaluate the potential physiological efficacy of the exercise programmes. Including trials with a suboptimal exercise regimen alongside those with a sufficient regimen could adversely influence the pooled estimate of PFMT effect.
Assessment of the interaction between quality and the effect of the intervention has been recommended but there were too few trials to conduct a formal sensitivity analysis by intervention quality (Herbert 2005). Rather than excluding or including trials on the basis of sufficiency of PFMT, or the likelihood that a clear‐cut comparison between PFMT and the control condition had been made, the preferred approach would be a sensitivity analysis on the basis of PFMT programme characteristics or amount of clinical difference between the PFMT and control interventions. However, more trials would be needed in each of the comparisons in the review before this was possible. We tried to distil information about the physiological and behavioural quality of the PFMT interventions, alongside the degree of contrast between the PFMT and control groups (see 'Sample characteristics' in Included studies and Summary of main results).
The control conditions were also highly variable and usually poorly described, with many including a blanket statement about women in control groups receiving usual or standard care. However, often it was unclear whether usual care encompassed advice about PFMT (i.e. written or verbal instructions) or a more ad hoc arrangement (see 'Sample characteristics' in Included studies, and Table 6).
Agreements and disagreements with other studies or reviews
The overall findings and conclusions in this updated review are generally the same as the previous version, despite this update containing more trials and more data than the previous review (Woodley 2017). Since the last update of this review in 2017, four non‐Cochrane systematic reviews on the effects of PFMT during pregnancy and postpartum for the prevention and treatment of urinary incontinence have been published (Davenport 2018; Mørkved 2014; Saboia 2018; Schreiner 2018). Although some of the reviews considered the data in slightly different categories, they reported that PFMT during pregnancy and after delivery was effective in treating and preventing urinary incontinence (Davenport 2018; Mørkved 2014; Saboia 2018; Schreiner 2018), particularly when women adhered to a strength‐training protocol and were closely supervised (Mørkved 2014). The findings of this review also agreed with those of Mørkved 2014 relating to methodological factors such as the heterogeneity of the populations in the included trials, differences in reported outcome measures, and considerable variation in the PFMT and control conditions between trials.
Brief economic commentary
To supplement the main systematic review of PFMT for prevention and treatment of urinary and faecal incontinence in antenatal and postnatal women, we sought to identify relevant economic evaluations as part of the review. No economic studies were identified that analysed the use of PFMT in these groups. The apparent shortage of relevant economic evaluations indicates that there is a paucity of economic evidence on the efficiency of PFMT as a management strategy for urinary incontinence and faecal incontinence in a postnatal and antenatal population. It should be noted that one economic evaluation is currently being conducted alongside a trial, which could be relevant (Moossdorf‐Steinhauser 2019). The trial compares two groups, with one group being given PMFT (stimulated by reinforcement techniques and a mobile app), and the other group usual care. This study will include a within‐trial cost utility analysis alongside the trial, a long‐term economic decision model and a budget impact analysis.
Authors' conclusions
Implications for practice.
This review provides evidence that early structured pelvic floor muscle training (PFMT) in early pregnancy for continent women probably prevents the onset of urinary incontinence in late pregnancy and reduces the risk of urinary incontinence slightly postnatally. Population approaches, that is, recruiting antenatal women regardless of their continence status, might also reduce the risk of urinary incontinence in late pregnancy and up to > 3‐6 months postpartum, but the effect may be less pronounced. However, the reasons for this are unclear. The findings about the effects of PFMT as a treatment for antenatal urinary incontinence are uncertain.
Similarly, it is uncertain whether a population‐based approach for delivery of postnatal PFMT (i.e. recruitment of women regardless of continence status immediately following delivery) is effective. It is possible that a 'high‐risk' approach (e.g. women who have an assisted delivery or deliver a large baby) leads to more clinical benefit than a population approach.
It is also appears that PFMT is not likely an effective treatment for persistent urinary incontinence symptoms (i.e. women recruited at three months' postdelivery). This uncertainty around the efficacy of PFMT as a treatment for urinary incontinence in the immediate postnatal period is perhaps surprising given the summary findings of Dumoulin 2018, which suggested that PFMT is an effective treatment for established urinary incontinence symptoms in non‐postnatal women.
We can suggest some plausible reasons for the differences in findings of the effectiveness of PFMT as a treatment for persistent postnatal urinary incontinence, compared to the findings of Dumoulin 2018, in non‐postnatal women. First, there are differences in the participants in the included trials. In this review, trials included postnatal women who may have altered physiological capabilities (muscle, nerve and connective tissue) consequent on the changes of pregnancy and delivery (Nygaard 2017). Postnatal women may find it particularly difficult to adopt or sustain exercise behaviour postdelivery, especially when they are distracted and occupied with caring for a new baby (Gillard 2010; Mason 2001). In contrast, Dumoulin 2018 reported outcomes from trials in non‐postnatal women, which may not have the same barriers. Second, there are differences in the comparator or control groups. In this review, the comparator group in the two large trials which carried the greatest weighting in the pooled estimate was usual care (which may have included PFMT), whereas the control group received no treatment in the majority of studies included in Dumoulin 2018 (Analysis 4.1). It is possible that the potential lack of contrast between the intervention and control groups in this review contributed to the uncertainty surrounding the effect of PFMT as a treatment for postnatal urinary incontinence. Interestingly, in the one small study that compared an intensively supervised strengthening PFMT programme versus no treatment, rather than two larger trials that compared a minimally supervised PFMT programme with uncertain physiological effect, the benefit of PFMT was more marked (Analysis 4.1).
There are insufficient data on faecal incontinence to state whether or not PFMT is effective in preventing or treating this problem in pregnant or postpartum women. Furthermore, there are insufficient data to determine whether or not PFMT is effective to prevent urinary incontinence more than one year after birth. However, it is acknowledged that assessing the long‐term effects of PFMT is challenging, as women may go on to have subsequent pregnancies, be offered a specific PFMT programme if they had taken part in the control arm of a trial, or initiate their own PFMT (Mørkved 2003).
Only two adverse events were reported with PFMT. It is possible that PFMT during pregnancy might influence labour and delivery outcomes). This does not seem to be the case based on findings from non‐systematic Cochrane Reviews (Du 2015; Schreiner 2018). However, based on data from 11 antenatal PFMT trials included in this review, there was no evidence of a difference between PFMT and control groups.
Implications for research.
Since the previous version of this review, eight new studies have been added, most of which were small‐ to moderate‐sized trials (i.e. fewer than 500 women per arm). Unfortunately, the variability in rigour of methods and quality of reporting continued and this affords an opportunity to make some recommendations for further research (Woodley 2017).
First, the lack of faecal incontinence data was notable. It is encouraging to see some attention is being directed specifically towards investigations of faecal incontinence in antenatal and postnatal women with 11 ongoing trials expecting to recruit about 1600 women (Haruna 2014; Haruna 2016; Hendler 2017; Lijun 2018; NCT02270008; NCT02334397; NCT02682212; NCT03247660; Sobhgol 2019; Torabipour 2019; Velez‐Sanchez 2015). Because fewer women may have faecal incontinence, every trial conducted on antenatal and postnatal incontinence must collect faecal as well as urinary incontinence data so we can learn more about this problem.
As there is insufficient evidence about the continuing effects of PFMT, trialists should, at a minimum, collect follow‐up data about antenatal training at three months' postpartum and about postnatal training at 12 months' postpartum. Ideally, for both antenatal and postnatal training, data should also be collected in both the intervention and control groups beyond one year.
The descriptions of the PFMT and control interventions and choice of outcome measures require attention. It is important that both the physiological and behavioural aspects of exercise are thoroughly described in both the intervention and control groups (Frawley 2017), which may be facilitated by using a Consensus on Exercise Reporting Template (Hay‐Smith 2019; Slade 2016). In particular, there is a need to know what types of PFMT advice and behaviour occur in the usual care group, as these details are infrequently measured or reported, which can influence the effect sizes and precision (Levack 2019). In addition, it is recommended that all future trials collect valid measures of incontinence‐specific quality of life for both urinary and faecal incontinence (e.g. International Consultation on Incontinence Questionnaire‐Short Form (ICIQ‐SF) for urinary incontinence and an agreed measure for faecal incontinence) (Avery 2007). In antenatal trials, the effect of PFMT on labour and delivery outcomes is worthy of further investigation. This would help to elucidate whether or not there are any associations between PFMT parameters, such as the type, frequency, intensity and duration of pelvic floor muscle (PFM) exercises and outcomes for mother and baby.
Half of the included trials reported some type of adherence data for women in the intervention or control groups but only nine studies asked women in both PFMT and control groups about their exercise behaviour (see Included studies). Adherence data should be collected in both study groups, although it is acknowledged that measuring it may change exercise behaviour. In turn, this may lead to an overestimate of the likely effect in 'real' life and may diminish the difference in effect between structured PFMT and control conditions.
The evidence to date about the benefit of mixed prevention and treatment approaches is uncertain in antenatal populations and not at all clear in postnatal populations. From the record of ongoing studies, four clearly appear to investigate PFMT delivered to women with or without existing incontinence symptoms, but all of these studies are small (total of approximately 700 women) and, therefore, unlikely to provide sufficient data for certainty about the effects of this approach. However, it is possible that the effect of PFMT in these mixed approaches is diluted by some women who will never become incontinent and also those in whom PFMT is unlikely to be effective, such as those with denervation. Perhaps the focus in future population type trials should be to target women who are at heightened risk of developing urinary or faecal incontinence (such as women with a high body mass index (BMI) or women who have had an assisted vaginal delivery).
The effect of PFMT for treating urinary and faecal incontinence, especially in antenatal women, is a high priority for further investigation. It is noted that only one of the 19 ongoing trials (Moossdorf‐Steinhauser 2019) appears to address this question in antenatal women, and as this is a small study (of 240 women), it is unlikely to provide sufficient information for certainty about the effect. Any further large pragmatic trials will ideally include process evaluation and fidelity checking, so some evaluation of treatment can be provided (Moore 2015).
In addition, given the resource implications of faecal and urinary incontinence, there is also a need for high‐quality economic evaluations assess strategies for managing urinary and faecal incontinence in postpartum populations.
What's new
| Date | Event | Description |
|---|---|---|
| 12 March 2021 | Amended | Republished to correct a technical issue with the PRISMA diagram |
History
Review first published: Issue 4, 2008
| Date | Event | Description |
|---|---|---|
| 18 April 2020 | New search has been performed | For this update, published in 2020, the following changes were made. 1. The search was updated to 07 August 2019. 2. Eight new trials were included (Dufour 2019; Hyakutake 2018; Oakley 2016; Sacomori 2019; Sut 2016; Szumilewicz 2019; Torsdatter Markussen 2017; Yang 2017), bringing the total number of included studies to 46. |
| 18 April 2020 | New citation required but conclusions have not changed | There has been a change to the byline. |
| 21 December 2017 | New search has been performed | For this version, published in Issue 12, 2017, the following changes were made: 1. The search was updated to February 2017 and 17 new trials incorporated (taking the total number of included trials to 38 (involving 9892 women)). In addition, two abstracts which were the primary reference in the last version were replaced by full papers. 2. The GRADE method was implemented throughout the review to assess the quality of evidence; and a 'Summary of findings' table was added. 3. The comparisons and subgroups were substantially amended. 4. There has been a change in authorship. |
| 20 December 2017 | New citation required and conclusions have changed | 1. The overall findings are similar to the previous version of the review, with the exception of the evidence summary for the effectiveness of postnatal pelvic floor muscle training as a treatment for incontinence; we are less certain about this effect than previously. The findings altered because the way the data were grouped changed to report outcomes according to the time since the birth rather than time since intervention. This decision about timing of outcomes was made, a priori, when choosing outcomes for the 'Summary of findings' table. |
| 7 September 2012 | New citation required but conclusions have not changed | Added 6 new studies |
| 7 September 2012 | New search has been performed | Added 6 new studies |
| 18 April 2008 | Amended | Converted to new review format. |
| 3 March 2008 | New citation required and conclusions have changed | Substantive amendment |
| 11 September 2007 | New search has been performed | minor update |
Acknowledgements
We are grateful to Sue Bennett, Fiona Beyer, Dwayne Boyers, Chantale Dumoulin, Jemma Hudson, Andrea Lemos, Kate Walsh and Luke Vale for valuable comments on drafts of this review. We also thank Sheila Wallace for running the searches for this update.
We sincerely thank Yuan Chi, Hsin‐wen Wu and Xiaomei Yao for extracting data from the Chinese language papers. Unpublished data were kindly provided by Carolyn Sampselle and colleagues, Polly Hughes and Siv Mørkved. We acknowledge and thank Kate Fairbrother and Peter Herbison for their substantial contribution to a previous version of this review (Hay‐Smith 2008).
Appendices
Appendix 1. Search for clinical effectiveness studies
The Cochrane Information Specialist searched the Cochrane Incontinence Specialised Register using the terms given below:
({design.rct*} or {design.cct*})
and
({intvent.prevent.pfe.} or {intvent.prevent.pfmt*} or {intvent.prevent.physicaltherapies} or {topic.urine.incon.prevent.} or {topic.urine.incon.prevent.postpartum.} or {topic.faecal.incon.prevent.} or {topic.faecal.incon.prevent.postobstet.} or {topic.urine.incon.postobstetric*} or {topic.faecal.incon.postobstetric*} or {topic.urine.incon.preg.} or {topic.urine.incon.stress.postnatal.} or {intvent.phys.biofeed*} or {intvent.phys.pfe*} or {topic.urine.incon.mixed.postnatal.} or {topic.urine.incon.mixed.preg.} or {topic.urine.incon.stress.preg.} or {topic.faecal.incon.preg.})
All searches were of the keyword field of EndNote 2018. The date of the last search was 7 August 2019.
Appendix 2. Search methods for the brief economic commentary (BEC)
The Cochrane Information Specialist performed electronic searches designed to identify published reports of relevant economic evaluations to inform the BEC (see 'Incorporating economic evidence' in the Methods) (date of search: 30 January 2020) searched:
NHS EED on the UK Centre for Reviews and Dissemination (CRD) website (covering from the earliest record in NHS EED, dating from 1968, up to and including 31 December 2014 when their coverage ended).
As NHS EED is no longer actively updated we performed additional searches of the following databases to identify eligible studies added to these databases from 1 January 2015 onwards (date of search: 29 January 2020):
MEDLINE on OvidSP (covering 1 January 1946 to January Week 3 2020); and
Embase (on OvidSP) (covering 1 January 1974 to 2020 Week 4).
The economic evaluation search filters applied to our MEDLINE and Embase search strategies were those formerly used by the CRD to identify published reports of full economic evaluations for indexing on NHS EED. These economic evaluation search filters remain freely available on the CRD Database search strategies web-page (CRD 2015). The other search lines in the MEDLINE and Embase search strategies were adapted from the electronic search strategies run for our Cochrane Incontinence Specialised Register along with additional terms for this population developed specifically for this review. Similarly, our NHS EED search strategy was adapted from search strategies run for our Specialised Register and based on textword and MeSH terms (capturing relevant P‐I‐C concepts) used to identify eligible studies of intervention effects. We followed the current economic methods guidance (Shemilt 2019). In order to comply with the guidance and make the dates covered by the searches fall broadly within the same upper limit as the search for clinical effectiveness the searches were limited by dates of entry to the database (or similar).
Two separate searches were run for the BEC for this review:
urinary incontinence
faecal incontinence
These are described below.
1. Urinary incontinence
The search for economic evaluations was based on the search for our Cochrane Incontinence Specialised Register of economic evaluations. It is currently under development. Broad searches covering the topic of urinary incontinence were conducted in NHS EED, MEDLINE and Embase and screened by volunteer health economists to identify economic evaluations. Please find details of these searches below.
NHS EED
NHS EED on the UK Centre for Reviews and Dissemination (CRD) website (covering from the earliest record in NHS EED, dating from 1968, up to and including 31 December 2014 when their coverage ended). Date of search: 14 June 2019. Only one set of terms was used: urinary incontinence terms
1. MeSH DESCRIPTOR pelvic floor EXPLODE ALL TREES IN NHSEED
2. MeSH DESCRIPTOR pelvic floor disorders EXPLODE ALL TREES IN NHSEED
3. MeSH DESCRIPTOR Urinary Bladder, Neurogenic EXPLODE ALL TREES IN NHSEED
4. MeSH DESCRIPTOR Urinary Bladder, overactive EXPLODE ALL TREES IN NHSEED
5. ((incontinen* ) OR (continen*)) IN NHSEED
6. ((floor adj2 pelvi* ) OR (pelvi* adj2 floor)) IN NHSEED
7. ((nycturia)) IN NHSEED
8. (((urin* or bladder) adj5 sphincter*) OR (sphincter* adj5 (urin* or bladder))) IN NHSEED
9. (((bladder OR detrusor OR vesic*) ADJ5 (instability OR stab* OR unstable OR irritab* OR hyperreflexia OR dysynerg* OR dyskinesi* OR irritat*)) OR ((instability OR stab* OR unstable OR irritab* OR hyperreflexia OR dysynerg* OR dyskinesi* OR irritat*) ADJ5 (bladder OR detrusor OR vesic*) )) IN NHSEED
10. ((urethra* ADJ2 sphincter*) OR (sphincter* ADJ2 urethra* )) IN NHSEED
11. ((bladder ADJ2 neck) OR (neck ADJ2 bladder )) IN NHSEED
12. ((urin* ADJ2 (leak* OR urge* OR frequen*)) OR ((leak* OR urge* OR frequen*) ADJ2 urin* )) IN NHSEED
13. (dribbl*) IN NHSEED
14. ((vesic* ADJ1 (neck* OR cervi*)) OR ((neck* OR cervi*) ADJ1 vesic*)) IN NHSEED
15. (((bladder OR detrusor OR vesic*) ADJ2 (hyper* OR overactiv*)) OR ((hyper* OR overactiv*) ADJ2 (bladder OR detrusor OR vesic*))) IN NHSEED
16. ((detrusor ADJ1 sphincter*) OR (sphincter* ADJ1 detrusor)) IN NHSEED
17. ((spinal ADJ2 bladder*) OR (bladder* ADJ2 spinal)) IN NHSEED
18. ((bladder* ADJ2 (neuropath* OR neurogen* OR neurolog*)) OR ((neuropath* OR neurogen* OR neurolog*) ADJ2 bladder*)) IN NHSEED
19. ((nervous ADJ1 (pollakisur* OR pollakiur*)) OR ((pollakisur* OR pollakiur*) ADJ1 nervous)) IN NHSEED
20. (MeSH DESCRIPTOR urinary incontinence EXPLODE ALL TREES) IN NHSEED
21. #1 OR #2 OR #3 OR #4 OR #5 OR #6 OR #7 OR #8 OR #9 OR #10 OR #11 OR #12 OR #13 OR #14 OR #15 OR #16 OR #17 OR #18 OR #19 OR #20
MEDLINE
MEDLINE on OvidSP (covering 1 January 1946 to January Week 3 2020). Date of search: 29 January 2020. For this review the searches were limited to those records with an entry date (.ed.) starting from 1 January 2015 up to and including 31 August 2019. Two sets of terms were used: urinary incontinence terms AND the NHS EED economic evaluation filter.
1. Economics/
2. exp "costs and cost analysis"/
3. Economics, Dental/
4. exp economics, hospital/
5. Economics, Medical/
6. Economics, Nursing/
7. Economics, Pharmaceutical/
8. (economic$ or cost or costs or costly or costing or price or prices or pricing or pharmacoeconomic$).ti,ab.
9. (expenditure$ not energy).ti,ab.
10. value for money.ti,ab.
11. budget$.ti,ab.
12. or/1‐11
13. ((energy or oxygen) adj cost).ti,ab.
14. (metabolic adj cost).ti,ab.
15. ((energy or oxygen) adj expenditure).ti,ab.
16. or/13‐15
17. 12 not 16
18. letter.pt.
19. editorial.pt.
20. historical article.pt.
21. or/18‐20
22. 17 not 21
23. exp animals/ not humans/
24. 22 not 23
25. (incontinen$ or continen$).tw.
26. exp urinary incontinence/
27. nycturia.tw.
28. ((bladder or detrusor or vesic$) adj5 (instability or stab$ or unstable or irritab$ or hyperreflexia or dys?ynerg$ or dyskinesi$ or irritat$)).tw.
29. (urin$ adj2 (leak$ or urge$ or frequen$)).tw.
30. dribbl$.tw.
31. bladder, neurogenic/
32. ((bladder or detrusor or vesic$) adj2 (hyper$ or overactiv$)).tw.
33. (spinal adj2 bladder$).tw.
34. (bladder$ adj2 (neuropath$ or neurogen$ or neurolog$)).tw.
35. (nervous adj1 (pollakisur$ or pollakiur$)).tw.
36. urinary bladder, overactive/
37. exp enuresis/
38. enure$.tw.
39. bedwet$.tw.
40. bed‐wet$.tw.
41. (bed adj5 wet$).tw.
42. (diurnal adj5 wet$).tw.
43. diurnal‐wet$.tw.
44. ((daytime or day‐time or nighttime or night‐time or nightime) adj5 wet$).tw.
45. (void$ adj2 dysfunct$).tw.
46. ((urin$ or bladder) adj5 sphincter$).tw.
47. (urethra$ adj2 sphincter$).tw.
48. (bladder adj2 neck).tw.
49. (vesic$ adj1 (neck$ or cervi$)).tw.
50. (detrusor adj1 sphincter$).tw.
51. or/25‐50
52. 24 and 51
53. 2015$.ed.
54. 2016$.ed.
55. 2017$.ed.
56. 2018$.ed.
57. 201901$.ed.
58. 201902$.ed.
59. 201903$.ed.
60. 201904$.ed.
61. 201905$.ed.
62. 201906$.ed.
63. 201907$.ed.
64. 201908$.ed.
65. or/53‐64
66. 52 and 65
Embase
Embase (on OvidSP) (covering 1 January 1974 to 2020 Week 4). Date of search: 29 January 2020. For this review the searches were limited to those records with a 'date created' (.dc.) date starting from 1 January 2015 up to and including 31 August 2019. Two sets of terms were used: urinary incontinence terms AND the NHS EED economic evaluation filter
1. Health Economics/
2. exp Economic Evaluation/
3. exp Health Care Cost/
4. pharmacoeconomics/
5. (econom$ or cost or costs or costly or costing or price or prices or pricing or pharmacoeconomic$).ti,ab.
6. (expenditure$ not energy).ti,ab.
7. (value adj2 money).ti,ab.
8. budget$.ti,ab.
9. or/1‐8
10. letter.pt.
11. editorial.pt.
12. note.pt.
13. or/10‐12
14. 9 not 13
15. (metabolic adj cost).ti,ab.
16. ((energy or oxygen) adj cost).ti,ab.
17. ((energy or oxygen) adj expenditure).ti,ab.
18. 15 or 16 or 17
19. 14 not 18
20. animal/
21. exp animal experiment/
22. nonhuman/
23. (rat or rats or mouse or mice or hamster or hamsters or animal or animals or dog or dogs or cat or cats or bovine or sheep).ti,ab,sh.
24. 20 or 21 or 22 or 23
25. exp human/
26. human experiment/
27. 25 or 26
28. 24 not (24 and 27)
29. 19 not 28
30. conference abstract.pt.
31. 29 not 30
32. incontinence/ or mixed incontinence/ or stress incontinence/ or urge incontinence/ or urine incontinence/
33. continence/
34. overactive bladder/
35. micturition disorder/ or lower urinary tract symptom/ or pollakisuria/
36. urinary dysfunction/ or bladder instability/ or detrusor dyssynergia/ or neurogenic bladder/ or urinary urgency/ or urine extravasation/
37. (incontinen$ or continen$).tw.
38. ((bladder or detrusor or vesic$) adj5 (instab$ or stab$ or unstab* or irritab$ or hyperreflexi$ or dys?ynerg$ or dyskinesi$ or irritat$)).tw.
39. (urin$ adj2 leak$).tw.
40. ((bladder or detrusor or vesic$) adj2 (hyper$ or overactiv$)).tw.
41. (bladder$ adj2 (neuropath$ or neurogen* or neurolog$)).tw.
42. (nervous adj pollakisur$).tw.
43. or/32‐42
44. 31 and 43
45. 2015$.dc.
46. 2016$.dc.
47. 2017$.dc.
48. 2018$.dc.
49. 201901$.dc.
50. 201902$.dc.
51. 201903$.dc.
52. 201904$.dc.
53. 201905$.dc.
54. 201906$.dc.
55. 201907$.dc.
56. 201908$.dc.
57. or/45‐56
58. 44 and 57
NHS EED
NHS EED on the UK Centre for Reviews and Dissemination (CRD) website (covering from the earliest record in NHS EED, dating from 1968, up to and including 31 December 2014 when their coverage ended). Date of search: 30 January 2020). Only a set of terms related to faecal incontinence was used as there were few records related to the topic in NHS EED (n = 69).
| Line | Search for |
| 1 | MeSH DESCRIPTOR fecal incontinence EXPLODE ALL TREES IN NHSEED |
| 2 | MeSH DESCRIPTOR anal canal EXPLODE ALL TREES IN NHSEED |
| 3 | MeSH DESCRIPTOR encopresis EXPLODE ALL TREES IN NHSEED |
| 4 | MeSH DESCRIPTOR defecography EXPLODE ALL TREES IN NHSEED |
| 5 | MeSH DESCRIPTOR Fecal Impaction EXPLODE ALL TREES IN NHSEED |
| 6 | MeSH DESCRIPTOR Elimination Disorders EXPLODE ALL TREES IN NHSEED |
| 7 | MeSH DESCRIPTOR Constipation EXPLODE ALL TREES IN NHSEED |
| 8 | MeSH DESCRIPTOR Hirschsprung Disease EXPLODE ALL TREES |
| 9 | MeSH DESCRIPTOR megacolon EXPLODE ALL TREES IN NHSEED |
| 10 | (defecation NEAR2 disorder*) OR (defaecation NEAR2 disorder*) IN NHSEED |
| 11 | (stool* NEAR25 incontinen* ) OR (stool* NEAR25 continen*) IN NHSEED |
| 12 | (fecal* NEAR25 incontinen* ) OR (fecal* NEAR25 continen*) IN NHSEED |
| 13 | (faecal* NEAR25 incontinen* ) OR (faecal* NEAR25 continen*) IN NHSEED |
| 14 | (faeces NEAR25 incontinen* ) OR (faeces* NEAR25 continen*) IN NHSEED |
| 15 | (feces NEAR25 incontinen* ) OR (feces* NEAR25 continen*) IN NHSEED |
| 16 | (bowel* NEAR25 incontinen* ) OR (bowel* NEAR25 continen*) IN NHSEED |
| 17 | (anal NEAR25 incontinen* ) OR (anal NEAR25 continen*) IN NHSEED |
| 18 | (anus NEAR25 incontinen* ) OR (anus NEAR25 continen*) IN NHSEED |
| 19 | (encopre*) IN NHSEED |
| 20 | (defaecograph*) OR (defecograph*) IN NHSEED |
| 21 | (impact* NEAR2 feces) OR (impact* NEAR2 faeces) IN NHSEED |
| 22 | (impact* NEAR2 fecal) OR (impact* NEAR2 faecal) OR (impact* NEAR2 stool) IN NHSEED |
| 23 | (pudend* NEAR2 neuropath*) OR (pudend* NEAR2 latenc*) IN NHSEED |
| 24 | (megarectum*) IN NHSEED |
| 25 | (leak* NEAR2 fecal) OR (leak* NEAR2 faecal) OR (leak* NEAR2 stool*) IN NHSEED |
| 26 | (leak* NEAR2 feces) OR (leak* NEAR2 faeces) OR (leak* NEAR2 motion*) IN NHSEED |
| 27 | (soil* NEAR2 feces) OR (soil* NEAR2 faeces) IN NHSEED |
| 28 | (soil* NEAR2 fecal) OR (soil* NEAR2 faecal) IN NHSEED |
| 29 | (postanal*) IN NHSEED |
| 30 | (bowel* NEAR25 manag*) IN NHSEED |
| 31 | (elimination disorder*) IN NHSEED |
| 32 | (expulsion NEAR2 feces) OR (expulsion NEAR2 faeces) IN NHSEED |
| 33 | (expulsion NEAR2 fecal) OR (expulsion NEAR2 faecal) IN NHSEED |
| 34 | (expel* NEAR2 fecal) OR (expel* NEAR2 faecal) IN NHSEED |
| 35 | (expel* NEAR2 feces) OR (expel* NEAR2 faeces) IN NHSEED |
| 36 | (megacolon) IN NHSEED |
| 37 | (retent* NEAR2 feces) OR (retent* NEAR2 faeces) IN NHSEED |
| 38 | (retent* NEAR2 fecal) OR (retent* NEAR2 faecal) IN NHSEED |
| 39 | (retain* NEAR2 fecal) OR (retain* NEAR2 faecal) IN NHSEED |
| 40 | (retain* NEAR2 feces) OR (retain* NEAR2 faeces) IN NHSEED |
| 41 | (retain* NEAR2 stool*) OR (retent* NEAR2 stool*) IN NHSEED |
| 42 | (expel* NEAR2 stool*) OR (expulsion* NEAR2 stool*) IN NHSEED |
| 43 | (anismus) IN NHSEED |
| 44 | (urge* NEAR2 fecal) OR (urge* NEAR2 faecal) OR (urge* NEAR2 stool*) IN NHSEED |
| 45 | (frequen* NEAR2 fecal) OR (frequen* NEAR2 faecal) OR (frequen* NEAR2 stool*) IN NHSEED |
| 46 | (frequen* NEAR2 feces) OR (frequen* NEAR2 faeces) IN NHSEED |
| 47 | (urge* NEAR2 feces) OR (urge* NEAR2 faeces) IN NHSEED |
| 48 | (spastic* NEAR2 bowel*) OR (spastic* NEAR2 colon*) IN NHSEED |
| 49 | (sphincter NEAR2 hypotoni*) IN NHSEED |
| 50 | (evacuat* NEAR2 feces) OR (evacuat* NEAR2 faeces) OR (evacuat* NEAR2 stool*) IN NHSEED |
| 51 | (evacuat* NEAR2 feces) OR (evacuat* NEAR2 faeces) OR (evacuat* NEAR2 stool*) IN NHSEED |
| 52 | (evacuat* NEAR2 fecal) OR (evacuat* NEAR2 faecal) OR (evacuat* NEAR2 motion*) IN NHSEED |
| 53 | (evacuat* NEAR2 bowel*) IN NHSEED |
| 54 | (voluntary NEAR2 placement*) OR (abnormal NEAR2 placement*) IN NHSEED |
| 55 | (dyschezia) OR (obstipation) OR (soiling) IN NHSEED |
| 56 | (pelvic NEAR2 dyssynerg*) IN NHSEED |
| 57 | (bowel* NEAR2 control*) OR (colonic NEAR2 aganglionosis) OR (colonic NEAR2 inertia) IN NHSEED |
| 58 | (seep* NEAR feces) OR (seep* NEAR faeces) IN NHSEED |
| 59 | (seep* NEAR fecal) OR (seep* NEAR faecal) IN NHSEED |
| 60 | (loss* NEAR2 feces) OR (loss* NEAR2 faeces) IN NHSEED |
| 61 | (loss* NEAR2 fecal) OR (loss* NEAR2 faecal) IN NHSEED |
| 62 | (loss* NEAR2 stool*) OR (loss* NEAR2 motion*) IN NHSEED |
| 63 | (seep* NEAR2 stool*) OR (seep* NEAR2 motion*) IN NHSEED |
| 64 | (urge* NEAR2 defecat*) OR (urge* NEAR2 defaecat*) IN NHSEED |
| 65 | (frequen* NEAR2 defecat*) OR (frequen* NEAR2 defaecat*) IN NHSEED |
| 66 | (bowel NEAR2 program$) IN NHSEED |
| 67 | (neurogen* NEAR2 bowel*) OR (neuropath* NEAR2 bowel*) IN NHSEED |
| 68 | #1 OR #2 OR #3 OR #4 OR #5 OR #6 OR #7 OR #8 OR #9 OR #10 OR #11 OR #12 OR #13 OR #14 OR #15 OR #16 OR #17 OR #18 OR #19 OR #20 OR #21 OR #22 OR #23 OR #24 OR #25 OR #26 OR #27 OR #28 OR #29 OR #30 OR #31 OR #32 OR #33 OR #34 OR #35 OR #36 OR #37 OR #38 OR #39 OR #40 OR #41 OR #42 OR #43 OR #44 OR #45 OR #46 OR #47 OR #48 OR #49 OR #50 OR #51 OR #52 OR #53 OR #54 OR #55 OR #56 OR #57 OR #58 OR #59 OR #60 OR #61 OR #62 OR #63 OR #64 OR #65 OR #66 OR #67 |
| 69 | (#68) IN NHSEED |
MEDLINE
MEDLINE on OvidSP (covering 1 January 1946 to January Week 3 2020). Date of search: 29 January 2020. For this review the searches were limited to those records with an entry date (.ed.) starting from 1 January 2015 up to and including 31 August 2019. Three sets of terms were used: faecal incontinence terms AND pelvic floor muscle training terms AND the NHS EED economic evaluation filter.
1. Economics/
2. exp "costs and cost analysis"/
3. Economics, Dental/
4. exp economics, hospital/
5. Economics, Medical/
6. Economics, Nursing/
7. Economics, Pharmaceutical/
8. (economic$ or cost or costs or costly or costing or price or prices or pricing or pharmacoeconomic$).ti,ab.
9. (expenditure$ not energy).ti,ab.
10. value for money.ti,ab.
11. budget$.ti,ab.
12. or/1‐11
13. ((energy or oxygen) adj cost).ti,ab.
14. (metabolic adj cost).ti,ab.
15. ((energy or oxygen) adj expenditure).ti,ab.
16. or/13‐15
17. 12 not 16
18. letter.pt.
19. editorial.pt.
20. historical article.pt.
21. or/18‐20
22. 17 not 21
23. exp animals/ not humans/
24. 22 not 23
25. ripstein.tw.
26. delorme.tw.
27. rectal prolapse/
28. graciloplast$.tw.
29. ivalon sponge$.tw.
30. thiersch.tw.
31. mucusectomy.tw.
32. mucosalectomy.tw.
33. mucosaectomy.tw.
34. antegrade continence.tw.
35. mucosectomy.tw.
36. mucosectom$.tw.
37. levatorplast$.tw.
38. procidentia.tw.
39. (mucosa$ adj2 prolapse$).tw.
40. (defecation adj2 disorder$).tw.
41. (defaecation adj2 disorder$).tw.
42. (stool$ adj25 (incontinen$ or continen$)).tw.
43. fecal incontinence/
44. anus/
45. ((fecal or faecal) adj25 (incontinen$ or continen$)).tw.
46. anus.tw.
47. anal.tw.
48. neosphincter$.tw.
49. (internal adj2 sphincter$).tw.
50. sphincteroplast$.tw.
51. cutaneous fistula/
52. rectal fistula/
53. rectovaginal fistula/
54. (artificial adj5 sphincter$).tw.
55. encopre$.tw.
56. encopresis/
57. defecography/
58. feces, impacted/
59. defaecograph$.tw.
60. defecograph$.tw.
61. (impact$ adj2 (feces or fecal or faeces or faecal or stool$)).tw.
62. archoptosis.tw.
63. ((intus?uscept$ or prolapse$ or invaginat$ or extirpat$ or anomal$ or malform$ or fistula$ or wells or support$ or sling$ or reconstruct$ or defect$ or resect$) adj2 (ano or ani or anorect$ or perianal or rectum or rectal or recti or mucosa$ or preanal or rectoan$ or rectovagina$ or vaginorectal or endorect$ or vagina$)).tw.
64. (abdominoperine$ adj2 (resect$ or extirpat$)).tw.
65. (miles adj2 operation$).tw.
66. proctopex$.tw.
67. rectopex$.tw.
68. (fistula$ adj2 (skin or cutaneous or enterocutaneous or enterovesic$)).tw.
69. protocolectom$.tw.
70. proctocolectom$.tw.
71. rectocolectom$.tw.
72. (pudend$ adj2 (neuropath$ or latenc$)).tw.
73. (lord$ adj2 stretch$).tw.
74. megarectum$.tw.
75. (sphincter$ adj2 (transposit$ or external$)).tw.
76. anoplast$.tw.
77. (resect$ adj2 (soave or perine$)).tw.
78. (ace adj2 (ano or ani or anorect$ or perianal or rectum or rectal or recti or mucosa$ or preanal or rectoan$ or rectovagina$ or vaginorectal or endorect$ or vagina$ or fecal or faecal or feces or faeces or stool$ or motion$)).tw.
79. (leak$ adj2 (fecal or faecal or feces or faeces or stool$ or motion$)).tw.
80. postanal.tw.
81. (polyviol adj2 sponge$).tw.
82 (rectocele or rectocoele or rectoceole).tw..
83. (soil$ adj2 (faeces or feces or fecal or faecal)).tw.
84. (bowel$ adj25 manag$).tw.
85. elimination disorders/
86. elimination disorder$.tw.
87. ((feces or faeces or fecal or faecal) adj2 (expulsion or expel$)).tw.
88. megacolon.tw.
89. ((faeces or feces or fecal or faecal or stool$) adj2 (retent$ or retain$)).tw.
90. (stool$ adj2 (expulsion or expel$)).tw.
91. anismus.tw.
92. (spastic$ adj2 (bowel$ or colon$)).tw.
93. constipation/
94. ((fecal or faecal or feces or faeces or stool$) adj2 (urge$ or frequen$)).tw.
95. (sphincter adj2 hypotoni$).tw.
96. ((faeces or feces or fecal or faecal or stool$ or motion$ or bowel$) adj2 evacuat$).tw.
97. (voluntary adj2 placement$).tw.
98. (abnormal adj2 placement$).tw.
99. dyschezia.tw.
100. obstipation.tw.
101. soiling.tw.
102. (bowel$ adj2 control$).tw.
103. hirschsprung disease/
104. (colonic adj2 aganglionosis).tw.
105. megacolon/
106. (colonic adj2 inertia).tw.
107. (pelvic adj2 dyssynerg$).tw.
108. ((feces or faeces or fecal or faecal) adj2 (seep$ or leak$ or loss)).tw.
109. ((stool$ or motion$) adj2 (seep$ or leak$)).tw.
110. ((defecat$ or defaecat$) adj2 (urge$ or frequent$)).tw.
111. (bowel adj2 program$).tw.
112. ((neurogen$ or neuropath$) adj2 bowel$).tw.
113. or/25‐112
114. 24 and 113
115. 2015$.ed.
116. 2016$.ed.
117. 2017$.ed.
118. 2018$.ed.
119. 201901$.ed.
120. 201902$.ed.
121. 201903$.ed.
122. 201904$.ed.
123. 201905$.ed.
124. 201906$.ed.
125. 201907$.ed.
126. 201908$.ed.
127. 115 or 116 or 117 or 118 or 119 or 120 or 121 or 122 or 123 or 124 or 125 or 126
128. 114 and 127
129. (pelvi$ adj2 floor).tw.
130. Physical Therapy Modalities/
131. Pelvic Floor/
132. Exercise therapy/
133. Resistance training/
134. Biofeedback, psychology/
135. perineomet$.tw.
136. (pelvi$ adj5 rehab$).tw.
137. kegel*.tw.
138. (pelvi* adj4 (exercis* or train* or muscle*)).tw.
139. PFMT.tw.
140. (pelvic adj2 diaphragm*).tw.
141. levator ani.tw.
142. electric stimulation therapy/ or exercise movement techniques/ or exp exercise therapy/ or musculoskeletal manipulations/ or myofunctional therapy/
143.or/129‐142
144. 128 and 143
Embase (on OvidSP) (covering 1 January 1974 to 2020 Week 4). Date of search: 29 January 2020. For this review the searches were limited to those records with a 'date created' (.dc.) or a 'date deliveried' (.dd.) date starting from 1 January 2015 up to and including 31 August 2019. Three sets of terms were used: faecal incontinence terms AND pelvic floor muscle training terms AND the NHS EED economic evaluation filter.
| 1 | Economics/ |
| 2 | exp "costs and cost analysis"/ |
| 3 | Economics, Dental/ |
| 4 | exp economics, hospital/ |
| 5 | Economics, Medical/ |
| 6 | Economics, Nursing/ |
| 7 | Economics, Pharmaceutical/ |
| 8 | (economic$ or cost or costs or costly or costing or price or prices or pricing or pharmacoeconomic$).ti,ab. |
| 9 | (expenditure$ not energy).ti,ab. |
| 10 | value for money.ti,ab. |
| 11 | budget$.ti,ab. |
| 12 | or/1‐11 |
| 13 | ((energy or oxygen) adj cost).ti,ab. |
| 14 | (metabolic adj cost).ti,ab. |
| 15 | ((energy or oxygen) adj expenditure).ti,ab. |
| 16 | or/13‐15 |
| 17 | 12 not 16 |
| 18 | letter.pt. |
| 19 | editorial.pt. |
| 20 | historical article.pt. |
| 21 | or/18‐20 |
| 22 | 17 not 21 |
| 23 | exp animals/ not humans/ |
| 24 | 22 not 23 |
| 25 | ripstein.tw. |
| 26 | delorme.tw. |
| 27 | rectal prolapse/ |
| 28 | graciloplast$.tw. |
| 29 | ivalon sponge$.tw. |
| 30 | thiersch.tw. |
| 31 | mucusectomy.tw. |
| 32 | mucosalectomy.tw. |
| 33 | mucosaectomy.tw. |
| 34 | antegrade continence.tw. |
| 35 | mucosectomy.tw. |
| 36 | mucosectom$.tw. |
| 37 | levatorplast$.tw. |
| 38 | procidentia.tw. |
| 39 | (mucosa$ adj2 prolapse$).tw. |
| 40 | (defecation adj2 disorder$).tw. |
| 41 | (defaecation adj2 disorder$).tw. |
| 42 | (stool$ adj25 (incontinen$ or continen$)).tw. |
| 43 | fecal incontinence/ |
| 44 | anus/ |
| 45 | ((fecal or faecal) adj25 (incontinen$ or continen$)).tw. |
| 46 | anus.tw. |
| 47 | anal.tw. |
| 48 | neosphincter$.tw. |
| 49 | (internal adj2 sphincter$).tw. |
| 50 | sphincteroplast$.tw. |
| 51 | cutaneous fistula/ |
| 52 | rectal fistula/ |
| 53 | rectovaginal fistula/ |
| 54 | (artificial adj5 sphincter$).tw. |
| 55 | encopre$.tw. |
| 56 | encopresis/ |
| 57 | defecography/ |
| 58 | feces, impacted/ |
| 59 | defaecograph$.tw. |
| 60 | defecograph$.tw. |
| 61 | (impact$ adj2 (feces or fecal or faeces or faecal or stool$)).tw. |
| 62 | archoptosis.tw. |
| 63 | ((intus?uscept$ or prolapse$ or invaginat$ or extirpat$ or anomal$ or malform$ or fistula$ or wells or support$ or sling$ or reconstruct$ or defect$ or resect$) adj2 (ano or ani or anorect$ or perianal or rectum or rectal or recti or mucosa$ or preanal or rectoan$ or rectovagina$ or vaginorectal or endorect$ or vagina$)).tw. |
| 64 | (abdominoperine$ adj2 (resect$ or extirpat$)).tw. |
| 65 | (miles adj2 operation$).tw. |
| 66 | proctopex$.tw. |
| 67 | rectopex$.tw. |
| 68 | (fistula$ adj2 (skin or cutaneous or enterocutaneous or enterovesic$)).tw. |
| 69 | protocolectom$.tw. |
| 70 | proctocolectom$.tw. |
| 71 | rectocolectom$.tw. |
| 72 | (pudend$ adj2 (neuropath$ or latenc$)).tw. |
| 73 | (lord$ adj2 stretch$).tw. |
| 74 | megarectum$.tw. |
| 75 | (sphincter$ adj2 (transposit$ or external$)).tw. |
| 76 | anoplast$.tw. |
| 77 | (resect$ adj2 (soave or perine$)).tw. |
| 78 | (ace adj2 (ano or ani or anorect$ or perianal or rectum or rectal or recti or mucosa$ or preanal or rectoan$ or rectovagina$ or vaginorectal or endorect$ or vagina$ or fecal or faecal or feces or faeces or stool$ or motion$)).tw. |
| 79 | (leak$ adj2 (fecal or faecal or feces or faeces or stool$ or motion$)).tw. |
| 80 | postanal.tw. |
| 81 | (polyviol adj2 sponge$).tw. |
| 82 | (rectocele or rectocoele or rectoceole).tw. |
| 83 | (soil$ adj2 (faeces or feces or fecal or faecal)).tw. |
| 84 | (bowel$ adj25 manag$).tw. |
| 85 | elimination disorders/ |
| 86 | elimination disorder$.tw. |
| 87 | ((feces or faeces or fecal or faecal) adj2 (expulsion or expel$)).tw. |
| 88 | megacolon.tw. |
| 89 | ((faeces or feces or fecal or faecal or stool$) adj2 (retent$ or retain$)).tw. |
| 90 | (stool$ adj2 (expulsion or expel$)).tw. |
| 91 | anismus.tw. |
| 92 | (spastic$ adj2 (bowel$ or colon$)).tw. |
| 93 | constipation/ |
| 94 | ((fecal or faecal or feces or faeces or stool$) adj2 (urge$ or frequen$)).tw. |
| 95 | (sphincter adj2 hypotoni$).tw. |
| 96 | ((faeces or feces or fecal or faecal or stool$ or motion$ or bowel$) adj2 evacuat$).tw. |
| 97 | (voluntary adj2 placement$).tw. |
| 98 | (abnormal adj2 placement$).tw. |
| 99 | dyschezia.tw. |
| 100 | obstipation.tw. |
| 101 | soiling.tw. |
| 102 | (bowel$ adj2 control$).tw. |
| 103 | hirschsprung disease/ |
| 104 | (colonic adj2 aganglionosis).tw. |
| 105 | megacolon/ |
| 106 | (colonic adj2 inertia).tw. |
| 107 | (pelvic adj2 dyssynerg$).tw. |
| 108 | ((feces or faeces or fecal or faecal) adj2 (seep$ or leak$ or loss)).tw. |
| 109 | ((stool$ or motion$) adj2 (seep$ or leak$)).tw. |
| 110 | ((defecat$ or defaecat$) adj2 (urge$ or frequent$)).tw. |
| 111 | (bowel adj2 program$).tw. |
| 112 | ((neurogen$ or neuropath$) adj2 bowel$).tw. |
| 113 | or/25‐112 |
| 114 | 2015*.dc. or 2015*.dd. |
| 115 | 2016*.dc. or 2016*.dd. |
| 116 | 2017*.dc. or 2017*.dd. |
| 117 | 2018*.dc. or 2018*.dd. |
| 118 | 201901*.dc. or 201901*.dd. |
| 119 | 201902*.dc. or 201902*.dd. |
| 120 | 201903*.dc. or 201903*.dd. |
| 121 | 201904*.dc. or 201904*.dd. |
| 122 | 201905*.dc. or 201905*.dd. |
| 123 | 201906*.dc. or 201906*.dd. |
| 124 | 201907*.dc. or 201907*.dd. |
| 125 | 201908*.dc. or 201908*.dd. |
| 126 | or/114‐125 |
| 127 | 24 and 113 and 126 |
| 128 | pelvic floor muscle training/ |
| 129 | exp feedback system/ |
| 130 | kegel*.tw. |
| 131 | (pelvi* adj4 (exercis* or train* or muscle*)).tw. |
| 132 | PFMT.tw. |
| 133 | perineomet$.tw. |
| 134 | (pelvi$ adj5 rehab$).tw. |
| 135 | (pelvi$ adj2 floor).tw. |
| 136 | (pelvic adj2 diaphragm*).tw. |
| 137 | levator ani.tw. |
| 138 | exp physiotherapy/ |
| 139 | exp kinesiotherapy/ |
| 140 | exp electrostimulation/ |
| 141 | manipulative medicine/ |
| 142 | muscle training/ or exp rehabilitation/ |
| 143 | exp conservative treatment/ |
| 144 | physiotherap*.tw. |
| 145 | physical therap*.tw. |
| 146 | kinesiotherap*.tw. |
| 147 | electrostimulat*.tw. |
| 148 | electrical stimulat*.tw. |
| 149 | or/128‐148 |
| 150 | 127 and 149 |
Data and analyses
Comparison 1. Antenatal pelvic floor muscle training (PFMT) versus control for prevention of incontinence.
| Outcome or subgroup title | No. of studies | No. of participants | Statistical method | Effect size |
|---|---|---|---|---|
| 1.1 Urinary incontinence in late pregnancy | 6 | 624 | Risk Ratio (M‐H, Random, 95% CI) | 0.38 [0.20, 0.72] |
| 1.1.1 PFMT versus no PFMT | 2 | 174 | Risk Ratio (M‐H, Random, 95% CI) | 0.14 [0.01, 2.04] |
| 1.1.2 PFMT versus usual care | 4 | 450 | Risk Ratio (M‐H, Random, 95% CI) | 0.44 [0.22, 0.91] |
| 1.2 Urinary incontinence early postnatal period (0‐3 months) | 5 | 439 | Risk Ratio (M‐H, Random, 95% CI) | 0.38 [0.17, 0.83] |
| 1.2.1 PFMT versus no PFMT | 2 | 174 | Risk Ratio (M‐H, Random, 95% CI) | 0.27 [0.11, 0.67] |
| 1.2.2 PFMT versus usual care | 2 | 198 | Risk Ratio (M‐H, Random, 95% CI) | 0.30 [0.04, 2.31] |
| 1.2.3 PFMT versus unspecified control | 1 | 67 | Risk Ratio (M‐H, Random, 95% CI) | 0.88 [0.43, 1.79] |
| 1.3 Urinary incontinence mid‐postnatal period (> 3‐6 months) | 5 | 673 | Risk Ratio (M‐H, Fixed, 95% CI) | 0.71 [0.54, 0.95] |
| 1.3.1 PFMT versus no PFMT | 1 | 86 | Risk Ratio (M‐H, Fixed, 95% CI) | 0.88 [0.35, 2.20] |
| 1.3.2 PFMT versus usual care | 4 | 587 | Risk Ratio (M‐H, Fixed, 95% CI) | 0.70 [0.52, 0.94] |
| 1.4 Urinary incontinence late postnatal period (> 6‐12 months) | 1 | 44 | Risk Ratio (M‐H, Fixed, 95% CI) | 1.20 [0.65, 2.21] |
| 1.4.1 PFMT versus usual care | 1 | 44 | Risk Ratio (M‐H, Fixed, 95% CI) | 1.20 [0.65, 2.21] |
| 1.5 Urinary incontinence long term (> 5 years) | 2 | Risk Ratio (M‐H, Fixed, 95% CI) | Subtotals only | |
| 1.5.1 PFMT versus usual care | 2 | 352 | Risk Ratio (M‐H, Fixed, 95% CI) | 1.07 [0.77, 1.48] |
| 1.6 Urinary incontinence‐specific quality of life | 1 | 152 | Mean Difference (IV, Fixed, 95% CI) | ‐2.42 [‐3.32, ‐1.52] |
| 1.6.1 PFMT versus usual care | 1 | 152 | Mean Difference (IV, Fixed, 95% CI) | ‐2.42 [‐3.32, ‐1.52] |
| 1.7 Severity of incontinence | 7 | Other data | No numeric data | |
| 1.7.1 PFMT versus no PFMT | 1 | Other data | No numeric data | |
| 1.7.2 PFMT versus usual care | 5 | Other data | No numeric data | |
| 1.7.3 PFMT versus unspecified control | 1 | Other data | No numeric data | |
| 1.8 Loss of urine under stress test late pregnancy | 1 | 102 | Risk Ratio (M‐H, Random, 95% CI) | 0.36 [0.19, 0.70] |
| 1.8.1 PFMT versus no PFMT | 1 | 102 | Risk Ratio (M‐H, Random, 95% CI) | 0.36 [0.19, 0.70] |
| 1.9 Loss of urine under stress test early postnatal period (0‐3 months) | 3 | 322 | Risk Ratio (M‐H, Fixed, 95% CI) | 0.35 [0.17, 0.75] |
| 1.9.1 PFMT versus no PFMT | 2 | 174 | Risk Ratio (M‐H, Fixed, 95% CI) | 0.09 [0.02, 0.47] |
| 1.9.2 PFMT versus usual care | 1 | 148 | Risk Ratio (M‐H, Fixed, 95% CI) | 0.88 [0.33, 2.29] |
| 1.10 Other self‐reported well‐being measures | 2 | Other data | No numeric data | |
| 1.10.2 PFMT versus usual care | 1 | Other data | No numeric data | |
| 1.10.3 PFMT versus unspecified control | 1 | Other data | No numeric data | |
| 1.11 Delivery outcome: caesarean section | 3 | 373 | Risk Ratio (M‐H, Fixed, 95% CI) | 1.28 [0.89, 1.85] |
| 1.11.1 PFMT versus no PFMT | 1 | 76 | Risk Ratio (M‐H, Fixed, 95% CI) | 1.83 [1.07, 3.15] |
| 1.11.2 PFMT versus usual care | 1 | 230 | Risk Ratio (M‐H, Fixed, 95% CI) | 1.24 [0.66, 2.36] |
| 1.11.3 PFMT versus unspecified control | 1 | 67 | Risk Ratio (M‐H, Fixed, 95% CI) | 0.68 [0.29, 1.57] |
| 1.12 Delivery outcome: other | 4 | Other data | No numeric data | |
| 1.12.1 PFMT versus no control | 1 | Other data | No numeric data | |
| 1.12.2 PFMT versus usual care | 2 | Other data | No numeric data | |
| 1.12.3 PFMT versus unspecified control | 1 | Other data | No numeric data | |
| 1.13 Pelvic floor muscle function | 3 | Other data | No numeric data | |
| 1.13.1 PFMT versus no PFMT | 1 | Other data | No numeric data | |
| 1.13.2 PFMT versus usual care | 2 | Other data | No numeric data |
Comparison 2. Antenatal pelvic floor muscle training (PFMT) versus control for treatment of incontinence.
| Outcome or subgroup title | No. of studies | No. of participants | Statistical method | Effect size |
|---|---|---|---|---|
| 2.1 Urinary incontinence late pregnancy | 3 | 345 | Risk Ratio (M‐H, Random, 95% CI) | 0.70 [0.44, 1.13] |
| 2.1.1 PFMT vs usual care | 3 | 345 | Risk Ratio (M‐H, Random, 95% CI) | 0.70 [0.44, 1.13] |
| 2.2 Urinary incontinence early postnatal period (0‐3 months) | 2 | 292 | Risk Ratio (M‐H, Random, 95% CI) | 0.75 [0.37, 1.53] |
| 2.2.1 PFMT versus usual care | 2 | 292 | Risk Ratio (M‐H, Random, 95% CI) | 0.75 [0.37, 1.53] |
| 2.3 Urinary incontinence mid‐postnatal period (> 3‐6 months) | 1 | 187 | Risk Ratio (M‐H, Fixed, 95% CI) | 0.94 [0.70, 1.24] |
| 2.3.1 PFMT versus usual care | 1 | 187 | Risk Ratio (M‐H, Fixed, 95% CI) | 0.94 [0.70, 1.24] |
| 2.4 Urinary incontinence late postnatal period (> 6‐12 months) | 2 | 869 | Risk Ratio (M‐H, Random, 95% CI) | 0.50 [0.13, 1.93] |
| 2.4.1 PFMT versus usual care | 2 | 869 | Risk Ratio (M‐H, Random, 95% CI) | 0.50 [0.13, 1.93] |
| 2.5 Urinary incontinence‐specific quality of life | 1 | 41 | Mean Difference (IV, Fixed, 95% CI) | ‐3.50 [‐6.13, ‐0.87] |
| 2.5.1 PFMT versus usual care | 1 | 41 | Mean Difference (IV, Fixed, 95% CI) | ‐3.50 [‐6.13, ‐0.87] |
| 2.6 Severity of incontinence | 1 | Other data | No numeric data | |
| 2.6.1 PFMT versus usual care | 1 | Other data | No numeric data | |
| 2.7 Self‐reported measures of pelvic floor dysfunction | 1 | Other data | No numeric data | |
| 2.7.1 PFMT versus usual care | 1 | Other data | No numeric data | |
| 2.8 Pelvic floor muscle function | 1 | Other data | No numeric data | |
| 2.8.1 PFMT versus usual care | 1 | Other data | No numeric data |
Comparison 3. Antenatal pelvic floor muscle training (PFMT) versus control for (mixed) prevention or treatment of incontinence.
| Outcome or subgroup title | No. of studies | No. of participants | Statistical method | Effect size |
|---|---|---|---|---|
| 3.1 Urinary incontinence late pregnancy | 11 | 3307 | Risk Ratio (M‐H, Random, 95% CI) | 0.78 [0.64, 0.94] |
| 3.1.1 PFMT versus no PFMT | 3 | 484 | Risk Ratio (M‐H, Random, 95% CI) | 0.43 [0.08, 2.37] |
| 3.1.2 PFMT versus usual care | 8 | 2823 | Risk Ratio (M‐H, Random, 95% CI) | 0.84 [0.73, 0.96] |
| 3.2 Urinary incontinence early postnatal period (0‐3 months) | 6 | 806 | Risk Ratio (M‐H, Fixed, 95% CI) | 0.83 [0.71, 0.99] |
| 3.2.1 PFMT versus no PFMT | 1 | 300 | Risk Ratio (M‐H, Fixed, 95% CI) | 0.72 [0.51, 1.02] |
| 3.2.2 PFMT versus usual care | 4 | 413 | Risk Ratio (M‐H, Fixed, 95% CI) | 0.95 [0.74, 1.24] |
| 3.2.3 PFMT versus unspecified control | 1 | 93 | Risk Ratio (M‐H, Fixed, 95% CI) | 0.77 [0.61, 0.97] |
| 3.3 Urinary incontinence mid‐postnatal period (> 3‐6 months) | 5 | 1921 | Risk Ratio (M‐H, Random, 95% CI) | 0.73 [0.55, 0.97] |
| 3.3.1 PFMT versus no PFMT | 1 | 300 | Risk Ratio (M‐H, Random, 95% CI) | 0.60 [0.38, 0.92] |
| 3.3.2 PFMT versus usual care | 3 | 1528 | Risk Ratio (M‐H, Random, 95% CI) | 0.85 [0.65, 1.11] |
| 3.3.3 PFMT versus unspecified control | 1 | 93 | Risk Ratio (M‐H, Random, 95% CI) | 0.42 [0.20, 0.86] |
| 3.4 Urinary incontinence late postnatal period (> 6‐12 months) | 2 | 244 | Risk Ratio (M‐H, Fixed, 95% CI) | 0.85 [0.63, 1.14] |
| 3.4.1 PFMT versus usual care | 2 | 244 | Risk Ratio (M‐H, Fixed, 95% CI) | 0.85 [0.63, 1.14] |
| 3.5 Urinary incontinence long term (> 5 years) | 1 | 188 | Risk Ratio (M‐H, Fixed, 95% CI) | 1.38 [0.77, 2.45] |
| 3.5.1 PFMT versus usual care | 1 | 188 | Risk Ratio (M‐H, Fixed, 95% CI) | 1.38 [0.77, 2.45] |
| 3.6 Faecal incontinence late pregnancy | 3 | 910 | Risk Ratio (M‐H, Fixed, 95% CI) | 0.64 [0.36, 1.14] |
| 3.6.1 PFMT versus usual care | 3 | 910 | Risk Ratio (M‐H, Fixed, 95% CI) | 0.64 [0.36, 1.14] |
| 3.7 Faecal incontinence early postnatal period (0‐3 months) | 2 | 130 | Risk Ratio (M‐H, Fixed, 95% CI) | 0.76 [0.34, 1.70] |
| 3.7.1 PFMT versus usual care | 2 | 130 | Risk Ratio (M‐H, Fixed, 95% CI) | 0.76 [0.34, 1.70] |
| 3.8 Urinary incontinence‐specific quality of life late pregnancy | 3 | 584 | Std. Mean Difference (IV, Random, 95% CI) | ‐0.02 [‐0.35, 0.31] |
| 3.8.1 PFMT versus no PFMT | 2 | 360 | Std. Mean Difference (IV, Random, 95% CI) | 0.06 [‐0.66, 0.78] |
| 3.8.2 PFMT versus usual care | 1 | 224 | Std. Mean Difference (IV, Random, 95% CI) | ‐0.05 [‐0.31, 0.21] |
| 3.9 Urinary incontinence‐specific quality of life early postnatal period (0‐3 months) | 4 | 645 | Std. Mean Difference (IV, Random, 95% CI) | ‐0.24 [‐0.67, 0.20] |
| 3.9.1 PFMT versus no PFMT | 2 | 360 | Std. Mean Difference (IV, Random, 95% CI) | ‐0.25 [‐1.28, 0.77] |
| 3.9.2 PFMT versus usual care | 2 | 285 | Std. Mean Difference (IV, Random, 95% CI) | ‐0.18 [‐0.41, 0.05] |
| 3.10 Urinary incontinence‐specific quality of life mid postnatal period (> 3‐6 months) | 1 | 300 | Mean Difference (IV, Random, 95% CI) | ‐0.79 [‐1.27, ‐0.31] |
| 3.10.1 PFMT versus no PFMT | 1 | 300 | Mean Difference (IV, Random, 95% CI) | ‐0.79 [‐1.27, ‐0.31] |
| 3.11 Urinary incontinence‐specific quality of life late postnatal period (> 6‐12 months) | 1 | 190 | Mean Difference (IV, Fixed, 95% CI) | ‐0.20 [‐1.20, 0.80] |
| 3.11.1 PFMT versus usual care | 1 | 190 | Mean Difference (IV, Fixed, 95% CI) | ‐0.20 [‐1.20, 0.80] |
| 3.12 Faecal incontinence‐specific quality of life early postnatal period (0‐3 months) | 1 | 74 | Mean Difference (IV, Random, 95% CI) | ‐2.60 [‐7.84, 2.64] |
| 3.12.1 PFMT versus usual care | 1 | 74 | Mean Difference (IV, Random, 95% CI) | ‐2.60 [‐7.84, 2.64] |
| 3.13 Severity of incontinence | 4 | Other data | No numeric data | |
| 3.13.3 PFMT versus no PFMT | 1 | Other data | No numeric data | |
| 3.13.4 PFMT versus usual care | 3 | Other data | No numeric data | |
| 3.14 Loss of urine under stress test early postnatal period (0‐3 months) | 1 | Other data | No numeric data | |
| 3.14.2 PFMT versus usual care | 1 | Other data | No numeric data | |
| 3.15 Self‐reported measures of pelvic floor dysfunction | 8 | Other data | No numeric data | |
| 3.15.3 PFMT versus no PFMT | 3 | Other data | No numeric data | |
| 3.15.4 PFMT versus usual care | 4 | Other data | No numeric data | |
| 3.15.5 PFMT versus unspecified control | 1 | Other data | No numeric data | |
| 3.16 Other self‐reported well‐being measures | 3 | Other data | No numeric data | |
| 3.16.4 PFMT versus usual care | 3 | Other data | No numeric data | |
| 3.17 Delivery outcome: caesarean section | 8 | 2030 | Risk Ratio (M‐H, Fixed, 95% CI) | 0.91 [0.77, 1.08] |
| 3.17.1 PFMT versus no PFMT | 2 | 360 | Risk Ratio (M‐H, Fixed, 95% CI) | 0.95 [0.71, 1.28] |
| 3.17.2 PFMT versus usual care | 6 | 1670 | Risk Ratio (M‐H, Fixed, 95% CI) | 0.89 [0.73, 1.10] |
| 3.18 Delivery outcome: other | 6 | Other data | No numeric data | |
| 3.18.3 PFMT versus no PFMT | 1 | Other data | No numeric data | |
| 3.18.4 PFMT versus usual care | 5 | Other data | No numeric data | |
| 3.19 Pelvic floor muscle function | 7 | Other data | No numeric data | |
| 3.19.1 PFMT versus no PFMT | 3 | Other data | No numeric data | |
| 3.19.2 PFMT versus usual care | 3 | Other data | No numeric data | |
| 3.19.3 PFMT versus unspecified control | 1 | Other data | No numeric data |
3.18. Analysis.
Comparison 3: Antenatal pelvic floor muscle training (PFMT) versus control for (mixed) prevention or treatment of incontinence, Outcome 18: Delivery outcome: other
| Delivery outcome: other | ||||
| Study | Outcome measure | PFMT data | Control data | Difference |
| PFMT versus no PFMT | ||||
| Ko 2011 | Episiotomy | 99 of 150 | 104 of 150 | Relative risk 0.95 (95% CI 0.81 to 1.11) |
| Severe perineal lacerations | 10 of 150 | 10 of 150 | Relative risk 1.00 (95% CI 0.43 to 2.33) | |
| PFMT versus usual care | ||||
| Fritel 2015 | Spontaneous vaginal delivery | 72 of 137 | 72 of 135 | Relative risk 0.99 (95% CI 0.79 to 1.23) |
| Assisted delivery | 29 of 137 | 35 of 135 | Relative risk 0.82 (95% CI 0.53 to 1.26) | |
| Hyakutake 2018 | Spontaneous vaginal delivery | 15 of 37 | 15 of 34 | Relative risk 0.92 (95% CI 0.53 to 1.58) |
| Assisted delivery | 11 of 37 | 7 of 34 | Relative risk 0.67 (95% CI 0.36 to 1.26) | |
| Miquelutti 2013 | Vaginal delivery | 44 of 76 | 38 of 71 | Relative risk 1.08 (95% CI 0.81 to 1.44) |
| Duration active phase labour (min) | Mean 284.5, SD 175, n = 78 | Mean 254.2, SD 139.4, n = 71 | Mean difference 30.3 (95% CI ‐40.9 to 101.4) | |
| Duration second stage labour (min) | Mean 29.2, SD 23.3, n = 78 | Mean 19.7, SD 13.0, n = 71 | Mean difference 9.48 (95% CI 0.32 to 18.64) | |
| Mørkved 2003 | Type of delivery (excluding twin pregnancy, preterm delivery, planned caesarean section and induced labour) | 91 normal vaginal deliveries, 15 asssisted vaginal deliveries, 5 emergency caesarean section, n = 111 | 91 normal vaginal deliveries, 19 assisted vaginal deliveries, 3 emergency caesarean section, n = 113 | Relative risk for normal vaginal delivery 1.02 (95% CI 0.90 to 1.15) Relative risk for assisted vaginal delivery 0.80 (95% CI 0.43 to 1.50) |
| Perineal trauma | 56 with episiotomy, and 7 with third or fourth degree tears, n = 111 | 72 with episiotomy, and 9 with third or fourth degree tears, n = 113 | Relative risk for episiotomy 0.79 (95% CI 0.63 to 1.00) | |
| Duration second stage labour (min) | Mean 40, 95% CI 33 to 47, n = 111 | Mean 45, 95% CI 38 to 52, n = 113 | Mean difference ‐5.00 (95% CI ‐14.79 to 4.79) | |
| Stafne 2012 | Assisted vaginal delivery | 62 of 426 | 50 of 425 | Relative risk 1.24 (95% CI 0.87 to 1.75) |
| Mean duration labour (min) | Mean 289, n = 426? | Mean 281, n = 425? | Unable to estimate | |
| Mean duration active second stage labor (min) | Mean 32, n = 426? | Mean 29, n = 425? | Unable to estimate | |
Comparison 4. Postnatal pelvic floor muscle training (PFMT) versus control for treatment of incontinence.
| Outcome or subgroup title | No. of studies | No. of participants | Statistical method | Effect size |
|---|---|---|---|---|
| 4.1 Urinary incontinence late postnatal period (> 6‐12 months) | 3 | 696 | Risk Ratio (M‐H, Random, 95% CI) | 0.55 [0.29, 1.07] |
| 4.1.1 PFMT versus no PFMT | 1 | 62 | Risk Ratio (M‐H, Random, 95% CI) | 0.29 [0.18, 0.47] |
| 4.1.2 PFMT versus usual care | 2 | 634 | Risk Ratio (M‐H, Random, 95% CI) | 0.80 [0.61, 1.06] |
| 4.2 Urinary incontinence long term (> 5‐10 years) | 1 | Risk Ratio (M‐H, Fixed, 95% CI) | Subtotals only | |
| 4.2.1 PFMT versus usual care | 1 | 516 | Risk Ratio (M‐H, Fixed, 95% CI) | 0.96 [0.88, 1.05] |
| 4.3 Urinary incontinence very long term (> 10 years) | 1 | 471 | Risk Ratio (M‐H, Fixed, 95% CI) | 1.03 [0.94, 1.12] |
| 4.3.1 PFMT versus usual care | 1 | 471 | Risk Ratio (M‐H, Fixed, 95% CI) | 1.03 [0.94, 1.12] |
| 4.4 Faecal incontinence late postnatal period (> 6‐12 months) | 2 | 620 | Risk Ratio (M‐H, Random, 95% CI) | 0.68 [0.24, 1.94] |
| 4.4.1 PFMT versus usual care | 2 | 620 | Risk Ratio (M‐H, Random, 95% CI) | 0.68 [0.24, 1.94] |
| 4.5 Faecal incontinence long term (> 5‐10 years) | 1 | 509 | Risk Ratio (M‐H, Fixed, 95% CI) | 0.95 [0.60, 1.50] |
| 4.5.1 PFMT versus usual care | 1 | 509 | Risk Ratio (M‐H, Fixed, 95% CI) | 0.95 [0.60, 1.50] |
| 4.6 Faecal incontinence very long term (> 10 years) | 1 | 468 | Odds Ratio (M‐H, Fixed, 95% CI) | 1.36 [0.84, 2.22] |
| 4.6.1 PFMT versus usual care | 1 | 468 | Odds Ratio (M‐H, Fixed, 95% CI) | 1.36 [0.84, 2.22] |
| 4.7 Urinary incontinence‐specific quality of life | 1 | 18 | Mean Difference (IV, Fixed, 95% CI) | ‐1.66 [‐3.51, 0.19] |
| 4.7.1 PFMT versus usual care | 1 | 18 | Mean Difference (IV, Fixed, 95% CI) | ‐1.66 [‐3.51, 0.19] |
| 4.8 Severity of incontinence | 5 | Other data | No numeric data | |
| 4.8.1 PFMT versus no PFMT | 1 | Other data | No numeric data | |
| 4.8.2 PFMT versus usual care | 4 | Other data | No numeric data | |
| 4.9 Self‐reported measures of pelvic floor dysfunction | 1 | Other data | No numeric data | |
| 4.10 Other self‐reported well‐being measures | 1 | Other data | No numeric data | |
| 4.11 Pelvic floor muscle function | 4 | Other data | No numeric data | |
| 4.11.1 PFMT versus no PFMT | 1 | Other data | No numeric data | |
| 4.11.2 PFMT versus usual care | 3 | Other data | No numeric data |
Comparison 5. Postnatal pelvic floor muscle training (PFMT) versus control for (mixed) prevention or treatment of incontinence.
| Outcome or subgroup title | No. of studies | No. of participants | Statistical method | Effect size |
|---|---|---|---|---|
| 5.1 Urinary incontinence early postnatal period (0‐3 months) | 2 | Risk Ratio (M‐H, Fixed, 95% CI) | Subtotals only | |
| 5.1.1 PFMT versus no PFMT | 2 | 321 | Risk Ratio (M‐H, Fixed, 95% CI) | 0.54 [0.44, 0.66] |
| 5.2 Urinary incontinence mid‐postnatal period (> 3‐6 months) | 5 | 2800 | Risk Ratio (M‐H, Random, 95% CI) | 0.95 [0.75, 1.19] |
| 5.2.1 PFMT versus usual care | 5 | 2800 | Risk Ratio (M‐H, Random, 95% CI) | 0.95 [0.75, 1.19] |
| 5.3 Urinary incontinence late postnatal period (> 6‐12 months) | 3 | 826 | Risk Ratio (M‐H, Fixed, 95% CI) | 0.88 [0.71, 1.09] |
| 5.3.1 PFMT versus no PFMT | 1 | 107 | Risk Ratio (M‐H, Fixed, 95% CI) | 0.82 [0.31, 2.21] |
| 5.3.2 PFMT versus usual care | 2 | 719 | Risk Ratio (M‐H, Fixed, 95% CI) | 0.88 [0.71, 1.10] |
| 5.4 Faecal incontinence early postnatal period (0‐3 months) | 1 | 1609 | Risk Ratio (M‐H, Fixed, 95% CI) | 0.93 [0.51, 1.67] |
| 5.4.1 PFMT versus usual care | 1 | 1609 | Risk Ratio (M‐H, Fixed, 95% CI) | 0.93 [0.51, 1.67] |
| 5.5 Faecal incontinence late postnatal period (> 6‐12 months) | 1 | 107 | Risk Ratio (M‐H, Fixed, 95% CI) | 0.73 [0.13, 4.21] |
| 5.5.1 PFMT versus no PFMT | 1 | 107 | Risk Ratio (M‐H, Fixed, 95% CI) | 0.73 [0.13, 4.21] |
| 5.6 Urinary incontinence‐specific quality of life | 1 | 23 | Mean Difference (IV, Fixed, 95% CI) | 0.50 [‐5.53, 6.53] |
| 5.6.1 PFMT plus versus PFMT | 1 | 23 | Mean Difference (IV, Fixed, 95% CI) | 0.50 [‐5.53, 6.53] |
| 5.7 Severity of incontinence | 7 | Other data | No numeric data | |
| 5.7.1 PFMT versus no PFMT | 2 | Other data | No numeric data | |
| 5.7.2 PFMT versus usual care | 5 | Other data | No numeric data | |
| 5.8 Loss of urine under stress test postpartum | 3 | 512 | Risk Ratio (M‐H, Fixed, 95% CI) | 0.83 [0.60, 1.13] |
| 5.8.1 PFMT versus no PFMT | 1 | 189 | Risk Ratio (M‐H, Fixed, 95% CI) | 0.53 [0.28, 0.98] |
| 5.8.2 PFMT versus usual care | 2 | 323 | Risk Ratio (M‐H, Fixed, 95% CI) | 0.97 [0.67, 1.40] |
| 5.9 Self‐reported measures of pelvic floor dysfunction | 8 | Other data | No numeric data | |
| 5.9.1 PFMT plus versus PFMT | 2 | Other data | No numeric data | |
| 5.9.2 PFMT versus no PFMT | 3 | Other data | No numeric data | |
| 5.9.3 PFMT versus usual care | 3 | Other data | No numeric data | |
| 5.10 Other self‐reported well‐being measures | 2 | Other data | No numeric data | |
| 5.10.1 PFMT versus usual care | 2 | Other data | No numeric data | |
| 5.11 Pelvic floor muscle function | 8 | Other data | No numeric data | |
| 5.11.1 PFMT plus versus PFMT | 1 | Other data | No numeric data | |
| 5.11.2 PFMT versus no PFMT | 1 | Other data | No numeric data | |
| 5.11.3 PFMT versus usual care | 6 | Other data | No numeric data |
Characteristics of studies
Characteristics of included studies [ordered by study ID]
Ahlund 2013.
| Study characteristics | ||
| Methods | Design: 2‐arm (parallel groups) RCT. | |
| Participants |
Number of participants: 98 postpartum primiparous women, 10 to 16 weeks after delivery. Setting: 4 different private antenatal clinics in the urban area of Stockholm, Sweden. Age: mean (SD), years: PFMT 33 (3.4); control 33 (3.9). Parity: primiparous. Delivery: not reported. BMI: mean (SD): PFMT 23 (3.5); control 23 (3.2). Incontinence at recruitment: 100% (as outlined in inclusion criteria). Inclusion: normal term singleton vaginal delivery, stress UI. Exclusion: neurological bladder dysfunction or tumours in the genital area. |
|
| Interventions |
PFMT (n = 49): supervised home exercise programme (written instructions), daily exercises, for 6 months. Instructions from study midwife on how to perform correct PFM contraction, confirmed by vaginal palpation. Participants visited the midwife every 6 weeks (total of 3 times during the study period) for follow‐up of progress and to encourage PFMT. Control (n = 49): usual postnatal care. Instructions from study midwife on how to perform correct PFM contraction, confirmed by vaginal palpation. Received customary written postpartum instructions explaining PFM anatomy and recommendations around PFMT. |
|
| Outcomes | Measured at 3 (baseline) and 9 months' postpartum. Primary endpoint: 9 months' postpartum. UI at 9 months' postpartum: not reported. Primary outcome: PFM strength (maximal voluntary contraction) measured using perineometry (mmHg). Secondary outcomes: PFM endurance (sec), PFM strength using Oxford grading scale, self‐reported UI using ICIQ FLUTS‐short form questionnaire, general health form with 19 questions related to delivery, motherhood and current health status. |
|
| Notes | Losses to follow‐up at 9 months: PFMT 9/49; control 7/49 (total 16.3%). Funding: not specifically funded. Conflicts of interest: none declared |
|
| Risk of bias | ||
| Bias | Authors' judgement | Support for judgement |
| Random sequence generation (selection bias) | Unclear risk | Not reported. |
| Allocation concealment (selection bias) | Low risk | "Allocated randomly through sequentially numbered and sealed envelopes." |
| Blinding of participants and personnel (performance bias) All outcomes | High risk | Not feasible. |
| Blinding of outcome assessment (detection bias) All outcomes | High risk | Unblinded reporting of UI self‐report outcomes because they were participant‐reported. "A limitation of this study was that the midwife was not blinded during the project." |
| Incomplete outcome data (attrition bias) All outcomes | Unclear risk | 16.3% dropout; similar between groups; different reasons; no mention of imputation for missing data. |
| Selective reporting (reporting bias) | High risk | Did not report data relating to adherence to the exercise programme and how women prioritised the exercises. |
| Other bias | Unclear risk | Study did not contribute any data to the forest plots. |
Assis 2015.
| Study characteristics | ||
| Methods | Design: 3‐arm (parallel groups) RCT. | |
| Participants |
Number of participants: 87 primiparous women. Setting: Basic Health Units, Assis (Sao Paulo), Brazil. Age: mean (SD), years: PFMT (1) 26.3 (4.6); PFMT (2) 27.1 (5.4); control 26.6 (5.7). Parity: primiparous. Delivery: not measured as primary endpoint was during pregnancy. Weight: mean (kg), at 18 weeks: PFMT (1) 70.7 (18.4); PFMT (2) 65.5 (13.4); control 63.2 (9.6). Incontinence at recruitment: PFMT (1) 58.6%; PFMT (2) 51.7%; control 48.3%. Inclusion: primiparous; ≤ 18 weeks' pregnant; aged 20‐35 years; and not presenting with diabetes, hypertension or UI prior to pregnancy. Exclusion: women who did not log their exercises, or gave up the collection of data. |
|
| Interventions |
PFMT 1 (n = 29): supervised home exercise programme, daily exercise at home, with up to 5 monthly visits from a physiotherapist (at 22, 26, 30, 34, and 38 weeks' gestation). Women received a manual of home exercises and were instructed on how to use it, as well as exercise and leakage diaries. PFMT 2 (n = 29): unsupervised PFMT, daily exercise at home as per the supervised group. Women received a manual of home exercises and were instructed on how to use it, as well as exercise and leakage diaries. Control (n = 29): no manual or supervision, and no exercise and leakage diaries. Unclear if instructed not to perform PFMT. Note: groups PFMT 1 and PFMT 2 were combined as the intervention group for comparison with controls. |
|
| Outcomes | Measured at baseline (up to 18 weeks' gestation), and at 22, 26, 30 and 34 weeks' gestation. Primary endpoint: 38 weeks' gestation. Primary outcome: self‐reported UI. Secondary outcome: PFM strength measured using perineometry (mmHg). |
|
| Notes | No dropouts. Funding: not reported. Conflicts of interest: not reported. |
|
| Risk of bias | ||
| Bias | Authors' judgement | Support for judgement |
| Random sequence generation (selection bias) | Low risk | Computer‐generated random number sequence. |
| Allocation concealment (selection bias) | Unclear risk | Prepared by third party, sealed envelopes. |
| Blinding of participants and personnel (performance bias) All outcomes | High risk | Not feasible. |
| Blinding of outcome assessment (detection bias) All outcomes | High risk | Unblinded reporting of UI self‐report outcomes because they were participant‐reported. Unclear if perineometry blinded. |
| Incomplete outcome data (attrition bias) All outcomes | Low risk | No dropouts. |
| Selective reporting (reporting bias) | High risk | Did not report UI severity (defined in methods as small, moderate and intense). |
| Other bias | Low risk | No other sources of bias noted. |
Barakat 2011.
| Study characteristics | ||
| Methods | Design: 2‐arm, parallel, unblinded, RCT (with unclear randomisation methods). | |
| Participants |
Number of participants: 80 sedentary pregnant, primiparous and multiparous women. Setting: obstetric department, Hospital de Fuenlabrada, Madrid, Spain. Age: mean (SD), years: PFMT 31 (3); control 30 (3). Parity: primiparous PFMT 65%; control 30%. Delivery: PFMT: 56.7% vaginal, 20.6% instrumental, 20.6% caesarean; control: 54.5% vaginal, 15.2% instrumental, 30.3% caesarean. BMI: mean (SD): PFMT 23.9 (3); control 24.8 (4). Incontinence at recruitment: none. Inclusion: healthy, uncomplicated and singleton pregnancies. Exclusion: women who did not plan to give birth in the same obstetric department, did not receive medical follow‐up evaluations throughout their entire pregnancy, and who had experienced incontinence before pregnancy. Also, any type of absolute obstetric contraindication to aerobic exercise during pregnancy (such as haemodynamically significant heart disease, restrictive lung disease, incompetent cervix, multiple gestation, risk of premature labour, pre‐eclampsia/pregnancy‐induced hypertension, thrombophlebitis, recent pulmonary embolism (last 5 years), acquired infectious disease, retarded intrauterine development, serious blood disease, absence of antenatal control, or a combination). |
|
| Interventions |
PFMT (n = 40): approximately 7‐8 min of PFMT as part of a 35‐45 min multimodal physical conditioning programme. All sessions supervised by a qualified fitness specialist (working with groups of 10‐12 participants) with the assistance of an obstetrician, 3 days per week from the beginning of pregnancy (weeks 6‐9) to the end of the 3rd trimester (weeks 38‐39). Thus, an approximate 85 training sessions were originally planned for each participant in the event of no preterm delivery. No details of PFMT programme given and this appeared to have been introduced only in the 3rd trimester. Control (n = 40): unspecified, no information provided. |
|
| Outcomes | Measured "after delivery." Primary endpoint: not reported, but questionnaires given to participants "after delivery." Primary outcome: not reported. Other outcomes: self‐reported UI (ICIQ‐SF), maternal perception of health (SF‐36, King's Health Questionnaire), pregnancy outcomes. |
|
| Notes | Losses to follow‐up "after delivery": PFMT 6/40; control 7/40 (total 16.3%). Adverse events: no exercise‐induced injuries were experienced. Funding: no outside funding received. Conflicts of Interest: not reported. |
|
| Risk of bias | ||
| Bias | Authors' judgement | Support for judgement |
| Random sequence generation (selection bias) | Low risk | "Use of a random number table." |
| Allocation concealment (selection bias) | Unclear risk | Not reported. |
| Blinding of participants and personnel (performance bias) All outcomes | High risk | Not feasible. |
| Blinding of outcome assessment (detection bias) All outcomes | High risk | Unblinded reporting of UI self‐report outcomes because they were participant‐reported. |
| Incomplete outcome data (attrition bias) All outcomes | Unclear risk | 16.3% dropout; similar between groups (numbers and reasons); no mention of imputation for missing data. |
| Selective reporting (reporting bias) | Low risk | Outcome measures described in methods were reported in results. |
| Other bias | Low risk | No other sources of bias noted. |
Bø 2011.
| Study characteristics | ||
| Methods | Design: 2‐arm (parallel groups) RCT. | |
| Participants |
Number of participants: 105 sedentary primiparous women. Setting: university‐conducted primary care study, single centre, Oslo, Norway. Age: mean (SD), in years: PFMT 31.2 (3.7); control 30.3 (4.4). Parity: 100% primiparous. Delivery: unclear, appeared to report delivery details for women with incontinence only. Of those with incontinence: PFMT 2 instrumental deliveries, 1 caesarean; control: 3 instrumental, 2 caesarean. BMI: mean (SD): PFMT 23.8 (3.8); control 23.9 (4.7). Incontinence at recruitment: UI: PFMT 27%, control 21%; flatus: PFMT 29%, control 23%; FI: PFMT 0, control 0. Inclusion: healthy and primiparous women with a singleton foetus, sedentary (defined as not having participated in regular exercise at least once per week, including significant amounts of walking) for the last 6 months, within the 1st 24 weeks of pregnancy, and able to understand verbal and written instructions in the Norwegian language. Exclusion: severe heart disease, pregnancy‐induced hypertension, history of ≥ 2 miscarriages, bleeding after 12 weeks' gestation, uncontrolled thyroid disease, pre‐eclampsia or other diseases that could affect participation. |
|
| Interventions |
PFMT (n = 52): as part of an aerobic fitness class (2‐3 times per week, 60 min), for at least 12 weeks. Progressive PFMT programme that was incorporated into 15 min of strength training which included PFMT. All sessions were led by instructors who were trained (which included instructions on how to explain a correct PFM contraction) by an experienced physiotherapist. Women were also encouraged to be physically active for at least 30 min per day and to increase their daily activity as much as possible. Women were given a book on general exercise during pregnancy with a specific PFMT pamphlet developed for pregnant women, explaining the anatomy of the pelvic floor, how to do a correct PFM contraction, and training prescription of 3 sets of 8‐12 close to maximum PFM contractions per day. Control (n = 53): usual antenatal care. |
|
| Outcomes | Measured before the start of the intervention (baseline, 12‐24 weeks' gestation), after the intervention (36‐38 weeks' gestation), and 6‐8 weeks' postpartum. Primary endpoint: not reported. Primary outcome: self‐reported UI and FI (flatus or anal incontinence, or both). Secondary outcomes: questions from the Severity Index and ICIQ‐SF. |
|
| Notes | Losses to follow‐up after the intervention (36‐38 weeks' gestation): PFMT 10/52; control 11/53 (total 20%). Losses to follow‐up 6‐8 weeks' postpartum: PFMT 9/52; control 6/53 (total 14.3%). Funding: not reported. Conflicts of interest: none declared. |
|
| Risk of bias | ||
| Bias | Authors' judgement | Support for judgement |
| Random sequence generation (selection bias) | Low risk | "A statistical randomisation computer programme was used to perform a simple randomisation procedure (not block)." |
| Allocation concealment (selection bias) | Low risk | "A secretary not involved in the study assigned the participants to either the exercise group or the control group." |
| Blinding of participants and personnel (performance bias) All outcomes | High risk | Not feasible. |
| Blinding of outcome assessment (detection bias) All outcomes | High risk | Unblinded reporting of UI and FI outcomes because they were participant‐reported. "The participants were asked not to reveal any information about group allocation to the principal investigator. The principal investigator was not involved in training the women, and was blinded to allocation while plotting and analysing the data... participants were interviewed by the blinded investigator and answered separate questions about incontinence." |
| Incomplete outcome data (attrition bias) All outcomes | Unclear risk | 14.3% dropout; differential loss (PFMT 17.3%, control 11.3%); similar reasons; no mention of imputation for missing data. |
| Selective reporting (reporting bias) | High risk | Authors reported that only the overall prevalence of UI (primary outcome of this paper) was used in the statistical analysis of this study. However, it appeared that not all of the study's prespecified outcomes (such as questions relating to the severity of urinary tract symptoms as assessed by the Severity Index and ICIQ‐6) were reported. |
| Other bias | Low risk | No other sources of bias noted. |
Chiarelli 2002.
| Study characteristics | ||
| Methods | Design: 2‐arm (parallel groups) RCT. | |
| Participants |
Number of participants: 720 women recruited from postnatal wards. Setting: 3 hospitals in New South Wales, Australia. Age: PFMT 57% aged 20‐29 years; control 57% aged 20‐29 years. Parity: primiparous, PFMT 57%; control 57%. Delivery: PFMT 66% vaginal, 44% instrumental; control 65% vaginal, 45% instrumental. BMI: overweight or obese, PFMT 30%; control 32%. Incontinence prior to current pregnancy: PFMT 18%; control 17%. Inclusion: forceps or ventouse delivery or birth of baby weighing ≥ 4000 g. Exclusion: stillbirth or baby in neonatal intensive care unit, women with disabilities unable to perform PFMT, women who were not residents of Australia, women who could not speak English sufficiently to give consent. |
|
| Interventions |
PFMT (n = 370): taught 1‐to‐1 by a physiotherapist, over 2 visits in 8 weeks. Intervention also included discussion based on postnatal booklet (UI, pelvic floor function, PFMT, good bladder habits, type and amount of fluids, perineal care) and viewing perineum with hand mirror (for perineal trauma, haemorrhoids, and to practice perineal splinting for defecation) and practice of voluntary PFM contraction, 'the knack', and transversus abdominus contraction. Postnatal pack also included red stick‐up dots, poster and partner information sheet in attempts to aid exercise adherence. Control (n = 350): usual postnatal care, no visit from physiotherapist. Hospital brochure available with general postnatal and PFMT advice, and invitation to join postnatal physiotherapy class held on wards. No restrictions on PFMT being recommended by other healthcare professionals. |
|
| Outcomes | Measured at 3 and 12 months' postpartum. Primary endpoint: 3 months' postpartum. Primary outcome: self‐reported UI (if answered occasionally, often, or always to a series of questions about stress or urgency UI). Secondary outcomes: incontinence severity (slight, moderate, severe), and self‐reported adherence. |
|
| Notes | Losses to follow‐up at 3 months: PFMT 22/370; control 22/350 (total 6.1%). Losses to follow‐up at 12 months: PFMT 49/370; control 50/350 (total 14%). In addition, at 12 months, 52 participants (PFMT 27; control 25) were pregnant and not included in the analysis. Funding: Medical Benefits Fund, Physiotherapy Foundation, and University of Newcastle Research Management Committee. Conflicts of interest: none declared. |
|
| Risk of bias | ||
| Bias | Authors' judgement | Support for judgement |
| Random sequence generation (selection bias) | Low risk | "Computer generated randomisation list contained the identification numbers for women in the trial." |
| Allocation concealment (selection bias) | Low risk | "The allocation to intervention or control group was placed by a research assistant in a sealed envelope marked with the corresponding study identification number." |
| Blinding of participants and personnel (performance bias) All outcomes | High risk | Not feasible to blind participants. "Physiotherapist blinded to the women's allocation until interview at entry into the trial was complete." |
| Blinding of outcome assessment (detection bias) All outcomes | High risk | Unblinded reporting of UI self‐report outcomes because they were participant‐reported. "The interviewer was trained by PC and was blind to the group allocation of the women being interviewed" |
| Incomplete outcome data (attrition bias) All outcomes | Low risk | 6.1% dropout; similar between groups; no reasons; no mention of imputation for missing data. |
| Selective reporting (reporting bias) | Low risk | Outcome measures described in methods were reported in results. |
| Other bias | Low risk | No other sources of bias noted. |
Cruz 2014.
| Study characteristics | ||
| Methods | Design: 2‐arm (parallel groups) RCT, nested into a cohort of 500 pregnant women. | |
| Participants |
Number of participants: 79 pregnant women. Setting: health service in Guarulhos (Sao Paulo), Brazil. Age: not reported. Parity: not reported. Delivery: not reported. BMI: not reported. Incontinence at recruitment: 100% (refer to inclusion criteria). Inclusion: UI in the current pregnancy (at 21‐26 weeks), single pregnancy, aged > 18 years, education to at least elementary school level and ability to understand the Portuguese language. Exclusion: previous urogenital surgery or diseases that may interfere with PFM strength (pelvic organ prolapse, neurological disorders, diabetes, pelvic or spinal injury). |
|
| Interventions |
PFMT (n = 43): 5 or 6 biweekly sessions of PFMT supervised by a physiotherapist. Control (n = 36): instructed to perform a similar unsupervised PFMT at home. |
|
| Outcomes | Measured before beginning (2nd trimester of pregnancy) and after finishing (3rd trimester of pregnancy) the PFMT. Primary endpoint: not reported but presume after finishing PFMT (3rd trimester). Primary outcomes: self‐reported UI, urinary severity (ICIQ‐SF). Secondary outcome: PFM strength (perineometry). |
|
| Notes | Losses to follow‐up: PFMT 23/43; control 15/36 (total 48.1%). Funding: Sao Paulo Research Foundation (FAPESP) and National Council for Scientific Technological Development (CNPq). Conflicts of interest: not reported. |
|
| Risk of bias | ||
| Bias | Authors' judgement | Support for judgement |
| Random sequence generation (selection bias) | Low risk | "Computer‐generated sequence." |
| Allocation concealment (selection bias) | Low risk | "Opaque, sequentially numbered, sealed envelopes." |
| Blinding of participants and personnel (performance bias) All outcomes | High risk | Not feasible. |
| Blinding of outcome assessment (detection bias) All outcomes | High risk | Unblinded reporting of UI self‐report outcomes because they were participant‐reported. Blinded PFM assessment. |
| Incomplete outcome data (attrition bias) All outcomes | High risk | 48.1% dropout; unclear if there was a differential between groups; no reasons; no mention of imputation for missing data. |
| Selective reporting (reporting bias) | Low risk | Outcome measures described in methods were reported in results. |
| Other bias | Unclear risk | This was reported in a conference abstract with limited information about study methods. Initial estimated sample size was 74 (37 per group). The abstract states that 42 women were recruited but Table 1 in the abstract reports data for only 41 (20 in PFMT and 21 in control group) participants. This may have affected the power of the study. |
Dinc 2009.
| Study characteristics | ||
| Methods | Design: 2‐arm (parallel groups) RCT. | |
| Participants |
Number of participants: 92 pregnant women. Setting: obstetric clinic, single centre, Istanbul, Turkey. Age: mean (SD), years: PFMT 26.0 (4.8); control 27.7 (7.2). Parity: ≥ 1 pregnancy which reached term PFMT: 37.5%; control 47.5%. Delivery: spontaneous PFMT 88%; control 95.2%. BMI: not reported. Incontinence at recruitment: 100% women in trial incontinent at recruitment. Inclusion: women 20‐34 weeks' gestation, complaints of stress/mixed UI, no genitourinary system pathology or UTI, who had at least primary school education. Exclusion: pregnancy complications, high risk for preterm labour, pain during PFMT, disease that could interfere with participation and were unable to attend for regular treatment. |
|
| Interventions |
PFMT (n = 46): trained by researcher how to do PFMT in accordance with booklet. Trained until all women were contracting the correct muscle group. Evaluated to check if performing PFMT correctly and retrained if not. Exercise session included 3 sets of exercise. Each set included contraction and relaxation of PFM, held for 10 sec, repeated 10 times. Duration of treatment not reported. Control (n = 46): usual antenatal care. |
|
| Outcomes | Measured at baseline (20‐34 weeks' gestation), intermediate evaluation (36‐38 weeks' gestation), and 6‐8 weeks' postpartum. Primary outcome: not reported. Outcomes: self‐reported leakage episodes, pad test (g, leakage), number of incontinence episodes per day, urgency and PFM strength (cm of water). |
|
| Notes | Losses to follow‐up after baseline evaluation PFMT 6/46; control 6/46 (total 13%). Losses to follow‐up by 6‐8 weeks' postpartum: PFMT 11/46; control 13/46 (total 26.1%). Funding: Research Fund of the University of Istanbul. Conflicts of interest: none declared. |
|
| Risk of bias | ||
| Bias | Authors' judgement | Support for judgement |
| Random sequence generation (selection bias) | Unclear risk | "Randomly allocated to a PFMT group or to control group using envelopes." |
| Allocation concealment (selection bias) | Unclear risk | "Randomly allocated to a PFMT group or to control group using envelopes." |
| Blinding of participants and personnel (performance bias) All outcomes | High risk | Not feasible. |
| Blinding of outcome assessment (detection bias) All outcomes | High risk | Unblinded reporting of UI self‐report outcomes because they were participant‐reported. Unclear if pad test or PFM strength blinded. |
| Incomplete outcome data (attrition bias) All outcomes | High risk | 26.1% dropout; differential loss (PFMT 23.9%; control 28.3%); reasons provided, but not for each group; no mention of imputation for missing data. |
| Selective reporting (reporting bias) | Low risk | Outcome measures described in methods were reported in results. |
| Other bias | Low risk | No other sources of bias noted. |
Dokmeci 2008.
| Study characteristics | ||
| Methods | Design: 2‐arm (parallel groups) RCT. | |
| Participants |
Number of participants: 40 women recruited from antenatal outpatient clinic. Setting: antenatal outpatient clinic, Ankara Medical Faculty, Turkey. Age: mean (SD), years: not reported. Parity: nulliparous. Delivery: not reported. BMI: not reported. Incontinence at recruitment: not reported. Inclusion: nulliparous pregnant women. Exclusion: not reported. |
|
| Interventions |
PFMT (n = 20): unspecified, no information of PFMT programme provided. Control (n = 20): unspecified. Note: assumed, but not stated, that the 40 participants were randomly allocated into 2 groups of 20. |
|
| Outcomes | Visits at weeks 12, 22 and 32 of gestation and week 6 postpartum. Primary endpoint: not reported. Primary outcome: not reported. Outcomes: lower urinary tract symptoms, sexual function and quality of life (UDI‐6, IIQ‐7, PISQ‐12), PFM activity (electromyographic biofeedback), Valsalva‐urethral rotation angle measured using perineal ultrasound. |
|
| Notes | Losses to follow‐up: PFMT 9/20; control 7/20 (total 40%). Funding: not reported. Conflicts of interest: none declared. |
|
| Risk of bias | ||
| Bias | Authors' judgement | Support for judgement |
| Random sequence generation (selection bias) | Unclear risk | "Randomised." |
| Allocation concealment (selection bias) | Unclear risk | "Randomised." |
| Blinding of participants and personnel (performance bias) All outcomes | High risk | Not feasible. |
| Blinding of outcome assessment (detection bias) All outcomes | High risk | Unblinded reporting of UI self‐report outcomes because they were participant‐reported. Unclear if ultrasound and electromyographic biofeedback blinded. |
| Incomplete outcome data (attrition bias) All outcomes | High risk | 40% dropout; similar between groups; no reasons; no mention of imputation for missing data. |
| Selective reporting (reporting bias) | High risk | Difficult to assess. Report some of the outcome measures in results, but unclear if all are reported. |
| Other bias | Unclear risk | This was reported in a conference abstract with limited information about study methods, and did not contribute any data to the forest plots. |
Dufour 2019.
| Study characteristics | ||
| Methods | Design: 2‐arm (parallel groups) RCT. | |
| Participants |
Number of participants: 23 pregnant women.
Setting: McMaster University, Hamilton, Ontario, Canada.
Age: mean (SD), years: PFMT 31.0 (2.7); control 34.0 (2.2).
Parity: primiparous, PFMT 46.2%; control 10.0%.
Delivery: vaginal or caesarean (proportions not reported).
BMI: not reported.
Incontinence at recruitment: not reported, but UDI‐6 and IIQ‐7 scores at baseline show some women in both groups have UI. Inclusion: Women in third trimester of pregnancy, attending local midwifery practices, vaginal or caesarean delivery. Exclusion: inability to understand English or direction from caregivers. |
|
| Interventions | PFMT plus iBall (n = 13): exercise schedules were not prescribed but participants were informed of the “standard established recommendation” to perform 3 sets of 10 exercises, 3‐4 times a week for the duration of the study. Additional instruction was provided on the use of the iBall at the initial assessment with an additional booster (via email) at the mid‐point of the intervention. Instructions were provided on performance of correct PFM contraction, confirmed using digital palpation by one of two expert assessors. Control (n = 10): PFMT only. exercise schedules were not prescribed but participants were informed of the “standard established recommendation” to perform 3 sets of 10 exercises, 3‐4 times a week for the duration of the study. Instructions were provided on performance of correct PFM contraction, confirmed using digital palpation by one of two expert assessors. | |
| Outcomes | Measured at baseline (6‐13 weeks postpartum) and end of treatment (after 16 weeks). Primary endpoint: after the 16 week intervention. Primary outcome: not reported. Other outcomes: feasibility and acceptability of implementing the iBall as a rehabilitation tool in support of PFMT (qualitative questionnaires), assessment of PFM (PERFECT score; see Laycock 2001), urinary symptoms and quality of life (UDI‐6, IIQ‐7). | |
| Notes | Losses to follow‐up: none. Unable to use PFM function data as logical inconsistencies in the data presentation e.g. dichotomised point estimate and mean variation. Qualitative analyses used to assess acceptability and feasibility of the iBall device. Funding: National Sciences and Engineering Research Council of Canada. iBall devices were provided by the manufacturer (ChunShuiTang Co, Changzhou, China). Conflicts of interest: none declared. | |
| Risk of bias | ||
| Bias | Authors' judgement | Support for judgement |
| Random sequence generation (selection bias) | Unclear risk | “Study was done in a 1:1 allocation ratio using random number assignments”, although not clear how random number was generated. |
| Allocation concealment (selection bias) | Unclear risk | “Allocations were placed in sealed envelopes that were opened after the initial assessment at the time of randomization.” Not clear whether envelopes were opaque or not. |
| Blinding of participants and personnel (performance bias) All outcomes | High risk | Not feasible. |
| Blinding of outcome assessment (detection bias) All outcomes | High risk | Unblinded reporting of UI self‐report outcomes because they were participant‐reported. |
| Incomplete outcome data (attrition bias) All outcomes | Low risk | Data available for all 23 participants randomised. |
| Selective reporting (reporting bias) | Low risk | Outcome measures described in methods were reported in results. |
| Other bias | Unclear risk | Unable to use data for the PERFECT score as presented in Tables 5 and 6 due to logical inconsistencies in the data. |
Dumoulin 2004.
| Study characteristics | ||
| Methods | Design: 3‐arm (parallel groups) RCT. | |
| Participants |
Number of participants: 64 postnatal women with persistent stress UI symptoms (and urodynamic stress UI) ≥ 3 months after last delivery. Setting: single‐centre, obstetrics clinic, Sainte‐Justine Hospital, Canada. Age: median (IQR), years: PFMT (1) 37 (34 to 29); PFMT (2) 36 (23 to 39); control 36 (34 to 38). Parity: median (IQR): PFMT 2 (2 to 2); PFMT (2) 2 (2 to 3); control 2 (1 to 3). Delivery: not reported. BMI: median (IQR): PFMT 22 (20 to 24); PFMT (2) 24 (23 to 26); control 24 (22 to 26). Incontinence at recruitment: all (refer to exclusion criteria). Inclusion: aged < 45 years, premenopausal, symptoms of UI once per week ≥ 3 months after last delivery, willing to participate in trial. Exclusion: UI before pregnancy, previous surgery for stress UI, neurological or psychiatric disease, major medical conditions, taking medication that would interfere with evaluation or treatment, current pregnancy, inability to understand French or English instructions, moderate‐to‐severe pelvic organ prolapse (POP‐Q stage ≥ II), postvoid residual > 50 mL, < 5 g leakage on stress test (250 mL bladder volume and 20 min pad test with 10 jumping jacks substituted for standard jumping exercises), detrusor overactivity on urodynamics. |
|
| Interventions |
PFMT 1 (n = 23): as part of multimodal PF rehabilitation and transverse abdominis muscle contraction. PFMT 2 (n = 21): as part of multimodal PF rehabilitation programme taught by physiotherapist. In addition to home PFMT this group had 15 min of electrical stimulation and 25 min of PFMT with electromyographic feedback weekly for 8 weeks. Control (n = 20): relaxation massage of back and extremities by physiotherapist, asked not to exercise PFM at home. Same number of contacts with health professional as PFMT group. Offered treatment at end of study. Note: combined PFMT groups as the intervention group for comparison with control group. |
|
| Outcomes | Measured 9 weeks after intervention began. Primary endpoint: 9 weeks. Primary outcome: modified 20 min pad test with standardised bladder volume. Secondary outcomes: perceived burden of incontinence (visual analogue scale), UDI, IIQ, PFM dynamometry. |
|
| Notes | Losses to follow‐up at 9 weeks: PFMT 1/44; control 1/20 (total 3%). Adverse events: no adverse events reported in the two PFMT groups. Funding: Canadian Institutes of Health Research and Laborie Medical Technologies Inc through a Canadian Institutes of Health Research‐Industry grant. C Dumoulin was supported by studentships from the Canadian Institutes of Health Research and from the Fonds de la Recherche en Santé du Quebec. Conflicts of interest: not reported. |
|
| Risk of bias | ||
| Bias | Authors' judgement | Support for judgement |
| Random sequence generation (selection bias) | Low risk | "Stratified randomisation was performed using a balanced block randomisation schedule generated from a table of random numbers." |
| Allocation concealment (selection bias) | Low risk | "A research investigator who was not involved in any intervention or outcome assessment informed all participants of their group allocation, which was pre‐established by the randomisation schedule." |
| Blinding of participants and personnel (performance bias) All outcomes | High risk | Not feasible. |
| Blinding of outcome assessment (detection bias) All outcomes | High risk | Unblinded reporting of UI self‐report outcomes because they were participant‐reported. "The participants were asked not to disclose their group allocation to the evaluators." Blinded pad test assessment. "A nurse‐assessor who was unaware of the treatment allocation of the participant administered the test." |
| Incomplete outcome data (attrition bias) All outcomes | Low risk | 3% dropout; similar between groups; different reasons (2 women); no mention of imputation for missing data. |
| Selective reporting (reporting bias) | Low risk | Outcome measures described in methods were reported in results. |
| Other bias | Low risk | No other sources of bias noted. |
Ewings 2005.
| Study characteristics | ||
| Methods | Design: 2‐arm (parallel groups) RCT. | |
| Participants |
Number of participants: 234 women recruited from postnatal wards. Setting: single centre, Taunton and Somerset Hospital, UK. Age: PFMT 48% aged 20‐29 years; control 45% aged 20‐29 years. Parity: primiparous, PFMT 39%; control 36%. Delivery: not reported. BMI: ≥ 26, PFMT 35%; control 39%. Incontinence at recruitment: PFMT 65%; control 62%. Inclusion: women who delivered in a 19‐week period from November 2001 to March 2002, scored ≥ 9 on the SIFCRAT or already experiencing incontinence, or both. Exclusion: stillbirth, baby at high risk (e.g. very low birthweight), mother aged < 16 years, insufficient comprehension to complete study documentation, mother or midwife requesting treatment from physiotherapist for incontinence. |
|
| Interventions |
PFMT (n = 117): taught 1‐to‐1 with physiotherapist in hospital, with invitation to attend PFMT group at 2 and 4 months after delivery. No details of PFMT programme given. Control (n = 117): usual postnatal care including verbal promotion of postnatal PFMT and leaflet explaining how to do PFMT. |
|
| Outcomes | Measured at 6 months' postpartum. Primary endpoint: 6 months' postpartum. Primary outcome: some or no problem with stress UI (dichotomised response from single question from BFLUTS). |
|
| Notes | Losses to follow‐up at 6 months: PFMT 27/117; control 17/117 (total 18.8%). Funding: National Health Service (South West) R&D Project Grant Scheme. Conflicts of interest: not reported. |
|
| Risk of bias | ||
| Bias | Authors' judgement | Support for judgement |
| Random sequence generation (selection bias) | Low risk | "Serially numbered opaque envelopes containing codes produced from computer generated pseudo‐random numbers." |
| Allocation concealment (selection bias) | Low risk | "Serially numbered opaque envelopes containing codes produced from computer generated pseudo‐random numbers." |
| Blinding of participants and personnel (performance bias) All outcomes | High risk | Not feasible. |
| Blinding of outcome assessment (detection bias) All outcomes | High risk | Unblinded reporting of UI self‐report outcomes because they were participant‐reported. |
| Incomplete outcome data (attrition bias) All outcomes | Unclear risk | 18.8% dropout; differential loss (PFMT 23.1%; control 14.5%); no reasons; no mention of imputation for missing data. |
| Selective reporting (reporting bias) | Low risk | Outcome measures described in methods were reported in results. |
| Other bias | Low risk | No other sources of bias noted. |
Fritel 2015.
| Study characteristics | ||
| Methods | Design: 2‐arm (parallel groups) RCT. | |
| Participants |
Number of participants: 282 nulliparous, pregnant women, 20‐28 weeks' gestation. Setting: 5 university teaching hospitals (Nîmes, Poissy‐Saint‐Germain, Clermont‐Ferrand, Clamart and Saint‐Denis‐de‐la‐Réunion), France. Age: mean (SD), years: PFMT 29.4 (5.1); control 29.4 (5.1). Parity: nulliparous. Delivery: PFMT 52.6% vaginal, 21.2% instrumental, 26.2% caesarean section; control 52.9% vaginal, 25.7% instrumental, 21.3% caesarean section. BMI: mean (SD): PFMT 22.3 (4.4); control 22.6 (3.6) Incontinence at recruitment: PFMT 32.9%; control 37.3%. Inclusion: nulliparous, aged ≥ 18 years, covered by health insurance, able to read French, carrying an uncomplicated singleton pregnancy, and with or without UI (including UI before pregnancy). Exclusion: previous delivery or abortion after 22 weeks' gestation, high‐risk pregnancy, any condition contraindicating further long‐distance travel, or previous PFMT < 6 months prior. |
|
| Interventions |
PFMT (n = 140): 1‐to‐1 sessions, 20‐30 min once per week, between 6th and 8th month of pregnancy (total of 8). An evaluation of PFM contraction was performed at each session through vaginal examination. PFMT supervised by 37 different therapists (physiotherapists and midwives who received an initial training course given by a physiotherapist specialising in PFM training), chosen by the woman from the list drawn up in each centre. Women were encouraged to perform daily PFM exercises at home. No specific instructions provided on the number or intensity of the contractions. However, note that abstract (Fritel and colleagues 2013) states women were given written information about UI and how to perform a series of 10 to 20 PFM contractions daily. Control (n = 142): written information on pelvic floor anatomy and PFM contraction exercises, at the time of inclusion. These instructions were also given to the PFMT group. |
|
| Outcomes | Measured at baseline (inclusion visit, 20‐28 weeks' gestation), end of pregnancy, and 2 and 12 months' postpartum. Primary endpoint: 12 months' postpartum. Primary outcome: self‐reported UI severity measured with ICIQ‐SF. Secondary outcomes: pelvic floor symptoms (Baessler Female Pelvic Floor Questionnaire, includes bladder, bowel, prolapse, sexual function scores), quality of life (Contilife, EuroQoL‐5D), clinical assessment of UI (24‐hour pad test at 2 months' postpartum), PFM strength (Laycock PFM digital palpation at 2 months' postpartum), questionnaire regarding frequency and duration of PFM contractions (end of pregnancy, 2 and 12 months' postpartum). |
|
| Notes | Losses to follow‐up at 12 months' postpartum: PFMT 47/140; control 45/142 (total 33%). Funding: French Ministry of Health. Conflicts of interest: none declared. Reported no difference between the groups in the number of medical visits since delivery. |
|
| Risk of bias | ||
| Bias | Authors' judgement | Support for judgement |
| Random sequence generation (selection bias) | Low risk | "Women were randomly assigned to a group at a 1:1 ratio. Stratification was performed according to the centre. The randomised list was generated using the Proc Plan from SAS (block of six). The block sizes were blinded for research and health professionals (information not divulged in the study protocol)." |
| Allocation concealment (selection bias) | Low risk | "The random allocation sequence was secured in sequentially numbered sealed envelopes not accessible to the obstetrician." |
| Blinding of participants and personnel (performance bias) All outcomes | High risk | Not feasible. |
| Blinding of outcome assessment (detection bias) All outcomes | High risk | Unblinded reporting of UI self‐report outcomes because they were participant‐reported. Blinded assessment of POP‐Q, PFM strength and pad test. |
| Incomplete outcome data (attrition bias) All outcomes | High risk | 33% dropout; similar between groups; no reasons; no mention of imputation for missing data (have done a non‐completers analysis). |
| Selective reporting (reporting bias) | Low risk | Outcome measures described in methods were reported in results. |
| Other bias | Low risk | No other sources of bias noted. |
Frost 2014.
| Study characteristics | ||
| Methods | Design: 2‐arm (parallel groups) RCT (with unclear randomisation methods and no mention of blinding). | |
| Participants |
Number of participants: 128 pregnant women. Setting: Queen's Medical Center, Honolulu, Hawaii. Age: not reported. Parity: primiparous. Delivery: vaginal, not reported per group. BMI: not reported. Incontinence prior to current pregnancy: not reported. Inclusion: primiparous, vaginal delivery, ≥ 18 years of age. Exclusion: not reported. |
|
| Interventions |
PFMT (n = 64): standard postpartum discharge instructions plus written and verbal instructions for PFMT. No details of PFMT programme given. Control (n = 64): standard postpartum discharge instructions which likely included education about PFMT. |
|
| Outcomes | Measured at baseline (presumably antenatal) and 6‐8 weeks' postpartum (by telephone). Primary endpoint: presumably 6‐8 weeks' postpartum. Primary outcome: not reported. Outcomes: UI, urogenital distress, quality of life. |
|
| Notes | Losses to follow‐up at 6‐8 weeks' postpartum: PFMT 33/64; control 23/64 (total 44%). Adverse events: no adverse events related to treatment were reported in the PFMT group. Funding: not reported. Conflicts of interest: not reported. |
|
| Risk of bias | ||
| Bias | Authors' judgement | Support for judgement |
| Random sequence generation (selection bias) | Unclear risk | "Randomized clinical trial." |
| Allocation concealment (selection bias) | Unclear risk | "Randomized clinical trial." |
| Blinding of participants and personnel (performance bias) All outcomes | High risk | Not feasible. |
| Blinding of outcome assessment (detection bias) All outcomes | High risk | Unblinded reporting of UI self‐report outcomes because they were participant‐reported. |
| Incomplete outcome data (attrition bias) All outcomes | High risk | 40% dropout; differential loss with nearly one‐third more from control group; no reasons; no mention of imputation for missing data. |
| Selective reporting (reporting bias) | High risk | Difficult to assess. No data reported, so failed to present a key outcome that would have been expected to have been reported. Some data also not reported (currently being analysed); "The remaining data which was collected is in the process of being analysed and may or may not have a significant impact on results." |
| Other bias | Unclear risk | Reported in a conference abstract with limited information about study methods and did not contribute data to the forest plots. |
Frumenzio 2012.
| Study characteristics | ||
| Methods | Design: 2‐arm (parallel groups) RCT. | |
| Participants |
Number of participants: 100 pregnant women. Setting: urology clinic, University Hospital, Perugia, Italy. Age: mean (SD), years: total 32.6 (5). Parity: not reported. Delivery: not reported. BMI: not reported. Incontinence prior to pregnancy: UI: PFMT 16%; control 10% (note, unclear how many women were incontinent at recruitment). Inclusion: 38‐42 weeks' gestation. Exclusion: not reported. |
|
| Interventions |
PFMT (n = 50): 8‐week programme, included 2 weekly sessions where Kegel exercises were taught (repeated daily at home for 20 min), and stretching exercises designed to correct agonist and antagonist muscle involvement. Control (n = 50): no pelvic or perineal rehabilitation. No other information provided. |
|
| Outcomes | Measured at baseline (38‐42 weeks' gestation), 3 and 6 months' postpartum. Primary endpoint: not reported. Primary outcome: not reported. Outcomes: number with UI, daily pad tests, stress tests, participant satisfaction (visual analogue scale). |
|
| Notes | Losses to follow‐up at 6 months. postpartum: PFMT 2/50; control 5/48 (total 7%). Funding: not reported. Conflicts of interest: not reported. |
|
| Risk of bias | ||
| Bias | Authors' judgement | Support for judgement |
| Random sequence generation (selection bias) | Unclear risk | "Randomised study." |
| Allocation concealment (selection bias) | Unclear risk | "Randomised study." |
| Blinding of participants and personnel (performance bias) All outcomes | High risk | Not feasible. |
| Blinding of outcome assessment (detection bias) All outcomes | High risk | Unblinded reporting of UI self‐report outcomes because they were participant‐reported. Unclear if stress test was blinded. |
| Incomplete outcome data (attrition bias) All outcomes | Unclear risk | 7% dropout; differential loss (PFMT 4%; control 10%); no reasons; no mention of imputation for missing data. |
| Selective reporting (reporting bias) | High risk | Did not report outcomes for number of daily pads or stress tests. |
| Other bias | Unclear risk | Reported in a conference abstract with limited information about study methods. |
Gaier 2010.
| Study characteristics | ||
| Methods | Design: 2‐arm (parallel groups) RCT, open‐label. | |
| Participants |
Number of participants: 127 healthy nulliparous women. Setting: 2 outpatient physiotherapy clinics in a primary care setting, Italy. Age: mean (SD), years: PFMT 25.68 (4.22); control 26.79 (3.72). Parity: 100% nulliparous. Delivery: episiotomy PFMT 3%; control 9.5%. BMI: mean (SD): PFMT 22.19 (1.19); control 21.63 (1.64). Incontinence at recruitment: none. Inclusion: nulliparous women. Exclusion: history of genitourinary or neuromuscular pathology, previous pregnancy and previous PFMT with a physiotherapist < 6 months before pregnancy. |
|
| Interventions |
PFMT (n = 65): 12‐week PFMT programme during pregnancy, supervised by a physiotherapist and a midwife. Control (n = 62): routine care and PFMT customary instruction at intake visit. |
|
| Outcomes | Measured at baseline, 12 weeks' postpartum, 6 months' postpartum. Primary endpoint: not reported. Primary outcomes: occurrence of traumatic tears and use of episiotomy. Secondary outcomes: PFM strength, PFM dysfunction (UI, FI and pelvic pain). |
|
| Notes | Dropouts after 1st assessment: PFMT 5/65; control 7/62 (total 9.4%). Unclear if any further dropouts following this time‐point. Funding: not reported. Conflicts of interest: not reported. |
|
| Risk of bias | ||
| Bias | Authors' judgement | Support for judgement |
| Random sequence generation (selection bias) | Unclear risk | "Open‐label randomised clinical trial." |
| Allocation concealment (selection bias) | Unclear risk | "Open‐label randomised clinical trial." |
| Blinding of participants and personnel (performance bias) All outcomes | High risk | Not feasible. |
| Blinding of outcome assessment (detection bias) All outcomes | High risk | Measure of UI and FI not reported. Presumably self‐reported as no indication of objective measure such as cough test. |
| Incomplete outcome data (attrition bias) All outcomes | Low risk | 9.4% dropout; similar between groups; reasons provided, but not for each group; no mention of imputation for missing data. |
| Selective reporting (reporting bias) | High risk | Did not report outcomes relating to FI and pelvic pain. |
| Other bias | Unclear risk | Reported in a conference abstract with limited information about study methods and few data. |
Glazener 2001.
| Study characteristics | ||
| Methods | Design: 2‐arm (parallel groups) RCT. | |
| Participants |
Number of participants: 747 women with symptoms of UI at 3 months' postpartum. Setting: 3 centres (Dunedin, Aberdeen, Birmingham) in 2 countries (New Zealand and UK). Age: mean (SD), years: PFMT 30 (5); control 29 (5). Parity: primiparous, PFMT 36%; control 37%. Delivery: PFMT 78.3% vaginal, 13.7% assisted, 8% caesarean; control 78.6% vaginal, 13.8% assisted, 7.6% caesarean. BMI: not reported. Incontinence at recruitment: all. Inclusion: women with any UI in the preceding month. Exclusion: stillbirth, neonatal death. |
|
| Interventions |
PFMT (n = 371): home visit from nurse, health visitor or continence advisor at 5, 7 and 9 months for instruction and supervision of PFMT. Also education on PF anatomy. Frequency and urgency strategies were added at 2nd or 3rd visits if appropriate. Referral to primary care physician for women whose symptoms were not typical of stress, urgency or mixed UI, or had evidence of UTI. Control (n = 376): usual postnatal care that may have included advice on PFMT. |
|
| Outcomes | Measured at 12 months' postpartum and 6 years after index delivery. Primary endpoint: 12 months' postpartum. Primary outcome: self‐reported UI. Secondary outcomes: severity of incontinence (visual analogue scale), FI, use and frequency of PFMT, use of pads, general well‐being, Hospital Anxiety and Depression scale. |
|
| Notes | Losses to follow‐up at 12 months: PFMT 92/371; control 131/376 (total 29.9%). Losses to follow‐up at 6 years: PFMT 108/371; control 123/376 (total 30.9%). Funding: Wellbeing (grant sponsored by GlaxoWellcome) and Health Research Council of New Zealand. Conflicts of interest: none declared. |
|
| Risk of bias | ||
| Bias | Authors' judgement | Support for judgement |
| Random sequence generation (selection bias) | Low risk | "Randomisation was achieved with remote access to a computer programme in Dunedin. It registered each woman before presenting the allocation by using stratification by parity (four versus fewer), method of delivery (caesarean versus other) and frequency of incontinence (at least once per week versus less)." |
| Allocation concealment (selection bias) | Unclear risk | Not reported. |
| Blinding of participants and personnel (performance bias) All outcomes | High risk | Not feasible. "Intervention could not be performed blind." |
| Blinding of outcome assessment (detection bias) All outcomes | High risk | Unblinded reporting of UI self‐report outcomes because they were participant‐reported. "Collection of outcome data were by anonymised questionnaire which was identified by a study number and which could not be related back to trial allocation at time of data entry." |
| Incomplete outcome data (attrition bias) All outcomes | High risk | 29.9% dropout; differential loss (PFMT 24.8%; control 34.8%; "differential loss to follow up confined to participants in one centre [Birmingham]"); few reasons provided ("women who did not respond at follow up were more likely to have had severe incontinence at baseline"); the impact of differential loss to follow‐up was explored with analyses stratified by centre. |
| Selective reporting (reporting bias) | Low risk | Outcome measures described in methods were reported in results. |
| Other bias | Low risk | No other sources of bias noted. |
Gorbea 2004.
| Study characteristics | ||
| Methods | Design: 2‐arm (parallel groups) RCT. | |
| Participants |
Number of participants: 75 pregnant nulliparous women. Setting: single‐centre, Mexico. Age: mean (SD), years: PFMT 26 (6); 24 (7). Parity: mean (SD): PFMT 1.4 (0.8); control 1.4 (0.7). Delivery: PFMT 42.1% vaginal, 57.9% caesarean; control 64.7% vaginal, 35.3% caesarean. Weight at 35 weeks' gestation: mean (SD), kg: PFMT 66 (7); control 66 (13). Incontinence at recruitment: none (see inclusion criteria). Inclusion: aged 15‐35 years without stress UI at 20 weeks' gestation. Exclusion: multiple pregnancy, ≥ 2 caesarean births, oligohydramnios or polyhydramnios, cervical incompetence, maternal‐fetal iso‐immunisation, severe pregnancy‐induced hypertension, chronic degenerative conditions affecting pelvic floor function such as diabetes mellitus and multiple sclerosis. |
|
| Interventions |
PFMT (n = 38): taught by physiotherapist. 8 × 1‐hour visits over 8 weeks, then weekly telephone calls. Also received information about anatomy and physiology of lower urinary tract, and biofeedback from surface electromyography electrodes (either side of anus) at clinic visits. Control (n = 34): requested not to perform PFMT during pregnancy or postpartum. |
|
| Outcomes | Measured at 28 and 35 weeks' gestation, and 6 weeks' postpartum. Primary endpoint: 6 weeks' postpartum. Primary outcome: self‐reported UI. Secondary outcomes: frequency and severity of UI, cough test, PFM activity (electromyography). |
|
| Notes | Losses to follow‐up: 3/75 (total 4%); data not available by group. Funding: not reported. Conflicts of interest: not reported. |
|
| Risk of bias | ||
| Bias | Authors' judgement | Support for judgement |
| Random sequence generation (selection bias) | Low risk | Participants names in sealed envelopes and assigned random numbers to divide them into 2 groups randomly. |
| Allocation concealment (selection bias) | Low risk | The sealed envelopes were held by the secretary who did not have any relationship to the study; she opened them and assigned the women to each group. |
| Blinding of participants and personnel (performance bias) All outcomes | High risk | Not feasible. |
| Blinding of outcome assessment (detection bias) All outcomes | High risk | Unblinded reporting of UI self‐report outcomes because they were participant‐reported. Unclear if cough test and electromyography were blinded. |
| Incomplete outcome data (attrition bias) All outcomes | Low risk | 4% dropout; unclear if similar between groups; no reasons provided; no mention of imputation for missing data. |
| Selective reporting (reporting bias) | Low risk | Outcome measures described in methods were reported in results. |
| Other bias | Unclear risk | Significant difference between groups with respect to weight gain during pregnancy (greater in the PFMT group) and self‐reported UI at 28 weeks' gestation (more prevalent in the PFMT group). |
Hilde 2013.
| Study characteristics | ||
| Methods | Design: 2‐arm (parallel groups) RCT. | |
| Participants |
Number of participants: 175 singleton primiparous women. Setting: Akershus University Hospital, Norway. Age: mean (SD), years: PFMT 29.5 (4.3); control 30.1 (4.0). Parity: primiparous. Delivery: all vaginal; 20% instrumental in total. BMI: mean (SD): PFMT 26.0 (4.1); control 25.3 (3.9). Incontinence at recruitment: PFMT 39.1%; control 50%. Inclusion: singleton primiparous women who delivered vaginally after 32 weeks' gestation and able to speak and understand Scandinavian languages. Instrumental deliveries was noted as an inclusion in a secondary report (Bø and colleagues 2015; see Hilde 2013). Exclusion: prior abortion or stillbirth after gestational week 16; serious illness to mother or neonate; or perineal tearing graded as 3b, 3c or 4. Caesarean section noted as an exclusion criterion in secondary reports (Bø and colleagues 2013; Bø and colleagues 2015; see Hilde 2013), as were intrauterine fetal deaths/stillbirths (Bø and colleagues 2015; see Hilde 2013). |
|
| Interventions |
PFMT (n = 87): supervised exercise class (once per week) led by an experienced physiotherapist, that included progressive PFMT programme (Bø 1990; Mørkved 1997), 16 weeks' duration. Women received individual instructions in how to perform a correct PFM contraction (including vaginal palpation and feedback). Also asked to perform daily PFMT at home (3 sets of 8‐12 contractions close to maximal contraction). All women were provided customary written information on discharge from postnatal ward and an exercise diary. Control (n = 88): individual instructions in how to perform a correct PFM contraction (including vaginal palpation and feedback) and a written leaflet containing information about PFMT and encouragement to perform these regularly. No further intervention provided. |
|
| Outcomes | Measured at 6 weeks' postpartum (baseline), and 6 months' postpartum. Primary endpoint: 6 months' postpartum. Primary outcome: self‐reported UI. Secondary outcomes: positive pad test (2 g); vaginal resting pressure, PFM strength and endurance (manometry). Stage of pelvic organ prolapse, bladder neck position and symptoms of pelvic organ prolapse (ICIQ‐vag) were outcomes included the secondary analysis (Bø and colleagues 2015; see Hilde 2013). |
|
| Notes | Losses to follow‐up at 6 months' postpartum: PFMT 12/87; control 3/88 (total 8.6%). Adverse events: no adverse events reported from women in the PFMT group. Funding: Research Council of Norway. Conflicts of interest: none declared. |
|
| Risk of bias | ||
| Bias | Authors' judgement | Support for judgement |
| Random sequence generation (selection bias) | Low risk | "The participants were stratified on major levator ani muscle defects being present or not at the very end of the baseline assessment and thereafter randomised into two groups (training or control) in blocks of 10. The randomisation sequence was computer‐generated and concealed." |
| Allocation concealment (selection bias) | Low risk | "Allocation of participants was administered outside the clinical room by a project midwife keeping the outcome assessors blinded for group allocation." |
| Blinding of participants and personnel (performance bias) All outcomes | High risk | Not feasible. |
| Blinding of outcome assessment (detection bias) All outcomes | High risk | Unblinded reporting of UI self‐report outcomes because they were participant‐reported. All other outcomes blinded. |
| Incomplete outcome data (attrition bias) All outcomes | Low risk | 8.6% dropout; differential loss (PFMT 13.8%; control 3.4%); no reasons; imputation for missing data (missing values for continuous data were imputed by using the baseline value plus added change observed in the corresponding control group. For self‐reported UI, last observation carried forward was used). |
| Selective reporting (reporting bias) | Low risk | Outcome measures described in methods were reported in results. |
| Other bias | Low risk | No other sources of bias noted. |
Hughes 2001.
| Study characteristics | ||
| Methods | Design: 2‐arm (parallel groups) RCT. | |
| Participants |
Number of participants: 1169 pregnant nulliparous women. Setting: single centre, UK. Age: median (IQR), years: PFMT 28 (24‐31); control 28 years (25‐31). Parity: all nulliparous. Delivery: PFMT 52.5% vaginal, 26.9% instrumental, 20.6% caesarean; control 54.8% vaginal, 23.5% instrumental, 21.7% caesarean. BMI: median (IQR): PFMT 23.2 (21.2‐26.3); control 23.5 (21.6‐25.7). Incontinence prior to pregnancy: PFMT 1.5%; control 1.4%. Incontinenceby 20 weeks: PFMT 22%; control 30%. Inclusion: pregnant nulliparous women at 20 weeks' gestation. Exclusion: diabetes, neurological conditions, previous bladder surgery or investigations. |
|
| Interventions |
PFMT (n = 586): 1 individual appointment with a physiotherapist that included tuition in use of perineometer, information on anatomy/physiology, and vaginal palpation of voluntary PFM contraction, and 1 PFMT group session (maximum 6 women) with senior obstetric physiotherapist between 22 and 25 weeks. Written instructions for antenatal and postnatal daily home PFMT. No details of PFMT programme given. Control (n = 583): routine community antenatal care, including usual information about PFMT. |
|
| Outcomes | Measured at 6 weeks, and 3 and 6 months' postpartum. Primary endpoint: 6 months' postpartum. Primary outcome: not reported. Outcomes: BFLUTS, additional questions about bowel function. |
|
| Notes | Losses to follow‐up at 6 weeks' postpartum: PFMT 238/586; control 217/583 (total 38.9%). Losses to follow‐up at 3 months' postpartum: PFMT 178/586; control 139/583 (total 27.2%). Losses to follow‐up at 6 months' postpartum: PFMT 203/586; control 189/583 (total 33.5%). Funding: not reported. Conflicts of interest: not reported. |
|
| Risk of bias | ||
| Bias | Authors' judgement | Support for judgement |
| Random sequence generation (selection bias) | Low risk | "Randomised using computer generated numbers." |
| Allocation concealment (selection bias) | Unclear risk | Not reported. |
| Blinding of participants and personnel (performance bias) All outcomes | High risk | Not feasible. |
| Blinding of outcome assessment (detection bias) All outcomes | High risk | Unblinded reporting of UI self‐report outcomes because they were participant‐reported. Not reported if perineometry was blinded. |
| Incomplete outcome data (attrition bias) All outcomes | High risk | 33.5% dropout; similar between groups; no reasons; no mention of imputation for missing data. |
| Selective reporting (reporting bias) | Low risk | Outcome measures described in methods were reported in results, and additional data were supplied by authors, from a thesis (as trial was reported as an abstract). |
| Other bias | Unclear risk | Reported in a conference abstract with limited information about study methods. |
Hyakutake 2018.
| Study characteristics | ||
| Methods | Design: 2‐arm (parallel groups) RCT. | |
| Participants |
Number of participants: 100 primiparous women.
Setting: St Paul’s Hospital, Vancouver, BC, Canada.
Age: mean (SD), years: PFMT 33.2 (3.6); Control 32.9 (3.4).
Parity: nulliparous.
Delivery: PFMT 40.6% spontaneous vaginal, 29.7% instrumental, 29.7% caesarean; control 40.6% spontaneous vaginal, 18.9% instrumental, 32.4% caesarean, 8.1% unknown.
BMI: not reported.
Incontinence at recruitment: not reported. Inclusion: nulliparous women > 20 years, with singleton gestation and proficiency in English. Exclusion: not stated. |
|
| Interventions | PFMT (n = 50): a single pelvic floor health workshop, 2‐hour duration, led by a physician. Contacted authors who provided additional information: women were educated on the benefits of PFMT, how to increase awareness of their perineum and perform PFM exercises, provided with a pack to take home, and encouraged to contact a local PF physiotherapist (list provided in pack). Women were instructed to perform PFMT three times daily at home starting with 5 contractions (1 sec hold) progressing to 10 contractions (10 sec hold), for the rest of their lives. Possible additions such as vaginal cones or weights and the use of an app were suggested. No PF examination performed. Control (n = 50): Routine pre‐natal care with existing maternity care provider (midwife, family physician, or obstetrician). Not specifically stated but likely to have received advice on PFMT. | |
| Outcomes | Measured at baseline (at earliest convenience prior to delivery) and 6 weeks postpartum. Primary endpoint: 6 weeks postpartum. Primary outcome: difference in pelvic floor health knowledge questionnaire. Other outcomes: PFMT‐specific questionnaire, parturition satisfaction questionnaire, PFDI‐20, PFIQ‐7. | |
| Notes | Losses to follow‐up: PFMT 13/50; control 13/50 (total 26 %). Funding: Canadian Foundation for Women’s Health and a Summer Student Research program grant from the University of British Columbia. Conflicts of interest: none declared. | |
| Risk of bias | ||
| Bias | Authors' judgement | Support for judgement |
| Random sequence generation (selection bias) | Low risk | “The randomised sequence was generated by a statistician using a randomization program. Random‐sized permuted blocks of four and six with equal allocations to treatment were generated”. |
| Allocation concealment (selection bias) | Low risk | “Sequentially numbered envelopes containing the allocations were used”. |
| Blinding of participants and personnel (performance bias) All outcomes | High risk | Not feasible. |
| Blinding of outcome assessment (detection bias) All outcomes | High risk | Unblinded reporting of UI self‐report outcomes because they were participant‐reported. |
| Incomplete outcome data (attrition bias) All outcomes | High risk | 26% dropout; similar between groups; reasons provided for PFMT but not control group; no mention of imputation for missing data. |
| Selective reporting (reporting bias) | Low risk | Outcome measures described in methods were reported in results. |
| Other bias | Low risk | No other sources of bias noted. |
Kim 2012.
| Study characteristics | ||
| Methods | Design: 2‐arm (parallel groups) RCT. | |
| Participants |
Number of participants: 20 women with UI symptoms, < 6 weeks' postpartum. Setting: Dong‐gu, Daejeon, Republic of Korea. Age: mean (SD), years: PFMT 31.4 (2.8); control 32.0 (2.6). Parity: mean (SD), number: PFMT 1.4 (0.5); control 1.6 (0.5). Delivery: normal vaginal. BMI: mean (SD): PFMT 23.6 (1.8); control 24.6 (1.8). Incontinence at recruitment: all. Inclusion: UI after childbirth, as diagnosed by an urogynaecologist, < 6 weeks after normal vaginal delivery. Exclusion: genitourinary disease or infection, treatment administered for UI, obstetrical operation history. |
|
| Interventions |
PFMT (n = 10): utilising trunk stabilisation (Koumantakis 2005), as part of a group session (3 times per week, 60 min) led by a specialist physiotherapist, over 8 weeks (23 in total). At the 1st session, the physiotherapist provided participants in both groups with information on basic anatomy and PFM function to facilitate a voluntary PFM contraction. Perineometry used to assist awareness and control of PFM contractions (but unclear if this was part of every session). Participants were instructed to perform the PFMT programme daily at home, and were provided with a home exercise training booklet and an exercise diary. Control (n = 10): women received the same information and demonstration session as described above for those in the supervised group sessions. They then followed the same PFMT programme, performing the same daily home exercises by themselves for an 8‐week period without physiotherapist supervision. |
|
| Outcomes | Measured at baseline (< 6 weeks' postpartum) and at 8 weeks' post‐treatment. Primary endpoint: 8 weeks' post‐treatment. Primary outcome: BFLUTS ‐ quality of life domain. Secondary outcomes: BFLUTS ‐ urinary symptoms domain; PFM strength (blinded perineometry, maximal vaginal squeeze pressure and holding time, mean of 3 trials). |
|
| Notes | Losses to follow‐up at 8 weeks postpartum: PFMT 1/10; control 1/10 (total 10%). These 2 participants were excluded from the data analysis due to "irregular participation in intervention sessions". Funding: no specific grants received from any funding agency. Conflicts of interest: not reported. |
|
| Risk of bias | ||
| Bias | Authors' judgement | Support for judgement |
| Random sequence generation (selection bias) | High risk | "An envelope with two cards was provided to each subject, and on each occasion, they simply drew out just one card without looking at the other." |
| Allocation concealment (selection bias) | High risk | "An envelope with two cards was provided to each subject, and on each occasion, they simply drew out just one card without looking at the other." |
| Blinding of participants and personnel (performance bias) All outcomes | High risk | Not feasible. |
| Blinding of outcome assessment (detection bias) All outcomes | High risk | Unblinded reporting of UI self‐report outcomes because they were participant‐reported. Perineometry was blinded. |
| Incomplete outcome data (attrition bias) All outcomes | Low risk | 10% dropout; similar between groups (numbers and reasons); no mention of imputation for missing data. |
| Selective reporting (reporting bias) | Low risk | Outcome measures described in methods were reported in results. |
| Other bias | Low risk | No other sources of bias noted. |
Ko 2011.
| Study characteristics | ||
| Methods | Design: 2‐arm (parallel groups) RCT. | |
| Participants |
Number of participants: 300 nulliparous women at 16‐24 weeks' gestation. Setting: obstetrics clinic at a university hospital, single centre, China. Age: mean, years: PFMT 32; control 31. Parity: all nulliparous. Delivery: PFMT 68% vaginal and of these 6% were instrumental, 32% caesarean; control 71% vaginal and of these 7% were instrumental, 29% caesarean. BMI prior to pregnancy: mean (SD): PFMT 21.78 (4.10); control 22.18 (3.38). Incontinence at recruitment: PFMT 27%; control 30%. Inclusion: nulliparous women at 16‐24 weeks' gestation. Exclusion: multiparity, multiple gestations, severe pregnancy complications, high risk for preterm labour, pain during PFMT, women with diseases that could interfere with participation or women who would be unavailable for follow‐up. Women who performed PFMT before entry to the trial were also excluded. |
|
| Interventions |
PFMT (n = 150): group training (once per week, 45 min, approximately 10 women per group) with a physiotherapist for 12 weeks. Women individually instructed by a physiotherapist about pelvic floor anatomy and how to contract the PFM correctly before exercise. PFMT twice daily at home with exercise diaries to monitor compliance. Control (n = 150): received regular antenatal care and the customary written postpartum instructions that did not include PFMT from the hospital. |
|
| Outcomes | Measured at baseline (16‐24 weeks' gestation), 36 weeks' gestation, and 3 days', 6 weeks' and 6 months' postpartum. Primary outcome: self‐reported UI (unclear which of the questionnaires were used to derive these data). Secondary outcomes: IIQ‐7, UDI‐6, questions about frequency of urination (daily) and UI. |
|
| Notes | Losses to follow‐up: none. Funding: Medical Research Project, Chang Gung Memorial Hospital, Taiwan. Conflicts of interest: none declared. |
|
| Risk of bias | ||
| Bias | Authors' judgement | Support for judgement |
| Random sequence generation (selection bias) | Unclear risk | "Randomly allocated." |
| Allocation concealment (selection bias) | Unclear risk | "Randomisation was achieved by selection of sealed envelopes, which were opened at entry." |
| Blinding of participants and personnel (performance bias) All outcomes | High risk | Not feasible. |
| Blinding of outcome assessment (detection bias) All outcomes | High risk | Unblinded reporting of UI self‐report outcomes because they were participant‐reported (in an interview setting). |
| Incomplete outcome data (attrition bias) All outcomes | Low risk | Data available for all 300 participants randomised. |
| Selective reporting (reporting bias) | Low risk | Outcome measures described in methods were reported in results. |
| Other bias | Low risk | No other sources of bias noted. |
Kocaoz 2013.
| Study characteristics | ||
| Methods | Design: 2‐arm (parallel groups), quasi‐randomised (alternation) trial. | |
| Participants |
Number of participants: 136 pregnant, continent women. Setting: antenatal outpatient clinics of a women's maternity training and research hospital in Ankara, Turkey. Age: mean (SD), years: PFMT 26.3 (4.8); control 25.7 (4.4). Parity: not reported. Delivery: not reported. BMI prior to pregnancy: < 20, 16.7%; 20‐24.9: 52.9%; 25‐29.9, 22.6%; 30‐39, 7.8%. Incontinence at recruitment: none. Based on negative 1‐hour pad test, urinary diary and self‐report. Inclusion: able to attend pregnancy outpatient visits regularly, 14‐20 weeks' gestation during 1st attendance, aged 20‐35 years, completed at least elementary school, no UI complaints or UTI, BMI < 40, and no chronic disease (such as asthma) or genitourinary pathology (such as pelvic organ prolapse) requiring treatment. Exclusion: not reported. |
|
| Interventions |
PFMT (n = 68): home exercise programme during pregnancy and postpartum, 3 sets of 10 exercises, 3 times per day. Women received education about functions of the PFM and PFMT, including the effect of pregnancy and vaginal delivery on incontinence, were taught the PFM exercises, and asked to observe the inward contraction of the perineum during contractions (frequency uncertain). Women completed an exercise diary, were phoned once per month to encourage adherence, and exercise compliance was checked at every hospital visit (9‐10 visits on average). Control (n = 68): not instructed to do PFMT. Once data collection complete, controls received PFMT and a brochure during the 12th week home visit. |
|
| Outcomes | Measured at baseline (unclear but possibly at 14‐20 weeks' gestation), 28 weeks' gestation, 32 weeks' gestation, 12 weeks' postpartum. Primary endpoint: 12 weeks' postpartum. Primary outcome: 1‐hour pad test. Secondary outcome: urinary diary. |
|
| Notes | Losses to follow‐up at 14‐20 weeks' gestation: PFMT 12/68; control 8/68 (total 14.7%). Losses to follow‐up at 28 weeks' gestation: PFMT 16/68; control 14/68 (total 22.1%). Losses to follow‐up at 32 weeks' gestation: PFMT 16/68; control 18/68 (total 25%). Losses to follow‐up at 12 weeks' postpartum: PFMT 16/68; control 18/68 (total 25%). Funding: not reported. Conflicts of interest: not reported. |
|
| Risk of bias | ||
| Bias | Authors' judgement | Support for judgement |
| Random sequence generation (selection bias) | High risk | "The pregnant women who were examined on odd days and even days were assigned to the intervention group and control group, respectively." |
| Allocation concealment (selection bias) | High risk | "The pregnant women who were examined on odd days and even days were assigned to the intervention group and control group, respectively." |
| Blinding of participants and personnel (performance bias) All outcomes | High risk | "The women were not informed as to which group they were in. The investigators were not blinded." |
| Blinding of outcome assessment (detection bias) All outcomes | High risk | Unblinded reporting of UI self‐report outcomes because they were participant‐reported (urinary diary). Pad test not blinded. |
| Incomplete outcome data (attrition bias) All outcomes | High risk | 25% dropout; similar between groups (numbers and reasons); no mention of imputation for missing data. |
| Selective reporting (reporting bias) | High risk | Study did not report the primary outcome of the review (i.e. self‐reported UI). Other outcome measures described in methods were reported in results. |
| Other bias | Low risk | No other sources of bias noted. |
Kou 2013.
| Study characteristics | ||
| Methods | Design: 2‐arm (parallel groups) RCT. | |
| Participants |
Number of participants: 150 women, 6 weeks' postpartum. Setting: People's Hospital of Kenli County, China. Age: years: 23‐35. Parity: not reported. Delivery: not reported. BMI: not reported. Incontinence at recruitment: not reported, but women not recruited because of UI. Inclusion: women 6 weeks' postpartum, full‐term pregnancy, free of lochia with good healing following caesarean section or episiotomy. Exclusion: pace‐maker. |
|
| Interventions |
PFMT (n = 80): combined with biofeedback. Biofeedback was used twice per week and PFMT (Kegel exercises) were undertaken 2‐3 times per day for 20‐30 min or 150‐200 contractions (3 sec hold then relax), performed until women were 12 months' postpartum. Not specified if a correct PFM contraction was confirmed, who supervised the programme, or the number and type of contacts with health professional(s). Control (n = 70): standard postpartum information. |
|
| Outcomes | Measured at baseline (6 weeks' postpartum), and 3, 6 and 12 months' postpartum. Primary endpoint: 12 months' postpartum. Primary outcome: self‐reported UI. Other outcomes: PFM tension and intensity (cm of water), PFM contraction time (sec), POP‐Q. |
|
| Notes | Losses to follow‐up not reported. Funding: not reported in translation. Conflicts of interest: not reported in translation. |
|
| Risk of bias | ||
| Bias | Authors' judgement | Support for judgement |
| Random sequence generation (selection bias) | Unclear risk | "Randomized into two groups." |
| Allocation concealment (selection bias) | Unclear risk | "Randomized into two groups." |
| Blinding of participants and personnel (performance bias) All outcomes | High risk | Not feasible. |
| Blinding of outcome assessment (detection bias) All outcomes | High risk | Not possible for outcome (number with UI) but unclear if self‐report. Not reported if PFM tension and intensity, contraction time and POP‐Q blinded. |
| Incomplete outcome data (attrition bias) All outcomes | Unclear risk | Data not reported. |
| Selective reporting (reporting bias) | Low risk | Outcome measures described in methods were reported in results. |
| Other bias | Unclear risk | Information from this study was obtained from a Chinese publication and it is possible some information was lost in translation. |
Liu 2011.
| Study characteristics | ||
| Methods | Design: 2‐arm (parallel groups) RCT. | |
| Participants |
Number of participants: 192 primiparous postpartum women. Setting: Yeyang Maternity and Child Health Care, China. Age: mean (SD), years: PFMT 26.2 (4.1); control 26.4 (4.5). Parity: primiparous. Delivery: all spontaneous vaginal. BMI: not reported. Incontinence at recruitment: not reported. Inclusion: primiparous, cephalic presentation of baby, natural vaginal delivery at full term. Exclusion: multiparous women, multiple births, genitourinary surgery prior to or during pregnancy, oversized newborn, neuromuscular disease, caesarean section or vaginal surgery. |
|
| Interventions |
PFMT (n = 106): 2‐3 times per day, 15‐30 min each set, started after birth and continued for ≥ 10 weeks. Exercises taught by experienced midwives who also supervised the programme (number and type of contacts/visits unclear). Not specified if a correct PFM contraction was confirmed. Control (n = 86): standard postpartum information. Unclear if this included PFMT. |
|
| Outcomes | Measured at 3, 6 and 12 months' postpartum. Primary endpoint: 12 months' postpartum. Primary outcome: "Urinary condition score." Other outcomes: PFM tension and intensity (Oxford score), pad test. |
|
| Notes | Losses to follow‐up not reported. If 1:1 randomisation, differential noted in numbers in intervention compared to control group (approximately 20%). Funding: not reported in translation. Conflicts of interest: not reported in translation. |
|
| Risk of bias | ||
| Bias | Authors' judgement | Support for judgement |
| Random sequence generation (selection bias) | Unclear risk | "Randomised into two groups." |
| Allocation concealment (selection bias) | Unclear risk | "Randomised into two groups." |
| Blinding of participants and personnel (performance bias) All outcomes | High risk | Not feasible. |
| Blinding of outcome assessment (detection bias) All outcomes | High risk | Not possible for outcome (number with UI) but unclear if self‐report. Not reported if pad test, and PFM tension and intensity blinded. |
| Incomplete outcome data (attrition bias) All outcomes | Unclear risk | Data not reported. |
| Selective reporting (reporting bias) | Low risk | Outcome measures described in methods were reported in results. |
| Other bias | Unclear risk | Information from this study was obtained from a Chinese publication and it is possible some information was lost in translation. This study did not contribute any data to the forest plots but did provide information on symptom severity. |
Meyer 2001.
| Study characteristics | ||
| Methods | Design: 2‐arm (parallel groups) RCT. | |
| Participants |
Number of participants: 107 pregnant nulliparous women (unclear if this was number recruited or number analysed). Setting: multiple clinics in single centre, Switzerland. Age: mean (SD), years: 29 (4). Not reported by group. Parity: all nulliparous. Delivery: PFMT 30% instrumental; control 16% instrumental. BMI: mean (SD): not reported. Incontinence at recruitment: PFMT 28%; control 32%. Inclusion: pregnant nulliparous women at 12‐39 weeks' gestation at enrolment. Exclusion: pregnancy complications (twin gestation, diabetes, preterm labour, haemorrhage from low‐lying placenta), women beginning labour, history of UTIs. |
|
| Interventions |
PFMT (n = 51): as part of a PFM rehabilitation programme, taught by a physiotherapist over 6 weeks (12 sessions). Begun at 2 months and ended before 10 months' postpartum. No details of PFMT programme given, but PFMT in clinic was followed by 20 min of biofeedback and 15 min of electrical stimulation. Control (n = 56): no postpartum PFM rehabilitation programme. Received PFMT education at 10 months' postpartum. |
|
| Outcomes | Measured at 10 months' postpartum. Primary endpoint: 10 months' postpartum. Primary outcome: not reported. Outcome measures: self‐reported UI or FI, sexual response, vaginal digital PFM palpation (graded 0‐5), ultrasonography (bladder volume, bladder neck position at rest, on Valsalva, and with voluntary PFM contraction, supine and standing), urodynamics (functional urethral length, maximal urethral closure pressure at stress (cm of water), area of continence at stress, mean value of pressure transmission ratio in central third of functional urethral length), vaginal and anal squeeze pressure. |
|
| Notes | No losses to follow‐up. Funding: Swiss National Fund for Scientific Research. Conflicts of interest: not reported. |
|
| Risk of bias | ||
| Bias | Authors' judgement | Support for judgement |
| Random sequence generation (selection bias) | Unclear risk | "Assigned" in full publication; "randomly assigned" in abstract. |
| Allocation concealment (selection bias) | Unclear risk | Not reported. |
| Blinding of participants and personnel (performance bias) All outcomes | High risk | Not feasible. |
| Blinding of outcome assessment (detection bias) All outcomes | High risk | Unblinded reporting of UI and FI self‐report outcomes because they were participant‐reported. Not reported if other measures were blinded. |
| Incomplete outcome data (attrition bias) All outcomes | Low risk | Data available for all 107 participants randomised. |
| Selective reporting (reporting bias) | Low risk | Outcome measures described in methods were reported in results. |
| Other bias | Low risk | No other sources of bias noted. |
Miquelutti 2013.
| Study characteristics | ||
| Methods | Design: 2‐arm (parallel groups) RCT. | |
| Participants |
Number of participants: 205 nulliparous women. Setting: Women's Integral Health Care Hospital, University of Campinas and 4 municipal primary healthcare centres in Campinas, São Paulo, Brazil. Age: mean (SD), years: PFMT 22.9 (4.6); control 22.9 (5.1). Parity: nulliparous. Delivery: PFMT 57.9% vaginal; control 53.5% vaginal. Significant difference in length of delivery (longer in PFMT group). BMI: mean (SD): PFMT 25.4 (5.0); control 25.2 (5.3). Incontinence at recruitment: UI PFMT 50.4%; control 52.0%. Inclusion: pregnant women with a single fetus, aged 16‐40 years, and gestational age of 18‐24 weeks. Exclusion: pathological conditions prior to pregnancy (heart conditions, diabetes, hypertension, bronchitis, asthma, HIV positive), pathological conditions of the pregnancy (gestational hypertension, gestational diabetes and pre‐eclampsia), contraindications to the practice of physical activity (persistent bleeding, preterm labour, incompetent cervix, acute febrile infection and fetal growth restriction) or indication for elective caesarean (placenta previa, cephalopelvic disproportion). |
|
| Interventions |
PFMT (n = 103): either in groups or on an individual basis (50 min, median 5 (range 2‐10)) depending on the number of women present, supervised by a physiotherapist between 18‐24 weeks' and 36‐38 weeks' gestation. PFMT was additional to the routine activities offered at the antenatal clinic (but held on the same days as these antenatal visits). Each session included non‐aerobic exercises designed to reduce back pain, help venous return, prevent UI and minimise anxiety. Women also received standard antenatal education, and were instructed to perform daily PFMT at home as well as ≥ 30 min of aerobic exercise daily. Instructions were provided on performance of correct PFM contraction, but this was not evaluated (due to the pragmatic nature of the study). Women were given an exercise guide (PFMT and general stretching) and asked to complete an exercise diary. Control (n = 102): usual care. Women participated in routine antenatal educational activities and received standard postnatal care and education from trained physiotherapy, nursing and medical staff (on the maternity ward). |
|
| Outcomes | Measured at baseline (18‐24 weeks' gestation), 28‐30 weeks' gestation, and 36‐38 weeks' gestation. Primary endpoint: 36‐38 weeks' gestation. Primary outcome: not reported. Outcomes: State‐Trait Anxiety Inventory, Pregnancy Physical Activity Questionnaire, self‐reported UI, lumbar pain as indicated on a body chart and quantified with a visual analogue scale, neonatal well‐being (Apgar scores in 1st and 5th min and perinatal scores from medical records). |
|
| Notes | Exclusions post‐randomisation: PFMT 6/103; control 2/102 (3.9%). Discontinuation at 28‐30 weeks' gestation: PFMT 3/103; control 1/102 (2%). Discontinuation after delivery: PFMT 19/103; control 29/103 (23.4%); need to check these numbers as flow‐chart appears to be incorrect in paper (Figure 1 of paper). Data on losses to follow‐up (reported on CONSORT flowchart, text and tables) were incongruent. Adverse events: no adverse events associated with exercise were reported. Funding: Foundation for the support of research Sao Paulo and the Co‐ordination for the Improvement of Higher Education Personnel (CAPES). Conflicts of interest: none declared. |
|
| Risk of bias | ||
| Bias | Authors' judgement | Support for judgement |
| Random sequence generation (selection bias) | Low risk | "Randomisation was done by opening a sealed, opaque, consecutively numbered envelope containing the information on the group to which the participant was being allocated in accordance with a previously prepared, computer‐generated random sequence of numbers. The randomisation was 1:1, and the process and preparation of the envelopes containing the information were carried out by a person who was not directly involved with the study." |
| Allocation concealment (selection bias) | Low risk | "Randomisation was done by opening a sealed, opaque, consecutively numbered envelope containing the information on the group to which the participant was being allocated in accordance with a previously prepared, computer‐generated random sequence of numbers. The randomisation was 1:1, and the process and preparation of the envelopes containing the information were carried out by a person who was not directly involved with the study." |
| Blinding of participants and personnel (performance bias) All outcomes | High risk | Not feasible. |
| Blinding of outcome assessment (detection bias) All outcomes | High risk | "The study was not blinded to the evaluators." |
| Incomplete outcome data (attrition bias) All outcomes | High risk | 27% dropout; slight differential loss (PFMT 24%; control 30%); similar reasons; no mention of imputation for missing data. |
| Selective reporting (reporting bias) | Low risk | Outcome measures described in methods were reported in results. |
| Other bias | Unclear risk | Data on losses to follow‐up (reported on CONSORT flowchart, in the text and tables) were incongruent. |
Mørkved 2003.
| Study characteristics | ||
| Methods | Design: 2‐arm (parallel groups) RCT. | |
| Participants |
Number of participants: 301 pregnant nulliparous women. Setting: single centre, Norway. Age: mean (SD), years: PFMT 28 (5); control 27 (4). Parity: all nulliparous. Delivery: PFMT 74.3% vaginal, 17.6% instrumental, 8.1% caesarean; control 69.9% vaginal, 20.9% instrumental, 9.2% caesarean. BMI prior to pregnancy: mean (SD): PFMT 23 (3); control 23 (4). Incontinence at recruitment: PFMT 32%; control 31%. Inclusion: 18 weeks' gestation, aged ≥ 18 years, single live fetus at 18‐week ultrasound. Exclusion: pregnancy complications, high risk for preterm labour, pain during voluntary PFM contraction, ongoing UTI, diseases that could interfere with participation, lived too far from centre to attend weekly class. |
|
| Interventions |
PFMT (n = 148): supervised group exercise class (once per week, 60 min, 10‐15 women), led by a physiotherapist over a 12‐week period (from 20‐26 weeks' gestation). Class included a progressive PFMT programme (based on Bø 1999), and body awareness, breathing, relaxation and strength training for abdominal, back and thigh muscles. Women received individual instruction in pelvic floor anatomy and how to perform a correct PFM contraction from a physiotherapist, confirmed by vaginal digital palpation and observation of the perineum. Women were instructed to perform daily PFMT at home (2 sets of 8‐12 contractions), and were given exercise diaries to complete. Control (n = 153): customary information given by midwife or general practitioner. Women received individual instruction in pelvic floor anatomy and how to perform a correct PFM contraction from a physiotherapist, confirmed by vaginal digital palpation and observation of the perineum. Not discouraged from doing PFMT on their own. |
|
| Outcomes | Measured at 36 weeks' gestation and 3 months' postpartum. Primary endpoint: 3 months' postpartum. Primary outcome: self‐reported UI. Secondary outcomes: leakage episodes (3‐day urinary diary), change in leakage (Likert scale), vaginal digital palpation, vaginal squeeze pressure. |
|
| Notes | Losses to follow‐up at 3 months' postpartum: PFMT 5/148; control 7/153 (total 4%). Funding: Norwegian Fund for Postgraduate Training in Physiotherapy and the Norwegian Women's Public Health Association. Conflicts of interest: not reported. |
|
| Risk of bias | ||
| Bias | Authors' judgement | Support for judgement |
| Random sequence generation (selection bias) | Low risk | "Randomisation was done in blocks of a maximum of 32 with the use of opaque, sealed envelopes. The envelopes were mixed thoroughly before they were stored in a larger envelope. Each participant drew and opened one envelope herself and was enrolled by the secretary in the secretary's office." |
| Allocation concealment (selection bias) | Low risk | "Randomisation was done in blocks of a maximum of 32 with the use of opaque, sealed envelopes. The professional staff involved in the training groups or the outcome assessments had no access to the randomisation procedure. A secretary with no other involvement in the trial prepared the envelopes." |
| Blinding of participants and personnel (performance bias) All outcomes | High risk | Not feasible. "The women were asked not to reveal any information about group allocation to the principal investigator doing the assessments." |
| Blinding of outcome assessment (detection bias) All outcomes | High risk | Unblinded reporting of UI self‐report outcomes because they were participant‐reported. Perineometry was blinded. "The principal assessor was not involved in the training of the women and was blinded to group allocation while making the assessments and plotting data." |
| Incomplete outcome data (attrition bias) All outcomes | Low risk | 4.0% dropout; no differential; reasons provided, but not for each group; imputation for missing data (for the principal analysis the "missing last values were carried forward by their baseline values"). |
| Selective reporting (reporting bias) | Low risk | Outcome measures described in methods were reported in results. |
| Other bias | Low risk | No other sources of bias noted. |
Oakley 2016.
| Study characteristics | ||
| Methods | Design: 2‐arm (parallel groups) RCT. | |
| Participants |
Number of participants: 54 primiparous women, with a third‐ or fourth‐degree laceration (with or without episiotomy) that required repair.
Setting: Tri‐Health hospital system, Cincinnati, Ohio, USA.
Age: mean (SD), years: PFMT 29.2 (4.2); Control 30.6 (5.2).
Parity: primiparous.
Delivery: vaginal (natural and instrumental), not reported per group.
BMI: mean (SD) years: PFMT 25.7 (8.5); control 27.6 (6.4).
Incontinence at recruitment: 4.0% (2/50) exhibited perineal soiling of faecal material. Inclusion: aged > 18 years, primiparous, vaginal delivery, vacuum‐ or forceps‐assisted vaginal delivery, gestational age ≥ 27 completed weeks, singleton or multiple gestational vaginal deliveries, and ability to read and speak English language. Exclusion: inability to comply with physical therapy or office visits; unreliable transportation; pre‐existing neurological, musculoskeletal, or neuromuscular disorders rendering participants unable to perform PFMT requirements, caesarean delivery (of any or all neonates), history of faecal incontinence of anorectal surgery before pregnancy and delivery. |
|
| Interventions | PFMT (n = 29): combined with behavioural therapy. Participants were required to complete 4 x 60 min PFMT sessions, every 2 weeks, beginning at 6 weeks’ postpartum (i.e. weeks 6, 8, 10 and 12), delivered by a physiotherapist. Instruction was provided in “proper performance of home exercise/treatment programme”, but the number or type of contractions was not reported. Women received behavioural therapy instructions (e.g. diet, perineal hygiene, level of activity) at baseline and during the PFMT sessions, and a written handout. Absence or presence of PFM contraction was confirmed with vaginal digital palpation and EMG; not specified if women were taught correct PFM contraction. Women also received routine post‐obstetric care with their primary obstetrician and gynaecologist. Control (n = 25): usual care, which included routine post‐obstetric care with their primary obstetrician and gynaecologist. | |
| Outcomes | Measured at baseline (2‐4 weeks’ postpartum), and 12 weeks’ postpartum. Primary endpoint: 12 weeks’ postpartum. Primary outcome: FI (assessed with the Faecal Incontinence Quality of Life (FIQOL) questionnaire). Other outcomes: PFM strength with vaginal EMG (microvolts; mean initial resting, quick‐flick peak, 10 sec hold, endurance, post‐contraction resting) and modified oxford scale, anorectal manometry (mmHg), Faecal Incontinence Severity Index (FISI), Female Sexual Function Index (FSFI), UDI‐6, IIQ‐7, general health questionnaire (short form‐12). | |
| Notes | Losses to follow‐up at 12 weeks’ postpartum: PFMT 2/29, control 2/25 (total 7.4%). At the primary endpoint 8/50 (16%) women had received information on PFMT from health professionals independent to the study; no differences noted between groups. Funding: TriHealth Medical Education Research Fund. Equipment for vaginal and anal physiologic measurements were supplied by their respective companies at a discounted research price. Conflicts of interest: none declared. | |
| Risk of bias | ||
| Bias | Authors' judgement | Support for judgement |
| Random sequence generation (selection bias) | Low risk | “The randomization allocation was determined by a computer‐generated random permuted block”. |
| Allocation concealment (selection bias) | Low risk | “Subjects were assigned randomly to wither the control arm (no intervention) or the treatment arm (intervention) by a sequentially numbered opaque sealed envelope”. |
| Blinding of participants and personnel (performance bias) All outcomes | High risk | Not feasible. |
| Blinding of outcome assessment (detection bias) All outcomes | High risk | Unblinded reporting of FI and UI self‐report outcomes because they were participant‐reported. Statistician was blinded. |
| Incomplete outcome data (attrition bias) All outcomes | Low risk | 7% dropout; similar between groups; no reasons; no mention of imputation for missing data. |
| Selective reporting (reporting bias) | Low risk | Data reported for everyone randomised within the results. |
| Other bias | Unclear risk | Significantly greater number of fourth degree lacerations in the PFMT group (P = 0.024). May account for the “less of an improvement of anal pressures” in the PFMT group. |
Peirce 2013.
| Study characteristics | ||
| Methods | Design: 2‐arm (parallel groups) block RCT. | |
| Participants |
Number of participants: 120 postpartum women. Setting: labour ward and perineal clinic, National Maternity Hospital, Dublin. Age: mean (SD), years: not reported. Parity: primiparous. Delivery: PFMT 60% spontaneous vaginal, 40%, assisted vaginal; control 63% spontaneous vaginal, 37% assisted vaginal. BMI: mean (SD): not reported. Incontinence at recruitment: not reported. Inclusion: primiparous, fluent in English, sustained a primary third‐degree tear during delivery (that was repaired immediately). Exclusion: women with an infant in the special care unit, a history of alcohol or illicit drug abuse, a positive viral status (hepatitis virus, HIV) and not fluent in English. |
|
| Interventions |
PFMT plus biofeedback (n = 30): 2 sessions per day, 3 months' duration. Biofeedback training was undertaken in the perineal clinic and was delivered by either a specialist obstetrician, a specialist nurse, or a combination of both; no written information was provided. PFMT education was provided by senior midwives or physiotherapists on the postnatal ward and written information was provided, with women to perform standard Kegel exercises for 5 min. There was no mention of checking for a correct pelvic floor contraction and once given the programme it appeared that no further contact was made until the 3‐month follow‐up. Women were given an exercise diary to complete. PFMT alone (n = 90): women were educated on the ward before discharge, by senior midwives or physiotherapists. Written instructions were provided with women to perform standard Kegel exercises for 5 min, 2 sessions per day. |
|
| Outcomes | Measured at 3 months' postpartum (no baseline measures). Primary endpoint: 3 months' postpartum. Primary outcome: not reported. Outcomes: Cleveland Clinic continence score, FIQOL quality of life scale, manometry (mmHg), endoanal ultrasound. |
|
| Notes | No losses to follow‐up. Note block randomisation 1:3 (PFMT plus biofeedback 30, PFMT 90). Adverse events: no adverse events were reported relating to the use of biofeedback. Funding: Health Research Board of Ireland. Conflicts of interest: none declared. |
|
| Risk of bias | ||
| Bias | Authors' judgement | Support for judgement |
| Random sequence generation (selection bias) | Low risk | "Computer randomisation programme" (note randomisation in a ratio of 1:3). |
| Allocation concealment (selection bias) | Low risk | "Sealed, opaque envelopes." |
| Blinding of participants and personnel (performance bias) All outcomes | High risk | Not feasible. |
| Blinding of outcome assessment (detection bias) All outcomes | High risk | Unblinded reporting of FI self‐report outcomes because they were participant‐reported. Unclear if manometry or ultrasound blinded. |
| Incomplete outcome data (attrition bias) All outcomes | Low risk | No dropouts. |
| Selective reporting (reporting bias) | Low risk | Outcome measures described in methods were reported in results. |
| Other bias | Low risk | No other sources of bias noted. |
Pelaez 2014.
| Study characteristics | ||
| Methods | Design: 2‐arm (parallel groups) RCT. | |
| Participants |
Number of participants: 169 pregnant primiparous women. Setting: Gynecology and Obstetrics Service of Fuenlabrada University Hospital, Madrid, Spain. Age: mean (SD), years: PFMT 29.9 (3.3); control 29.1 (4.5). Parity: primiparous. Delivery: not applicable as primary endpoint was during pregnancy. BMI prior to pregnancy: mean (SD): PFMT 23.6 (4.3); control 22.7 (3.8). Incontinence at recruitment: none (see inclusion criteria). Inclusion: healthy primiparous pregnant with singleton fetus, 10‐14 weeks' gestation, no UI, able to communicate in Spanish and able to provide informed written consent. Exclusion: planning not to give birth in Fuenlabrada University Hospital, and any contraindication according to the American College of Obstetricians and Gynecologists guidelines. |
|
| Interventions |
PFMT (n = 73): supervised exercise class (3 times per week, 60 min, 8‐12 women) designed and led by a physical activity and sport sciences graduate, at least 22 weeks' duration (about 70‐78 sessions in total). Class included a progressive PFMT programme (approximately 10 min of each session), low impact aerobics including general strength training, and stretching, relaxation and massage. All women received standard education and information on PFM anatomy and function, but a correct PFM contraction was not verified. Women were encouraged to perform 100 PFM contractions distributed in different sets every day (unclear if this was in reference to a home programme). Control (n = 96): usual care, which included follow‐up by midwifes including information about PFMT. Women were not asked not to do PFMT. |
|
| Outcomes | Measured at 36‐40 weeks' gestation. Primary endpoint: end treatment (36‐40 weeks' gestation). Primary outcomes: self‐reported UI and UI severity (measured with ICIQ‐SF). Secondary outcome: none. |
|
| Notes | Losses to follow‐up: PFMT 10/73; control 7/96 (total 10%). Funding: not reported. Conflicts of interest: none declared. |
|
| Risk of bias | ||
| Bias | Authors' judgement | Support for judgement |
| Random sequence generation (selection bias) | Low risk | "A statistical randomisation computer programme was used." |
| Allocation concealment (selection bias) | Unclear risk | Not reported. |
| Blinding of participants and personnel (performance bias) All outcomes | High risk | Not feasible. |
| Blinding of outcome assessment (detection bias) All outcomes | High risk | "Non‐blinded design." |
| Incomplete outcome data (attrition bias) All outcomes | Low risk | 10% dropout; slight differential loss (PFMT 13.7%; control 7.3%); similar reasons; no mention of imputation for missing data. Note uneven group size (PFMT 73, control 96). |
| Selective reporting (reporting bias) | Low risk | Outcome measures described in methods were reported in results. |
| Other bias | Unclear risk | Unclear how the randomisation process resulted in uneven group sizes (PFMT 73; control 96). This could possibly be due to immediate losses post‐randomisation from the PFMT group. |
Reilly 2002.
| Study characteristics | ||
| Methods | Design: 2‐arm (parallel groups) RCT. | |
| Participants |
Number of participants: 268 primigravid women. Setting: single centre, UK. Age: median (range), years: PFMT 27 (17‐42); control 29 (16‐47). Parity: all primigravid. Delivery: PFMT 66.1% vaginal, 17.8% instrumental, 16.1% caesarean; control 65.5% vaginal, 21.8% instrumental, 12.7% caesarean. BMI: mean (SD): PFMT 25 (4); control 24 (4). Incontinence at recruitment: none. Inclusion: 20 weeks' gestation, bladder neck hypermobility (> 5 mm linear movement following standardised Valsalva) on perineal ultrasound. Exclusion: pre‐pregnancy UI, neurological disorder. |
|
| Interventions |
PFMT (n = 139): one‐to‐one monthly sessions with a physiotherapist, between 20 weeks' gestation and delivery. Progressive PFMT programme (based on that of Bø 1995) that included daily PFMT at home (2 sets of exercises) with women asked to complete an exercise diary. Women unable to follow PFMT protocol due to inability to contract the PFM had an individualised programme until they were able to follow the study regimen. Control (n = 129): likely to have received verbal advice on PFMT from midwives at antenatal classes. Probably monthly clinic visits for measurement of bladder neck mobility and vaginal squeeze pressure (perineometry). |
|
| Outcomes | At approximately 20 weeks' and 34 weeks' gestation, and 3 months' postpartum. PFM strength measured monthly from 20 weeks' gestation. Primary endpoint: 3 months' postpartum. Primary outcome: self‐reported UI. Secondary outcomes: 1‐hour ICS pad test at home, PFM strength (perineometry), bladder neck mobility with perineal US, joint hypermobility, striae (graded 1‐3), SF‐36, King's Health Questionnaire. |
|
| Notes | Losses to follow‐up at 3 months' postpartum: PFMT 19/139; control 19/129 (total 14.2% for primary outcome). Funding: Wellbeing. Conflicts of interest: not reported. |
|
| Risk of bias | ||
| Bias | Authors' judgement | Support for judgement |
| Random sequence generation (selection bias) | Low risk | "Simple randomisation was used, from pseudo‐random numbers generated by computer." |
| Allocation concealment (selection bias) | Low risk | "Because women in the pelvic floor exercise group had to be referred to the physiotherapist, the allocation schedule was held by the study coordinator. The physiotherapist operated from separate premises." |
| Blinding of participants and personnel (performance bias) All outcomes | High risk | Not feasible. |
| Blinding of outcome assessment (detection bias) All outcomes | High risk | Unblinded reporting of UI self‐report outcomes because they were participant‐reported. Pad test not blinded; perineometry and assessment of bladder neck mobility were blinded. "The observers carrying out the assessments of pelvic floor strength, bladder neck mobility and reported symptoms were blind to the allocation." |
| Incomplete outcome data (attrition bias) All outcomes | Unclear risk | 14.2% dropout; similar between groups; reasons provided, but not for each group; no mention of imputation for missing data. |
| Selective reporting (reporting bias) | Low risk | Outcome measures described in methods were reported in results. |
| Other bias | Low risk | No other sources of bias noted. |
Sacomori 2019.
| Study characteristics | ||
| Methods | Design: 2‐arm (parallel groups) cluster‐RCT. | |
| Participants |
Number of participants: 202 postpartum women.
Setting: Carmela Dutra Maternity Hospital, Florianopolis, Santa Catarina, Brazil.
Age: not reported.
Parity: primiparous, PFMT 49.3%; control 41.5%. Multiparous, PFMT 50.7%, control 58.5%.
Delivery: PFMT 59.7% vaginal, 40.3% caesarean; control 56.9% vaginal, 43.1% caesarean.
BMI: not reported.
Incontinence prior to pregnancy: PFMT 10.4%, control 9.2%.
Incontinence by third trimester: PFMT 62.7%; control 63.1%. Inclusion: > 18 years of age, able to understand Portuguese and immediately post‐partum after giving birth to a live child. Exclusion: previous history of UI due to neurological disorders, history of cancer in the genitourinary tract, previous diagnosis of neurological disease, blind, illiterate, drug addiction, no telephone/mobile phone number. |
|
| Interventions | PFMT (n = 98): home exercise programme during postpartum, 10 repetitions of 10‐sec holds (increasing intensity of contractions; strength and endurance training), 10 repetitions of 5 fast and strong contractions (strength training), and ‘the knack’ (a contraction before and during a sneeze or cough) to be performed 2 times per day (without supervision). Women received verbal and written (brochure) educational information provided by ‘pelvic floor specialists’ on PF structure, physiological changes, common problems during pregnancy, PF dysfunction, how to localise the PF and perform PFMT. Correct PFM contraction was ascertained through visual assessment. Adherence to PFMT assessed via phone survey at 3 months postpartum. Control (n = 104): no PFMT. Women did not receive any kind of intervention or information regarding PFMT as this is not usual practice in Brazil. | |
| Outcomes | Measured pre‐pregnancy and third trimester (data were collected retrospectively), and 3 months’ postpartum. Primary endpoint: 3 months’ postpartum. Primary outcome: adherence, classified according to the length of time dedicated to the exercises. Other outcomes: incontinence‐specific quality of life (measured with ICIQ‐SF). | |
| Notes | Losses to follow‐up: PFMT 31/98; control 39/104 (total 34.7%).
Have presented complete case analysis imputed for missing data but no indication of the methods of imputation. We used the directly observed data. A cluster‐RCT with no apparent adjustment for the effect of cluster. Funding: not reported Conflicts of interest: not reported. |
|
| Risk of bias | ||
| Bias | Authors' judgement | Support for judgement |
| Random sequence generation (selection bias) | Unclear risk | “Rooms instead of individual participants were randomised considering that each participant shared a room in the maternity division with another postpartum woman.” Did not state method of randomisation. |
| Allocation concealment (selection bias) | Low risk | “Allocation concealment was performed through consecutively numbered, sealed, opaque envelopes, kept with an author not directly involved with participants.” |
| Blinding of participants and personnel (performance bias) All outcomes | High risk | Not feasible. |
| Blinding of outcome assessment (detection bias) All outcomes | High risk | Unblinded reporting of UI self‐report outcomes because they were participant‐reported. |
| Incomplete outcome data (attrition bias) All outcomes | High risk | 34.7% dropout; slight differential (PFMT 31.6%; control 37.5%); similar reasons; presented complete case analysis imputed for missing data but no indication of the methods of imputation. |
| Selective reporting (reporting bias) | Low risk | Outcome measures described in methods were reported in results. |
| Other bias | Low risk | No other sources of bias noted. |
Sampselle 1998.
| Study characteristics | ||
| Methods | Design: 2‐arm (parallel groups) RCT. | |
| Participants |
Number of participants: 72 primigravid women. Setting: single centre, USA. Age: mean (SD), years: PFMT 28 (6); control 26 (5). Parity: all primigravid. Delivery: of the 46 with UI, 37 vaginal and 9 caesarean. Not reported by group. BMI: not reported. Incontinence at recruitment: PFMT 23%; control 21%. Inclusion: 20 weeks' gestation, no history of genitourinary pathology, plan to remain in region for 12 months' postpartum, ability to read and understand English. Exclusion: history of genitourinary pathology (including severe incontinence) or neuromuscular pathology. |
|
| Interventions |
PFMT (n = 34): standardised instruction in PFMT which included 30 maximal or near maximal voluntary PFM contractions per day; for up to 17 months. Control (n = 38): usual care with no systematic PFMT programme. |
|
| Outcomes | Measured at 35 weeks' gestation, 6 weeks' postpartum, and 6 and 12 months' postpartum. Primary endpoint: 12 months' postpartum. Primary outcome: not reported. Outcomes: best of 2 maximal voluntary PFM contractions measured using instrumented speculum (Newtons), severity of incontinence (mean score from questionnaire where 0 = none, 1 = damp, 2 = wet and 3 = soaked with gentle cough, hard cough, sneeze and laugh), self‐reported adherence. |
|
| Notes | Losses to follow‐up at 12 months' postpartum: PFMT 12/34; control 14/38 (total 36.1%). Funding: National Institutes of Health grants (R29‐NRO1950 and RO1‐NRO‐4007). Conflicts of interest: not reported. |
|
| Risk of bias | ||
| Bias | Authors' judgement | Support for judgement |
| Random sequence generation (selection bias) | Low risk | "Group allocation was by random assignment using a computer generated random numbers table." |
| Allocation concealment (selection bias) | Low risk | "Group assignment was conducted by a clerical member of the project staff." |
| Blinding of participants and personnel (performance bias) All outcomes | High risk | Not feasible. |
| Blinding of outcome assessment (detection bias) All outcomes | High risk | Unblinded reporting of UI self‐report outcomes because they were participant‐reported. PFM strength blinded. "Investigator was blinded to participant group status... through the use of a second individual not involved in assessment of UI symptoms or muscle strength." |
| Incomplete outcome data (attrition bias) All outcomes | High risk | 36.1% dropout; similar between groups; no reasons; no mention of imputation for missing data. |
| Selective reporting (reporting bias) | Low risk | Outcome measures described in methods were reported in results. |
| Other bias | Unclear risk | Women who had a caesarean section were excluded from the analysis of PFM strength. |
Sangsawang 2016.
| Study characteristics | ||
| Methods | Design: 2‐arm (parallel groups) RCT. | |
| Participants |
Number of participants: 70 pregnant primiparous women. Setting: antenatal clinic, Department of Obstetrics and Gynecological Nursing, Srinakharinwirot University, Thailand (July‐October 2012). Age: mean (SD), years: PFMT 27.6 (SD 5.1); control 28.2 (5.0). Parity: primiparous. Delivery: not applicable as primary endpoint was during pregnancy. BMI prior to pregnancy: mean (SD): PFMT 21.7 (1.9); control 22.0 (1.9). Incontinence at recruitment: none. Inclusion: primiparous, aged ≥ 18 years, 20‐30 weeks' gestation, singleton fetus and prepregnancy BMI < 30. Exclusion: stress UI during pregnancy, complications such as preterm labour, pregnancy‐induced hypertension, gestational diabetes mellitus, antenatal haemorrhage, pain during PFM contraction or diseases that could interfere with the participant. |
|
| Interventions |
PFMT (n = 35): supervised group PFMT programme (45 min, held once every 2 weeks, 4‐5 women) led by a midwife, 6 weeks' duration (a total of 3 sessions). All women received antenatal education about PFM function, PFM strengthening and how to perform PFM exercises. The ability to contract the PFM was assessed using the "stop test" (stop or slow urinary flow for 1‐2 sec). Women were instructed to perform 20 sets of exercises twice per day at home, at least 5 days per week, and were provided with a 25‐page PFMT handbook and a urinary dairy. Control (n = 35): usual antenatal care from health professionals, obstetricians or midwives (who were not involved in the study). Received information on diet, sleep, breastfeeding and antenatal exercise for the benefit of preparing for childbirth and were instructed in the "stop test." They did not receive information about stress UI during pregnancy and had no training to support the performance of correct PFMT. |
|
| Outcomes | Measured at baseline (20‐30 weeks' gestation) and 38 weeks' gestation. Primary endpoint: 38 weeks' gestation. Primary outcome: self‐reported UI (defined as involuntary leakage of urine on sneezing, coughing, effort or physical exertion, ≥ 1 times per week). Secondary outcomes: severity of UI comprised of frequency, volume of urine leakage (minimal = a few drops, moderate = wetting underwear, large = sufficient to dampen outer clothing) and perceived severity (visual analogue scale, 0‐10). |
|
| Notes | Losses to follow‐up at 38 weeks' gestation: PFMT 2/35; control 5/35 (total 10%). Funding: Supported by Faculty of Nursing, Srinakharinwirot University, Thailand. Conflicts of interest: none declared. |
|
| Risk of bias | ||
| Bias | Authors' judgement | Support for judgement |
| Random sequence generation (selection bias) | Low risk | Computer‐generated random numbers. |
| Allocation concealment (selection bias) | Low risk | Sealed, opaque envelopes. |
| Blinding of participants and personnel (performance bias) All outcomes | High risk | Not feasible. |
| Blinding of outcome assessment (detection bias) All outcomes | High risk | Unblinded reporting of UI self‐report outcomes because they were participant‐reported. |
| Incomplete outcome data (attrition bias) All outcomes | Low risk | 10% dropout; slight differential loss (PFMT 5.7%: control 14.3%); similar reasons; no mention of imputation for missing data. |
| Selective reporting (reporting bias) | Low risk | Outcome measures described in methods were reported in results. |
| Other bias | Low risk | No other sources of bias noted. |
Skelly 2004.
| Study characteristics | ||
| Methods | Design: 2‐arm (parallel groups) RCT. | |
| Participants |
Number of participants: unspecified number of women with antenatal UI, 705 women consented and interviewed. Setting: single centre, Canada. Age: not reported. Delivery: not reported. BMI: not reported. Parity: not reported. Inclusion: none reported in addition to above. Exclusion: none reported. |
|
| Interventions |
PFMT (n = not known): teaching about PFMT. No further details given. Control (n = not known): handout information about PFMT. |
|
| Outcomes | Measured at 1, 6 and 12 months' postpartum. Primary endpoint: not reported. Primary outcome: self‐reported UI. Secondary outcome: not reported. |
|
| Notes | Losses to follow‐up not reported. Funding: not reported. Conflicts of interest: not reported. |
|
| Risk of bias | ||
| Bias | Authors' judgement | Support for judgement |
| Random sequence generation (selection bias) | Unclear risk | Not reported. |
| Allocation concealment (selection bias) | Unclear risk | Not reported. |
| Blinding of participants and personnel (performance bias) All outcomes | High risk | Not feasible. |
| Blinding of outcome assessment (detection bias) All outcomes | High risk | Unblinded reporting of UI and FI self‐report outcomes because they were participant‐reported. |
| Incomplete outcome data (attrition bias) All outcomes | Unclear risk | Not reported. |
| Selective reporting (reporting bias) | Unclear risk | Difficult to assess. Outcomes not clearly specified in text and probable that not all have been reported. |
| Other bias | Unclear risk | Reported in a conference abstract with limited information about study methods and results. |
Sleep 1987.
| Study characteristics | ||
| Methods | Design: 2‐arm (parallel groups) RCT. | |
| Participants |
Number of participants: 1800 women recruited from postnatal wards. Setting: single centre, UK. Age: mean (SD), years: PFMT 27.1 (5.3); control 26.2 (5.3). Parity: primiparous, PFMT 49%; control 50%. Delivery: PFMT 83.6% vaginal, 16.4% instrumental; control 80.3% vaginal, 19.7% instrumental. BMI: not reported. Incontinence during pregnancy: PFMT 32%; control 29%. Inclusion: within 24 hours of delivery, vaginal delivery. Exclusion: stillbirth or seriously ill baby. |
|
| Interventions |
PFMT (n = 900): 1 individual session daily with midwife co‐ordinator while in hospital. 4‐week health diary including section recommending specific exercise each week that integrated voluntary PFM contraction with activities of daily living (also used to assess adherence). No further details of PFMT programme. Control (n = 900): usual antenatal and postnatal care that included instruction in PFMT at antenatal class and by obstetric physiotherapist in postnatal classes on the ward. PFMT instruction included awareness, voluntary PFM contraction as often as remembered, and mid‐stream urine stop. 4‐week health diary without additional section on PFMT. |
|
| Outcomes | Measured at 3 and 12 months' postpartum. Primary endpoint: 3 months' postpartum. Primary outcome: not reported. Outcomes: postal questionnaire to assess self‐reported UI and FI, frequency of leakage, perineal pain and severity of pain, time to resume sexual intercourse, dyspareunia, general well‐being, "use of PFM exercises." |
|
| Notes | Losses to follow‐up at 3 months' postpartum: PFMT 81/900; control 108/900 (total 11%). Funding: Oxford Region Health Authority. Conflicts of interest: not reported. |
|
| Risk of bias | ||
| Bias | Authors' judgement | Support for judgement |
| Random sequence generation (selection bias) | Unclear risk | "Allocated at random." |
| Allocation concealment (selection bias) | Unclear risk | Not reported. |
| Blinding of participants and personnel (performance bias) All outcomes | High risk | Not feasible. "Community staff able to recognise women in intensive exercise group by possession of diary." |
| Blinding of outcome assessment (detection bias) All outcomes | High risk | Unblinded reporting of UI and FI self‐report outcomes because they were participant‐reported. |
| Incomplete outcome data (attrition bias) All outcomes | Unclear risk | 10.6% dropout; similar between groups; no reasons; no mention of imputation for missing data. |
| Selective reporting (reporting bias) | Low risk | Outcome measures described in methods were reported in results. |
| Other bias | Unclear risk | Unclear if the 2 groups were comparable at baseline in terms of undertaking regular PFMT during the last 6 months of pregnancy (PFMT 56.6%; control 45.6%) and UI during pregnancy (PFMT 32.0%; control 28.6%). |
Stafne 2012.
| Study characteristics | ||
| Methods | Design: 2‐arm (parallel groups), 2‐centre RCT. | |
| Participants |
Number of participants: 855 pregnant women at 18 weeks' gestation. Setting: 2 centres in Norway. Trondheim University Hospital (St. Olavs Hospital) and Stavanger University Hospital. Age: mean (SD), years: PFMT 30.5 (4.4); control 30.4 (4.3). Parity: nulliparous, PFMT 57.5%; control 56.1%. Delivery: not applicable as primary endpoint was during pregnancy. BMI, mean (SD): PFMT 24.7 (3.0); control 25.0 (3.4). Incontinence at recruitment: UI PFMT 40.1%; control 42.2%. FI PFMT 5.2%; control 4.0%. Flatal incontinence PFMT 27.5%; control 26.1%. Inclusion: aged ≥ 18 years, singleton live foetus. Exclusion: high‐risk pregnancy or diseases that could interfere with participation (or both), women who lived too far from the hospitals to attend weekly training groups (judged as more than 30‐min drive). |
|
| Interventions |
PFMT (n = 429): supervised group exercise class (once per week, 8‐15 women, 60 min), led by a physiotherapist over a 12‐week period. Class included a progressive PFMT programme that was included in a 20‐ to 25‐min block of strengthening exercises (in addition to 30‐35 min low‐impact aerobics and 5‐10 min of stretching). All women received written information on PFMT, individual instruction in PFM anatomy and how to perform a correct PFM contraction (confirmed by vaginal palpation) by a physiotherapist. Also encouraged to perform PFMT at home at least twice per week as part of a 45‐min home programme (written instructions provided) and complete an exercise diary. Control (n = 426): usual care including standard antenatal care and information provided by midwife or general practitioner. Women were not discouraged from doing PFMT. All women received the same written information and recommendations on PFMT as the intervention group, including detailed information about the pelvic floor and an evidence‐based PFMT programme. |
|
| Outcomes | Measured at baseline (18‐22 weeks' gestation) and end of treatment (32‐36 weeks' gestation). Primary endpoint: end of treatment (32‐36 weeks' gestation). Primary outcome: self‐reported UI and anal incontinence via a questionnaire that included Sandvik's severity index (UI) and St. Marks score (anal incontinence). Urinary leakage subclassified as UI, stress UI and urge UI with severity categorised as "urinary leakage < once per week" or "urinary leakage equal to or greater than once per week" (severe UI). Anal incontinence categorised into FI and flatal incontinence. Secondary outcomes: frequency, intensity and type of physical activity (including PFMT), training diary (intervention group only). Labour and delivery outcomes (Salvesen and colleagues 2014; see Stafne 2012). |
|
| Notes | Losses to follow‐up during pregnancy: PFMT 33/429; control 61/426 (total 11%). Funding: Norwegian Fund for Postgraduate Training in Physiotherapy and the Liaison Committee for Central Norway Health Authority, and the Norwegian University of Science and Technology. Conflicts of interest: none declared. |
|
| Risk of bias | ||
| Bias | Authors' judgement | Support for judgement |
| Random sequence generation (selection bias) | Low risk | "Concealed randomisation in blocks of 30 was performed at the Unit for Applied Clinical Research, Norwegian University of Technology and Science, by a web‐based computerised procedure. The staff involved with training or outcome assessments had no influence on the randomisation procedure." |
| Allocation concealment (selection bias) | Low risk | "Concealed randomisation in blocks of 30 was performed at the Unit for Applied Clinical Research, Norwegian University of Technology and Science, by a web‐based computerised procedure. The staff involved with training or outcome assessments had no influence on the randomisation procedure." |
| Blinding of participants and personnel (performance bias) All outcomes | High risk | Not feasible. |
| Blinding of outcome assessment (detection bias) All outcomes | High risk | Unblinded reporting of anal incontinence and UI self‐report outcomes because they were participant‐reported. |
| Incomplete outcome data (attrition bias) All outcomes | Unclear risk | 11% dropout; slight differential loss (PFMT 8%; control 14%); similar reasons; no mention of imputation for missing data. |
| Selective reporting (reporting bias) | Low risk | Outcome measures described in methods were reported in results. |
| Other bias | Low risk | No other sources of bias noted. |
Stothers 2002.
| Study characteristics | ||
| Methods | Design: 2‐arm (parallel groups) RCT. | |
| Participants |
Number of participants: 86 pregnant women (unclear if this was number recruited, or number analysed). Setting: single centre, Canada. Age: range 24‐42 years. Parity: not reported. Delivery: 73.3% vaginal, 26.7% caesarean; not reported per group. BMI: not reported. Pre‐existing incontinence: none. Inclusion: no further criteria reported. Exclusion: multiple birth, pre‐existing incontinence, medical conditions preventing exercise regimens during pregnancy. |
|
| Interventions |
PFMT (n = 43): seen twice per month during pregnancy and every 3 months' postpartum for 1 year (possibly by a physiotherapist, but not explicitly stated). No further details given. Control (n = 43): same number of contacts. Treatment described as "other (placebo) including no pelvic floor exercises." |
|
| Outcomes | Measured at 6 and 12 months' postpartum. Primary endpoint: 6 months' postpartum. Primary outcome: mean urine loss on stress test with standardised bladder volume. Secondary outcome: not reported. |
|
| Notes | No losses to follow‐up for primary outcome. Adverse events: 2/43 women withdrew from PFMT due to pelvic floor pain. Funding: not reported. Conflicts of interest: not reported. |
|
| Risk of bias | ||
| Bias | Authors' judgement | Support for judgement |
| Random sequence generation (selection bias) | Unclear risk | Not reported. |
| Allocation concealment (selection bias) | Unclear risk | Not reported. |
| Blinding of participants and personnel (performance bias) All outcomes | High risk | Not feasible. |
| Blinding of outcome assessment (detection bias) All outcomes | High risk | Unblinded reporting of UI self‐report outcomes because they were participant‐reported. "The statistician and medical staff assessing questionnaires and assisting with pad testing were blinded to treatment assignment." |
| Incomplete outcome data (attrition bias) All outcomes | Low risk | UI self‐report data available for all 107 participants randomised. |
| Selective reporting (reporting bias) | Unclear risk | Difficult to assess. 1 prespecified outcome from methods reported, but possible other outcomes have not been. |
| Other bias | Unclear risk | Reported in a conference abstract with limited information about study methods and results. |
Sut 2016.
| Study characteristics | ||
| Methods | Design: 2‐arm (parallel groups) RCT. | |
| Participants |
Number of participants: 64 pregnant women.
Setting: Urogynaecology Unit of the Gynaecology and Obstetrics Department of Trakya University Faculty of Medicine, Turkey.
Age: mean (SD), years: PFMT 30.0 (6.5); control 27.2 (6.3).
Parity: mean (SD): PFMT 1.2 (1.1); control 0.8 (1.1).
Delivery: PFMT 66.7% vaginal, 33.3% caesarean; control 40.0% vaginal, 60.0% caesarean. Statistically significant difference (P = 0.018) in vaginal deliveries between groups.
BMI: mean (SD): PFMT 29.9 (5.7), control 27.7 (5.0).
Incontinence at recruitment: not explicitly stated. Baseline values suggest the presence of UI (mean (SD)) for some women: PFMT 0.1 (0.3), control 0.1 (0.2). Inclusion: pregnant women in their third trimester (28 weeks’ gestation), aged > 18 years and attending the Gynaecology and Obstetrics Department of the University Faculty of Medicine. Exclusion: pregnant women with twin or high‐risk pregnancies, urinary tract infections, prolapses, neuropathy, collagen tissue disease, neurological illnesses, diabetes mellitus, chronic pulmonary disease, history of pelvic surgery or high risk of early delivery. |
|
| Interventions | PFMT (n = 32): home exercise programme during pregnancy and postpartum, 3 sets of 10 exercises, 3 times per day. Instructions provided by researcher on how to perform Kegel exercises, but not reported if correct performance of contractions was confirmed. Women were phoned at two‐week intervals to remind them to perform their exercises. Control (n = 32): “no instruction was given to the patients in the control group”. | |
| Outcomes | Measured at baseline (28 weeks’ gestation), 36‐38 weeks’ gestation and 6‐8 weeks’ postpartum. Primary endpoint: 6‐8 weeks’ postpartum. Primary outcome: PFM strength (measured with a manometric perineometry device). Other outcomes: voiding functions (measured using uroflowmetry), voiding diaries, and urinary symptoms and quality of life (UDI‐6, IIQ‐7 and OAB‐q). | |
| Notes | Losses to follow‐up: PFMT 2/32; control 2/32 (total 5.4%). Funding: Trakya University Research Foundation. Conflicts of interest: none declared. | |
| Risk of bias | ||
| Bias | Authors' judgement | Support for judgement |
| Random sequence generation (selection bias) | Unclear risk | “The 64 remaining participants were randomly assigned into the training or control group using a computer‐based system.” |
| Allocation concealment (selection bias) | Unclear risk | Not reported. |
| Blinding of participants and personnel (performance bias) All outcomes | High risk | Not feasible. |
| Blinding of outcome assessment (detection bias) All outcomes | High risk | Unblinded reporting of UI self‐report outcomes because they were participant‐reported. |
| Incomplete outcome data (attrition bias) All outcomes | Low risk | Less than 10% dropout; similar between groups, no reasons; no mention of imputation for missing data. |
| Selective reporting (reporting bias) | Low risk | Outcome measures described in the methods were reported in the results. |
| Other bias | Low risk | No other sources of bias noted. |
Szumilewicz 2019.
| Study characteristics | ||
| Methods | Design: 2‐arm (parallel groups) block RCT. | |
| Participants |
Number of participants: 166 pregnant nulliparas women
Setting: Gdansk University of Physical Education and Sport, Poland.
Age: mean (SD), years: PFMT 30.0 (4.0); control 29.0 (3.0).
Parity: nulliparous.
Delivery: not applicable as endpoint was during pregnancy.
BMI: mean (SD): PFMT 22.9 (2.8), control 23.5 (2.7).
Incontinence at recruitment: PFMT 12.9% control 3.7% (IIQ score > 0 and < 50). Inclusion: normal single pregnancy confirmed by routine obstetric consultation. Exclusion: current or previous pelvic floor dysfunction (diagnosed by a health professional), history of miscarriages > 12 weeks’ gestation and/or > two successive miscarriages in the first trimester, contraindications to physical activity according to American College of Obstetricians and Gynaecologists (ACOG 2015), allergy to any materials used in the study (e.g. nickel in vaginal probes), the presence of a condition or abnormality that would compromise the safety of the participant or the quality of the data. Women who were unable to perform a PFM contraction (assessed with EMG) and did not show good quality of life (IIQ) at the pre‐intervention assessment were also excluded. |
|
| Interventions | PFMT (n = 111): supervised group exercise sessions (three times per week, 60 min), led by a certified pregnancy and postnatal exercise specialist (with quality checks by the principal researcher every 2 weeks) over a 6‐week period (18 sessions in total). Each session included PFMT incorporated into high‐ and low‐impact aerobic activity (25 min) and strengthening exercises (25 min) which included a progressive PFMT programme; the session finished with stretching and breathing exercises and relaxation (10mins). PFM contraction was confirmed by EMG and women received one session of verbal instruction about PFM contraction and relaxation with biofeedback. Attendance at each session was documented and women were phoned or emailed to ensure adherence to the programme. Control (n = 55): did not receive biofeedback, verbal instruction on how to contract the PFM or any exercise program. | |
| Outcomes | Measured at baseline (mean 21, (SD) 5 weeks gestation), and end of treatment (after 6 weeks’). Primary endpoint: end of treatment (after the 6‐week intervention). Primary outcome: changes in neuromuscular activity of PFM (measured with EMG). Other outcomes: impact of UI on quality of life (IIQ; quality of life defined as < 50 good, 50‐70 moderate, >70 poor). | |
| Notes | Losses to follow‐up at late pregnancy: PFMT 41/111 (of these 26 were excluded prior to PFMT); control 30/55 (of these 14 were excluded prior to no PFMT). Data on losses to follow‐up (reported on CONSORT flowchart, in the text and tables) are incongruent. Adverse events: no adverse effects were reported by women in the PFMT group. Funding: Faculty of Tourism and Recreation of the Gdansk University of Physical Education and Sport, Poland. Conflicts of interest: none declared. | |
| Risk of bias | ||
| Bias | Authors' judgement | Support for judgement |
| Random sequence generation (selection bias) | Low risk | “We randomized them to experimental or control groups with 2:1 ratio. For this purpose, we used STATISTICA software v. 10.0.” |
| Allocation concealment (selection bias) | Unclear risk | Unclear how allocation was concealed from the researchers. |
| Blinding of participants and personnel (performance bias) All outcomes | High risk | Not feasible. |
| Blinding of outcome assessment (detection bias) All outcomes | High risk | Unblinded reporting of UI self‐report outcomes because they were participant‐reported. |
| Incomplete outcome data (attrition bias) All outcomes | High risk | 23% dropout; differential loss (PFMT 18%; control 34%); not all reasons provided; no mention of imputation for missing data. |
| Selective reporting (reporting bias) | Low risk | Outcome measures described in the methods were reported in the results. |
| Other bias | Unclear risk | Data on losses to follow‐up (reported on CONSORT flowchart, in the text and tables) are incongruent. Numbers with UI symptoms unbalanced at baseline: PFMT 9/70, control 1/27. |
Torsdatter Markussen 2017.
| Study characteristics | ||
| Methods | Design: 2‐arm (parallel groups) RCT. | |
| Participants |
Number of participants: 91 pregnant women with a prepregnancy BMI ≥ 30.
Setting: St Olav’s Hospital, Trondheim, Norway.
Age: mean (SD), years: PFMT 31.3 (3.8); control 31.4 (4.7).
Parity: mean (SD): primiparous, PFMT 47.8%; control 42.2%. Multiparous, PFMT 52.2%, control 57.8%
Delivery: not reported.
BMI: mean (SD): PFMT 33.9 (3.8); control 35.1 (4.6).
Incontinence at recruitment: UI: PFMT 41.6%, control 44.1%; FI PFMT 35.3% (12/34), control 48.5% (16/33). Inclusion: aged ≥ 18 years, singleton pregnancy confirmed by ultrasound at 11‐ to 14 gestational weeks, previously sedentary, and without risk factors (apart from high BMI) for complications during pregnancy or preterm delivery, able to participate in testing and exercise training at St. Olav’s Hospital. Exclusion: pregnancy complications, high risk for preterm labour or diseases that would interfere with participation and habitual exercise training (twice or more weekly). |
|
| Interventions | PFMT (n = 46): as part of a small exercise group or individual sessions (three times per week, 60 min, from study inclusion to delivery) supervised by a physiotherapist. Each session included a warm‐up (10 min), endurance training (walking or running on treadmill; 35 min) and resistance training of the pelvic and back muscles and a progressive PFMT (25 min). PFMT consisted of 3 x 10 reps of 6‐8 sec sustained maximum contractions, followed by 3‐5 quick contractions. PFM contraction was confirmed by digital vaginal palpation by a gynaecologist, and instruction provided on correct PFM contraction. Participants were asked to do the 50‐min exercise programme at home at least once per week and daily home PFMT (same parameters as above). All were invited to attend a 30‐min motivational interview session at the beginning of the training period and received a standardised pamphlet containing general advice including PFMT. Self‐reported frequency of home PFMT was collected by questionnaire at baseline, late pregnancy and 3 months’ postpartum. Control (n = 45): usual care which consisted of 8 routine prenatal visits to midwife and/or general practitioner and a routine ultrasound at 8 weeks. Women were not told to refrain from exercise, physical activity or PFMT. Received standardised pamphlet containing general advice including PFMT. | |
| Outcomes | Measured at baseline (12‐18 weeks’ gestation), late pregnancy (34‐37 weeks’ gestation) and 3 months’ postpartum. Primary endpoint: 6‐8 weeks’ postpartum. Primary outcome: weight gain during pregnancy. Other outcomes: PFM strength (modified Oxford scale), urinary incontinence (UI Severity Index, Sandvik 2000), faecal incontinence (St. Mark’s score questionnaire), BMI, body composition, physical activity level, skin‐fold thickness, blood pressure, various blood tests, gestational diabetes mellitus, maternal hypertension. | |
| Notes | With the exception of incontinence data, baseline data were extracted from the secondary publication which reported on all women randomised. Details regarding the PFMT intervention were inconsistent between the primary and secondary publications. Losses to follow‐up at late pregnancy: PFMT 25/46; control 24/45 (total 53.8%). Losses to follow‐up at 3 months’ postpartum: PFMT 30/46; control 21/45 (total 56.0%). Funding: Funding for published trial on primary outcome (Garnæs 2016) supported by the Norwegian Fund for Post‐Graduate Training in Physiotherapy and the Liaison Committee between the Central Norway Regional Health Authority and the Norwegian University of Science and Technology. Conflicts of interest: none declared. | |
| Risk of bias | ||
| Bias | Authors' judgement | Support for judgement |
| Random sequence generation (selection bias) | Low risk | Computer‐generated random numbers. |
| Allocation concealment (selection bias) | Low risk | Remote computer‐based allocation, with allocation communicated to investigators after participant enrolment. |
| Blinding of participants and personnel (performance bias) All outcomes | High risk | Not feasible. |
| Blinding of outcome assessment (detection bias) All outcomes | High risk | Unblinded reporting of UI self‐report outcomes because they were participant‐reported. "The clinical tests were done by a gynecologist blinded for group allocation." |
| Incomplete outcome data (attrition bias) All outcomes | High risk | 56.0% dropout; differential between groups; similar reasons; no mention of imputation for missing data. Data on losses to follow‐up (reported on CONSORT flowchart, in the text and tables) are incongruent. |
| Selective reporting (reporting bias) | Low risk | Outcome measures described in the methods were reported in the results. |
| Other bias | Low risk | No other sources of bias were noted. |
Wen 2010.
| Study characteristics | ||
| Methods | Design: 2‐arm (parallel groups) RCT. | |
| Participants |
Number of participants: 148 postpartum women. Setting: 1 hospital, China. Age: years: range 21‐35 in both groups. Parity: primiparous. Delivery: natural vaginal. BMI: not reported. Incontinence at recruitment: not reported. Inclusion: delivery via natural birth. Exclusion: multiple births, history of genitourinary disease prior to or during pregnancy, neuromuscular disease, caesarean section or vaginal surgery. |
|
| Interventions |
PFMT (n = 75): twice per day, 15‐30 min each set (anal contraction for at least 3 sec hold when inhaling, followed by relaxation with 3‐5 faster contractions at the end of each time), for > 6‐8 weeks. Exercises taught by experienced midwives but it was unclear who supervised the programme or the number and type of contacts/visits. An obstetrician assessed participants PFM strength and contraction (no further details provided). Control (n = 73): no details provided other than "conventional guidance". |
|
| Outcomes | Measured immediately following childbirth and at 6 and 12 months' postpartum. Primary endpoint: unclear. Primary outcome: not reported. Outcomes: stress UI (criteria of ICS, 0‐5), pad test (UI defined as > 2 g), PFM strength (Oxford scale). |
|
| Notes | Losses to follow‐up not reported. Funding: not reported in translation. Conflicts of interest: not reported in translation. |
|
| Risk of bias | ||
| Bias | Authors' judgement | Support for judgement |
| Random sequence generation (selection bias) | Unclear risk | "Patients were randomised into two groups." |
| Allocation concealment (selection bias) | Unclear risk | "Patients were randomised into two groups." |
| Blinding of participants and personnel (performance bias) All outcomes | High risk | Not feasible. |
| Blinding of outcome assessment (detection bias) All outcomes | High risk | Unblinded reporting of UI self‐report outcomes because they were participant‐reported. Unclear if pad test and PFM strength blinded. |
| Incomplete outcome data (attrition bias) All outcomes | Unclear risk | Data not reported. |
| Selective reporting (reporting bias) | Low risk | Outcome measures described in methods were reported in results. |
| Other bias | Unclear risk | Information from this study was obtained from a Chinese publication and it is possible some information was lost in translation. |
Wilson 1998.
| Study characteristics | ||
| Methods |
Design: 2‐arm (parallel groups) RCT (note: usual care versus individual treatment; the individual treatment group was further randomised into 3, producing 4 comparison groups in total). Stratified by parity (1‐3, ≥ 4), number of leakage episodes (< 1 per day, ≥ 1 per day), and type of delivery (vaginal, caesarean). |
|
| Participants |
Number of participants: 230 women with UI symptoms, 3 months' postpartum. Setting: single centre, New Zealand. Age: mean (95% CI), years: PFMT 29 (28.8‐29.2); control 27.8 (27.0‐28.7). Parity: primiparous, PFMT 28%; control 33%. Delivery: PFMT 82% vaginal (50% perineal trauma), 18% caesarean; control 83% (56% perineal trauma) vaginal, 17% caesarean. BMI: not reported. < 1 leakage episode per day: PFMT 89%; control 89%. Inclusion: none reported in addition to above. Exclusion: none reported. |
|
| Interventions |
PFMT (n = 113): individual treatment: further randomised into (a) individualised PFMT (39 women), (b) individualised PFMT with vaginal cones (38 women) and (c) vaginal cones (36 women). In group (a) the PFMT comprised individual instruction by physiotherapist at 3, 4, 6 and 9 months' postpartum with use of perineometer at each visit for biofeedback. Women were to aim for 80‐100 voluntary PFM contractions daily, for up to 9 months. Control (n = 117): usual care comprising PFMT as taught by physiotherapists in antenatal classes (1 occasion) or daily classes on the postnatal wards (or audiotape at the weekend). |
|
| Outcomes | Measured at 12 months' postpartum. Primary endpoint: 12 months' postpartum. Primary outcome: not reported. Outcomes: postal questionnaire that included UI and FI, frequency of incontinence, frequency and amount of PFMT, general well‐being and sexual satisfaction. PFM strength (perineometry, mean of 3 maximal contractions) and home pad test. |
|
| Notes | Losses to follow‐up at 12 months: PFMT 59/113 (PFMT 20/38, PFMT with cones 24/38, cones 15/36); control 26/117 (total 37%). Funding: Health Research Council of New Zealand. Conflicts of interest: not reported. The mean time to teach PFMT to the intervention group was 32 minutes (95% CI 30 to 34). |
|
| Risk of bias | ||
| Bias | Authors' judgement | Support for judgement |
| Random sequence generation (selection bias) | Low risk | "Assignment was by means of a computer programme that used files stored in computer‐readable form to produce the next assignment. The assignment was stratified by parity (1‐3, or 4 or more). Number of incontinence episodes and type of delivery, and was blocked to produce even numbers after every 6 subjects in each of the strata." |
| Allocation concealment (selection bias) | Unclear risk | Not reported. |
| Blinding of participants and personnel (performance bias) All outcomes | High risk | Not feasible. |
| Blinding of outcome assessment (detection bias) All outcomes | High risk | Unblinded reporting of UI and FI self‐report outcomes because they were participant‐reported; pad test unblinded; perineometry blinded. |
| Incomplete outcome data (attrition bias) All outcomes | High risk | 37.0% dropout; differential loss (PFMT 52.2%; control 22.2%); similar reasons but different proportions; no mention of imputation for missing data. |
| Selective reporting (reporting bias) | Low risk | Outcome measures described in methods were reported in results. |
| Other bias | Low risk | No other sources of bias were noted. |
Woldringh 2007.
| Study characteristics | ||
| Methods | Design: 2‐arm (parallel groups) RCT. | |
| Participants |
Number of participants: 264 pregnant women. Setting: multiple centres, the Netherlands. Age: mean (95% CI), years: PFMT 31.9 (31.1‐32.7); 32.6 (32.0‐33.3). Parity: nulliparous, PFMT 38%; control 34%. Delivery: ≥ 55.3% had vaginal births, exact data not reported. BMI: mean (95% CI): PFMT 24.0 (23.2‐24.8); control 23.5 (22.9‐24.1). Incontinence before pregnancy: PFMT 53%; control 52%. Inclusion: already affected by UI (≥ 2 leakage episodes in the last month). Exclusion: already receiving treatment for UI, comorbidity (type(s) not reported), insufficient knowledge of Dutch language. |
|
| Interventions |
PFMT (n = 112): taught by physiotherapists specialised in PFMT (using a treatment manual prepared for the study in accordance with guidelines from the Dutch Society of Physiotherapists). 4 × 30‐min visits with 3 between 23 and 30 weeks' gestation, and 1 × 6 weeks' postpartum. Included observation and palpation of perineal body with voluntary PFM contraction, information to raise awareness of PFM and encourage PFMT, self‐palpation encouraged. Also 40‐page handbook with information about incontinence, PFM function, detailed instructions on PFMT. No further details of PFMT. Control (n = 152): routine care for pregnant women. Nearly two‐thirds received some instruction on PFMT. |
|
| Outcomes | Measured at 35 weeks, 8 weeks' postpartum, 6 months' postpartum, and 12 months' postpartum. Primary endpoint: 12 months' postpartum. Primary outcome: severity of UI (combination of severity of urine loss from 7‐day bladder diary and score from PRAFAB questionnaire). Secondary outcome: IIQ. |
|
| Notes | Losses to follow‐up at 35 weeks: PFMT 19/112; control 21/152 (total 15%). Losses to follow‐up at 8 weeks' postpartum: PFMT 25/112; control 27/152 (total 20%). Losses to follow‐up at 6 months' postpartum: PFMT 33/112; control 44/152 (total 29%). Losses to follow‐up at 12 months' postpartum: PFMT 47/112; control 53/152 (total 38%). Funding: Netherlands Organisation for Health Research and Development (Zon‐MW Nr 2200.0052). Conflicts of interest: not reported. |
|
| Risk of bias | ||
| Bias | Authors' judgement | Support for judgement |
| Random sequence generation (selection bias) | Low risk | "Allocated to an intervention or control group by computerised randomisation." |
| Allocation concealment (selection bias) | Unclear risk | Not reported. |
| Blinding of participants and personnel (performance bias) All outcomes | High risk | Not feasible. |
| Blinding of outcome assessment (detection bias) All outcomes | High risk | Unblinded reporting of UI self‐report outcomes because they were participant‐reported. |
| Incomplete outcome data (attrition bias) All outcomes | High risk | 37.9% dropout; slight differential loss (PFMT 42.0%; control 34.9%); similar reasons; no mention of imputation for missing data. |
| Selective reporting (reporting bias) | Low risk | Outcome measures described in methods were reported in results. |
| Other bias | Low risk | No other sources of bias were noted. |
Yang 2017.
| Study characteristics | ||
| Methods | Design: 3‐arm (parallel groups) RCT. | |
| Participants |
Number of participants: 240 primiparous women, with an episiotomy or second‐degree episiotomy tear.
Settings: Shijiazhuang Maternal and Child Health Care Hospital, Shijiazhuang, China.
Age: mean (SD), years: PFMT (1) 28.6 (2.2); PFMT (2) 28.3 (2.4); control 29.0 (2.0).
Parity: primiparous.
Delivery: PFMT (1) 31.8% vaginal, 68.2% assisted; PFMT (2) 31.4% vaginal, 68.6% assisted; control 30.0% vaginal, 70.0% assisted.
BMI: mean (SD): PFMT (1) 26.2 (1.9); PFMT (2) 26.3 (1.8); control 25.6 (1.5).
Incontinence at recruitment: not reported. Inclusion: aged 20‐35 years, primiparous with a single surviving baby, an episiotomy or second degree episiotomy tear during spontaneous vaginal delivery, an episiotomy as a result of instrumental delivery. Exclusion: heart disease, pacemaker, diabetes, high blood pressure, stress UI or pelvic organ prolapse, lochia (rubra, serosa or alba), laparotomy, cancer, nervous system disease. |
|
| Interventions | PFMT 1 (n = 80): unsupervised home exercise programme from 2 days to 3 months postpartum, 2‐3 times per day. Kegel exercises and pelvic movements (Jonasson 1989) were taught by two specialised staff members at 2 days’ postpartum (each training session went for 20 min with the exercises perform 6 times per min), with vaginal palpation used to confirm correct PFM contraction. PFMT 2 (n = 80): in addition to home PFMT this group received electrical stimulation administered by two specialised staff, 30 min, 3 times per week, beginning at 6 weeks’ postpartum (15 sessions in total). Control (n = 80): no PFMT, unclear if instructed not to perform PFMT. At 2 hours post‐delivery, two specialised training staff provided 1 hour of routine postpartum guidance. Note: groups PFMT 1 and PFMT 2 were combined as the intervention group for comparison with controls. | |
| Outcomes | Measured at 3 months’ postpartum. Primary endpoint: 3 months postpartum. Primary outcome: not reported. Other outcomes: POP‐Q score, Incontinence severity score, pad test (g), modified Oxford scale (graded 0‐5), pubic symphysis clearance (radiographic analyses), PFM electrophysiology. | |
| Notes | Losses to follow‐up at 2 days postpartum: PFMT (1) 6/80; PFMT (2) 5/80; control 2/80 (total 5.4%). Losses to follow‐up once discharged from hospital: PFMT (1) 14/80; PFMT (2) 10/80; control 20/80 (total 18.3%). Losses to follow‐up at 3 months’ postpartum: PFMT (1) 17/80; PFMT (2) 14/80; control 20/80 (total 21.3%). No baseline data of objective measures (qualitative or quantitative) that would allow comparison of pre‐ and post‐intervention. Adverse events: no adverse events related to the treatment were reported. Funding: not reported. Conflicts of interest: none declared. | |
| Risk of bias | ||
| Bias | Authors' judgement | Support for judgement |
| Random sequence generation (selection bias) | Low risk | Random number table. |
| Allocation concealment (selection bias) | Unclear risk | “Specialised staff responsible for sample selection”. “Admitted to three groups according to a random number table”. |
| Blinding of participants and personnel (performance bias) All outcomes | High risk | Not feasible. |
| Blinding of outcome assessment (detection bias) All outcomes | High risk | Unblinded reporting of UI self‐report outcomes because they were participant‐reported. Researchers blinded to group allocation. |
| Incomplete outcome data (attrition bias) All outcomes | High risk | 21.3% dropout; similar between groups; reasons provided for 7 participants; no mention of imputation for missing data. |
| Selective reporting (reporting bias) | Low risk | Outcome measures described in the methods were reported in the results. |
| Other bias | Low risk | No other sources of bias noted. |
BFLUTS: British Female Lower Urinary Tract Symptoms questionnaire; BMI: body mass index (kg/m²); CI: confidence interval; EMG: Electromyography; FI: faecal incontinence; ICIQ: International Consultation on Incontinence; ICIQ FLUTS: International Consultation on Incontinence‐Female Lower Urinary Tract Symptoms; ICIQ‐SF: International Consultation on Incontinence Questionnaire‐Short Form; ICS: International Continence Society; IIQ‐7: Incontinence Impact Questionnaire; IQR: interquartile range; min: minute; n: number of women; OAB‐q: Overactive Bladder Questionnaire; PERFECT: acronym with P = power (or pressure), E = endurance, R = repetitions, F = fast contractions and ECT = every contraction timed; PFDI‐20: Pelvic Floor Distress Inventory‐Short Form; PFIQ‐7: Pelvic Floor Impact Questionnaire‐Short Form; PFM: pelvic floor muscle; PFMT: pelvic floor muscle training; PISQ‐12: Pelvic Organ Prolapse/Urinary Incontinence Sexual Questionnaire; POP‐Q: Pelvic Organ Prolapse‐Quantification; RCT: randomised controlled trial; SD: standard deviation; sec: second; SF‐36: 36‐Item Short Form Health Survey; SIFCRAT: Sandwell Incontinence Following Childbirth Risk Assessment Tool; UDI‐6: Urogenital Distress Index‐Short Form; UI: urinary incontinence; UTI: urinary tract infection.
Characteristics of excluded studies [ordered by study ID]
| Study | Reason for exclusion |
|---|---|
| Agur 2005 | RCT. Pregnant women. Usual care versus PFMT. Excluded because did not collect data on UI or FI; primary outcome of interest was duration of 2nd‐stage labour. |
| Assis 2013 | Quasi‐RCT. Postpartum, multiparous women. PFMT versus unspecified control. Excluded because UI or FI were not an outcome; assessed PFM function. |
| Barakat 2014 | RCT. Pregnant women. PFMT (in an exercise group) versus usual care. Excluded because it did not collect data on UI or FI; outcomes were maternal and fetal parameters. |
| Barakat 2016 | RCT. Healthy, pregnant women. PFMT (as part of an exercise group) versus usual care. Excluded because did not collect data on UI or FI; primary outcome was hypertension during pregnancy. |
| Barakat 2018 | RCT. Pregnant women. PFMT (as part of an exercise group) versus usual care Excluded because no measure of UI or FI; primary outcomes were labour and delivery parameters. |
| Brik 2019 | RCT. Pregnant women. PFMT (as part of an exercise group) versus control (not discuouraged to do PFMT) Excluded because no measure of UI or FI; primary outcome was materal weight. |
| Chen 2018 | RCT (Chinese; abstract in English). PFMT versus PFMT and modified Buzhong Yiqi decoction; both groups received electrical stimulation and biofeedback. Excluded due to use of Chinese herbal medicine and uncertainty around the timing of the intervention ("early postpartum PF dysfunction"). |
| Culligan 2005 | RCT. Primigravid women. Sham versus active extracorporeal magnetic innervation after delivery; both groups did PFMT during pregnancy. Excluded because comparison of sham and active stimulation. |
| Dannecker 2004 | RCT. Primigravidae, pregnant women. PFMT with Epi‐No device versus no device. Excluded because the primary purpose of the study was to reduce perianal trauma. In addition, the maximum 3‐ to 4‐week duration of the intervention was deemed insufficient to change PFM strength (see also Dietz 2014). |
| Dias 2011 | RCT. Nulliparous pregnant women at 20 weeks' gestation. PFMT (in an exercise group and home exercises) versus control (no instruction on PFMT). Excluded because it did not collect data on UI or FI; assessed labour and newborn outcomes, including PFM strength. |
| Dias 2018 | RCT. Primiparous, pregnant women. PFMT (as part of a Pilates group) versus group exercise with no PFMT instuction. Excluded because no measure of UI or FI; primary outcome was PFM strength (manometry). |
| Dieb 2017 | RCT (ClinicalTrials.gov Identifier: NCT03287258; recruitment completed). Pregnant women. PFMT plus perineal massage versus control (educational PF dysfunction prevention programme). Excluded because no measure of UI or FI; primary outcome is proportion of participants with perineal tears. |
| Dietz 2014 | RCT. Primigravidae, pregnant women. Epi‐No versus unspecified control. Excluded because the Epi‐No device is designed to stretch the vagina and perineum, unclear if PFMT was part of the protocol (see Dannecker 2004), and did not collect data on UI or FI; outcome was levator avulsion. |
| Domingues 2015 | RCT (ongoing study). Pregnant women. PFMT (in an exercise group) versus no intervention. Excluded because UI or FI not stated as an outcome measure in trial protocol; assessment of preterm birth and pre‐eclampsia alongside other maternal and newborn measures. |
| Dougherty 1989 | RCT. Postnatal women within 6‐11 weeks of vaginal delivery. PFMT with intravaginal balloon device versus no treatment. Excluded because did not collect data on UI or FI. |
| El‐Shamy 2018 | RCT. Pregnant women. PFMT versus no PFMT (routine antenatal care). Excluded because no measure of UI or FI; primary outcome wad PFM strength. |
| Fynes 1999 | RCT. Postnatal women with FI following obstetric trauma. Sensory feedback versus audiovisual feedback (including electrical stimulation); both groups did PFMT. Excluded because comparison of 2 types of feedback. |
| Golmakani 2015 | RCT. Primiparous, postnatal women. PFMT versus usual care that included written instructions on PFMT. Excluded because did not collect data on UI or FI; outcomes were sexual self‐efficacy and PFM strength. |
| Gouldthorpe 2003 | RCT. Primiparous women. Abdominal muscle exercise versus no abdominal exercise. Excluded because not PFMT. |
| Han 2018 | RCT ("randomly divided"). Postnatal women. PFMT and shixiao powder and siwu decoction versus PFMT; both groups received electrical stimulation and biofeedback. Excluded due to use of Chinese herbal medicine. |
| Hou 2010 | RCT. Postpartum women. PFMT with vaginal dumbbell and electrical stimulation versus PFMT with vaginal dumbbell. Excluded because no measure of UI or FI; outcome was PFM strength. |
| Huang 2014 | RCT. Primiparous women. PFMT versus control ("traditional nursing"). Excluded because did not collect data on UI or FI; assessed labour outcomes and PFM strength. |
| Iervolino 2017 | RCT. Primiparous, postnatal women. PFMT (in an exercise groups) versus PFMT (home exercise programme) Excluded because no measure of UI or FI; primary outcome was sexual dysfunction. |
| Johannessen 2017 | RCT. Postnatal women. PFMT (individual supervision) versus usual care. Excluded as women included in the study were on average > 12 months postpartum at the time of recruitment. |
| Kamisan Atan 2016 | RCT. Nulliparous, pregnant women. Epi‐No versus usual care. Excluded because the Epi‐No device is designed to stretch the vagina and perineum, unclear if PFMT was part of the protocol (see Dannecker 2004), and did not collect data on UI or FI; main outcomes were levator ani, anal sphincter and perineal trauma. |
| Khorasani 2017 | RCT. Postnatal women. PFMT (home programme) versus no treatment Excluded as women included in the study were between 3‐6 months' postpartum at the time of recruitment. |
| Lekskulchai 2014 | RCT. Nulliparous pregnant women (5‐12 weeks' pregnancy). PFMT versus no‐PFMT (routine antenatal care). Excluded because outcome of study was bladder neck descent on perineal ultrasound, no incontinence outcomes. |
| Leon‐Larios 2017 | Quasi‐RCT. Primiparous, pregnant women. PFMT plus perinal massage versus control (no instruction on PFMT or perineal massage). Excluded because no measure of UI or FI; outcomes were labour, maternal and fetal parameters. |
| Li 2010 | RCT (no information provided about random sequence generation). Primiparous, pregnant women. PFMT versus no PFMT. Excluded as did not collect data on UI or FI; assessed labour outcomes and PFM strength. |
| Liu 2013 | RCT. Primigravidae, pregnant women. PFMT versus usual care. Excluded because no measure of UI or FI; outcome was PFM strength. |
| Mahmoodi 2014 | RCT. Primiparous, postnatal women. PFMT versus usual care. Excluded because did not collect data on UI or FI UI; outcome was postepisiotomy pain. |
| Mahony 2004 | RCT. Postnatal women with FI. Biofeedback versus biofeedback augmented with stimulation; both groups did PFMT. Excluded because comparison of 2 types of feedback. |
| Mason 1999 | RCT. Primiparous women recruited from postnatal wards. Conventional versus intensive physiotherapy. Excluded because cannot find any trial report (only record of trial on Medical Research Council trials database) and no response to letter to primary author. |
| Mason 2010 | RCT. Nulliparous, singleton pregnancy, no previous stress UI, 11‐14 weeks' pregnancy. PFMT versus usual care and instruction in PFMT. Excluded because there were internal inconsistencies in the data and the accuracy of the numbers was in doubt. |
| Min 2019 | RCT (ongoing study). Postpartum women PFMT with electrical stimulation versus PFMT Excluded because no measure of UI or FI; outcomes are pelvic organ prolapse, PFM strength, pelvic imaging measurements. |
| Morin 2015 | RCT. Primiparous, postnatal women with avulsion injury. PFMT versus usual care (plus a control arm of women without avulsion who received physiotherapy). Excluded because did not collect data on UI or FI; outcome was PFM morphometry. |
| Nielsen 1988 | RCT. Primiparous women. PFMT versus no PFMT. Excluded because did not collect data on UI or FI. |
| Norton 1990 | RCT. Primiparous women 6 weeks' postnatal. PFMT versus vaginal cones vs controls. Excluded because did not collect data on UI or FI. |
| Oblasser 2016 | RCT. Postnatal women. Licensed PFMT vaginal ball versus usual care that included written PFMT exercises. Excluded as no formal PFMT provided to women in the intervention group. |
| Okido 2015 | RCT. Primigravidae, pregnant women. PFMT versus usual care. Excluded because did not collect data on UI or FI; outcomes were uteroplacental and fetoplacental blood flow. |
| Perales 2015 | RCT. Pregnant women. PFMT (as part of an exercise group) versus usual care. Excluded because no measure of UI or FI; primary outcome was maternal depression levels. |
| Perales 2016 | RCT. Healthy, pregnant women. PFMT (as part of an exercise group) versus usual care. Excluded because did not collect data on UI or FI; primary outcomes were the effects of exercise on the maternal cardiovascular system and on risk factors for cardiovascular disease. |
| Pourkhiz 2017 | RCT. Nulliparous, pregnant women. PFMT versus usual care Excluded because no measure of UI or FI; primary outcome was sexual function. |
| Ruiz 2013 | RCT. Pregnant women. PFMT (as part of an exercise group) versus usual care. Excluded because did not collect data on UI or FI; assessed gestational bodyweight gain and fetal outcomes. |
| Santos‐Rocha 2015 | RCT. Pregnant women. PFMT (as part of an exercise group) versus usual care Excluded because no measure of UI or FI; outcomes were physical activity level, and other maternal and fetal parameters. |
| Siva 2014 | RCT. Primigravidae, pregnant women. PFMT (as part of a "motor relearning programme") versus PFMT. Excluded because did not collect data on UI or FI; outcome was PFM strength. |
| Taskin 1996 | Quasi‐randomised RCT (day of week). Primigravidae. Intervention PFMT with or without episiotomy or caesarean section. Excluded because of mixed intervention and inappropriate controls. |
| Teymuri 2018 | RCT. Postpartum women with persistent lumbopelvic pain. PFMT plus biofeedback versus electrotherapy modalities Excluded because no measure of UI or FI, and women were recuited > 3 months postpartum; outcomes were pain (lumbopelvic), disability and PFM function. |
| Thorp 1994 | RCT. Nulliparous women recruited through advertisement. Unclear if PFMT or vaginal cones versus controls. Excluded because it was unclear whether the intervention was PFMT or vaginal cones, neither were data on UI or FI collected. |
| Wang 2014 | RCT. Nulliparous, pregnant women. PFMT plus phone follow‐up once every 2 weeks versus PFMT. Excluded because did not collect data on UI or FI; assessed delivery outcomes and PFM strength. |
| Wilson 2015 | Pilot RCT. Pregnant women. PFMT (as part of web‐based PFM education prgoramme) versus usual care. Excluded because no measures of UI or FI; outcomes were awareness and knowledge of PFM, confidence in and belief about engaging in PFME, and adherence to PFMT. |
| Zhu 2012 | Quasi‐RCT. Postnatal women. PFMT with electrical stimulation versus usual care. Excluded as unclear when women were recruited after delivery. Possible that the women included in the study were > 12 months' postpartum at the time of recruitment because the mean age of the sample was 34 years, which is substantially higher than other trials conducted in a similar context (see Liu 2011 or Wen 2010). |
FI: faecal incontinence; PF: pelvic floor; PFM: pelvic floor muscle;PFME: pelvic floor muscle education; PFMT: pelvic floor muscle training; RCT: randomised controlled trial; UI: urinary incontinence.
Characteristics of studies awaiting classification [ordered by study ID]
Hoseinkhani 2018.
| Methods | Design: RCT (Pan African Clinical Trials Registry: RCT "randomly divided"). |
| Participants | Number of participants: 36 primiparous women in Najafabad city, Iran. Inclusion: not stated. Exclusion: not stated. |
| Interventions | Kegel exercises. Central stability training. Combined exercises. All participants trained 3 times per week, for 6 weeks'. |
| Outcomes | Trunk muscle endurance and quality of life (SF‐36). |
| Notes | Abstract is in Farsi, and translation required. Unclear if UI or FI are outcome measures. |
Longo 2013.
| Methods | Design: RCT. |
| Participants |
Number of participants: 232 nulliparous women. Inclusion: not reported. Exclusion: not reported. |
| Interventions |
PFMT (n = 84). Control (n = 148): unknown. |
| Outcomes | Pelvic dysfunction, perineal trauma, episiotomy. |
| Notes | From this abstract we are unable to determine if this study addresses a population of interest and although it refers to postpartum incontinence, no data are provided. Awaiting full publication. |
Ngugi 2015.
| Methods | Design: RCT (Pan African Clinical Trials Registry: PACTR201407000834391). |
| Participants | Number of participants: 66 primiparous women between 14 to 24 weeks' gestation. Inclusion: Black African descent, aged 18 years and older. Exclusion: pre‐existing UI, severe medical illness requiring recurrent hospital admissions, or that would affect compliance to training programme, obstetrical conditions likely to lead to pre‐term delivery, history suggestive of collagen disorders. |
| Interventions | PFMT (n = 33): PFMT supervised by a physiotherapist and continence nurse, up to 37 weeks' gestation. Control (n = 33): usual care. |
| Outcomes | Primary: UI at 6 weeks postpartum assessed with the ICIQ‐SF. Other: the effect of mode of delivery on incidence of postpartum UI and determining contributory factors (e.g. smoking, BMI, age, cultural practices) in this population on the incidence of postpartum UI. |
| Notes | Unpublished thesis. Authors contacted to obtain copy of thesis, no response received. |
Sun 2015.
| Methods | Design: 2‐arm (parallel groups) RCT. |
| Participants | Number of participants: 324 women. Inclusion: pregnant women who gave birth to a single child at term. Exclusion: patients with a history or UI or FI prior to pregnancy, pelvic organ prolapse, history or induced labour, multiple pregnancy, a baby that weighed < 2500 g or > 4000 g, BMI > 25 kg/m², asthma, chronic cough or constipation (> 1 month), diabetes mellitus, sciatica, history of pelvic surgery. |
| Interventions |
PFMT (n = 200): electrical stimulation plus biofeedback. Control (n = 124): home exercise. |
| Outcomes | Muscle fibre strength and fatigue, vaginal dynamic pressure (cm of water), POP‐Q, PFIQ‐7, PISQ‐12. |
| Notes | No description has been provided of the intervention in either group. It is unclear in the PFMT group whether muscle contractions were voluntary or stimulated. |
Zhou 2009.
| Methods | Design: unknown. |
| Participants | Unknown. |
| Interventions |
PFMT. Control: unknown. |
| Outcomes | Unknown. |
| Notes | No further details of this research available. This Master's thesis has been requested and, if available, will require translation. |
BMI: body mass index; FI: faecal incontinence; ICIQ‐SF: International Consultation on Incontinence Questionnaire‐Short Form; n: number of women; PFIQ: Pelvic Floor Impact Questionnaire; PISQ: Pelvic Organ Prolapse/Urinary Incontinence Sexual Questionnaire; PFMT: pelvic floor muscle training; POP‐Q: Pelvic Organ Prolapse‐Quantification; SF‐36: 36‐Item Short Form Health Survey; UI: urinary incontinence.
Characteristics of ongoing studies [ordered by study ID]
ACTRN12609001005246.
| Study name | Effects of pelvic floor muscle training on pelvic floor muscle function in women during their first pregnancies measured by perineometer |
| Methods | Design: RCT (Australian New Zealand Clinical Trial Registry: ACTRN12609001005246). |
| Participants |
Number of participants: 15 nulliparous women. Inclusion: 1st pregnancy, aged 18‐40 years. Exclusion: pregnancy complications. |
| Interventions |
PFMT: 30‐min sessions, once per week for 16 weeks, starting at 20 weeks' gestation. Control: no PFMT. |
| Outcomes |
Primary outcome: PFM function (perineometry and digital palpation). Secondary outcome: self‐reported UI. |
| Starting date | 2007. |
| Contact information | Cristine Ferreira, Av. Bandeirantes, 3900: Monte Alegre: CEP: 14049‐900 Ribeirão Preto/SP, Brazil. |
| Notes | Trial completed and paper in preparation for publication. |
Buen 2014.
| Study name | Influence of the practice of Pilates on the Incidence of Urinary Incontinence, perineal strength, low back pain in the third trimester |
| Methods | Design: RCT (Brazilian Registry of Clinical Trials: UTN: U1111‐1155‐5315). |
| Participants | 80 primiparous women, 20‐25 weeks' gestation. Inclusion: reported UI prepregnancy and low back pain, single fetus. Exclusion: neurological disorders that resulted in cognitive deficits or motor disorders of the lower limbs, physical or mental (or both) limitations, restrictive lung or heart disease, regular physical exercise of Pilates in the past 6 months, prepregnancy BMI ≥ 30. |
| Interventions |
Pilates sessions (n = 40): 20 in total (twice per week), 60‐min duration. Guided walks (n = 40): 2‐3 times per week for 30 min, daily PFM strengthening exercises. |
| Outcomes |
Primary outcome: UI assessed with "urinary incontinence" questionnaire, low back pain assessed with visual analogue scale. Secondary outcome: PFM strength with surface electromyography. |
| Starting date | May 2014. |
| Contact information | Mariana Buen, Faculdade de Ciências Médicas da Universidade Estadual de Campinas, Brazil. |
| Notes | Recruitment status unknown, as registry last updated in September 2014. Awaiting full publication to determine if Pilates sessions included any voluntary PFM contractions. |
Haruna 2014.
| Study name | Effect of postpartum pelvic floor muscle training with ultrasound biofeedback on recovery of pelvic floor muscle function: a randomized controlled trial |
| Methods | Design: 3‐arm RCT (UMIN Clinical Trial Registry: UMIN000015878). |
| Participants | 180 primiparous postpartum women. Inclusion: primiparous postpartum women. Exclusion: caesarean section, multiple birth or breech delivery, incontinence before pregnancy, neuropathic UI and FI, restricted physical activity, aged < 20 years. |
| Interventions |
Intervention group 1: PFMT with ultrasound biofeedback. Intervention group 2: PFMT without ultrasound biofeedback. Control: Usual care. |
| Outcomes |
Primary outcome: PFM function assessed with ultrasound. Secondary outcomes: UI assessed with ICIQ‐SF and I‐QOL; FI assessed with FISI, FIQL and Wexner score; PFDI‐20, PFM exercise self‐efficacy scale, fatigue feelings (Jikakusho shirabe). |
| Starting date | December 2014. |
| Contact information | Megumi Haruna, Division of Health Sciences & Nursing, Graduate School of Medicine, University of Tokyo, Japan. |
| Notes | Registry updated in December 2016; recruitment completed. Contacted author, and paper has been submitted for peer review. |
Haruna 2016.
| Study name | A randomized controlled trial of transabdominal ultrasound biofeedback in postpartum pelvic floor muscle training for primiparous and multiparous women |
| Methods | Design: RCT (UMIN Clinical Trial Registry: UMIN000025165). |
| Participants | 164 postpartum women. Inclusion: > 20 years of age. Exclusion: caesarean section, multiple birth or breech delivery, incontinence prior to pregnancy, neuropathic UI or FI, restricted physical activity, < 20 years of age. |
| Interventions | PFMT: PFMT with trans‐abdominal ultrasound biofeedback. Control: PFMT with no trans‐abdominal ultrasound biofeedback. |
| Outcomes | Primary outcome: PFM function assessed with ultrasound. Secondary outcome: UI assessed with ICIQ‐SF, and Incontinence quality of life scale questionnaire (I‐QOL); FI assessed with the faecal incontinence severity index (FISI), faecal incontinence quality of life scale (FIQL) and Wexner score; pelvic floor distress inventory‐20 (PFDI‐20), PFM exercise self‐efficacy scale, fatigue feelings (Jikakusho shirabe). |
| Starting date | December 2016. |
| Contact information | Megumi Haruna, Division of Health Sciences & Nursing, Graduate School of Medicine, University of Tokyo. |
| Notes | Registry updated in June 2018; recruitment completed; follow‐up completed March 2018. Contacted author and currently analysing data. |
Hendler 2017.
| Study name | The influence of manual fascial manipulation on the function of the pelvic floor in pregnant women |
| Methods | Design: RCT (Clinical Trials.gov Identifier: NCT03041246). |
| Participants | 80 pregnant women. Inclusion: 20‐45 years of age, 24‐30 weeks' gestation, singleton pregnancy, multiparous. Exclusion: primiparous, > 30 weeks' gestation, high risk pregnancy (premature contractions, cervical insufficiency, placenta previa, placenta accrete), multifetal pregnancy, maternal conditions (e.g. connective tissue disease, neurological illness). |
| Interventions | PFMT: with pelvic floor fascial mobilisation. Control: guidance for strengthening pelvic floor with on other intervention. |
| Outcomes | Primary: PFM strength assessed with Oxford scale, PFM contraction pressure measured using perineometry. Secondary: UI and FI measured with PFDI‐20, forced expiratory volume, Voice Handcap Index‐10. |
| Starting date | February 2017. |
| Contact information | Israel Hendler, Sheba Medical Center, Ramat Gan, Israel. |
| Notes | Registry updated July 2018; estimated study completion date February 2019. |
Lijun 2018.
| Study name | Clinical study of pelvic floor electrical stimulation combined with traditional Chinese medicine and acupoint sticking in the treatment of postpartum urinary incontinence (Qi Deficiency syndrome) |
| Methods | Design: RCT (Chinese Clinical Trial Registry identifier: ChiCTR1800014351). |
| Participants | 160 postnatal women. Inclusion: 20‐35 years of age, full‐term single birth, stress UI, postpartum enuresis syndrome of Qi deficiency dialectical standard, willing to participate in the treatment and attend follow‐up sessions, willing to voluntarily participate and sign informed consent. Exclusion: vaginitis, systemic conditions (e.g. heart disease, diabetes, hypertension, neurological conditions), poor compliance, history of gynaecological surgery, urinary infection. |
| Interventions | Intervention group 1: traditional Chinese medicine. Intervention group 2: acupoint sticking. Intervention group 3: biofeedback. Intervention group 4: Chinese medicine and acupoint sticking. Intervention group 5: Chinese medicine and biofeedback. Intervention group 6: acupoint sticking and biofeedback. Intervention group 7: biofeedback, Chinese medicine and acupoint sticking. Control: PFMT. |
| Outcomes | Primary outcomes: PFM strength, UI symptoms (pad test). Secondary outcomes: Quality of life (PFDI‐20), sexual quality of life (FSFI). |
| Starting date | January 2018. |
| Contact information | Ruan Lijun, The Fifth Affiliated Hospital of Southern Medical University, Guangdong, China. |
| Notes | Registry updated in January 2018; not yet recruiting. |
Mesk 2018.
| Study name | The effectiveness of theory based intervention using social media to reduce urinary incontinence among postpartum women in Hebron city hospitals |
| Methods | Design: RCT (ISRCTN registry: 13224744). |
| Participants | 120 postpartum women. Inclusion: postpartum women with UI, 20‐40 years of age, vaginal delivery, own a smart phone. Exclusion: chronic obstructive pulmonary disease, neurological disorders, diabetes mellitus, arterial hypertension, urinary tract infection, kidney stones, history of pelvic surgery. |
| Interventions | PFMT: home PFMT plus weekly contact via social messaging (information and reminder to do PFMT). Control: usual care. After 6 months will receive the same intervention as the PFMT group. |
| Outcomes | Primary: severity of UI (ICIQ‐SF). Secondary: adherence to PFMT (Exercise Adherence Rating Scale). |
| Starting date | August 2018. |
| Contact information | Zeenat Mesk, Department of Community Health, University Putra Malaysia. |
| Notes | Registry updated in March 2019; recruitment completed. |
Moossdorf‐Steinhauser 2019.
| Study name | Long term effects of multidisciplinary assessment and pre‐ and post‐partum Pelvic Floor Muscle Group Treatment in primigravid with stress urinary incontinence compared to care‐as‐usual: a randomised controlled trial (Motherfit) |
| Methods | Design: 2 RCTs, Motherfit 1 and Motherfit 2 (Netherlands Trial Register: NTR5971). |
| Participants | 240 pregnant and/or postpartum women with stress UI. Inclusion: ≥ 18 years of age, UI (stress or mixed), a score of > 3 on the ICIQ‐SF questionnaire, motivated to participate in the motherfit programme, competent to speak and understand Dutch language, able to access to a mApp on a tablet. Exclusion: UI prior to first pregnancy that continues during pregnancy, high risk pregnancy resulting in contraindication to high intensity PFM exercises, significant exercise limitations or co‐morbidities (physical or psychological) that would impede participation in motherfit group therapy, chronic neurological disorders or diseases related to UI, urinary tract infection, anti‐incontinence or urogynaecological surgery, women who are expected to be lost to follow‐up, recent pelvic physiotherapy (< 6 months), refusal to use a mApp. |
| Interventions |
PFMT (n = 40): group training sessions with intensive PFMT and general fitness (as per Bø 1999), 8 sessions. Individualised home PFMT programme (using a mApp to encourage adherence and compliance). Control (n = 40): usual care which may or may not include PFMT. |
| Outcomes | Primary outcome: self‐reported UI (ICIQ‐SF) at 18 months postpartum. Secondary outcome: self‐reported improvement (Patient Global Impression of Severity), urinary‐specific quality of life (IIQ‐7), general activity level (diary), adherence to home PFMT (training diary), cost‐effectiveness (EQ‐5D‐5L), and participant satisfaction. |
| Starting date | December 2016. |
| Contact information | Bary Berghmans, Maastricht University Medical Center (MUMC+), the Netherlands. |
| Notes | Trial protocol published; registry states anticipated date of study completion is December 2020. |
NCT00763984.
| Study name | PERL 4: Promoting effective recovery from labour. Self‐care to prevent birth‐related urinary incontinence in diverse women |
| Methods | Design: RCT (ClinicalTrials.gov Identifier: NCT00763984). |
| Participants | 432 pregnant nulliparous or multiparous women of African American, Caucasian or Hispanic ethnicity. Inclusion: ≥ 18 years of age, able to understand and read English or Spanish, low risk antepartum (1st, 2nd or 3rd pregnancy), 16‐25 weeks' gestation, expecting a vaginal birth, have lost no more than a few drops of urine as often as every other day, no previous or current UI treatment, no history of serious medical or neurological conditions, do not have a chronic urinary tract infection. Exclusion: if participant does not meet all of the above criterion for inclusion. |
| Interventions |
PFMT: PFMT (as defined by the International Continence Society) and bladder training as part of a bladder health class. Women's knowledge, adoption and maintenance of PFMT and bladder training monitored. Control: usual care, which may include PFMT. Women's knowledge, adoption and maintenance of PFMT monitored. |
| Outcomes |
Primary outcome: incidence and severity of UI at 12 months' postpartum. 3‐year follow‐up period. |
| Starting date | October 2007. |
| Contact information | Carolyn Sampselle, School of Nursing, University of Michigan, USA. |
| Notes | Study complete (as verified on trial register in January 2015). Author contacted to confirm status of study, no response received. |
NCT02270008.
| Study name | Reducing perinatal anal incontinence through early pelvic floor muscle training: a prospective pilot study |
| Methods | Design: feasibility RCT (ClinicalTrials.gov Identifier: NCT02270008). |
| Participants | 100 parous women. Inclusion: parous women, aged 20‐40 years, new obstetrician visit prior to 20 weeks' gestation, confirmed singleton live intrauterine pregnancy. Exclusion: history of anal incontinence or prolapse, history of surgery or procedures for urinary or anal incontinence or pelvic organ prolapse, tobacco use, diabetes mellitus, history of sexual trauma, chronic cough, chronic constipation, known connective tissue disorder. |
| Interventions |
PFMT: 1‐to‐1 with a trained nurse practitioner (1 session), with PFMT at home. Control: usual care: including written PFM exercises. |
| Outcomes |
Primary outcome: incidence of FI or flatal incontinence assessed with standardised questionnaires. Secondary outcome: PFMT compliance (exercise diary). |
| Starting date | October 2014. |
| Contact information | Deborah Karp, Emory University, USA. |
| Notes | Registry updated in January 2016; recruitment completed in June 2015. |
NCT02334397.
| Study name | Bump on the ball: impact of a prenatal exercise & education program on birth outcomes & maternal quality of life |
| Methods | Design: RCT (ClinicalTrials.gov Identifier: NCT02334397). |
| Participants | 120 pregnant women. Inclusion: singleton, primiparous pregnancy, delivering at Prentice Women's Hospital, able to participate based on PARmedX for pregnancy criteria. Exclusion: non‐English or Spanish speaking, aged < 18 years, known condition requiring caesarean section, currently enrolled in any type of physiotherapy, unable to complete the programme secondary to medical limitations. |
| Interventions |
PFMT: as part of a fitness and education programme ("total control") that combines PFM and core muscle strengthening and education (around aspects of labour and delivery process), 1 class per week for 6 weeks. Women also to wear pedometers to monitor general activity. Control: no intervention. |
| Outcomes |
Primary outcomes: type of birth (spontaneous vs operative vaginal delivery) and indications for operative vaginal delivery. Secondary outcomes: obstetrical complications, level of concern about birthing experience (Penn State Worry Questionnaire), knowledge about birthing experience, PF symptoms (PFDI), sexual function (PISQ‐12), satisfaction with birthing experience, postpartum depression and risk factors (Edinburgh Postnatal Depression Score). |
| Starting date | February 2016. |
| Contact information | Christina Lewicky‐Gaupp, Northwestern University, USA. |
| Notes | Registry updated in October 2019; recruitment completed June 2019. |
NCT02420288.
| Study name | Effect of physical exercise programme on fetoplacental growth: a randomised controlled trial |
| Methods | Design: RCT (ClinicalTrials.gov Identifier: NCT02420288). |
| Participants | 124 healthy pregnant women. Inclusion: able to exercise according to the American College of Obstetricians and Gynecologists guidelines, able to communicate in Spanish, giving birth at Hospital Universitario de Torrejón, Hospital Universitario de Puerta de Hierro or Hospital Universitario Severo Ochoa (Madrid, Spain). Exclusion: multiparous, obstetric complications, > 18 weeks' gestation, unable to attend the physical exercise programme, aged < 18 years or > 45 years. |
| Interventions |
PFMT: as part of a supervised exercise group, 3 times per week, 16‐38 weeks' gestation. Session duration 55‐60 min with 10 min PFMT. Control: no intervention. |
| Outcomes |
Primary outcomes: maternal weight gain during pregnancy, fetal and placental weight. Secondary outcomes: various maternal outcomes including postnatal depression, gestational diabetes and UI (measured with ICIQ‐SF), and fetal outcomes. |
| Starting date | November 2014. |
| Contact information | Ruben Barakat, Universidad Politecnica de Madrid. |
| Notes | Registry update June 2019; active, not recruiting. Awaiting publication of UI and FI data. |
NCT02682212.
| Study name | Obstetric Perineal Trauma, Pelvic Floor Symptoms and Early Physiotherapy Intervention. |
| Methods | Design: RCT (ClinicalTrials.gov Identifier: NCT02682212). |
| Participants | 80 healthy postpartum women. Inclusion: primiparas after vaginal delivery at Landspitali University Hospital, aged ≥ 18 years, diagnosed UI at 6 weeks' postpartum, able to attend the intervention and answer the Australian Pelvic Floor Questionnaire. Exclusion: diseases or conditions that interfere with PF function (other than childbirth), unable to understand Icelandic, cognitive disabilities. |
| Interventions |
PFMT: delivered by a physiotherapist with vaginal/rectal pressure feedback once per week, plus daily home exercises, for 12 weeks. Control: usual care. |
| Outcomes |
Primary outcome: UI (Australian Female Pelvic Floor Questionnaire). Secondary outcomes: faecal/flatal incontinence, sexual dysfunction, quality of life (Australian Female Pelvic Floor Questionnaire), PFM strength. |
| Starting date | March 2016. |
| Contact information | Thora Steingrimsdottir, Landspitali University Hospital/University of Iceland, Reykjavik, Iceland. |
| Notes | Registry updated in April 2019; recruitment completed January 2018. |
NCT03247660.
| Study name | Effectiveness of perineal physiotherapy in the prevention and treatment of pelvic floor dysfunction in postpartum |
| Methods | Design: 3‐arm RCT (Clinical Trials.gov Identifier: NCT03247660). |
| Participants | 240 postnatal women. Inclusion: 18‐45 years of age, primiparous, 6‐8 weeks' following vaginal delivery in the Príncipe de Asturias hospital, no treatment for PF dysfunction, literate and able to provide informed consent. Exclusion: medical diagnosis of PF dysfunction prior to pregnancy and delivery, history of conservative treatment or surgery for PF dysfunction, concomitant or systematic diseases, active or recurrent urinary infection or haematuria, unable to understand the information, respond to questionnaires, consent and/or participate in the study. |
| Interventions | Intervention group 1: PFMT, biofeedback and hypopressive exercises, twice a week for 8 weeks. Intervention group 2: hypopressive exercises, twice a week for 8 weeks. Control: PFMT, once a week for 8 weeks. |
| Outcomes | Primary outcome: Pelvic floor impact questionnaire‐short form (PFIQ‐7), incontinence‐specific quality of life (PFDI‐20), PFM strength (manometry, dynamometry and Oxford scale). |
| Starting date | August 2017. |
| Contact information | María Torres‐Lacomba, University of Alcalá, Alcalá de Henares. |
| Notes | Registry updated in August 2017; recruiting. |
Schreiner 2016.
| Study name | Impact of pelvic floor physiotherapy during pregnancy in urinary incontinence and delivery |
| Methods | Design: RCT (Brazilian Registry of Clinical Trials: UTN: U1111‐1184‐9871). |
| Participants | 96 primiparous women. Inclusion: 12‐20 weeks' gestation, aged 12‐50 years. Exclusion: diabetes, fetal malformation, vaginal delivery unfeasible, UI. |
| Interventions |
PFMT (n = 48): once per week over 12 weeks (supervised by a physiotherapist), 12‐32 weeks' gestation. Perineal massage and elongation of PFM (supervised by a physiotherapist), once per week over 4 weeks, 34‐38 weeks' gestation. Control (n = 48): unspecified (but no physiotherapy intervention). |
| Outcomes |
Primary outcome: self‐reported UI (ICIQ‐SF). Secondary outcome: perineal laceration. |
| Starting date | July 2016. |
| Contact information | Lucas Schreiner, Pontifícia Universidade Católica do Rio Grande do Sul, Porto Alegre, Brazil. |
| Notes | Registry updated in September 2016, with recruitment ongoing. Estimated date of last enrolment was December 2017. |
Sobhgol 2019.
| Study name | Evaluation of the effect of an antenatal pelvic floor muscle exercise programme on female sexual function during pregnancy and the first 3 months following birth: study protocol for a pragmatic randomised controlled trial |
| Methods | Design: RCT (Australian New Zealand Clinical Trial Registry: ACTRN12617001030369). |
| Participants | 200 pregnant women. Inclusion: primiparous, >18 years of age, ≤ 22 weeks' gestation, singleton pregnancy, anticipating a vaginal birth, no history of UI, pelvic surgery or pelvic organ prolapse, no previous history of depression, mental illness, alcohol and drug use or domestic violence, able to read, understand and communicate in English. Participants in PFMT group to only perform PFMT prescribed in the study. Exclusion: > 22 weeks' gestation, planning to give birth via caesarean section, multiparous, multiple or complicate pregnancy, known PFM dysfunction, unable to read and understand English. |
| Interventions | PFMT (n = 100): usual care plus initial education session (PFM function, benefits of PFMT, shown how to perform PFM contraction, pamphlet and daily 15 min home exercise programme. Control (n = 100): usual care, women not discouraged from performing PFMT. |
| Outcomes | Primary outcome: sexual function assessed with FSFI. Secondary outcome: various childbirth outcomes, UI symptoms and specific quality of life measures (UDI‐6, IIQ‐7), FI symptoms (Wexner short form of faecal incontinence questionnaire), depression (Edinburgh Postnatal Depression Scale), relationship with partner (Relationship Assessment Scale), expectation of treatment, PFMT compliance (diary). |
| Starting date | February 2018. |
| Contact information | Sahar Sobhgol, School of Nursing and Midwifery, Western Sydney University, Australia. |
| Notes | Registry updated in November 2019; recruitment completed June 2019. |
Torabipour 2019.
| Study name | Determine the effect of physiotherapy in women's sexual function and incontinence after first child birth |
| Methods | Design: RCT (Iranian Registry of Clinical Trials registration number: IRCT20160521027998N7). |
| Participants | 114 postnatal women. Inclusion: 15‐45 years of age, primiparous > 8 weeks following natural birth, a term and healthy baby, no medical and psychological disease, disuse of alcohol and sexual function drugs, no forceps or vacuum. Exclusion: pregnancy during study, lack of cooperation to continue physiotherapy, addiction, athletic suffering from uterine prolapse, cyctocele, rectocele (grade 3, 4). |
| Interventions | PFMT: PFMT, weekly for 2 months. Control: usual postpartum advice (no physiotherapy). |
| Outcomes | Primary outcome: sexual function (FISI), UI and FI (PFDI‐20). Secondary outcome: requirement for physiotherapy 4 months' after delivery. |
| Starting date | January 2019. |
| Contact information | Maryam al‐Sadat Torabipour, Al‐Zahra Hospital, Isfahan, Iran. |
| Notes | Registry updated in March 2019; recruitment complete. |
Vasconcelos 2018.
| Study name | Prevention of urinary incontinence in postpartum women |
| Methods | Design: RCT (Brazilian Registry of Clinical Trials: UTN: U1111‐1212‐6567). |
| Participants | 408 postnatal women. Inclusion: > 18 years of age, mobile phone or similar that is compatible with the application. Exclusion: women with UI or pelvic organ prolapse, gynaecological surgery for correction of previous PF dysfunction, pelvic radiotherapy, collagen diseases, apparent mental state that makes collection impossible. |
| Interventions | PFMT (n = 204): PFMT for 12 weeks with information about PF anatomy, physiology and PFMT available on social messaging app. Control (n =204): usual care. |
| Outcomes | Primary outcome: self‐reported prevalence of UI. Secondary outcome: knowledge, attitude and practice of women on UI, adherence to PFMT and motivation, satisfaction and mastery of the app. |
| Starting date | June 2018. |
| Contact information | Camila Teixeira Moreira Vasconcelos, Universidade Federal do Ceará, Fortaleza, Brazil. |
| Notes | Registry updated July 2018; estimated date of last enrolment December 2018. |
Velez‐Sanchez 2015.
| Study name | Perineal muscle training versus usual prenatal care in the incidence of avulsion of the levator ani muscle at first birth of Mexican women: randomized control trial |
| Methods | Design: RCT (ClinicalTrials.gov Identifier: NCT02513420). |
| Participants | 228 pregnant women. Inclusion: pregnant women aged > 18 years with a single fetus, without contraindications to delivery, with no previous PF damage due to childbirth, with or without symptoms of PF dysfunction, < 33 weeks' gestation, physical and cognitive abilities to enable participation in programme. Exclusion: any contraindication to labour, avulsion of the levator ani muscle, previous pregnancies > 20 weeks' gestation delivered via caesarean section. |
| Interventions |
PFMT: perineal massage and PFMT from 33 weeks' gestation onwards, once per week until delivery. Control: usual care. |
| Outcomes | Levator ani avulsion (assessed by palpation and ultrasound), symptoms of PF dysfunction (Spanish Pelvic Floor Disability Index‐20 questionnaire), morphological changes of genital hiatus and perineal body, "accomplishment" of PFMT. |
| Starting date | July 2015. |
| Contact information | Daniel Velez‐Sanchez, Mexican College of Gynecology and Obstetrics. |
| Notes | Registry updated in July 2018; recruitment completed. Study completion date was July 2019. |
BMI: body mass index (kg/m²); FI: faecal incontinence; FIQL: Faecal Incontinence Quality of Life scale; FISI: Faecal Incontinence Severity Index; FSFI: Female Sexual Function Index; I‐QOL: Incontinence Quality of Life Scale Questionnaire; ICIQ‐SF: International Consultation on Incontinence Questionnaire‐Short Form; IIQ‐7: Incontinence Impact Questionnaire; min: minute; n: number of women; PF: pelvic floor; PFDI‐20: Pelvic Floor Distress Inventory‐20; PFM: pelvic floor muscle; PFMT: pelvic floor muscle training; PISQ‐12: Pelvic Organ Prolapse/Urinary Incontinence Sexual Questionnaire; RCT: randomised controlled trial; UDI‐6: Urogenital Distress Index‐Short Form; UI: urinary incontinence.
Differences between protocol and review
For this version of the review, we split the outcome of incontinence‐specific quality of life into urinary incontinence‐specific quality of life and faecal incontinence‐specific quality of life. This is because the symptoms of faecal incontinence and urinary incontinence influence quality of life in different ways and are measured using separate tools.
Contributions of authors
SW drafted the updated review, with assistance from JHS and PL. With the exception of AK, all authors screened trials for eligibility and discussed the overall conclusions.
SW, PL and JHS: extracted and cross‐checked the data from the studies new to this review. SW and PL: did most of the data entry, which was cross‐checked by JHS. SW and JHS: performed the GRADE assessment and prepared the 'Summary of findings' tables. AK: screened the search for economic evaluations and conducted the brief economic commentary. JHS wrote the first draft of the protocol and the previous review.
Sources of support
Internal sources
-
University of Otago, New Zealand
Host institution support for several members of the review team
External sources
-
National Institute for Health Research, UK
This project was supported by the National Institute for Health Research, via Cochrane Infrastructure funding to Cochrane Incontinence. The views and opinions expressed therein are those of the authors and do not necessarily reflect those of the Evidence Synthesis Programme, the NIHR, NHS or the Department of Health and Social Care.
Declarations of interest
In accordance with Cochrane's Commercial Sponsorship Policy, the following declarations are applicable for the three years prior to the publication date of this review.
SW: none known. PL: none known. RB: none known. JC: none known. SM: was an investigator on three of the included trials in the review and had no role in screening, risk of bias assessment or data extraction for these trials. AK: none known JHS: none known.
Edited (no change to conclusions)
References
References to studies included in this review
Ahlund 2013 {published data only}
- Ahlund S, Nordgren B, Wilander EL, Wiklund I, Friden C. Is home-based pelvic floor muscle training effective in treatment of urinary incontinence after birth in primiparous women? A randomized controlled trial. Acta Obstetricia et Gynecologica Scandinavica 2013;92(8):909-15. [sr-incont48416] [DOI] [PubMed] [Google Scholar]
Assis 2015 {published data only}
- Assis LC, Dias A, Barbosa AMP, Santini ACM, Sousa VO, Vianna LS, et al. Contribution of early intensive prolonged pelvic floor exercises (Abstract number 782-S). American Journal of Epidemiology 2011;173(Suppl 11):S196. [sr-incont47327] [Google Scholar]
- Assis LC, Bernardes JM, Barbosa AM, Santini AC, Vianna LS, Dias A. Effectiveness of an illustrated home exercise guide on promoting urinary continence during pregnancy: a pragmatic randomized clinical trial [Portuguese]. Revista Brasileira de Ginecologia e Obstetricia 2015;37(10):460-6. [sr-incont69254] [DOI] [PubMed] [Google Scholar]
- Dias A, Assis L, Barbosa A, Santini AC, Picelli-Dias F. Effectiveness of perineal exercises in controlling urinary incontinence and improving pelvic floor muscle function during pregnancy (Abstract number 117). Neurourology and Urodynamics 2011;30(6):968. [NCT00740428] [sr-incont42184] [Google Scholar]
Barakat 2011 {published data only}
- Barakat R, Pelaez M, Montejo R, Luaces M, Zakynthinaki M. Exercise during pregnancy improves maternal health perception: a randomized controlled trial. American Journal of Obstetrics and Gynecology 2011;204(5):402.e1-7. [sr-incont65194] [DOI] [PubMed] [Google Scholar]
Bø 2011 {published data only}
- Bø K, Haakstad L. Is pelvic floor muscle training effective when taught in a general fitness class for pregnant women? A randomized controlled trial (Abstract number 200). International Urogynecology Journal 2009;20(Suppl 2):S238-9. [sr-incont62378] [Google Scholar]
- Bø K, Haakstad LA. Is pelvic floor muscle training effective when taught in a general fitness class in pregnancy? A randomised controlled trial. Physiotherapy 2011;97(3):190-5. [NCT00617149] [sr-incont41700] [DOI] [PubMed] [Google Scholar]
- Haakstad LA, Bø K. Effect of a regular exercise programme on pelvic girdle and low back pain in previously inactive pregnant women: a randomized controlled trial. Journal of Rehabilitation Medicine 2015;47(3):229-234. [NCT00617149] [sr-incont75164] [DOI] [PubMed] [Google Scholar]
- Haakstad LA, Bø K. Effect of regular exercise on prevention of excessive weight gain in pregnancy: a randomised controlled trial. European Journal of Contraception & Reproductive Health Care 2011;16(2):116-25. [NCT00617149] [sr-incont78509] [DOI] [PubMed] [Google Scholar]
Chiarelli 2002 {published data only}
- Chiarelli P, Cockburn J. Preventing urinary incontinence in postpartum women (Abstract). Neurourology and Urodynamics 2001;20(4):448-9. [SR-INCONT12109] [Google Scholar]
- Chiarelli P, Cockburn J. Promoting urinary continence in women after delivery: randomised controlled trial (extended electronic version). BMJ 2002;324(7348):1241. [DOI: 10.1136/bmj.324.7348.1241] [SR-INCONT14669] [DOI] [PMC free article] [PubMed] [Google Scholar]
- Chiarelli P, Murphy B, Cockburn J. Acceptability of a urinary continence promotion programme to women in postpartum. BJOG 2003;110(2):188-96. [SR-INCONT15783] [PubMed] [Google Scholar]
- Chiarelli P, Murphy B, Cockburn J. Promoting urinary continence in postpartum women: 12-month follow-up data from a randomised controlled trial. International Urogynecology Journal 2004;15(2):99-105. [SR-INCONT17410] [DOI] [PubMed] [Google Scholar]
Cruz 2014 {published data only}
- Cruz C, Riesco ML, Zanetti M. Supervised pelvic floor muscle training to treat urinary incontinence during pregnancy: a randomized controlled trial (Abstract number 403). Neurourology and Urodynamics 2014;33(6):867-8. [RBR-8xj48n] [sr-incont64412] [Google Scholar]
Dinc 2009 {published data only}
Dokmeci 2008 {published data only}
- Dokmeci F, Bayramov S, Tur BS, Bayramov V, Seval M, Gok H. Pelvic floor muscle training during pregnancy: a randomized single-blind controlled study on improvement of antenatal and postpartum lower urinary tract symptoms (Abstract). Journal of Pelvic Medicine and Surgery 2008;14(4):304. [sr-incont46744] [Google Scholar]
Dufour 2019 {published data only}
- Dufour S, Fedorkow D, Fang Q. The use of mobile health technology to support post-partum pelvic health: a randomized mixed methods pilot study (Abstract number 25). Neurourology and Urodynamics 2018;37(Suppl 5):S70-1. [NCT02865954] [sr-incont78289] [Google Scholar]
- Dufour S, Fedorkow D, Kun J, Deng SX, Fang Q. Exploring the impact of a mobile health solution for postpartum pelvic floor muscle training: pilot randomized controlled feasibility study. JMIR mHealth and uHealth 2019;7(7):e12587. [10.2196/12587] [NCT02865954] [sr-incont78396] [DOI] [PMC free article] [PubMed] [Google Scholar]
- Dufour S, NCT02865954. Iball & pelvic floor muscle training (iball) [Use of iball mobile health technology in pelvic floor muscle training in the postpartum period: a pilot mixed methods study]. clinicaltrials.gov/show/NCT02865954 Date first received: 15 August 2016. [NCT02865954] [sr-incont73352]
Dumoulin 2004 {published data only}
- Dumoulin C, Bourbonnais D, Morin M, Gravel D, Lemieux MC. Predictors of success for physiotherapy treatment in women with persistent postpartum stress urinary incontinence. Archives of Physical Medicine and Rehabilitation 2010;91(7):1059-63. [sr-incont39946] [DOI] [PubMed] [Google Scholar]
- Dumoulin C, Lemieux MC, Bourbonnais D, Gravel D, Bravo G, Morin M. Physiotherapy for persistent postnatal stress urinary incontinence: a randomized controlled trial. Obstetrics and Gynecology 2004;104(3):504-10. [sr-incont19487] [DOI] [PubMed] [Google Scholar]
- Dumoulin C, Martin C, Elliott V, Bourbonnais D, Morin M, Lemieux MC, et al. Randomized controlled trial of physiotherapy for postpartum stress incontinence: 7-year follow-up. Neurourology and Urodynamics 2013;32(5):449-54. [sr-incont48074] [DOI] [PubMed] [Google Scholar]
- Dumoulin C, Morin M, Bourbonnais D, Lemieux M, Gravel D. Effect of adding deep abdominal muscle training to pelvic floor muscle training to treat stress urinary incontinence: a one-year follow up (Abstract number 662). In: 34th Annual Meeting of the joint meeting of the International Continence Society and the International Urogynecological Association; 2004 Aug 23-27; Paris. 2004. [sr-incont19083]
- Dumoulin C. Efficacite des traitements physiotherapiques pour l'incontinence urinaire d'effort chez la femme en periode postnatale [PhD thesis]. Montreal: University of Montreal, 2004. [sr-incont26954] [Google Scholar]
- Elliott V, Dumoulin C, Martin C, Morin M, Lemieux M, Bourbonnais D. Physical therapy for persistent postpartum stress urinary incontinence: a seven year follow-up study (Abstract number 198). Neurourology and Urodynamics 2009;28(7):820-1. [sr-incont39347] [Google Scholar]
Ewings 2005 {published data only}
- Ewings P, Spencer S, Marsh H, O'Sullivan M. Obstetric risk factors for urinary incontinence and preventative pelvic floor exercises: cohort study and nested randomized controlled trial. Journal of Obstetrics and Gynaecology 2005;25(6):558-64. [SR-INCONT21250] [DOI] [PubMed] [Google Scholar]
Fritel 2015 {published data only}
- Fritel X, Tayrac R, Bader G, Savary D, Gueye A, Deffieux X, et al. Preventing urinary incontinence with supervised prenatal pelvic floor exercises: a randomized controlled trial. Obstetrics and Gynecology 2015;126(2):370-7. [NCT00551551] [sr-incont68120] [DOI] [PubMed] [Google Scholar]
- Fritel X, Fauconnier A, Tayrac R, Amblard J, Cotte L, Fernandez H. Prevent postnatal urinary incontinence by prenatal pelvic floor exercise? Rationale and protocol of the multicenter randomized study PreNatal Pelvic floor Prevention (3PN) [French]. Journal de Gynecologie, Obstetrique et Biologie de la Reproduction 2008;37(5):441-8. [NCT00551551] [sr-incont27753] [DOI] [PubMed] [Google Scholar]
- Fritel X, Fauconnier A, Savary D, Letouzey V, Gueye A, Campagne S, et al. Prevent postnatal urinary incontinence by prenatal pelvic floor muscle training? First results of the multicenter randomized study 3PN, prenatal pelvic floor prevention (Abstract number 263). Neurourology and Urodynamics 2012;31(6):1068-9. [NCT00551551] [sr-incont46713] [Google Scholar]
- Fritel X, Guilhot-Gaudeffroy J, Tayrac R, Savary D, Deffieux X, Cotte L, et al. Prevention of postnatal urinary incontinence by antenatal pelvic floor muscle exercises, secondary per protocol analysis of the 3PN (prenatal pelvic floor prevention) randomized trial (Abstract number 5). Neurourology and Urodynamics 2013;32(6):528-9. [NCT00551551] [sr-incont49222] [Google Scholar]
Frost 2014 {published data only}
- Frost A, Trankel D, Shannon M. The efficacy of written and verbal pelvic floor exercise discharge instructions in reducing urinary incontinence among postpartum patients (Abstract). Journal of Women's Health Physical Therapy 2014;38(1):40. [sr-incont61793] [Google Scholar]
Frumenzio 2012 {published data only}
- Frumenzio E, Giovannozzi S, Pietropaolo A, Salvini E, Bruno R, Lolli C, et al. Results of a prospective randomised study: role of pelvic-perineal rehabilitation in post-partum incontinence recovery (Abstract number 4). Neurourology and Urodynamics 2012;31(S1):S3. [sr-incont46707] [Google Scholar]
Gaier 2010 {published data only}
- Gaier L, Lamberti G, Giraudo D. Pelvic floor muscle training during pregnancy to prevent urinary pelvic floor dysfunctions (Abstract). Neurourology and Urodynamics 2010;29(2S):64-5. [sr-incont39879] [Google Scholar]
Glazener 2001 {published data only}
- Geraerts I, Van Kampen M. Twelve-year follow-up of conservative management of postnatal urinary and faecal incontinence and prolapsed outcomes: randomised controlled trial [letter]. BJOG 2014;121(13):1741-2; authors' reply 1742. [sr-incont64903] [DOI] [PubMed] [Google Scholar]
- Glazener C, Elders A, MacArthur C, Lancashire RJ, Herbison P, Hagen S, et al. Childbirth and prolapse: long-term associations with the symptoms and objective measurement of pelvic organ prolapse. BJOG 2013;120(2):161-8. [sr-incont74061] [DOI] [PubMed] [Google Scholar]
- Glazener C, MacArthur C, Hagen S, Elders A, Lancashire R, Herbison G, et al. Twelve-year follow-up of conservative management of postnatal urinary and faecal incontinence and prolapse outcomes: randomised controlled trial. BJOG 2014;121(1):112-20. [sr-incont50467] [DOI] [PubMed] [Google Scholar]
- Glazener C, MacArthur C, Wilson D, Hagen S, ProLong study group. Authors' reply: twelve-year follow-up of conservative management of postnatal urinary and faecal incontinence and prolapsed outcomes: randomised controlled trial [letter]. BJOG 2014;121(13):1742. [sr-incont64902] [DOI] [PubMed] [Google Scholar]
- Glazener CM, Herbison GP, MacArthur C, Grant A, Wilson PD. Randomised controlled trial of conservative management of postnatal urinary and faecal incontinence: six year follow up. BMJ 2005;330(7487):337-40. [sr-incont20230] [DOI] [PMC free article] [PubMed] [Google Scholar]
- Glazener CM, Herbison GP, Wilson PD, MacArthur C, Lang GD, Gee H, et al. Conservative management of persistent postnatal urinary and faecal incontinence: a randomised controlled trial [Extended electronic version]. BMJ 2001;323:593. [DOI: 10.1136/bmj.323.7313.593] [sr-incont12123] [DOI] [PMC free article] [PubMed] [Google Scholar]
- Glazener CM, Herbison GP, Wilson PD, MacArthur C, Lang GD, Gee H, et al. Conservative management of persistent postnatal urinary and faecal incontinence: randomised controlled trial. BMJ 2001;323(7313):593-6. [sr-incont12122] [DOI] [PMC free article] [PubMed] [Google Scholar]
- Rennie AM, Wilson D, Glazener C, Gee H, Lang G, MacArthur C. A multicentre randomised trial of treatment of postnatal incontinence (Abstract). In: International Confederation of Midwives, 24th Triennial Congress; 1996 May 26-31; Oslo. 1996:8. [sr-incont5937]
- Wilson PD, Glazener C, McGee M, Herbison P, MacArthur C, Grant A. Randomised controlled trial of conservative management of postnatal urinary and faecal incontinence: long term follow-up study (Abstract). Neurourology and Urodynamics 2002;21(4):370. [sr-incont14363] [Google Scholar]
- Wilson PD, Herbison GP, Glazener CM, Lang G, Gee H, MacArthur C. Postnatal incontinence: a multi centre, randomised controlled trial of conservative treatment (Abstract). Neurourology and Urodynamics 1997;16(5):349-50. [sr-incont5834] [Google Scholar]
Gorbea 2004 {published data only}
- Gorbea Chavez V, Velazquez Sanchez Mdel P, Kunhardt Rasch JR. Effect of pelvic floor exercise during pregnancy and puerperium on prevention of urinary stress incontinence [Efecto de los ejercicios del piso pelvico durante el embarazo y el puerperio en la prevencion de la incontinencia urinaria de esfuerzo]. Ginecologia y Obstetricia de Mexico 2004;72(12):628-36. [SR-INCONT20384] [PubMed] [Google Scholar]
Hilde 2013 {published data only}
- Bø K, Hilde G, Stӕr-Jensen J, Siafarikas F, Tennfjord MK, Engh ME. Postpartum pelvic floor muscle training and pelvic organ prolapse-a randomized trial of primiparous women. American Journal of Obstetrics and Gynecology 2015;212(1):38.e1-7. [NCT01069484] [sr-incont64837] [DOI] [PubMed] [Google Scholar]
- Bø K, Hilde G, Tennfjord MK, Jensen JS, Siafarikas F, Engh ME. Randomized controlled trial of pelvic floor muscle training to prevent and treat pelvic organ prolapse in postpartum primiparous women (Abstract number 205). Neurourology and Urodynamics 2013;32(6):806-7. [sr-incont49200] [Google Scholar]
- Gluppe SL, Hilde G, Tennfjord MK, Engh ME, Bø K. Effect of a postpartum training program on the prevalence of diastasis recti abdominis in postpartum primiparous women: a randomized controlled trial. Physical Therapy 2018;98(4):260-8. [NCT01069484] [sr-incont78297] [DOI] [PMC free article] [PubMed] [Google Scholar]
- Hilde G, Stӕr-Jensen J, Siafarikas F, Ellstrom Engh M, Bø K. Does pelvic floor muscle training enhance pelvic floor muscle recovery? An assessor blinded randomized controlled trial (Abstract number PP15). International Urogynecology Journal and Pelvic Floor Dysfunction 2014;25(1 Suppl 1):S17-8. [sr-incont64248] [Google Scholar]
- Hilde G, Stӕr-Jensen J, Siafarikas F, Ellstrom Engh M, Bø K. Effect of postpartum pelvic floor muscle training on urinary incontinence in primiparous women with and without major pelvic floor muscle defects. An assessor blinded randomised controlled trial (Abstract number 8). Neurourology and Urodynamics 2013;32(6):533-4. [NCT01069484] [sr-incont49221] [Google Scholar]
- Hilde G, Stӕr-Jensen J, Siafarikas F, Ellstrom Engh M, Bø K. Postpartum pelvic floor muscle training and urinary incontinence: a randomized controlled trial [Erratum appears in: Obstetrics and Gynecology 2014;124(3):639]. Obstetrics and Gynecology 2013;122(6):1231-8. [NCT01069484] [sr-incont49471] [DOI] [PubMed] [Google Scholar]
- Kolberg Tennfjord M, Hilde G, Stӕr-Jensen J, Siafarikas F, Engh ME, Bø K. Effect of postpartum pelvic floor muscle training on vaginal symptoms and sexual dysfunction-secondary analysis of a randomised trial. BJOG 2016;123(4):634-42. [NCT01069484] [sr-incont70389] [DOI] [PubMed] [Google Scholar]
Hughes 2001 {published data only}
- Hughes P, Jackson S, Smith P, Abrams P. Can antenatal pelvic floor exercises prevent postnatal incontinence (Abstract number 49). Neurourology and Urodynamics 2001;20(4):447-8. [SR-INCONT12110] [Google Scholar]
- Hughes P. Personal communication 2006.
Hyakutake 2018 {published data only}
- Han V, Hyakutake M, Cundiff G, Koenig N, Baerg L, Lee T, et. Pregnancy-associated pelvic floor health knowledge and reduction of symptoms: the PREPARED trial (Abstract number O-GYN-JM-017). Journal of Obstetrics and Gynaecology Canada 2016;38(5):487. [NCT02947282] [TrialID.PREPARED.] [sr-incont76174] [DOI] [PubMed] [Google Scholar]
- Hyakutake MT, Han V, Baerg L, Koenig NA, Cundiff GW, Lee T, et al. Pregnancy-associated pelvic floor health knowledge and reduction of symptoms: the PREPARED randomized controlled trial. Journal of Obstetrics and Gynaecology Canada 2018;40(4):418-25. [NCT02947282] [TrialID.PREPARED.] [sr-incont78398] [DOI] [PubMed] [Google Scholar]
- Koenig N, NCT02947282. PREgnancy-associated Pelvic Floor Health Knowledge And REDuction of Symptoms: the PREPARED trial. clinicaltrials.gov/show/NCT02947282 Date first received: 27 October 2016. [NCT02947282] [TrialID.PREPARED.] [sr-incont74043]
Kim 2012 {published data only}
- Kim EY, Kim SY, Oh DW. Pelvic floor muscle exercises utilizing trunk stabilization for treating postpartum urinary incontinence: randomized controlled pilot trial of supervised versus unsupervised training. Clinical Rehabilitation 2012;26(2):132-41. [sr-incont44514] [DOI] [PubMed] [Google Scholar]
Ko 2011 {published data only}
- Ko PC, Liang CC, Chang SD, Lee JT, Chao AS, Cheng PJ. A randomized controlled trial of antenatal pelvic floor exercises to prevent and treat urinary incontinence. International Urogynecology Journal 2011;22(1):17-22. [sr-incont41029] [DOI] [PubMed] [Google Scholar]
- Liang C, Ko P, Lin Y, Tseng L, Lo T, Wang AC. Effect of antenatal pelvic floor muscle exercises in prevention and treatment of urinary incontinence: a randomized controlled trial (Abstract number 208). Neurourology and Urodynamics 2010;29(6):1105-6. [sr-incont40157] [Google Scholar]
Kocaoz 2013 {published data only}
- Kocaoz S, Eroglu K, Sivaslioglu AA. Role of pelvic floor muscle exercises in the prevention of stress urinary incontinence during pregnancy and the postpartum period. Gynecologic and Obstetric Investigation 2013;75(1):34-40. [sr-incont49319] [DOI] [PubMed] [Google Scholar]
Kou 2013 {published data only}
- Kou J-L, Dang L-J, Feng X-Q. Clinical study on the treatment of postpartum rehabilitation to improve the pelvic floor function. Medical Innovation of China 2013;10(25):55-7. [sr-incont70278] [Google Scholar]
Liu 2011 {published data only}
- Liu X-B. Pelvic floor muscle training for prevention and treatment of postpartum urinary incontinence clinical observation. Guide of China Medicine 2011;9(2):21-2. [sr-incont70276] [Google Scholar]
Meyer 2001 {published data only}
- Meyer S, Hohlfeld P, Achtari C, De Grandi P. Pelvic floor education after vaginal delivery. Obstetrics and Gynecology 2001;97(5 Pt 1):673-7. [SR-INCONT12119] [DOI] [PubMed] [Google Scholar]
- Meyer S, Hohlfeld P, De Grandi P, Megalo A. Is pelvic floor reeducation after vaginal delivery effective? A prospective double-blind randomized study in primiparae (Abstract). International Urogynecology Journal and Pelvic Floor Dysfunction 1999;10 Suppl 1:39-40. [SR-INCONT9846] [Google Scholar]
- Meyer S, Hohlfeld P, De Grandi P, Megalo A. Is pelvic floor re-education after vaginal delivery effective? A prospective double-blind randomized study in primiparae (Abstract). Neurourology and Urodynamics 1999;18(4):290. [SR-INCONT9941]
Miquelutti 2013 {published data only}
- Miquelutti MA, Cecatti JG, Makuch MY. Developing strategies to be added to the protocol for antenatal care: an exercise and birth preparation program. Clinics (Sao Paulo, Brazil) 2015;70(4):231-6. [sr-incont69188] [DOI] [PMC free article] [PubMed] [Google Scholar]
- Miquelutti MA, Cecatti JG, Makuch MY. Evaluation of a birth preparation program on lumbopelvic pain, urinary incontinence, anxiety and exercise: a randomized controlled trial. BMC Pregnancy and Childbirth 2013;13:154. [DOI: 10.1186/1471-2393-13-154] [NCT01155804] [sr-incont59873] [DOI] [PMC free article] [PubMed] [Google Scholar]
- Miquelutti MA, Cecatti JG, Makuch MY. Evaluation of the efficacy of an antenatal birth preparation program (Abstract number O431). International Journal of Gynaecology and Obstetrics 2012;119(Suppl 3):S414. [sr-incont64222] [Google Scholar]
- Miquelutti MA. Evaluating of an Antenatal Education Program [PhD thesis]. Campinas, São Paulo: Universidade Estadual de Campinas, Faculdade de Ciências Médicas, 2012. [sr-incont46712] [Google Scholar]
Mørkved 2003 {published data only}
- Mørkved S, Bø K, Schei B, Salvesen KÅ. Pelvic floor muscle training during pregnancy to prevent urinary incontinence: a single-blind randomized controlled trial. Obstetrics and Gynecology 2003;101(2):313-9. [SR-INCONT15816] [DOI] [PubMed] [Google Scholar]
- Mørkved S, Rommen K, Schei B, Salvesen KÅ, Bø K. No difference in urinary incontinence between training and control group six years after cessation of a randomized controlled trial, but improved sexual satisfaction in the training group (Abstract number 50). Neurourology and Urodynamics 2007;26(5):667. [sr-incont23748] [Google Scholar]
- Mørkved S, Salvesen KÅ, Scheil B, Bø K. Prevention of urinary incontinence during pregnancy - a randomized controlled trial of primiparous women (Abstract). International Urogynecology Journal and Pelvic Floor Dysfunction 2001;12 Suppl 3:1. [SR-INCONT15713] [Google Scholar]
- Mørkved S, Salvesen KÅ. Does pelvic floor muscle training during pregnancy have an effect on labour? (Abstract). Neurourology and Urodynamics 2004;23(5/6):410-1. [SR-INCONT19001] [Google Scholar]
- Salvesen KÅ, Mørkved S. Randomised controlled trial of pelvic floor muscle training during pregnancy. BMJ 2004;329(7462):378-80. [SR-INCONT17558] [DOI] [PMC free article] [PubMed] [Google Scholar]
- Schei B, Mørkved S, Bø K. Does pelvic floor muscle training during pregnancy have an influence on sexual life after delivery? (Abstract number 176). Journal of Sexual Medicine 2011;8(Suppl s3):124-5. [sr-incont64220] [Google Scholar]
Oakley 2016 {published data only}
- Oakley SH, Ghodsi VC, Crisp CC, Estanol MV, Westermann LB, Novicki KM, et al. Effects of physical therapy on pelvic floor symptoms and quality of life in postpartum women following severe perineal trauma: a randomized controlled trial. Female Pelvic Medicine and Reconstructive Surgery 2015;21(5 Suppl 1):S18. [NCT01672697] [sr-incont72724] [Google Scholar]
- Oakley SH, Ghodsi VC, Crisp CC, Estanol MV, Westermann LB, Novicki KM, et al. Impact of pelvic floor physical therapy on quality of life and function after obstetric anal sphincter injury: a randomized controlled trial. Female Pelvic Medicine and Reconstructive Surgery 2016;22(4):205-13. [NCT01672697] [sr-incont72183] [DOI] [PubMed] [Google Scholar]
Peirce 2013 {published data only}
- O'Herlihy C. Early home feedback physiotherapy compared with pelvic floor exercises soon after third degree perineal tear: a randomised trial (Abstract number 63). International Urogynecology Journal and Pelvic Floor Dysfunction 2012;23(2 Suppl 1):S107. [sr-incont67239] [Google Scholar]
- Peirce C, Murphy C, Fitzpatrick M, Cassidy M, Daly L, O'Connell P, et al. Randomised controlled trial comparing early home biofeedback physiotherapy with pelvic floor exercises for the treatment of third-degree tears (EBAPT Trial). BJOG 2013;120(10):1240-7. [sr-incont48563] [DOI] [PubMed] [Google Scholar]
- Peirce C, O'Herlihy C, Murphy C, Fitzpatrick M, Cassidy M, Daly L, et al. Randomized trial comparing early home biofeedback physiotherapy with pelvic floor exercises following third degree perineal tears (Abstract). American Journal of Obstetrics and Gynecology 2012;206(1 Suppl 1):S298-9. [sr-incont46739] [DOI] [PubMed] [Google Scholar]
Pelaez 2014 {published data only}
- Pelaez M, Gonzalez-Cerron S, Montejo R, Barakat R. Pelvic floor muscle training included in a pregnancy exercise program is effective in primary prevention of urinary incontinence: a randomized controlled trial. Neurourology and Urodynamics 2014;33(1):67-71. [NCT01578369] [sr-incont50396] [DOI] [PubMed] [Google Scholar]
Reilly 2002 {published data only}
- Agur WI, Steggles P, Waterfield M, Freeman RM. The long-term effectiveness of antenatal pelvic floor muscle training: eight-year follow up of a randomised controlled trial. BJOG 2008;115(8):985-90. [sr-incont27527] [DOI] [PubMed] [Google Scholar]
- Reilly EIL, Freeman RM, Waterfield MR, Waterfield AE, Steggles P, Pedlar F. Can post partum stress incontinence be prevented? (Abstract). International Urogynecology Journal 2001;12 Suppl 3:1. [SR-INCONT15712] [Google Scholar]
- Reilly ET, Freeman RM, Waterfield MR, Waterfield AE, Steggles P, Pedlar F. Prevention of postpartum stress incontinence in primigravidae with increased bladder neck mobility: a randomised controlled trial of antenatal pelvic floor exercises. BJOG 2002;109(1):68-76. [SR-INCONT12890] [DOI] [PubMed] [Google Scholar]
- Reilly ETC, Pedler F, Steggles P, Waterfield AE, Freeman RM. Prevention of postpartum stress incontinence in at risk primigravidae (Abstract). International Urogynecology Journal and Pelvic Floor Dysfunction 1999;10 Suppl 1:2. [SR-INCONT9837] [Google Scholar]
- Udayasankar VJ, Steggles P, Freeman RM, Waterfield M, Adekanmi OA, Reilly ET. Prevention of stress incontinence by ante-natal pelvic floor exercises in primigravidae with bladder neck mobility: a three year follow-up (Abstract). International Urogynaecology Journal 2002;13 Suppl 1:57-8. [SR-INCONT16343] [Google Scholar]
Sacomori 2019 {published data only}
- Sacomori C, Sperandio F, RBR-53wq87. Orientation of perineal exercises during postpartum to prevent urinary loss [Study about the influence of pelvic floor exercises orientation regarding urinary loss prevention on postpartum period]. ensaiosclinicos.gov.br/rg/RBR-53wq87/ Date first received: 7 October 2011. [RBR-53wq87] [sr-incont64551]
- Sacomori C, Zomkowski K, dos Passos Porto I, Cardoso FL, Sperandio FF. Adherence and effectiveness of a single instruction of pelvic floor exercises: a randomized clinical trial. International Urogynecology Journal 2019 Jun 28 [ePub ahead of print]. [DOI: 10.1007/s00192-019-04032-6] [RBR-53wq87] [U1111–1125-1467] [sr-incont78510] [DOI] [PubMed]
Sampselle 1998 {published data only}
- Sampselle C, Miller J. Personal communication 2006.
- Sampselle CM, Miller JM, Mims BL, Delancey JO, Ashton-Miller JA, Antonakos CL. Effect of pelvic muscle exercise on transient incontinence during pregnancy and after birth. Obstetrics and Gynecology 1998;91(3):406-12. [SR-INCONT5452] [DOI] [PubMed] [Google Scholar]
Sangsawang 2016 {published data only}
- Sangsawang B, Sangsawang N. Is a 6-week supervised pelvic floor muscle exercise program effective in preventing stress urinary incontinence in late pregnancy in primigravid women?: a randomized controlled trial. European Journal of Obstetrics, Gynecology, and Reproductive Biology 2016;197:103-10. [sr-incont70455] [DOI] [PubMed] [Google Scholar]
Skelly 2004 {published data only}
- Skelly J, Rush J, Eyles P, Burlock S, Morrow C, Fedorkow D. Postpartum urinary incontinence: regional prevalence and the impact of teaching pelvic muscle exercises to pregnant women with UI (Abstract number 552). In: 34th Annual Meeting of the International Continence Society and the International Urogynecology Association; 2004 Aug 23-27; Paris. 2004. [sr-incont19071]
Sleep 1987 {published data only}
- Sleep J, Grant A. Pelvic floor exercises in postnatal care. Midwifery 1987;3(4):158-64. [SR-INCONT2623] [DOI] [PubMed] [Google Scholar]
Stafne 2012 {published data only}
- Gustafsson MK, Stafne SN, Romundstad PR, Mørkved S, Salvesen K, Helvik AS. The effects of an exercise programme during pregnancy on health-related quality of life in pregnant women: a Norwegian randomised controlled trial. BJOG 2016;123(7):1152-60. [sr-incont69900] [DOI] [PubMed]
- Hellenes OM, Vik T, Løhaugen GC, Salvesen KÅ, Stafne SN, Mørkved S, et al. Regular moderate exercise during pregnancy does not have an adverse effect on the neurodevelopment of the child. Acta Paediatrica 2015;104(3):285-91. [sr-incont69901] [DOI] [PubMed] [Google Scholar]
- Mørkved S. Effects of regular exercise during pregnancy [Training during pregnancy - effects of regular exercise during pregnancy in prevention of pregnancy-related diseases and complications during labour. A randomised clinical trial]. clinicaltrials.gov/show/NCT00476567 Date first received: 22 May 2007. [NCT00476567] [sr-incont47816]
- Salvesen KÅ, Stafne SN, Eggebo TM, Mørkved S. Does regular exercise in pregnancy influence duration of labor? A secondary analysis of a randomized controlled trial. Acta Obstetricia et Gynecologica Scandinavica 2014;93(1):73-9. [sr-incont61153] [DOI] [PubMed] [Google Scholar]
- Songøygard KM, Stafne SN, Evensen KA, Salvesen KÅ, Vik T, Mørkved S. Does exercise during pregnancy prevent postnatal depression? A randomized controlled trial. Acta Obstetricia et Gynecologica Scandinavica 2012;91(1):62-7. [sr-incont69903] [DOI] [PubMed] [Google Scholar]
- Stafne S, Salvesen K, Romundstad P, Torjusen I, Mørkved S. Does regular exercise including pelvic floor muscle training prevent urinary and anal incontinence during pregnancy? A randomised controlled trial. BJOG 2012;119(10):1270-80. [sr-incont45048] [DOI] [PubMed] [Google Scholar]
- Stafne SN, Salvesen KÅ, Mørkved S. Does regular exercise in pregnancy increase lumbopelvic pain? (Abstract number RR-PO-312-11-Wed). Physiotherapy 2011a;97(Suppl S1):eS1171. [NCT00476567] [sr-incont68518] [Google Scholar]
- Stafne SN, Salvesen KÅ, Mørkved S. Does regular exercise in pregnancy prevent urinary incontinence? (Abstract number RR-PL-3377). Physiotherapy 2011b;97(Suppl S1):eS1170-1. [NCT00476567] [sr-incont68519] [Google Scholar]
- Stafne SN, Salvesen KÅ, Romundstad PR, Eggebo TM, Carlsen SM, Mørkved S. Regular exercise during pregnancy to prevent gestational diabetes: a randomized controlled trial. Obstetrics and Gynecology 2012;119(1):29-36. [sr-incont69902] [DOI] [PubMed] [Google Scholar]
- Stafne SN, Salvesen KÅ, Volloyhaug I, Mørkved S. Does a regular exercise program including pelvic floor muscle exercises prevent urinary incontinence in pregnancy? (Abstract number 100). Neurourology and Urodynamics 2011c;30(6):941-2. [sr-incont42181] [Google Scholar]
Stothers 2002 {published data only}
- Stothers L. A randomized controlled trial to evaluate intrapartum pelvic floor exercise as a method of preventing urinary incontinence (Abstract). Journal of Urology 2002;167(4 Suppl):106. [SR-INCONT17623] [Google Scholar]
Sut 2016 {published data only}
- Kahyaoglu Sut H, Balkanli Kaplan P. Effect of pelvic floor muscle exercise on pelvic floor muscle activity and voiding functions during pregnancy and the postpartum period. Neurourology and Urodynamics 2016;35(3):417-22. [sr-incont72124] [DOI] [PubMed] [Google Scholar]
Szumilewicz 2019 {published data only}
- Szumilewicz A, Dornowski M, Piernicka M, Worska A, Kuchta A, Kortas J, et al. High-low impact exercise program including pelvic floor muscle exercises improves pelvic floor muscle function in healthy pregnant women: a randomized control trial. Frontiers in Physiology 2019;9:1867. [DOI: 10.3389/fphys.2018.01867] [ISRCTN92265528] [sr-incont78375] [DOI] [PMC free article] [PubMed] [Google Scholar]
Torsdatter Markussen 2017 {published data only}
- Garnæs KK, Mørkved S, Salvesen Ø, Moholdt T. Exercise training and weight gain in obese pregnant women: a randomized controlled trial (ETIP Trial). PLOS Medicine 2016;13(7):e1002079. [DOI: 10.1371/journal.pmed.1002079] [NCT01243554] [TRIALID.ETIP] [sr-incont75278] [DOI] [PMC free article] [PubMed] [Google Scholar]
- Garnæs KK, Nyrnes SA, Salvesen KÅ, Salvesen Ø, Mørkved S, Moholdt T. Effect of supervised exercise training during pregnancy on neonatal and maternal outcomes among overweight and obese women. Secondary analyses of the ETIP trial: a randomised controlled trial. PLoS ONE 2017;12(3):e0173937. [DOI: 10.1371/journal.pone.0173937] [NCT01243554] [TRIALID.ETIP] [sr-incont75272] [DOI] [PMC free article] [PubMed] [Google Scholar]
- Markussen, LT. Effects of pelvic floor muscle training in pregnancy on pelvic floor muscle strength, urinary- and anal incontinence: a randomized controlled trial in overweight and obese women [Masters thesis]. Trondheim, Norway: Faculty of Medicine and Health Sciences, Institute of Medical Imaging and Circulation, Norwegian University of Science and Technology, 2017. [NCT01243554] [TrialID.ETIP] [sr-incont78511] [Google Scholar]
- Moholdt TT, Salvesen K, Ingul CB, Vik T, Oken E, Mørkved S. Exercise training in pregnancy for obese women (ETIP): study protocol for a randomised controlled trial. Trials 2011;12(1):154. [DOI: 10.1186/1745-6215-12-154] [NCT01243554] [TRIALID.ETIP.] [sr-incont41703] [DOI] [PMC free article] [PubMed] [Google Scholar]
- NCT01243554, Moholdt TT, Mørkved S. Exercise training in pregnancy for obese mothers [Exercise training in pregnancy. Good for the mother - good for the child?]. clinicaltrials.gov/show/NCT01243554 Date first received: 18 November 2010. [NCT01243554] [TrialID.ETIP]
Wen 2010 {published data only}
- Wen X-H, Shi S-Q, Wang J-Y. Pelvic muscles exercise for postpartum stress urinary incontinence. China Practical Medicine 2010;5(15):72-3. [sr-incont70270] [Google Scholar]
Wilson 1998 {published data only}
- Wilson D, Herbison P, Borland M, Grant AM. A randomised controlled trial of physiotherapy treatment of postnatal urinary incontinence. In: 26th Congress of Obstetrics and Gynaecology; 1992 Jul 7-10; Manchester (UK). 1992:162. [sr-incont6209]
- Wilson PD, Herbison GP. A randomized controlled trial of pelvic floor muscle exercises to treat postnatal urinary incontinence. International Urogynecology Journal and Pelvic Floor Dysfunction 1998;9(5):257-64. [sr-incont6657] [DOI] [PubMed] [Google Scholar]
Woldringh 2007 {published data only}
- Woldringh C, den Wijngaart M, Albers-Heitner P, Lycklama à Nijeholt AA, Lagro-Janssen T. Pelvic floor muscle training is not effective in women with UI in pregnancy: a randomised controlled trial. International Urogynecology Journal and Pelvic Floor Dysfunction 2007;18(4):383-90. [DOI: 10.1007/s00192-006-0175-x] [sr-incont23007] [DOI] [PubMed]
Yang 2017 {published data only}
- Yang S, Sang W, Feng J, Zhao H, Li X, Li P, et al. The effect of rehabilitation exercises combined with direct vagina low voltage low frequency electric stimulation on pelvic nerve electrophysiology and tissue function in primiparous women: a randomised controlled trial. Journal of Clinical Nursing 2017;26(23-24):4537-47. [sr-incont74511] [DOI] [PubMed] [Google Scholar]
References to studies excluded from this review
Agur 2005 {published data only}
- Agur W, Freeman R. Do antenatal pelvic floor training affect the outcome of labour? A randomised controlled trial (Abstract). Neurourology and Urodynamics 2005;24(5/6):510-1. [SR-INCONT20969] [DOI] [PubMed] [Google Scholar]
Assis 2013 {published data only}
- Assis TR, Sa AC, Amaral WN, Batista EM, Formiga CK, Conde DM. The effect of an exercise program to strengthen pelvic floor muscles in multiparous women [Portuguese]. Revista Brasileira de Ginecologia e Obstetricia 2013;35(1):10-5. [DOI] [PubMed] [Google Scholar]
Barakat 2014 {published data only}
- Barakat R, Perales M, Bacchi M, Coteron J, Refoyo I. A program of exercise throughout pregnancy. Is it safe to mother and newborn? American Journal of Health Promotion 2014;29(1):2-8. [DOI] [PubMed] [Google Scholar]
- Barakat R, Perales M. Effect of a supervised exercise program during whole pregnancy on outcomes and level of depression. A randomized controlled trial. clinicaltrials.gov/show/NCT01696201 Date first received: 28 September 2012. [NCT01696201]
- Perales M, Cordero Y, Vargas M, Lucia A, Barakat R. Exercise and depression in overweight and obese pregnant women: a randomised controlled trial. Archivos de Medicina del Sport 2015;32(3):70-7. [Google Scholar]
Barakat 2016 {published data only}
- Barakat R, Pelaez M, Cordero Y, Perales M, Lopez C, Coteron J, et al. Exercise during pregnancy protects against hypertension and macrosomia: randomized clinical trial. American Journal of Obstetrics and Gynecology 2016;214(5):649-8. [DOI] [PubMed] [Google Scholar]
Barakat 2018 {published data only}
- Barakat R, Franco E, Perales M, Lopez C, Mottola MF. Exercise during pregnancy is associated with a shorter duration of labor. A randomized clinical trial. European Journal of Obstetrics, Gynecology, and Reproductive Biology 2018;224:33-40. [DOI] [PubMed] [Google Scholar]
Brik 2019 {published data only}
- Brik M, Fernandez-Buhigas I, Martin-Arias A, Vargas-Terrones M, Barakat R, Santacruz B. Does exercise during pregnancy impact on maternal weight gain and fetal cardiac function? A randomized controlled trial. Ultrasound in Obstetrics and Gynecology 2019;53(5):583-9. [DOI] [PubMed] [Google Scholar]
Chen 2018 {published data only}
- Chen Z, Huang H, Chen QY. Effect of modified Buzhong Yiqi decoction combined with pelvic floor muscle exercise-biofeedback-electrical stimulation on early stage postpartum pelvic floor dysfunction. Zhongguo Zhongyao Zazhi (China Journal of Chinese Materia Medica) 2018;43(11):2391-5. [DOI] [PubMed] [Google Scholar]
Culligan 2005 {published data only}
- Culligan P, Blackwell L, Murphy M, Ziegler C, Heit M. A blinded, sham-controlled trial of postpartum extracorporeal magnetic innervation to restore pelvic muscle strength in primiparous patients (Abstract). Neurourology and Urodynamics 2004;23(5/6):451. [SR-INCONT19008] [DOI] [PubMed] [Google Scholar]
- Culligan PJ, Blackwell L, Murphy M, Ziegler C, Heit MH. A randomized, double-blinded, sham-controlled trial of postpartum extracorporeal magnetic innervation to restore pelvic muscle strength in primiparous patients. American Journal of Obstetrics and Gynecology 2005;192(5):1578-82. [DOI] [PubMed] [Google Scholar]
Dannecker 2004 {published data only}
- Dannecker C. The effect of the pelvic floor training device Epi-No on the maternal pelvic floor function six months after childbirth - follow-up study of a randomised controlled trial [Einfluss des Geburtstrainers Epi-No auf die mutterliche Beckenbodenfunktion sechs Monate nech Entbinding - follow-up einer prospektiven und randomisierten Studie]. Geburtshilfe und Frauenheilkunde 2004;64(11):1192-8. [SR-INCONT21149] [Google Scholar]
Dias 2011 {published and unpublished data}
- Dias LA, Driusso P, Aita DL, Quintana SM, Bø K, Ferreira CH. Effect of pelvic floor muscle training on labour and newborn outcomes: a randomized controlled trial. Revista Brasileira de Fisioterapia 2011;15(6):487-93. [SRINCONT42964] [DOI] [PubMed] [Google Scholar]
Dias 2018 {published data only}
- Dias NT, Ferreira LR, Fernandes MG, Resende AP, Pereira-Baldon VS. A Pilates exercise program with pelvic floor muscle contraction: is it effective for pregnant women? A randomized controlled trial. Neurourology and Urodynamics 2018;37(1):379-84. [DOI] [PubMed] [Google Scholar]
Dieb 2017 {published data only}
- Dieb AS, NCT03287258. Perineal preparation for pregnant ladies [Digital perineal massage and pelvic floor muscle exercise as an antenatal program for prevention of perineal trauma in elderly women, a randomized controlled trial]. clinicaltrials.gov/show/NCT03287258 Date first received: 19 September, 2017. [NCT03287258]
Dietz 2014 {published data only}
- Dietz HP, Langer S, Kamisan Atan I, Shek KL, Caudwell-Hall J, Guzman Rojas R. Does the Epi-No prevent pelvic floor trauma? A multicentre randomised controlled trial (Abstract number 394). Neurourology and Urodynamics 2014;33(6):853-5. [Google Scholar]
Domingues 2015 {published data only}
- Domingues MR, Bassani DG, da Silva SG, Vargas Nunes Coll C, da Silva BG, Hallal PC. Physical activity during pregnancy and maternal-child health (PAMELA): study protocol for a randomized controlled trial. Trials 2015;16:227. [DOI: 10.1186/s13063-015-0749-3] [DOI] [PMC free article] [PubMed] [Google Scholar]
Dougherty 1989 {published data only}
- Dougherty MC, Abrams RM, Batich CD, Bishop KR, Gimptty P. Effect of exercise on the circumvaginal muscles (CVM) (Abstract). Neurourology and Urodynamics 1987;6(3):189-90. [SR-INCONT16393] [Google Scholar]
- Dougherty MC, Bishop KR, Abrams RM, Batich CD, Gimotty PA. The effect of exercise on the circumvaginal muscles in postpartum women. Journal of Nurse-Midwifery 1989;34(1):8-14. [SR-INCONT454] [DOI] [PubMed] [Google Scholar]
El‐Shamy 2018 {published data only}
- El-Shamy FF, Abd El Fatah E. Effect of antenatal pelvic floor muscle exercise on mode of delivery: a randomized controlled trial. Integrative Medicine International 2018;4(3-4):187-97. [Google Scholar]
Fynes 1999 {published data only}
- Fynes M, Marshall K, Cassidy M, O'Connell R, O'Herlihy C. A prospective randomised study comparing the effect of augmented biofeedback with sensory biofeedback alone on faecal incontinence following obstetric trauma. 28th Annual Meeting of the International Continence Society (ICS); 1998 Sept 14-17; Jerusalem, Israel 1998:151. [SR-INCONT5691]
- Fynes MM, Marshall K, Cassidy M, Behan M, Walsh D, O'Connell PR, et al. A prospective, randomized study comparing the effect of augmented biofeedback with sensory biofeedback alone on fecal incontinence after obstetric trauma. Diseases of the Colon and Rectum 1999;42(6):753-8. [sr-incont8121] [DOI] [PubMed] [Google Scholar]
Golmakani 2015 {published data only}
- Golmakani N, Zare Z, Khadem N, Shareh H, Shakeri MT. The effect of pelvic floor muscle exercises program on sexual self-efficacy in primiparous women after delivery. Iranian Journal of Nursing and Midwifery Research 2015;20(3):347-53. [IRCT2013062313750N1] [PMC4462060] [sr-incont67962] [PMC free article] [PubMed] [Google Scholar]
- Zare Z, Golmakani N, Khadem N, Shareh H, Shakeri MT. The effect of pelvic floor muscle exercises on sexual quality of life and marital satisfaction in primiparous women after childbirth. Iranian Journal of Obstetrics, Gynecology and Infertility 2014;17(103):21-32. [Google Scholar]
Gouldthorpe 2003 {published data only}
- Gouldthorpe H. A physiotherapy abdominal muscle assessment during and after pregnancy: Part 4 (Abstract). Australian and New Zealand Continence Journal 2003;9(4):92. [SR-INCONT17166]
Han 2018 {published data only}
- Han W, Wang Y, Qi S, Li T, Cao J, Zheng T, et al. Observation of the effect of physical rehabilitation therapy combined with the medication on pelvic floor dysfunction. Experimental and Therapeutic Medicine 2018;15(2):1211-6. [DOI] [PMC free article] [PubMed] [Google Scholar]
Hou 2010 {published data only}
- Hou S-X. The clinical effects on biofeedback combined with electrical stimulation used in pelvic muscle recover therapy. Guide of China Medicine 2010;8(17):28-9. [sr-incont70279] [Google Scholar]
Huang 2014 {published data only}
- Huang J. Effects of exercise of pelvic floor on childbirth outcome and pelvic floor function in primiparas. Hebei yi xue (Hebei Medicine) 2014;20(3):513-6. [Google Scholar]
Iervolino 2017 {published data only}
- Iervolino SA, Pezzella M, Passaretta A, Torella M, Colacurci N. Postpartum female sexual dysfunction: effects of two different degrees of pelvic floor muscle exercises. Neurourology and Urodynamics 2017;36(Suppl S2):S37-8. [Google Scholar]
Johannessen 2017 {published data only}
- Johannessen HH, Wibe A, Stordahl A, Sandvik L, Mørkved S. Do pelvic floor muscle exercises reduce postpartum anal incontinence? A randomised controlled trial. BJOG 2017;124(4):686-94. [DOI] [PubMed] [Google Scholar]
Kamisan Atan 2016 {published data only}
- Kamisan Atan I, Shek KL, Langer S, Guzman Rojas R, Caudwell-Hall J, Daly JO, et al. Does the Epi-No(©) birth trainer prevent vaginal birth-related pelvic floor trauma? A multicentre prospective randomised controlled trial. BJOG 2016;123(6):995-1003. [DOI] [PubMed] [Google Scholar]
Khorasani 2017 {published data only}
- Khorasani F, Ghaderi F, IRCT2017050618760N4. The effects of stabilization exercises focusing on pelvic floor on stress urinary incontinence and low back pain in postpartum women. [Iranian Registry of Clinical Trials] irct.ir/searchresult.php?id=18760&number=4 Date first received: 27 June 2017. [IRCT2017050618760N4]
Lekskulchai 2014 {published data only}
- Lekskulchai O, Wanichsetakul P. Effect of pelvic floor muscle training (PFMT) during pregnancy on bladder neck descend and delivery. Journal of the Medical Association of Thailand 2014;97(Suppl 8):S156-63. [PubMed] [Google Scholar]
- Lekskulchai O. Effect of antenatal pelvic floor exercises on bladder neck descent in nulliparous pregnant women (Abstract number 105). Neurourology and Urodynamics 2011;30(6):949-50. [SRINCONT42182] [Google Scholar]
Leon‐Larios 2017 {published data only}
- Leon-Larios F, Corrales-Gutierrez I, Casado-Mejia R, Suarez-Serrano C. Influence of a pelvic floor training programme to prevent perineal trauma: a quasi-randomised controlled trial. Midwifery 2017;50:72-7. [DOI] [PubMed] [Google Scholar]
Li 2010 {published data only}
- Li Y, Liu H-S, Guo X-J, Mai F-M. Effect of functional exercise of prenatal pelvic floor muscles on pregnancy outcome. Xian Dai Sheng Wu Yi Xue Jin Zhan (Progress in Modern Biomedicine) 2010;10(11):2129-31. [Google Scholar]
Liu 2013 {published data only}
- Liu Y-L, Zhou Y-H, Ding H, Peng J, Chen S-Q, Zhang J-P. Effect of pelvic muscle training on pelvic floor function during pregnancy. Zhongshan da xue xue bao. Yi xue ke xue ban (Journal of Sun Yat-sen University. Medical Sciences) 2013;34(5):777-81. [sr-incont70267] [Google Scholar]
Mahmoodi 2014 {published data only}
- Mahmoodi F, Mobaraki A. Assessment of effects of Kegel exercises on reduction of perineal pain after episiotomy in primiparous women. Iranian Journal of Obstetrics, Gynecology and Infertility 2014;17(95):18-25. [Google Scholar]
Mahony 2004 {published data only}
- Mahony R, Malone P, Nalty J, Cassidy M, O'Connell PR, O'Herlihy C. Prospective randomized comparison of intra-anal electromyographic biofeedback and intra-anal electromyographic biofeedback augmented with electrical stimulation of the anal sphincter. American Journal of Obstetrics and Gynecology 2003;189(6 Suppl):71. [DOI] [PubMed] [Google Scholar]
- Mahony RT, Malone PA, Nalty J, Behan M, O'Connell PR, O'Herlihy C. Randomized clinical trial of intra-analysis electromyographic biofeedback physiotherapy with intra-anal electromyographic biofeedback augmented with electrical stimulation of the anal sphincter in the early treatment of postpartum fecal incontinence. American Journal of Obstetrics and Gynecology 2004;191(3):885-90. [DOI] [PubMed] [Google Scholar]
Mason 1999 {published data only}
- Mason M. A multicentre study to evaluate different pelvic floor exercise regimes. National Research Register 1999. [SR-INCONT6662]
Mason 2010 {published data only}
- Mason L, Roe B, Wong H, Davies J, Bamber J. The role of antenatal pelvic floor muscle exercises in prevention of postpartum stress incontinence: a randomised controlled trial. Journal of Clinical Nursing 2010;19(19-20):2777-86. [SRINCONT40375] [DOI] [PubMed] [Google Scholar]
Min 2019 {published data only}
- Min L. A randomized controlled trial for intra-vaginal electrical stimulation with pelvic muscle exercises in the early treatment of postpartum pelvic organ prolapse. [Chinese Clinical Trial Registry] chictr.org.cn/showproj.aspx?proj=35452 Date first received: 6 March 2019.
Morin 2015 {published data only}
- Morin M, Kruger J, Wong V, Girard I, Sherburn M, Dumoulin C. Effect of physiotherapy on pelvic floor morphometry in women with and without avulsion injury of the puborectalis muscle after vaginal delivery: a randomised pilot study (Abstract number 15). Neurourology and Urodynamics 2015;34(S3):S39-40. [Google Scholar]
Nielsen 1988 {published data only}
- Nielsen CA, Sigsgaard I, Olsen M, Tolstrup M, Danneskiold-Samsoee B, Bock JE. Trainability of the pelvic floor. A prospective study during pregnancy and after delivery. Acta Obstetricia et Gynecologica Scandinavica 1988;67(5):437-40. [SR-INCONT7395] [DOI] [PubMed] [Google Scholar]
Norton 1990 {published data only}
- Norton P, Baker J. Randomized prospective trial of vaginal cones versus Kegel exercises in postpartum primiparous women. In: 11th Annual Meeting of the American Urogynecology Society; 1990 Oct 31-Nov 3; Tarpon Springs (FL). 1990. [SR-INCONT14572]
- Norton P, Baker J. Randomized prospective trial of vaginal cones vs Kegel exercises in postpartum primiparous women (Abstract). Neurourology and Urodynamics 1990;9(4):434-5. [SR-INCONT5116] [Google Scholar]
Oblasser 2016 {published data only}
- Oblasser C, McCourt C, Hanzal E, Christie J. Vibrating vaginal balls to improve pelvic floor muscle performance in women after childbirth: a protocol for a randomised controlled feasibility trial. Journal of Advanced Nursing 2016;72(4):900-14. [DOI] [PubMed] [Google Scholar]
Okido 2015 {published data only}
- Okido MM, Valeri FL, Martins WP, Ferreira CH, Duarte G, Cavalli RC. Assessment of foetal wellbeing in pregnant women subjected to pelvic floor muscle training: a controlled randomised study. International Urogynecology Journal 2015;26(10):1475-81. [DOI] [PubMed] [Google Scholar]
Perales 2015 {published data only}
- Barakat R, Perales M. Effect of a supervised exercise program in obese and overweight pregnant women on outcomes and level of depression. A randomized controlled trial. clinicaltrials.gov/show/NCT01753622 Date first received: 20 December 2012. [NCT01753622]
- Perales M, Cordero Y, Vargas M, Lucia A, Barakat R. Exercise and depression in overweight and obese pregnant women: a randomised controlled trial. Archivos de Medicina del Sport 2015;32(3):70-7. [Google Scholar]
Perales 2016 {published data only}
- Barakat R, Perales M. Effect of a specific exercise program during whole pregnancy on fetal heart rate response to maternal effort in third trimester. A randomised controlled trial. clinicaltrials.gov/show/NCT01723293 Date first received: 7 November 2012. [NCT01723293]
- Perales M, Santos-Lozano A, Sanchis-Gomar F, Luaces M, Pareja-Galeano H, Garatachea N, et al. Maternal cardiac adaptations to a physical exercise program during pregnancy. Medicine and Science in Sports and Exercise 2016;48(5):896-906. [DOI] [PubMed] [Google Scholar]
Pourkhiz 2017 {published data only}
- Pourkhiz Z, Mohammad-Alizadeh-Charandabi S, Mirghafourvand M, Haj-Ebrahimi S, Ghaderi F. Effect of pelvic floor muscle training on female sexual function during pregnancy and postpartum: a randomized controlled trial. Iranian Red Crescent Medical Journal 2017;19(10):e63218. [DOI: 10.5812/ircmj.63218] [DOI] [Google Scholar]
Ruiz 2013 {published data only}
- Ruiz JR, Perales M, Pelaez M, Lopez C, Lucia A, Barakat R. Supervised exercise-based intervention to prevent excessive gestational weight gain: a randomized controlled trial. Mayo Clinic Proceedings 2013;88(12):1388-97. [DOI] [PubMed] [Google Scholar]
Santos‐Rocha 2015 {published data only}
- Santos-Rocha R, Portela C, Santos T. Active pregnancy: effects of a physical exercise and nutritional counselling program on pregnant women' lifestyle and new-born's health (pilot study) (Abstract number O-0149). Journal of Perinatal Medicine 2015;43(S1):no pagination. [Google Scholar]
Siva 2014 {published data only}
- Siva PR, Kokila V, Kanchana MK, Suresh KS. Effectiveness of antenatal motor relearning approach of diaphragm, deep abdominal and pelvic floor muscles versus Kegels exercises on postpartum pelvic floor muscle strength. Indian Journal of Physiotherapy and Occupational Therapy 2014;8(1):193-7. [sr-incont67960] [Google Scholar]
Taskin 1996 {published data only}
- Taskin O, Wheeler JM, Yalcinoglu AI, Coksenim S. The effects of episiotomy and Kegel exercises on postpartum pelvic relaxation: a prospective controlled study. Journal of Gynecologic Surgery 1996;12(2):123-7. [SRINCONT18347] [Google Scholar]
Teymuri 2018 {published data only}
- Teymuri Z, Hosseinifar M, Sirousi M. The effect of stabilization exercises on pain, disability and pelvic floor muscle function in postpartum lumbopelvic pain: a randomized controlled trial. American Journal of Physical Medicine and Rehabilitation 2018;97(12):885-91. [DOI] [PubMed] [Google Scholar]
Thorp 1994 {published data only}
- Thorp JM, Stephenson H, Jones LH, Cooper G. Pelvic floor (Kegel) exercises: a pilot study in nulliparous women. International Urogynecology Journal 1994;5(2):86-9. [Google Scholar]
Wang 2014 {published data only}
- Wang X, Li G-Y, Deng M-L. Effect of persistent guidance of pelvic floor muscle training on the delivery outcome and pelvic muscle strength. Zhonghua Hu Li za Zhi [Chinese Journal of Nursing] 2013;48(4):308-10. [Google Scholar]
- Wang X, Li G-Y, Deng M-L. Pelvic floor muscle training as a persistent nursing intervention: effect on delivery outcome and pelvic floor myodynamia. International Journal of Nursing Sciences 2014;1(1):48-52. [Google Scholar]
Wilson 2015 {published data only}
- Wilson J. Evaluating Web-based Pelvic Floor Muscle Education for Pregnant Women [PhD thesis]. Fremantle (Australia): The University of Notre Dame (Fremantle Campus), 2015. [Google Scholar]
Zhu 2012 {published data only}
- Zhu X-M, Jiang L-Q. Effect of exercises and electrical stimulation of pelvic floor muscles on postpartum incontinence. Journal of Nursing (China) 2012;19(2A):49-51. [Google Scholar]
References to studies awaiting assessment
Hoseinkhani 2018 {published data only}
- Hoseinkhani M, Taghian F. Effects of Kegel, central, and combined stability exercises on the central muscle endurance and quality of life of primiparous women after episiotomy. Iranian Journal of Obstetrics, Gynecology and Infertility 2018;21(2):60-8. [sr-incont78077] [Google Scholar]
Longo 2013 {published data only}
- Longo F, Montironi PL, Bar E, Frigerio S. Effects of pelvic floor muscle training during pregnancy. Techniques in Coloproctology 2013;17(1):143-4. [sr-incont61867] [Google Scholar]
Ngugi 2015 {published data only}
- Ngugi S, Kamanda C, Miheso J. Effect of pelvic floor muscle training among pregnant black African population on the risk of postpartum urinary incontinence, a single blind randomized control trial. pactr.samrc.ac.za/TrialDisplay.aspx?TrialID=834 [Pan African Clinical Trials Registry (PACTR)] Date first received: 22 May 2014. [PACTR201407000834391] [sr-incont64511]
- Ngugi S. Effect of Pelvic Floor Muscle Training Among Pregnant Black African Population on the Risk of Postpartum Urinary Incontinence, a Single Blind Randomized Control Trial [Masters dissertation]. Nairobi (Kenya): Department of Obstetrics and Gynaecology, Aga Khan University, 2015. [PACTR201407000834391] [sr-incont76175] [Google Scholar]
Sun 2015 {published data only}
- Sun Z, Zhu L, Lang J, Zhang Y, Liu G, Chen X, et al. Postpartum pelvic floor rehabilitation on prevention of female pelvic floor dysfunction: a multicenter prospective randomized controlled study. [Chinese]. Chung-Hua Fu Chan Ko Tsa Chih [Chinese Journal of Obstetrics and Gynecology] 2015;50(6):420-7. [PubMed] [Google Scholar]
- Zhu L, Wang Y, Zhang X, Gong J. The effect of postpartum pelvic floor rehabilitation in prevention and treatment of pelvic floor dysfunction [The effect of postpartum pelvic floor rehabilitation in prevention and treatment of pelvic floor dysfunction- a multiple centers cooperation research]. clinicaltrials.gov/show/NCT01926314 Date first received: 20 August, 2013. [NCT01926314]
Zhou 2009 {published data only}
- Zhou Y-H. The Function of the Pregnancy on the Female Pelvic Floor and Study on the Effect of Pelvic Floor through Pelvic Floor Muscle Training During the Pregnancy [Masters thesis]. Guangzhou, Guangdong (China): Sun Yat-Sen University, 2009. [sr-incont70268] [Google Scholar]
References to ongoing studies
ACTRN12609001005246 {published data only}
- Ferreira CH, Cavalcanti DL. Effects of pelvic floor muscle training on pelvic floor muscle function in women during their first pregnancies measured by perineometer. anzctr.org.au/ACTRN12609001005246.aspx Date first received: 10 October 2009. [ACTRN12609001005246] [sr-incont64574]
Buen 2014 {published data only}
- Buen M. Clinical trial: influence of the practice of Pilates on the incidence of urinary incontinence, perineal strength low back pain in the third trimester. ensaiosclinicos.gov.br/rg/RBR-4wkr8y/ Date first received: 9 April 2014. [RBR-4wkr8y] [sr-incont64504]
Haruna 2014 {published data only}
- Haruna M, Asai Y, UMIN000015878. Effect of postpartum pelvic floor muscle training with ultrasound biofeedback on recovery of pelvic floor muscle function: a randomized controlled trial. UMIN Clinical Trials Registry (UMIN-CTR) ( https://upload.umin.ac.jp/cgi-open-bin/ctr_e/ctr_view.cgi?recptno=R000018467) Date first received: 8 December 2014. [UMIN000015878] [sr-incont66324]
Haruna 2016 {published data only}
- Haruna M, UMIN000025165. A randomized controlled trial of transabdominal ultrasound biofeedback in postpartum pelvic floor muscle training for primiparous and multiparous women. (Sango-PFMT Trial). upload.umin.ac.jp/cgi-open-bin/ctr_e/ctr_view.cgi?recptno=R000028948 Date first recieved: 6 December, 2016. [UMIN000025165] [sr-incont76219]
Hendler 2017 {published data only}
- Hendler I, Mohr-Sasson A, NCT03041246. Manual fascial manipulation in pregnant women [The influence of manual fascial manipulation on the function of the pelvic floor in pregnant women]. clinicaltrials.gov/show/NCT03041246 Date first received: 2 February 2017. [3722-16-SMC] [NCT03041246] [sr-incont78303]
Lijun 2018 {published data only}
- Lijun R. Clinical study of pelvic floor electrical stimulation combined with traditional Chinese medicine and acupoint sticking in the treatment of postpartum urinary incontinence. [Chinese Clinical Trial Registry] chictr.org.cn/showproj.aspx?proj=24515 Date first received: 7 January 2018. [ChiCTR1800014351 ] [sr-incont78278]
Mesk 2018 {published data only}ISRCTN13224744
- Mesk Z, Abdul Manaf R, Juni MH, Kadir Shahar H, Mohd Nazan AI, Amro AA. Effectiveness of theory based intervention using social media to reduce urinary incontinence among postpartum women in Hebron city hospitals: protocol for randomize control trial. JMIR Research Protocols 2019 Aug 13 [Preprint ahead of print available at preprints.jmir.org/preprint/13514] (accessed 9 January 2020). [DOI: 10.2196/13514] [DOI: ] [DOI]
- Mesk Z. The effectiveness of theory based intervention using social media to reduce urinary incontinence among postpartum women in Hebron city hospitals. isrctn.com/ISRCTN13224744 Date first received: 26 July, 2018. [ISRCTN13224744] [sr-incont78325]
Moossdorf‐Steinhauser 2019 {published data only}
- Berghmans B. Long term effects of multidisciplinary assessment and pre- and post partum Pelvic Floor Muscle Group Treatment in primigravid with stress urinary incontinence compared to care-as-usual: a randomised controlled trial - motherfit. trialregister.nl/trial/5816 Date first received: 18 July 2016. [NL5816] [NTR5971] [sr-incont74038]
- Moossdorff-Steinhauser HF, Bols, EMJ, Spaanderman ME, Dirksen CD, Weemhoff M, Nieman FH, et al. Long-term effects of motherfit group therapy in pre-(MOTHERFIT1) and post-partum women (MOTHERFIT2) with stress urinary incontinence compared to care-as-usual: study protocol of two multi-centred, randomised controlled trials. Trials 2019;20(1):237. [NL5816] [NTR5971] [sr-incont-ee2692] [DOI] [PMC free article] [PubMed] [Google Scholar]
NCT00763984 {published data only}
- Sampselle C, Davis CK. PERL 4: Promoting Effective Recovery from Labour. Self-care to prevent birth-related urinary incontinence in diverse women. clinicaltrials.gov/show/NCT00763984 Date first received: 1 October 2008. [NCT00763984] [sr-incont47852]
NCT02270008 {published data only}
- Karp D, Huber SA, Martinuzzi K. Reducing perinatal anal incontinence through early pelvic floor muscle training: a prospective pilot study. clinicaltrials.gov/show/NCT02270008 Date first received: 21 October 2014. [NCT02270008] [sr-incont67524]
NCT02334397 {published data only}
- Lewicky-Gaupp C, Alverdy A. Bump on the ball: impact of a prenatal exercise & education program on birth outcomes & maternal quality of life. clinicaltrials.gov/show/NCT02334397 Date first received: 8 January 2015. [NCT02334397] [sr-incont65526]
NCT02420288 {published data only}
- Barakat R, Vargas M, Brik M, Fernandez I, Gil J, Coteron J, et al. Does exercise during pregnancy affect placental weight?: a randomized clinical trial. Evaluation and the Health Professions 2017;41(3):400-14. [NCT02420288] [sr-incont78271] [DOI] [PubMed] [Google Scholar]
- Barakat RO, Vargas Terrones M. Effect of physical exercise program on fetoplacental growth: a randomized controlled trial. clinicaltrials.gov/show/NCT02420288 Date first received: 17 April 2015. [NCT02420288] [sr-incont67550]
- Vargas-Terrones M, Barakat R, Santacruz B, Fernandez-Buhigas I, Mottola MF. Physical exercise programme during pregnancy decreases perinatal depression risk: a randomised controlled trial. British Journal of Sports Medicine 2019;53(6):348-53. [ NCT02420288] [DOI] [PubMed] [Google Scholar]
NCT02682212 {published data only}
- Steingrimsdottir T, Geirsson RT, Bø K. Obstetric perineal trauma, pelvic floor symptoms and early physiotherapy intervention. clinicaltrials.gov/show/NCT02682212 Date first received: 15 February 2016. [NCT02682212] [sr-incont71364]
NCT03247660 {published data only}
- Torres-Lacomba M, Navarro-Brazalez B. Perineal physiotherapy in postpartum [Effectiveness of the perineal physiotherapy in the prevention and treatment of pelvic floor dysfunction in postpartum]. clinicaltrials.gov/show/NCT03247660 Date first received: 14 August 2017. [21/2013] [NCT03247660] [sr-incont77783]
Schreiner 2016 {published data only}
- Schreiner L. Impact of pelvic floor physiotherapy during pregnancy in urinary incontinence and delivery. ensaiosclinicos.gov.br/rg/RBR-8nv3fg/ Date first received: 2 July 2016. [RBR-8nv3fg] [sr-incont74033]
Sobhgol 2019 {published data only}
- Dahlen H. For primiparous women, do the antenatal pelvic floor muscle exercises improve female sexual function during pregnancy and the first three months following birth when compared with standard antenatal care alone? A randomised controlled trial. [Australia New Zealand Clinical Trials Registry] anzctr.org.au/ACTRN12617001030369.aspx Date first received: 21 June 2017. [ACTRN12617001030369] [UTN - U1111-1197-6617] [sr-incont77743]
- Sobhgol SS, Priddis H, Smith CA, Dahlen HG. Evaluation of the effect of an antenatal pelvic floor muscle exercise programme on female sexual function during pregnancy and the first 3 months following birth: study protocol for a pragmatic randomised controlled trial. Trials [Electronic Resource] 2019;20(1):144. [ACTRN12617001030369] [sr-incont78373] [DOI] [PMC free article] [PubMed] [Google Scholar]
Torabipour 2019 {published data only}
- Torabipour MA, Hajihashemi M, IRCT20160521027998N7. Determine the effect of physiotherapy in women's sexual function and incontinence after first child birth. en.irct.ir/trial/37576 Date first received: 13 March 2019. [IRCT20160521027998N7] [sr-incont78381]
Vasconcelos 2018 {published data only}
- Vasconcelos CT, Saboia DM. Prevention of urinary incontinence in postpartum women. [Brazillian Registry of Clinical Trials] ensaiosclinicos.gov.br/rg/RBR-5634jr/ Date first received: 21 April 2018. [RBR-5634jr] [UTN Number: U1111-1212-6567] [sr-incont78383]
Velez‐Sanchez 2015 {published data only}
- Velez-Sanchez D, Veloz MG. Perineal muscle training versus usual prenatal care in the incidence of avulsion of the levator ani muscle at first birth of Mexican women: randomized control trial. clinicaltrials.gov/show/NCT02513420 Date first received: 31 July 2015. [NCT02513420] [sr-incont68795]
Additional references
Abrams 2017
- Abrams P, Andersson K-E, Apostolidis A, Birder L, Bliss D, Brubaker L, et al. Evaluation and treatment of urinary incontinence, pelvic organ prolapse and faecal incontinence: recommendations of the International Scientific Committee, 6th International Consultation on Incontinence. In: Abrams P, Cardozo L, Wagg A, Wein A, editors(s). Incontinence: 6th International Consultation on Incontinence, Tokyo, September 2016. 6th edition. Vol. 1. Bristol (UK): International Continence Society (ICS) and International Consultation on Urological Diseases (ICUD), 2017:2549-619. [ISBN: 978-09569607-3-3] [Google Scholar]
ACOG 2015
- American College of Obstetricians and Gynecologists [ACOG]. Physical activity and exercise during pregnancy and the postpartum period. Committee Opinion No. 650 summary. Obstetrics and Gynecology 2015;126(6):1326-7. [DOI: 10.1097/AOG.0000000000001209] [DOI] [PubMed] [Google Scholar]
Atkins 2004
- Atkins D, Best D, Briss PA, Eccles M, Falck-Ytter Y, Flottorp S, and GRADE Working Group. Grading quality of evidence and strength of recommendations. BMJ 2004;328(7454):1490-7. [DOI] [PMC free article] [PubMed] [Google Scholar]
Avery 2004
- Avery K, Donovan J, Peters TJ, Shaw C, Gotoh M, Abrams P. ICIQ: a brief and robust measure for evaluating the symptoms and impact of urinary incontinence. Neurourology and Urodynamics 2004;23(4):322-30. [DOI] [PubMed] [Google Scholar]
Avery 2007
- Avery KN, Bosch JL, Gotoh M, Naughton M, Jackson S, Radley SC, et al. Questionnaires to assess urinary and anal incontinence: review and recommendations. Journal of Urology 2007;177(1):39-49. [DOI] [PubMed] [Google Scholar]
Bols 2010
- Bols EM, Hendriks EJ, Berghmans BC, Baeten CG, Nijhuis JG, Bie RA. A systematic review of etiological factors for postpartum fecal incontinence. Acta Obstetricia et Gynecologica Scandinavica 2010;89(3):302-14. [DOI] [PubMed] [Google Scholar]
Brown 2012
- Brown SJ, Gartland D, Donath S, MacArthur C. Fecal incontinence during the first 12 months postpartum: complex causal pathways and implications for clinical practice. Obstetrics and Gynecology 2012;119(2 Pt 1):240-9. [DOI] [PubMed] [Google Scholar]
Bø 1990
- Bø K, Hagen RH, Kvarstein B, Jørgensen J, Larsen S, Burgio KL. Pelvic floor muscle exercise for the treatment of female stress urinary incontinence. III. Effects of two different degrees of pelvic floor muscle exercises. Neurourology and Urodynamics 1990;9(5):489-502. [Google Scholar]
Bø 1995
- Bø K. Pelvic floor muscle exercise for the treatment of stress urinary incontinence: an exercise physiology perspective. International Urogynecology Journal 1995;6(5):282-91. [Google Scholar]
Bø 1999
- Bø K, Talseth T, Holme I. Single blind, randomised controlled trial of pelvic floor exercises, electrical stimulation, vaginal cones, and no treatment in management of genuine stress incontinence in women. BMJ 1999;318(7182):487-93. [DOI] [PMC free article] [PubMed] [Google Scholar]
Bø 2004
- Bø K. Pelvic floor muscle training is effective in treatment of female stress urinary incontinence, but how does it work? International Urogynecology Journal and Pelvic Floor Dysfunction 2004;15(2):76-84. [DOI] [PubMed] [Google Scholar]
Bø 2014
- Bø K. Measurement of pelvic floor muscle function and strength, and pelvic organ prolapse. In: Bø K, Berghmans B, Mørkved S, Van Kampen M, editors(s). Evidence-based Physical Therapy for the Pelvic Floor: Bridging Science and Clinical Practice. 2nd edition. London: Elsevier Health Sciences UK, 2014:43-109. [Google Scholar]
Coyne 2014
- Coyne KS, Wein A, Nicholson S, Kvasz M, Chen Chieh-I, Milsom I. Economic burden of urgency urinary incontinence in the United States: a systematic review. Journal of Managed Care Pharmacy 2014;20(2):130-40. [DOI] [PMC free article] [PubMed] [Google Scholar]
CRD 2015
- Centre for Reviews and Dissemination (CRD). CRD databases: search strategies. 2015. crd.york.ac.uk/crdweb/ (accessed 7 January 2020).
Davenport 2018
- Davenport MH, Nagpal TS, Mottola MF, Skow RJ, Riske L, Poitras VJ, et al. Prenatal exercise (including but not limited to pelvic floor muscle training) and urinary incontinence during and following pregnancy: a systematic review and meta-analysis. British Journal of Sports Medicine 2018;52(21):1397-404. [DOI: 10.1136/bjsports-2018-099780] [DOI] [PubMed] [Google Scholar]
Du 2015
- Du Y, Xu L, Ding L, Wang Y, Wang Z. The effect of antenatal pelvic floor muscle training on labor and delivery outcomes: a systematic review with meta-analysis. International Urogynecology Journal 2015;26(10):1415-27. [DOI] [PubMed] [Google Scholar]
Dumoulin 2017
- Dumoulin C, Adewuyi T, Booth J, Bradley C, Burgio K, Hagen S, et al. Adult conservative management. In: Abrams P, Cardozo L, Wagg A, Wein A, editors(s). Incontinence: 6th International Consultation on Incontinence, Tokyo, September 2016. 6th edition. Vol. 1. Bristol, UK: International Continence Society (ICS) and International Consultation on Urological Diseases (ICUD), 2017:1443-628. [Google Scholar]
Dumoulin 2018
- Dumoulin C, Cacciari LP, Hay-Smith EJ. Pelvic floor muscle training versus no treatment, or inactive control treatments, for urinary incontinence in women. Cochrane Database of Systematic Reviews 2018, Issue 10. Art. No: CD005654. [DOI: 10.1002/14651858.CD005654.pub4] [DOI] [PMC free article] [PubMed] [Google Scholar]
Durnea 2017
- Durnea CM, Khashan AS, Kenny LC, Durnea UA, Dornan JC, O'Sullivan SM, et al. What is to blame for postnatal pelvic floor dysfunction in primiparous women-pre-pregnancy or intrapartum risk factors? European Journal of Obstetrics, Gynecology, and Reproductive Biology 2017;214:36-43. [DOI] [PubMed] [Google Scholar]
Eason 2002
- Eason E, Labrecque M, Marcoux S, Mondor M. Anal incontinence after childbirth. CMAJ 2002;166(3):326-30. [PMC free article] [PubMed] [Google Scholar]
EndNote 2018 [Computer program]
- EndNote. Version X8.2. Philadelphia (PA): Clarivate Analytics, 2018.
Foldspang 1999
- Foldspang A, Mommsen S, Djurhuus JC. Prevalent urinary incontinence as a correlate of pregnancy, vaginal childbirth, and obstetric techniques. American Journal of Public Health 1999;89(2):209-12. [DOI] [PMC free article] [PubMed] [Google Scholar]
Frawley 2017
- Frawley HC, Dean SG, Slade SC, Hay-Smith EJ. Is pelvic-floor muscle training a physical therapy or a behavioural therapy? A call to name and report the physical, cognitive, and behavioural elements. Physical Therapy 2017;97(4):425-37. [DOI] [PubMed] [Google Scholar]
Garnæs 2016
- Garnæs KK, Mørkved S, Salvesen Ø, Moholdt T. Exercise training and weight gain in obese pregnant women: a randomized controlled trial (ETIP Trial). PLOS Medicine 2016;13(7):e1002079. [DOI: 10.1371/journal.pmed.1002079] [DOI] [PMC free article] [PubMed] [Google Scholar]
Gartland 2012
- Gartland D, Donath S, MacArthur C, Brown SJ. The onset, recurrence and associated obstetric risk factors for urinary incontinence in the first 18 months after a first birth: an Australian nulliparous cohort study. BJOG 2012;119(11):1361-9. [DOI] [PubMed] [Google Scholar]
Gartland 2016
- Gartland D, MacArthur C, Woolhouse H, McDonald E, Brown SJ. Frequency, severity and risk factors for urinary and faecal incontinence at 4 years postpartum: a prospective cohort. BJOG 2016;123(7):1203-11. [DOI] [PubMed] [Google Scholar]
Gillard 2010
- Gillard S, Shamley D. Factors motivating women to commence and adhere to pelvic floor muscle exercises following a perineal tear at delivery: the influence of experience. Journal of the Association of Chartered Physiotherapists in Women's Health 2010;106:5-18. [Google Scholar]
GRADEpro GDT [Computer program]
- GRADEpro GDT. Version accessed 7 January 2020. Hamilton (ON): McMaster University (developed by Evidence Prime). Available at gradepro.org.
Gyhagen 2013
- Gyhagen M, Bullarbo M, Nielsen TF, Milsom I. A comparison of the long-term consequences of vaginal delivery versus caesarean section on the prevalence, severity and bothersomeness of urinary incontinence subtypes: a national cohort study in primiparous women. BJOG 2013;120(12):1548-55. [DOI] [PubMed] [Google Scholar]
Handa 2007
- Handa VL, Zyczynski HM, Burgio KL, Fitzgerald MP, Borello-France D, Janz NK, et al. The impact of fecal and urinary incontinence on quality of life 6 months after childbirth. American Journal of Obstetrics and Gynecology 2007;197(6):636.e1-e6. [DOI] [PMC free article] [PubMed] [Google Scholar]
Hay‐Smith 2019
- Hay-Smith EJ, Englas K, Dumoulin C, Ferreira CH, Frawley H, Weatherall M. The Consensus on Exercise Reporting Template (CERT) in a systematic review of exercise-based rehabilitation effectiveness: completeness of reporting, rater agreement, and utility. European Journal of Physical and Rehabilitation Medicine 2019;55(3):342-52. [DOI: 10.23736/S1973-9087.19.05791-5] [DOI] [PubMed] [Google Scholar]
Hensrud 2000
- Hensrud DD. Clinical preventive medicine in primary care: background and practice: 1. Rationale and current preventive practices. Mayo Clinic Proceedings 2000;75(2):165-72. [DOI] [PubMed] [Google Scholar]
Herbert 2005
- Herbert RD, Bø K. Analysis of quality of interventions in systematic reviews. BMJ 2005;331(7515):507-9. [DOI: 10.1136/bmj.331.7515.507] [DOI] [PMC free article] [PubMed] [Google Scholar]
Higgins 2011
- Higgins JP, Green S, editor(s). Cochrane Handbook for Systematic Reviews of Interventions Version 5.1.0 (updated March 2011). The Cochrane Collaboration, 2011. Available from handbook.cochrane.org.
Imamura 2010
- Imamura M, Abrams P, Bain C, Buckley B, Cardozo L, Cody J, et al. Systematic review and economic modelling of the effectiveness and cost-effectiveness of non-surgical treatments for women with stress urinary incontinence. Health Technology Assessment 2010;14(40):1-188, iii-iv. [DOI: 10.3310/hta14400] [DOI] [PubMed] [Google Scholar]
Johannessen 2016
- Johannessen HH, Wibe A, Stordahl A, Sandvik L, Backe B, Mørkved S. Prevalence and predictors of anal incontinence during pregnancy and 1 year after delivery: a prospective cohort study. BJOG 2016;121(3):269-80. [DOI] [PubMed] [Google Scholar]
Johanson 1996
- Johanson JF, Lafferty J. Epidemiology of fecal incontinence: the silent affliction. American Journal of Gastroenterology 1996;91(1):33-6. [PubMed] [Google Scholar]
Jonasson 1989
- Jonasson A, Larsson B, Pschera H. Testing and training of the pelvic floor muscles after childbirth. Acta Obstetricia et Gynecologica Scandinavica 1989;68(4):301-4. [DOI] [PubMed] [Google Scholar]
Kegel 1948
- Kegel AH. Progressive resistance exercise in the functional restoration of the perineal muscles. American Journal of Obstetrics and Gynecology 1948;56(2):238-48. [DOI] [PubMed] [Google Scholar]
Koumantakis 2005
- Koumantakis GA, Watson PJ, Oldham JA. Trunk muscle stabilization training plus general exercise versus general exercise only: randomized controlled trial of patients with recurrent low back pain. Physical Therapy 2005;85(3):209-25. [PubMed] [Google Scholar]
Laycock 2001
- Laycock J, Jerwood D. Pelvic floor muscle assessment: the PERFECT Scheme. Physiotherapy 2001;87(12):631-42. [Google Scholar]
Levack 2019
- Levack WM, Martin RA, Graham FP, Hay-Smith EJ. Compared to what? An analysis of the management of control groups in Cochrane reviews in neurorehabilitation. European Journal of Physical and Rehabilitation Medicine 2019;55(3):353-63. [DOI: 10.23736/S1973-9087.19.05795-2] [DOI] [PubMed] [Google Scholar]
MacArthur 2001
- MacArthur C, Glazener CM, Wilson PD, Herbison GP, Gee H, Lang GD, et al. Obstetric practice and faecal incontinence three months after delivery. BJOG 2001;108(7):678-83. [DOI] [PubMed] [Google Scholar]
MacArthur 2013
- MacArthur C, Wilson D, Herbison P, Lancashire RJ, Hagen S, Toozs-Hobson P, et al, on behalf of the ProLong study group. Faecal incontinence persisting after childbirth: a 12 year longitudinal study. BJOG 2013;120(2):169-79. [DOI] [PubMed] [Google Scholar]
Mason 2001
- Mason L, Glenn S, Walton I, Hughes C. Do women practise pelvic floor exercises during pregnancy or following delivery? Physiotherapy 2001;87(12):662-70. [DOI: 10.1016/S0031-9406(05)61112-1] [DOI] [PubMed] [Google Scholar]
Miller 2008
- Miller JM, Sampselle C, Ashton-Miller J, Hong GR, DeLancey JO. Clarification and confirmation of the Knack maneuver: the effect of volitional pelvic floor muscle contraction to preempt expected stress incontinence. International Urogynecology Journal and Pelvic Floor Dysfunction 2008;19(6):773-82. [SR-INCONT27428] [DOI] [PMC free article] [PubMed] [Google Scholar]
Milsom 2017
- Milsom I, Altman D, Cartwright R, Lapitan MC, Nelson R, Sjöström S, et al. Epidemiology of urinary incontinence (UI) and other lower urinary tract symptoms (LUTS), pelvic organ prolapse (POP) and anal incontinence (AI). In: Abrams P, Cardozo L, Wagg A, Wein A, editors(s). Incontinence: 6th International Consultation on Incontinence, Tokyo, September 2016. 6th edition. Vol. 1. Bristol (UK): International Continence Society (ICS) and International Consultation on Urological Diseases (ICUD), 2017:1-141. [Google Scholar]
Moher 1998
- Moher D, Pham B, Jones A, Cook DJ, Jadad AR, Moher M, et al. Does quality of reports of randomised trials affect estimates of intervention efficacy reported in meta-analyses? Lancet 1998;352(9128):609-13. [DOI] [PubMed] [Google Scholar]
Moore 2015
- Moore GF, Audrey S, Barker M, Bond L, Bonell C, Hardeman W, et al. Process evaluation of complex interventions: Medical Research Council guidance. BMJ 2015;350:h1258. [DOI: 10.1136/bmj.h1258] [DOI] [PMC free article] [PubMed] [Google Scholar]
Mørkved 1997
- Mørkved S, Bø K. Effect of postpartum pelvic floor muscle exercise in prevention and treatment of urinary incontinence. International Urogynecology Journal and Pelvic Floor Dysfunction 1997;8(4):217-22. [DOI] [PubMed] [Google Scholar]
Mørkved 2014
- Mørkved S, Bø K. Effect of pelvic floor muscle training during pregnancy and after childbirth on prevention and treatment of urinary incontinence: a systematic review. British Journal of Sports Medicine 2014;48(4):299-310. [DOI] [PubMed] [Google Scholar]
Norton 2012
- Norton C, Cody JD. Biofeedback and/or sphincter exercises for the treatment of faecal incontinence in adults. Cochrane Database of Systematic Reviews 2012, Issue 7. Art. No: CD002111. [DOI: 10.1002/14651858.CD002111.pub3] [DOI] [PMC free article] [PubMed] [Google Scholar]
Nygaard 2017
- Nygaard IE, Clark E, Clark L, Egger MJ, Hitchcock R, Hsu Y, et al. Physical and cultural determinants of postpartum pelvic floor support and symptoms following vaginal delivery: a protocol for a mixed-methods prospective cohort study. BMJ Open 2017;7(1):e014252. [DOI: 10.1136/bmjopen-2016-014252] [DOI] [PMC free article] [PubMed] [Google Scholar]
Nyström 2015
- Nyström E, Sjöström M, Stenlund H, Samuelsson E. ICIQ symptom and quality of life instruments measure clinically relevant improvements in women with stress urinary incontinence. Neurourology and Urodynamics 2015;34(8):747-51. [DOI] [PubMed] [Google Scholar]
Pizzoferrato 2014
- Pizzoferrato AC, Fauconnier A, Quiboeuf E, Morel K, Schaal JP, Fritel X. Urinary incontinence 4 and 12 years after first delivery: risk factors associated with prevalence, incidence, remission, and persistence in a cohort of 236 women. Neurourology and Urodynamics 2014;33(8):1229-34. [DOI] [PMC free article] [PubMed] [Google Scholar]
Pollack 2004
- Pollack J, Nordenstam J, Brismar S, Lopez A, Altman D, Zetterstrom J. Anal incontinence after vaginal delivery: a five-year prospective cohort study. Obstetrics and Gynecology 2004;104(6):1397-402. [DOI] [PubMed] [Google Scholar]
Quiboeuf 2016
- Quiboeuf E, Saurel-Cubizolles MJ, Fritel X, EDEN Mother-Child Cohort Study Group. Trends in urinary incontinence in women between 4 and 24 months postpartum in the EDEN cohort. BJOG 2016;123(7):1222-8. [DOI] [PubMed] [Google Scholar]
Rockwood 2000
- Rockwood TH, Church JM, Fleshman JW, Kane RL, Mavrantonis C, Thorson AG, et al. Fecal Incontinence Quality of Life Scale: quality of life instrument for patients with fecal incontinence. Diseases of the Colon and Rectum 2000;43(1):9-16; discussion 16-7. [DOI] [PubMed] [Google Scholar]
Rogers 2017
- Rogers RG, Ninivaggio C, Gallagher K, Borders AN, Qualls C, Leeman LM. Pelvic floor symptoms and quality of life changes during first pregnancy: a prospective cohort study. International Urogynecology Journal 2017;28(11):1701-7. [DOI: 10.1007/s00192-017-3330-7] [DOI] [PMC free article] [PubMed]
Rortveit 2003a
- Rortveit G, Daltveit AK, Hannestad YS, Hunskaar S, the Norwegian EPINCONT study. Urinary incontinence after vaginal delivery or cesarean section. New England Journal of Medicine 2003;348(10):900-7. [DOI] [PubMed] [Google Scholar]
Rortveit 2003b
- Rortveit G, Daltveit AK, Hannestad YS, Hunskaar S. Vaginal delivery parameters and urinary incontinence: the Norwegian EPINCONT study. American Journal of Obstetrics and Gynecology 2003;189(5):1268-74. [DOI] [PubMed] [Google Scholar]
Saboia 2018
- Saboia DM, Bezerra KC, Vasconcelos Neto JA, Bezerra LR, Oriá MOB, Vasconcelos CT. The effectiveness of post-partum interventions to prevent urinary incontinence: a systematic review. Revista Brasileira de Enfermagem 2018;71(Suppl 3):1460-8. [DOI] [PubMed] [Google Scholar]
Sandvik 1993
- Sandvik H, Hunskaar S, Seim A, Hermstad R, Vanvik A, Bratt H. Validation of a severity index in female urinary incontinence and its implementation in an epidemiological survey. Journal of Epidemiology and Community Health 1993;47(6):497-9. [DOI] [PMC free article] [PubMed] [Google Scholar]
Sandvik 2000
- Sandvik H, Seim A, Vanvik A, Hunskaar S. A severity index for epidemiological surveys of female urinary incontinence: comparison with 48-hour pad-weighing tests. Neurourology and Urodynamics 2000;19(2):137-45. [DOI] [PubMed] [Google Scholar]
Schreiner 2018
- Schreiner L, Crivelatti I, Oliveira JM, Nygaard CC, Dos Santos TG. Systematic review of pelvic floor interventions during pregnancy. International Journal of Gynaecology and Obstetrics 2018;143(1):10-8. [DOI: 10.1002/ijgo.12513] [DOI] [PubMed] [Google Scholar]
Shemilt 2019
- Shemilt I, Aluko P, Graybill E, Craig D, Henderson C, Drummond M, et al, on behalf of the Campbell and Cochrane Economics Methods Group. Chapter 20: Economic evidence. In: Higgins JP, Thomas J, Chandler J, Cumpston M, Li T, Page MJ, et al, editor(s). Cochrane Handbook for Systematic Reviews of Interventions version 6.0 (updated July 2019). Cochrane, 2019. Available from training.cochrane.org/handbook.
Shumaker 1994
- Shumaker SA, Wyman JF, Uebersax JS, McClish D, Fantl JA, Continence Program in Women (CPW) Research Group. Health-related quality of life measures for women with urinary incontinence: the Incontinence Impact Questionnaire and the Urogenital Distress Inventory. Quality of Life Research 1994;3(5):291-306. [DOI] [PubMed] [Google Scholar]
Signorello 2000
- Signorello LB, Harlow BL, Chekos AK, Repke JT. Midline episiotomy and anal incontinence: retrospective cohort study. BMJ 2000;320(7227):86-90. [DOI] [PMC free article] [PubMed] [Google Scholar]
Slade 2016
- Slade SC, Dionne CE, Underwood M, Buchbinder R. Consensus on Exercise Reporting Template (CERT): explanation and elaboration statement. British Journal of Sports Medicine 2016;50:1428-37. [DOI] [PubMed] [Google Scholar]
Stach‐Lempinen 2001
- Stach-Lempinen B, Kujansuu E, Laippala P, Metsanoja R. Visual analogue scale, urinary incontinence severity score and 15 D--psychometric testing of three different health-related quality-of-life instruments for urinary incontinent women. Scandinavian Journal of Urology and Nephrology 2001;35(6):476-83. [DOI] [PubMed] [Google Scholar]
Sultan 1999
- Sultan AH, Monga AK, Kumar D, Stanton SL. Primary repair of obstetric anal sphincter rupture using the overlap technique. British Journal of Obstetrics and Gynaecology 1999;106(3):318-23. [DOI] [PubMed] [Google Scholar]
Svare 2014
- Svare JA, Hansen BB, Lose G. Risk factors for urinary incontinence 1 year after first vaginal delivery in a cohort of primiparous Danish women. International Urogynecology Journal 2014;25(1):47-51. [DOI] [PubMed] [Google Scholar]
Svare 2016
- Svare JA, Hansen BB, Lose G. Prevalence of anal incontinence during pregnancy and 1 year after delivery in a cohort of primiparous women and a control group of nulliparous women. Acta Obstetricia et Gynecologica Scandinavica 2016;95(8):920-5. [DOI] [PubMed] [Google Scholar]
Thom 2010
- Thom DH, Rortveit G. Prevalence of postpartum urinary incontinence: a systematic review. Acta Obstetricia et Gynecologica Scandinavica 2010;89(12):1511-22. [DOI] [PubMed] [Google Scholar]
Vierhout 1990
- Vierhout ME. Measurement of undesirable urine loss in women [Meting van ongewenst urineverlies bij de vrouw]. Nederlands Tijdschrift voor Geneeskunde 1990;134(38):1837-40. [PubMed] [Google Scholar]
Viktrup 2006
- Viktrup L, Rortveit G, Lose G. Risk of stress urinary incontinence twelve years after the first pregnancy and delivery. Obstetrics and Gynecology 2006;108(2):248-54. [DOI] [PubMed] [Google Scholar]
Wagner 2017
- Wagner TH, Moore KH, Subak LL, Wachter S, Dudding T. Economics of urinary & faecal incontinence, and prolapse. In: Abrams P, Cardozo L, Wagg A, Wein A, editors(s). Incontinence: 6th International Consultation on Incontinence, Tokyo, September 2016. 6th edition. Vol. 1. Bristol (UK): International Continence Society (ICS) and International Consultation on Urological Diseases (ICUD), 2017:2479-511. [Google Scholar]
Wesnes 2007
- Wesnes SL, Rortveit G, Bø K, Hunskaar S. Urinary incontinence during pregnancy. Obstetrics and Gynecology 2007;109(4):922-8. [DOI] [PubMed] [Google Scholar]
Wesnes 2017
Xu 2012
- Xu L, Menees SB, Zochowski MK, Fenner DE. Economic cost of fecal incontinence. Diseases of the Colon and Rectum 2012;55(5):586-98. [DOI] [PubMed] [Google Scholar]
References to other published versions of this review
Boyle 2012
- Boyle R, Hay-Smith EJ, Cody JD, Mørkved S. Pelvic floor muscle training for prevention and treatment of urinary and faecal incontinence in antenatal and postnatal women. Cochrane Database of Systematic Reviews 2012, Issue 10. Art. No: CD007471. [DOI: 10.1002/14651858.CD007471.pub2] [DOI] [PubMed] [Google Scholar]
Hay‐Smith 2008
- Hay-Smith J, Mørkved S, Fairbrother KA, Herbison GP. Pelvic floor muscle training for prevention and treatment of urinary and faecal incontinence in antenatal and postnatal women. Cochrane Database of Systematic Reviews 2008, Issue 4. Art. No: CD007471. [DOI: 10.1002/14651858.CD007471] [DOI] [PubMed] [Google Scholar]
Woodley 2017
- Woodley SJ, Boyle R, Cody JD, Mørkved S, Hay‐Smith EJ. Pelvic floor muscle training for prevention and treatment of urinary and faecal incontinence in antenatal and postnatal women. Cochrane Database of Systematic Reviews 2017, Issue 12. Art. No: CD007471. [DOI: 10.1002/14651858.CD007471.pub3] [DOI] [PMC free article] [PubMed] [Google Scholar]