Abstract
Transcription is a highly dynamic process that generates single-stranded DNA (ssDNA) in the genome as ‘transcription bubbles’. Here we describe a kethoxal-assisted single-stranded DNA sequencing (KAS-seq) approach, based on the fast and specific reaction between N3-kethoxal and guanines in ssDNA in live cells and mouse tissues. KAS-seq enables rapid (within 5 min), sensitive, and genome-wide capture and mapping of ssDNA produced by transcriptionally active RNA polymerases or other processes in situ by using as few as 1,000 cells. KAS-seq defines a group of enhancers that are single-stranded, which enrich unique sequence motifs and are associated with specific transcription factor binding and more enhancer-promotor interactions. Under protein condensation inhibition conditions, KAS-seq uncovers a rapid release of RNA polymerase II (Pol II) from a group of promotors. KAS-seq thus facilitates fast, comprehensive, and accurate analysis of transcription dynamics and enhancer activities simultaneously in a low input and high-throughput manner.
Transcription and its regulation determine cell fate and physiological functions, with dysfunctions in transcriptional regulation associated with various human diseases1. To understand global transcription regulation, genome-wide sequencing approaches have been developed to analyze the occupancy of RNA polymerases (ChIP-seq)2, or detect the presence and level of nascent RNA. Nascent RNA analysis is usually based on run-on assays3,4, metabolic labeling5,6, and Pol II-associated or chromatin-associated RNA enrichment7–11. Although powerful, these methods also have limitations. Run-on-based methods and Pol II-associated RNA enrichment typically require millions of cells as starting materials. Pol II ChIP-seq could not distinguish whether RNA polymerases are simply bound or are actively engaged in transcription3. Metabolic labeling may not be able to accurately measure transient and low-abundant RNA species, such as enhancer RNAs (eRNAs), especially when using limited materials with modest sequencing depth. As most RNAs undergo post-transcriptional processing, their levels are indirect readouts that may not accurately reflect transcription dynamics in situ.
Transcriptionally engaged RNA polymerases resolve DNA double helices and generate single-stranded DNA bubbles. Therefore, we envision that mapping ssDNA throughout the genome provides a readout of the activity and dynamics of transcriptionally engaged RNA polymerases. Permanganate was previously reported to preferentially oxidize single-stranded thymidine residues12, and was subsequently used to reveal Pol II-induced promotor melting in both loci-specific12,13 and genome-wide manners14. The combination of permanganate treatment and S1 nuclease digestion allows genome-wide identification of non-B form DNA structures15. However, this method requires tens of millions of cells, and shows low sensitivity when detecting relatively weak and broad signals derived from Pol II elongation at gene bodies.
Here we describe a rapid and sensitive labeling of single-stranded DNA for sequencing (KAS-seq), based on a kethoxal-guanine reaction. We show that KAS-seq simultaneously measures the dynamics of transcriptionally-engaged Pol II, transcribing enhancers, Pol I and Pol III activities, and non-canonical DNA structures involving ssDNA in situ, by using as few as 1,000 cells or mice tissues. We demonstrate that KAS-seq detects transcription dynamics during transient physiological environment changes such as protein condensation inhibition.
Results
Genome-wide profiling of single-stranded DNA using N3-kethoxal-based labeling
Kethoxal (1,1-dihydroxy-3-ethoxy-2-butanone) was previously reported to react with the N1 and N2 positions of guanines in single-stranded DNAs and RNAs under physiological conditions16. We recently developed a synthesis of an azide-tagged kethoxal (N3-kethoxal), which not only preserves its high reactivity and specificity to guanines in single-stranded nucleic acids, but also offers a bio-orthogonal handle that can be readily modified with a biotin or other functional groups17. We showed that this reagent provides an effective way to map RNA secondary structures by labeling guanines in single-stranded RNAs under mild conditions in live cells17. Based on this initial success, we reasoned that N3-kethoxal should also enable specific ssDNA labeling and profiling, because the formation of Watson-Crick base-pairing in dsDNA blocks the labeling reaction (Fig. 1a).
Fig. 1 |. Probing single-stranded DNA regions in the genome by using KAS-seq.
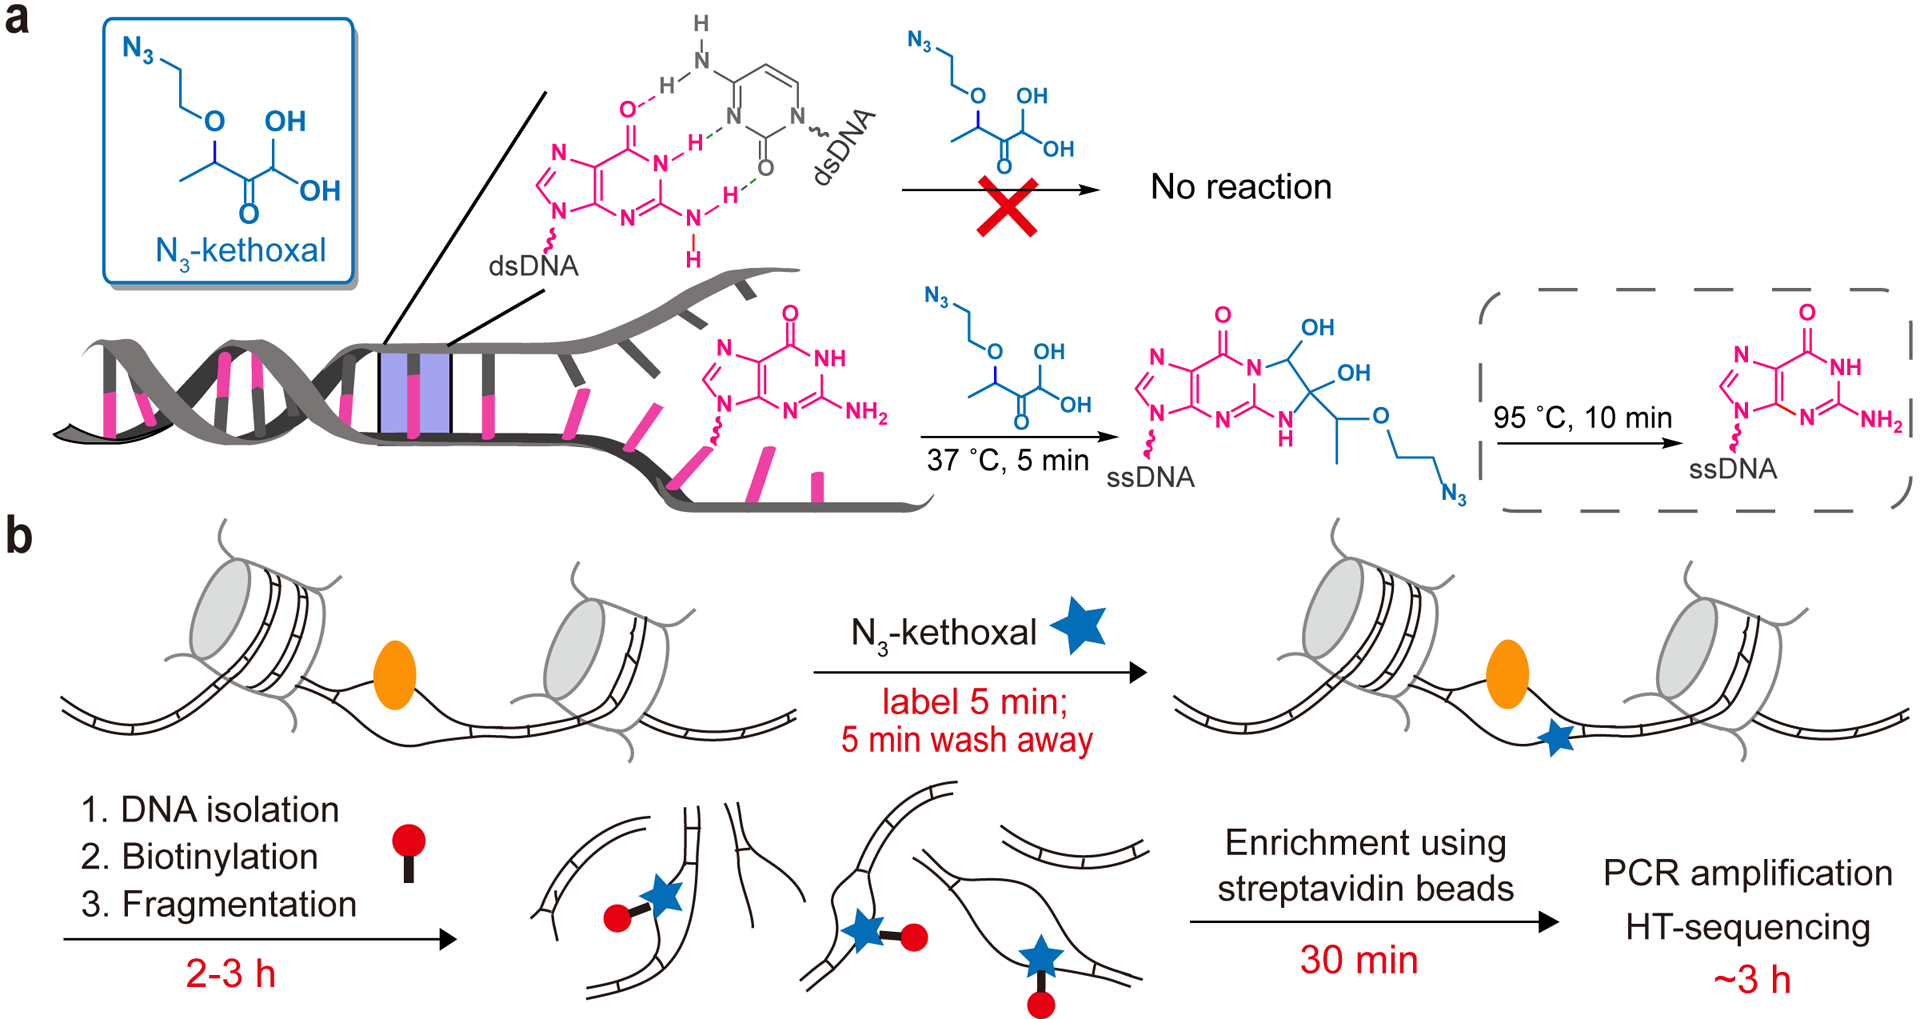
a, The molecular structure of N3-kethoxal and how N3-kethoxal labels guanines in single-stranded DNA but not in double-stranded DNA. b, The scheme of KAS-seq. N3-kethoxal (blue star) reacts with single-stranded guanines in the genome (resolved by DNA-binding proteins, such as Pol II as shown in yellow), which can be further biotinylated (red) and enriched for sequencing. The whole process takes 6–7 h in total, from live cell labeling to finish library preparation.
We first performed in vitro labeling assay using a synthetic DNA oligo probe containing four deoxyguanosine bases. After incubating the oligo with N3-kethoxal at 37 ˚C for 5 min, all four deoxyguanosine bases on all oligo molecules were labeled (Extended Data Fig. 1a), suggesting a high labeling reactivity of N3-kethoxal on ssDNA in vitro. While N3-kethoxal reacts with deoxyguanosine bases under neutral conditions within 2 min, very few L-arginine could be labeled within 10 min under the same conditions (Extended Data Fig. 1b), indicating that protein labeling could be minimized under the labeling conditions of KAS-seq. After labeling live cells with N3-kethoxal, genomic DNA (gDNA) can be isolated and subjected to biotinylation through ‘click’ chemistry before being fragmented. The single-stranded fragments can then be enriched through the biotin-streptavidin interaction and subjected to library construction (Fig. 1b). N3-kethoxal labels can be removed by a short heating at 95 ˚C to avoid affecting PCR amplification17. The entire KAS-seq protocol can be finished within one day.
KAS-seq signals mark active transcription
We performed KAS-seq starting from one million live HEK293T cells and mouse embryonic stem cells (mESCs). N3-kethoxal labeling does not affect gDNA isolation yield and purity (Extended Data Fig. 1c, d). KAS-seq performed in the absence of N3-kethoxal or the biotinylation reagent (biotin-DBCO) resulted in negligible biotin signals shown by dot blot (Extended Data Fig. 1e), nor sufficient enriched DNA for library construction (Extended Data Fig. 1f), suggesting minimum background of KAS-seq.
KAS-seq is very robust and reproducible, showing high enrichment efficiency (Extended Data Fig. 2a) along with high correlation (r = 0.99, Extended Data Fig. 2b) and high peak overlap (Extended Data Fig. 2c) between replicates. KAS-seq signals exhibit a similar distribution pattern as Pol II ChIP-seq signals along regions with different G/C contents (Extended Data Fig. 2d), suggesting that the G-specific labeling does not notably induce bias, although G/C content effect should be considered for more specified applications of KAS-seq. KAS-seq reads are considerably enriched at gene-coding regions, especially at gene promotors and transcription termination areas, while depleted at intergenic regions (Fig. 2a). KAS-seq profile on gene-coding regions revealed a strong and sharp peak around transcription start site (TSS), relatively weak and broad signals that cover the entire gene body, and a strong but broad peak starting from transcription end site (TES) to its downstream regions (Fig. 2b, Extended Data Fig. 2e). KAS-seq signals show positive correlations with histone modifications that mark active transcription, such as H3K4me3, H3K27ac, and H3K36me3, and are negatively correlated with inactive chromatin markers such as H3K27me3 and H3K9me3 (Fig. 2c). Notably, KAS-seq signals correlate better with H3K36me3 than ATAC-seq results do, indicating that while ATAC-seq serves as a powerful tool to probe chromatin accessibility18, KAS-seq directly measures transcription activities. KAS-seq signals at TSS overlap with H3K4me3 and H3K27ac, and those at gene body overlap with H3K36me3 (Fig. 2d, Extended Data Fig. 2f). These results collectively suggest that KAS-seq signals are derived from the Pol II-mediated transcription. We also compared KAS-seq with permanganate/S1 footprinting. Both methods show similar sensitivity on detecting the strong “promotor melting” signals, but KAS-seq is much more sensitive on detecting the weaker and broad ssDNA signals on the gene bodies and terminal regions (Extended Data Fig. 2e, g).
Fig. 2 |. An overview of KAS-seq in HEK293T cells.
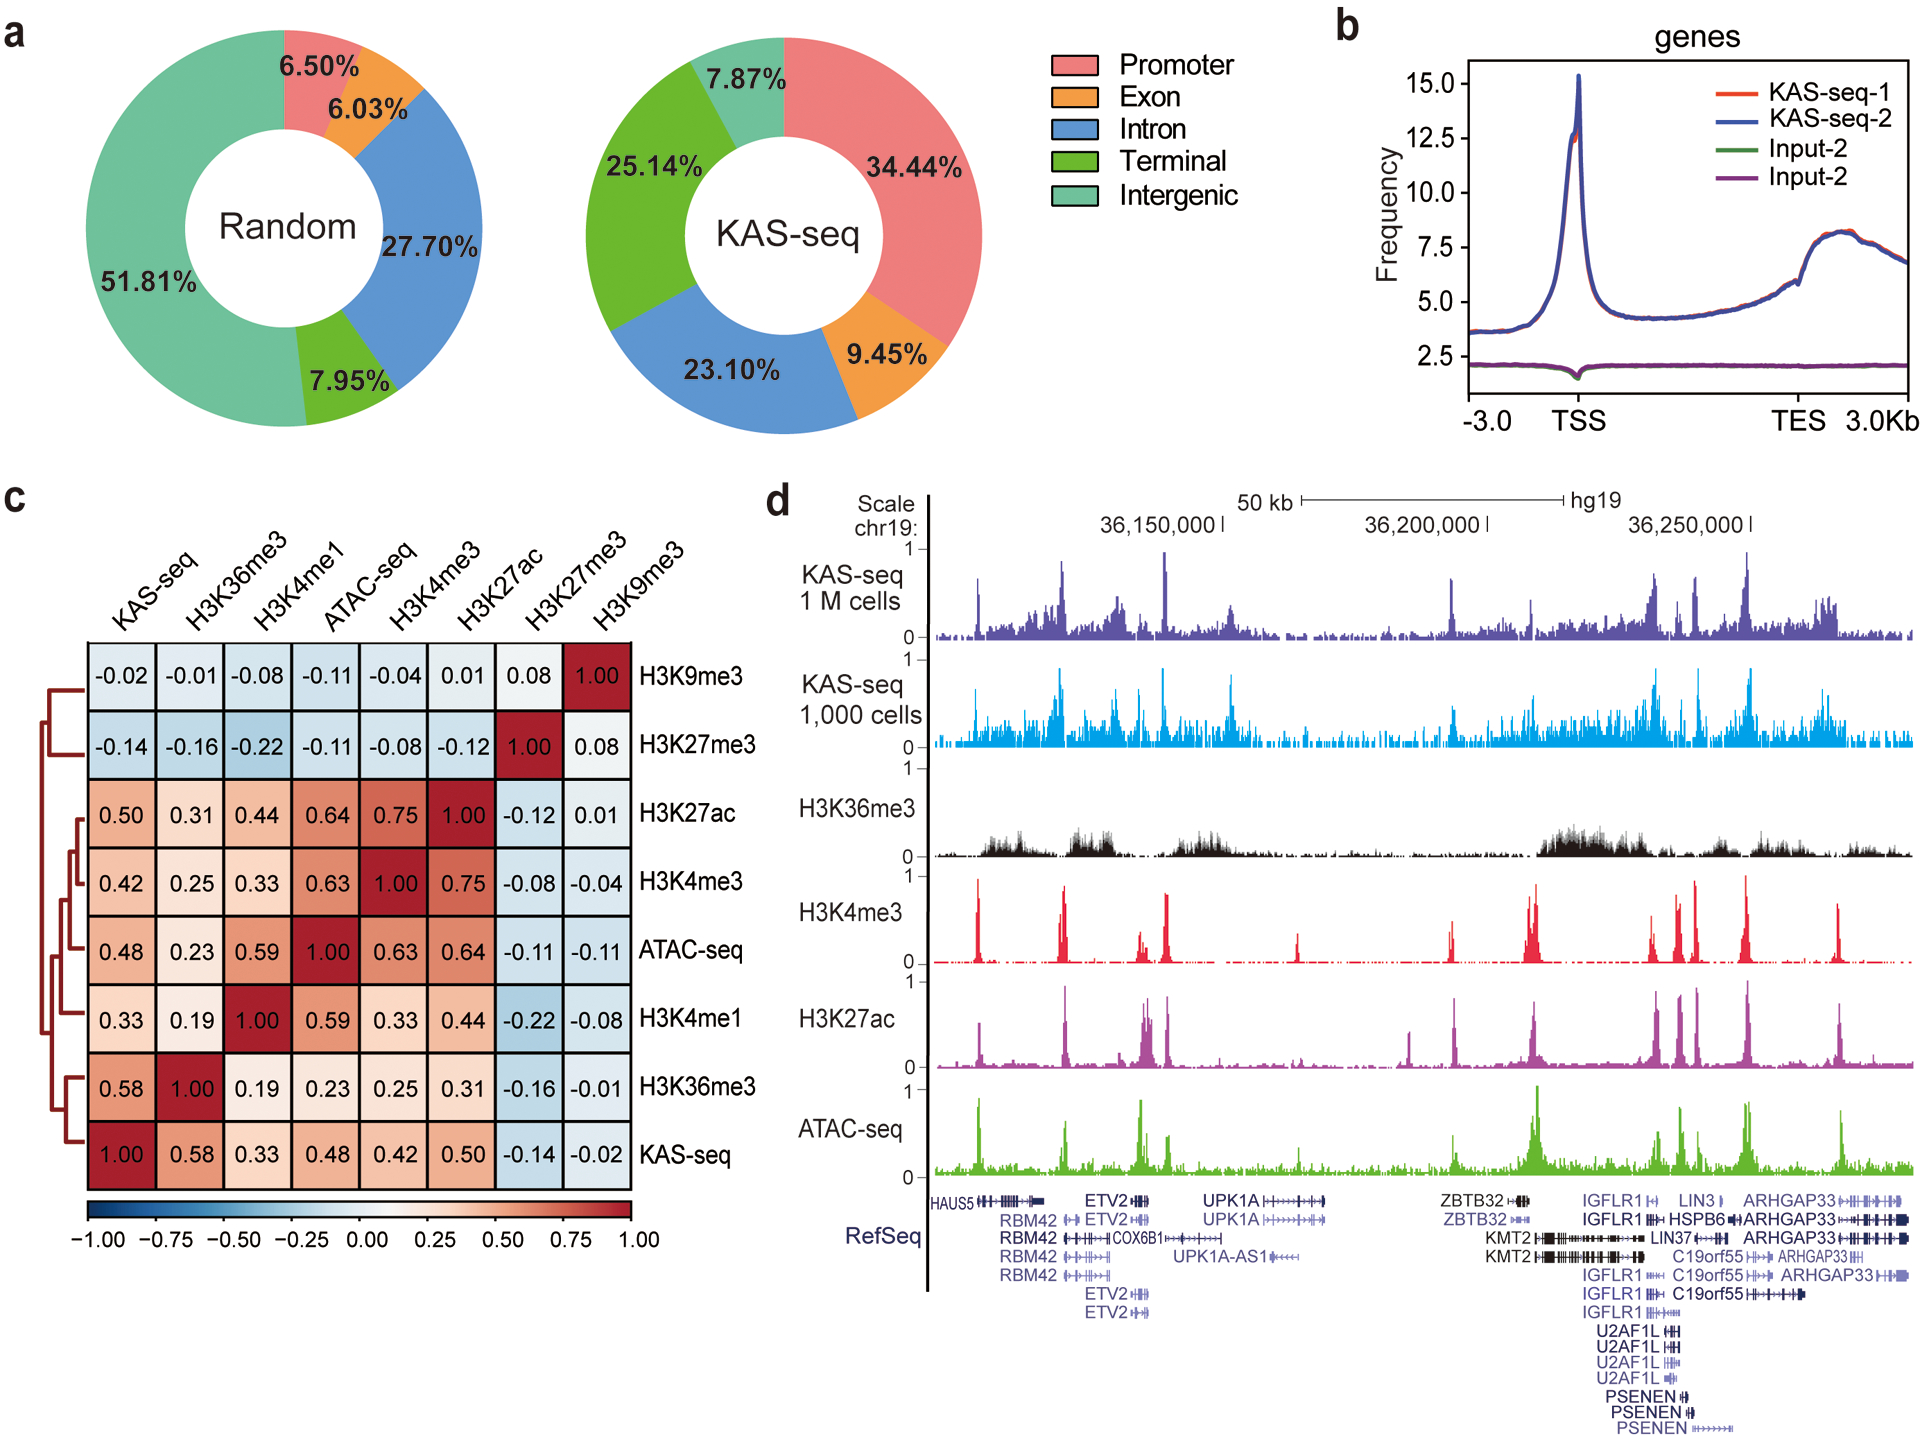
a, Genome-wide distribution of KAS-seq peaks. “KAS-seq” denotes the percentage overlap of KAS-seq peaks with different genomic features. “Random” denotes the percentage overlap of randomly generated regions with the same number and length of real peaks with different genomic features. b, The distribution of KAS-seq signals at gene-coding regions, with 3 kb upstream of TSS and 3 kb downstream of TES shown. c, The genome-wide Pearson correlation heatmap among averaged KAS-seq signals, selected histone modifications, and ATAC-seq reads density in HEK293T cells. Heatmap was clustered using hierarchical clustering, with pairwise correlation coefficients noted in each square (n = 302,755 10 kb bins in the hg19 genome). d, A snapshot from UCSC Genome Browser, showing the relationship between KAS-seq peaks, selected histone modifications, and ATAC-seq peaks at a highlighted locus.
Because of the high guanine labeling reactivity of N3-kethoxal and the high affinity between biotin and streptavidin, KAS-seq is expected to maintain its sensitivity when using low-input starting materials or primary tissue samples. Indeed, the distribution of KAS-seq signals at gene-coding regions and the overlap with histone modifications remain unchanged by using 10,000, 5,000 or even 1,000 HEK293T cells (Fig. 2d, Extended Data Fig. 3a, b). KAS-seq results with low input cells showed similar enrichment efficiency and captured similar numbers of peaks compared with KAS-seq libraries generated from 1 million cells (Extended Data Fig. 3c, d). KAS-seq performed by using mice liver tissues also show strong signals at TSS, with weakened signals on the gene bodies and at TES regions (Extended Data Fig. 3e). Thus, KAS-seq is a method suitable for a wide range of potential applications to study rare cell samples and clinical samples in the future.
KAS-seq reveals the dynamics of transcriptionally engaged Pol II
We next compared KAS-seq in HEK293T cells with GRO-seq and Pol II ChIP-seq in the same cell line. KAS-seq results correlate well with results from these assays (Fig. 3a). In mESCs, ~95% of KAS-seq peaks on promotors overlap with Pol II ChIP-seq peaks (Extended Data Fig. 4a). Reads density of KAS-seq and Pol II ChIP-seq on the gene bodies show a strong positive correlation (Pearson r = 0.81, Extended Data Fig. 4b). We then ranked all genes into four groups according to their expression levels based on RNA-seq data (Extended Data Fig. 4c), and showed that the strength of KAS-seq signals drop notably in genes with low expression levels (Fig. 4b).
Fig. 3 |. KAS-seq reveals Pol II dynamics and defines gene transcription states.
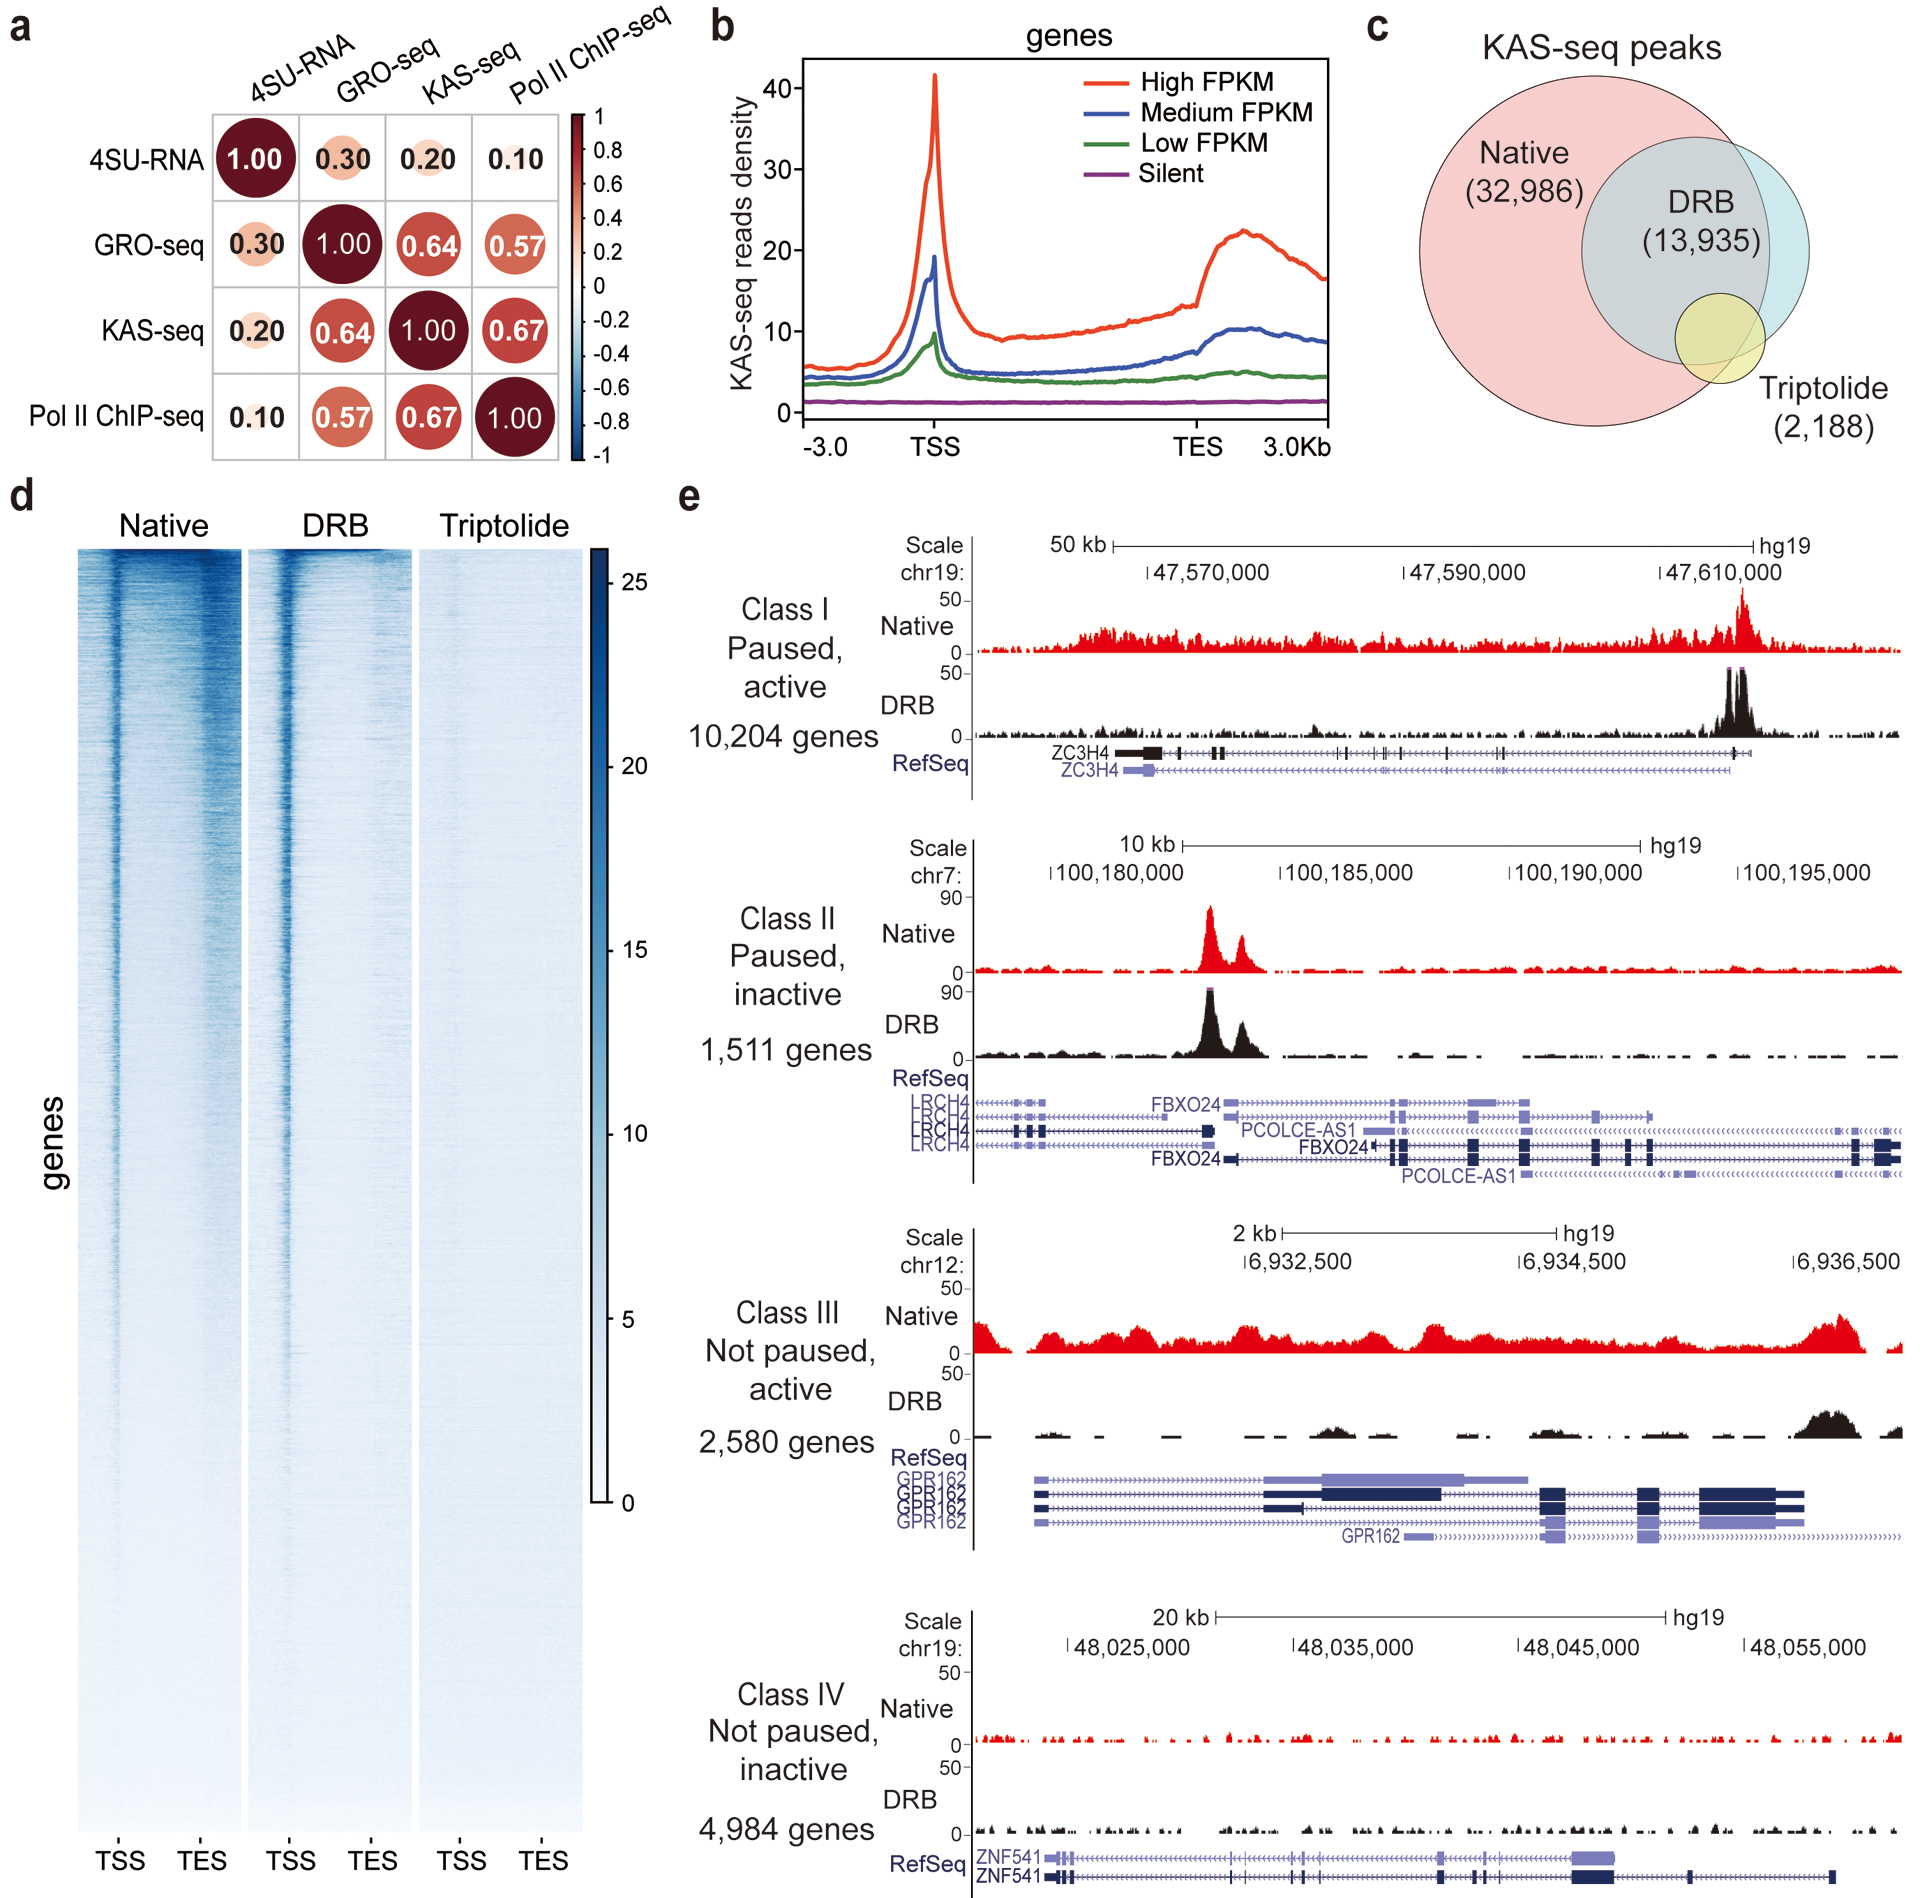
a, Genome-wide Pearson correlation heatmap between KAS-seq, Pol II ChIP-seq, GRO-seq, and nascent RNA-seq (4SU-seq) reads density on gene-coding regions in HEK293T cells. Pairwise correlation coefficients are noted in each square (n = 839,684 1 kb bins in the hg19 genome). b, KAS-seq reads density at gene-coding regions of genes with different expression levels (defined by RNA-seq) in HEK293T cells. c, Venn diagram showing overlap of KAS-seq peaks in HEK293T cells under native, DRB treatment, and triptolide treatment conditions. The number of common peaks between two replicates was used in each case. d, Heatmap showing KAS-seq signal distribution at gene-coding regions under native, DRB treatment, and triptolide treatment conditions. Regions of 3 kb upstream of TSS and 3 kb downstream of TES were shown. e, Defining four groups of genes with different transcription states based on KAS-seq results. In each group, one gene is shown as an example by using the snapshot of KAS-seq signals under native and DRB-treated conditions.
Fig. 4 |. A portion of enhancers exist as single-stranded, which possess higher enhancer activity and are associated with critical functions.
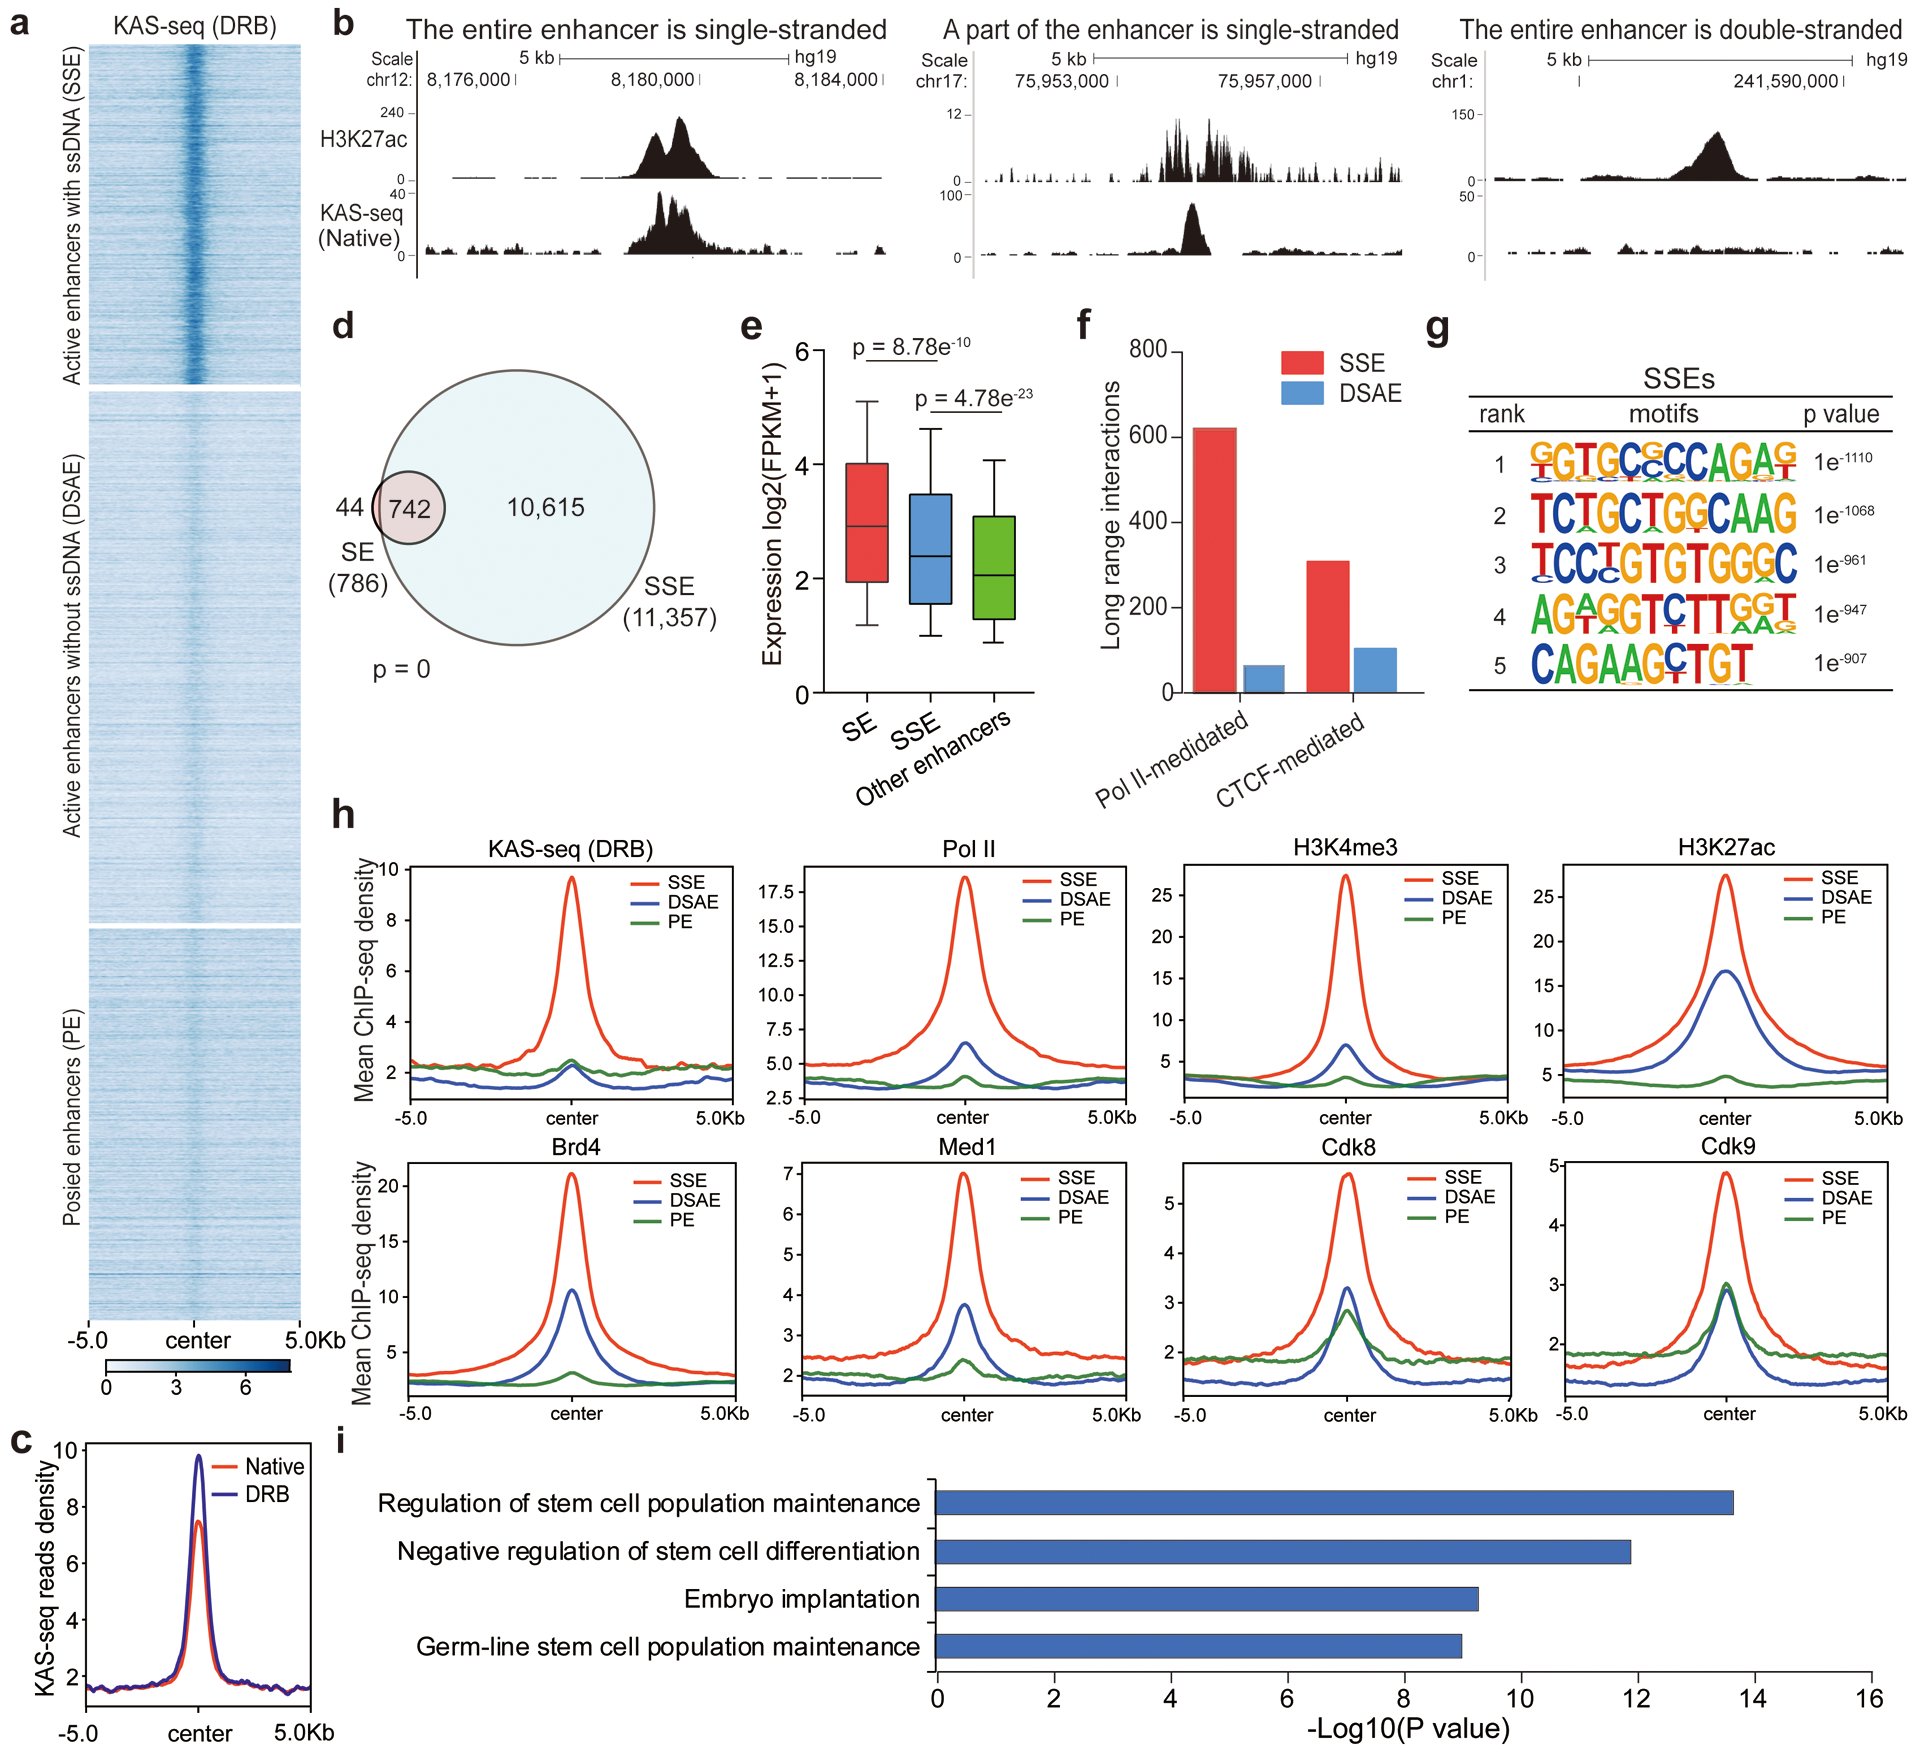
a, Heatmap of KAS-seq reads density at all enhancer regions in mESCs. Active and poised enhancer regions are defined by distal H3K27ac and H3K4me1 signals. Active enhancers are sub-grouped into SSEs and DSAEs. More than 40% of active enhancers (25% of all enhancers) are single-stranded. b, Snapshots of HEK293T KAS-seq under the native condition and H3K27ac signals from UCSC Genome Browser, showing examples that the entire enhancer is single-stranded, a part of the enhancer is single-stranded, or the entire enhancer is not single-stranded, respectively. c, KAS-seq reads densities on ssDNA-containing enhancers in mESCs under native and DRB-treatment conditions. d, The numbers of ssDNA-containing enhancers and super-enhancers in mESCs and their overlap. The p value was calculated using two-sided Fisher’s exact test. e, Boxplot showing the expression levels of genes regulated by denoted enhancers. 10 – 90 percentile of data points are shown, with the center line showing the median, and the box limits showing the upper and lower quartiles. P values were calculated using two-sided unpaired Student’s t-test (n = 617 genes for SEs, n = 3,262 genes for SSEs, n = 3,367 genes for other enhancers). f, ssDNA-containing enhancers possess more long range interactions mediated by both Pol II and CTCF than those from double-stranded active enhancers. Both Pol II-mediated and CTCF-mediated long-range interactions were defined from public ChIA-PET data in mESCs. g, Sequence motifs enriched in ssDNA-containing enhancers in mESCs. P-values were calculated by using two-sided binomial test (n = 786 SSEs). h, Metagene profiles of KAS-seq (DRB), Pol II, H3K4me3, H3K27ac, Brd4, Med1, Cdk8, and Cdk9 ChIP-seq reads densities at denoted enhancers in mESCs. Regions within 10 kb around the enhancer centers are shown. i, GREAT analysis of genes regulated by ssDNA-containing enhancers in mESCs. P-values were calculated by using two-sided binomial test (n = 786 SSEs). SSE: ssDNA-containing enhancers; DSAE: double-stranded active enhancers; PE: poised enhancers.
To further validate that transcriptionally engaged Pol II is the primary source of detected ssDNA signals, we treated HEK293T cells with 5,6-dichlorobenzimidazole 1-β-D-ribofuranoside (DRB) and triptolide, respectively, before performing KAS-seq. DRB inhibits Pol II release from pausing at TSS, and triptolide inhibits recruitment and loading of Pol II to promoters19. While the majority of peaks overlap with those at the native state, after DRB and triptolide treatment, KAS-seq peak numbers decreased by 57% and 93%, respectively (Fig. 3c). As expected, DRB severely diminished ssDNA signals at gene body and TES regions with increased signals at TSS; triptolide almost completely erased all signals at the entire gene-coding regions (Fig. 3d, Extended Data Fig. 4d, e). These observations confirm that the strong and sharp KAS-seq peaks on gene promotors reflect transcription initiation and Pol II pausing near TSS3,13, and that KAS-seq signals at gene bodies are derived from transcription elongation.
Comparing KAS-seq signals at promotor-proximal and gene body regions enabled us to sort genes into four classes with distinct transcription states: class I, paused and active; class II, paused and inactive; class III, not paused and active; class IV, not paused and inactive (Fig. 3e, Extended Data Fig. 4f). In HEK293T cells, 60% (11,715 out of 19,279) of all genes showed significant pausing signals around TSS, and the majority of these paused genes (10,204 out of 11,715) also showed active Pol II elongation, which is consistent with results obtained previously from GRO-seq3.
Apart from signals on promotors and gene bodies, we also found KAS-seq signals considerably enriched at transcription termination regions (Fig. 1a, b). These signals were removed by DRB treatment (Extended Data Fig. 5a), indicating that they are derived from Pol II elongation (and pausing) at the termination window. We sorted all genes with KAS-seq signals at this region into three groups according to the length of their termination signals (Extended Data Fig. 5b). We then analyzed the averaged KAS-seq reads density on the entire terminal region of the three groups without observing notable differences (Extended Data Fig. 5c), suggesting that KAS-seq does not exhibit length-dependent bias. We calculated the ‘termination index’ as the ratio of reads density at TES-downstream regions relative to the density in the promotor-proximal regions (Extended Data Fig. 5d). KAS-seq revealed a higher termination index than Pol II ChIP-seq and GRO-seq do in the same cell line (Extended Data Fig. 5e), suggesting that Pol II accumulation at TES-downstream regions can be more than previously expected.
KAS-seq detects Pol I- and Pol III-mediated transcription events and non-B form ssDNA structures in the same assay
RNA polymerase I (Pol I) transcribes 5.8S, 18S, and 28S ribosomal RNAs (rRNAs); RNA polymerase III (Pol III) synthesize 5S rRNAs, transfer RNAs (tRNAs) and some small RNAs20,21. As expected, apart from detecting Pol II activities, KAS-seq simultaneously detects transcription events mediated by Pol I and Pol III, which do not respond to DRB and triptolide (Extended Data Fig. 6a–c). Note that only a portion of tRNAs are actively transcribed (411/606) (Extended Data Fig. 6b), which may suggest a transcription level regulation of codon usage. KAS-seq can thus monitor the transcription activity dynamics of all RNA polymerases in one assay.
We also noticed many KAS-seq peaks that are not derived from Pol I or Pol III-mediated transcription under triptolide-treatment condition; these peaks could be derived from other DNA forms and telomeric DNAs. We followed a previous report22 to predict potential genomic locations of different non-B form DNA species, including cruciform, quadruplex, H-DNA, Z-DNA, and hairpin structures. We found a number of KAS-seq signals under triptolide-treatment condition overlap with these non-B DNA and telomere regions (Extended Data Fig. 6d–e) with significant enrichment (Extended Data Fig. 6f), suggesting potential applications of KAS-seq to study other ssDNA-involved biological processes.
Many enhancer regions are single-stranded, which correlate with higher enhancer activity
Pol II is known to bind at certain enhancers and generate enhancer RNAs bidirectionally2. KAS-seq could, therefore, identify enhancers that are being transcribed by Pol II. We defined enhancers with KAS-seq peaks as ssDNA-containing enhancers (SSEs). We used the KAS-seq data under DRB-treatment conditions to annotate SSEs, because some enhancers are located at gene bodies that can form ssDNA upon transcription elongation. Only around 25% of all annotated enhancers were defined as SSEs in mESCs, with the majority of enhancers showing no KAS-seq signal (Fig. 4a, b). Note that the cutoff we used for peak-calling filters off some weak KAS-seq signals, which may appear in the defined double-stranded enhancers.
ssDNA-containing enhancers include two sub-types, with one type showing KAS-seq signals spanning over the entire enhancer, and the other type showing KAS-seq signals more localized when comparing with H3K27ac signals (Fig. 4b). KAS-seq signals at ssDNA-containing enhancers tend to increase upon DRB treatment (Fig. 4c), supporting the presence of enhancer transcription pausing and elongation23. ssDNA-containing enhancers include 94% of super-enhancers24, suggesting most of the super-enhancers are actively transcribed (Fig. 4d). Genes associated with SSEs show higher expression levels (Fig. 4e), and these enhancers possess much more long-range interactions mediated by both CTCF and Pol II (Fig. 4f), indicating that these transcribing enhancers may possess stronger capability to activate their target genes.
ssDNA-containing enhancers appear to enrich unique sequence motifs (Fig. 4g), suggesting their distinct sequence features and potential binding by specific transcription factors (TFs). To compare SSEs with enhancers that simply possess high TF-binding signals, we sorted all ATAC-seq-positive enhancers into two groups according to whether they possess KAS-seq signals or not. We found 50% of ATAC-seq-positive enhancers show no (or very weak) KAS-seq signals in mESCs (Extended Data Fig. 7a). The averaged intensities of ATAC-seq signals on these two groups are similar (Extended Data Fig. 7b), but genes associated with the KAS-seq-positive group show a higher expression level (Extended Data Fig. 7c). Sequence motifs enriched in ATAC-seq-positive but KAS-seq-negative enhancers are different from those in SSEs (Extended Data Fig. 7d).
We then examined the occupancy of Pol II, histone modifications, and other transcription regulatory proteins on the ssDNA-containing enhancers. Consistent with them being transcribed, the occupancy of Pol II, H3K4me3, H3K27ac, Med1, Cdk8, and Cdk9 on these enhancers are considerably higher than those double-stranded enhancers (Fig. 4h). Moreover, while the binding of Oct4, Nanog, and Sox2 showed no significant difference in SSEs comparing with double-stranded ones (Extended Data Fig. 7e), Brd4 is considerably enriched in SSEs (Fig. 4h). Brd4 was previously reported to regulate the expression of pluripotency factors such as Oct4 and Nanog in mESCs and mouse embryos25–27, indicating potential roles of these transcribing enhancers on regulating mESC differentiation. Moreover, gene ontology28 analysis revealed critical biological processes enriched in genes regulated by ssDNA-containing enhancers, including regulation of stem cell population maintenance, differentiation, and embryo implantation (Fig. 4i).
In HEK293T cells, though the ratio of SSEs over total enhancers is lower than that in mESCs (Extended Data Fig. 8a), KAS-seq results show similar high overlap with super-enhancers, response to DRB treatment, and high correlations with Pol II, H3K4me3 and H3K27ac signals (Extended Data Fig. 8b–e). Chromatin regulatory factors such as CTCF and YY1, as well as transcription factors such as SP1, SP2, MAZ, NCAPH2, KLF8, and KLF9 showed high occupancy on these ssDNA-containing enhancers (Extended Data Fig. 9a), with their binding motifs enriched at these regions (Extended Data Fig. 9b). Several other zinc-finger-domain-containing TFs were also shown enriched on these SSEs (Extended Data Fig. 9a). mRNA processing, translation regulation, and several other essential pathways are enriched in genes regulated by these enhancers (Extended Data Fig. 9c). Enriched TFs and gene sets in HEK293T cells are different from those in mESCs, suggesting potential regulatory functions by these transcribing enhancers in cell-type-specific manners.
Collectively, KAS-seq is able to detect SSEs as transcribing enhancers, which appear to possess distinct genomic features and unique TF-binding footprints. Consistent with previous observations29–33, these enhancers are associated with higher enhancer activity and can be cell-type specific.
ssDNA dynamics upon the inhibition of protein condensates
Considering the fast reaction between N3-kethoxal and ssDNA as well as the high sensitivity of KAS-seq, we speculated that KAS-seq can detect transcription dynamics in transient events. Protein condensates are highly dynamic structures formed through interactions between mediators, TFs, and other transcription coactivators, and were shown to incorporate Pol II to activate transcription34–38. 1,6-hexanediol is widely used to dissociate these condensates in vivo, reducing the occupancy of BRD4, MED1, and Pol II on many genes and enhancers36. However, how transcription (Pol II) is perturbed dynamically during this process has not been fully elucidated.
To probe protein condensation dynamics taking advantage of the superb sensitivity of KAS-seq, we performed KAS-seq in HEK293T cells treated with 1.5% 1,6-hexanediol for 0 min (no treatment), 5 min, 15 min, 30 min, and 60 min, respectively. PCA analysis showed that KAS-seq profiles at each time point are distinct from the others (Extended Data Fig. 10a), indicating dynamic transcription changes happening from 5 min to 60 min. Consistent with previous results36, total KAS-seq signals on gene body gradually decrease from 15 min to 60 min (Extended Data Fig. 10b), supporting a role of protein condensate formation on transcription activation. However, after 5 min treatment, we observed a previously unnoticed increase of ssDNA clustered in a ~4 kb window around TSS, which resulted in a slightly increased ssDNA signal on gene body, accompanied by a decreased ssDNA signal at TSS (Fig. 5a–c, Extended Data Fig. 10b). These ssDNA clusters form at both directions of TSS at bi-directional promotors (Fig. 5a), while they were only observed at TSS downstream regions for uni-directionally transcribed genes (Fig. 5b). As time went by, these clustered ssDNA signals moved continuously towards TES and gradually diminished, accompanied with increased ssDNA signals at promotor-proximal regions (Fig. 5a–c, Extended Data Fig. 10c).
Fig. 5 |. KAS-seq reveals transcription dynamics upon inhibition of protein condensation.
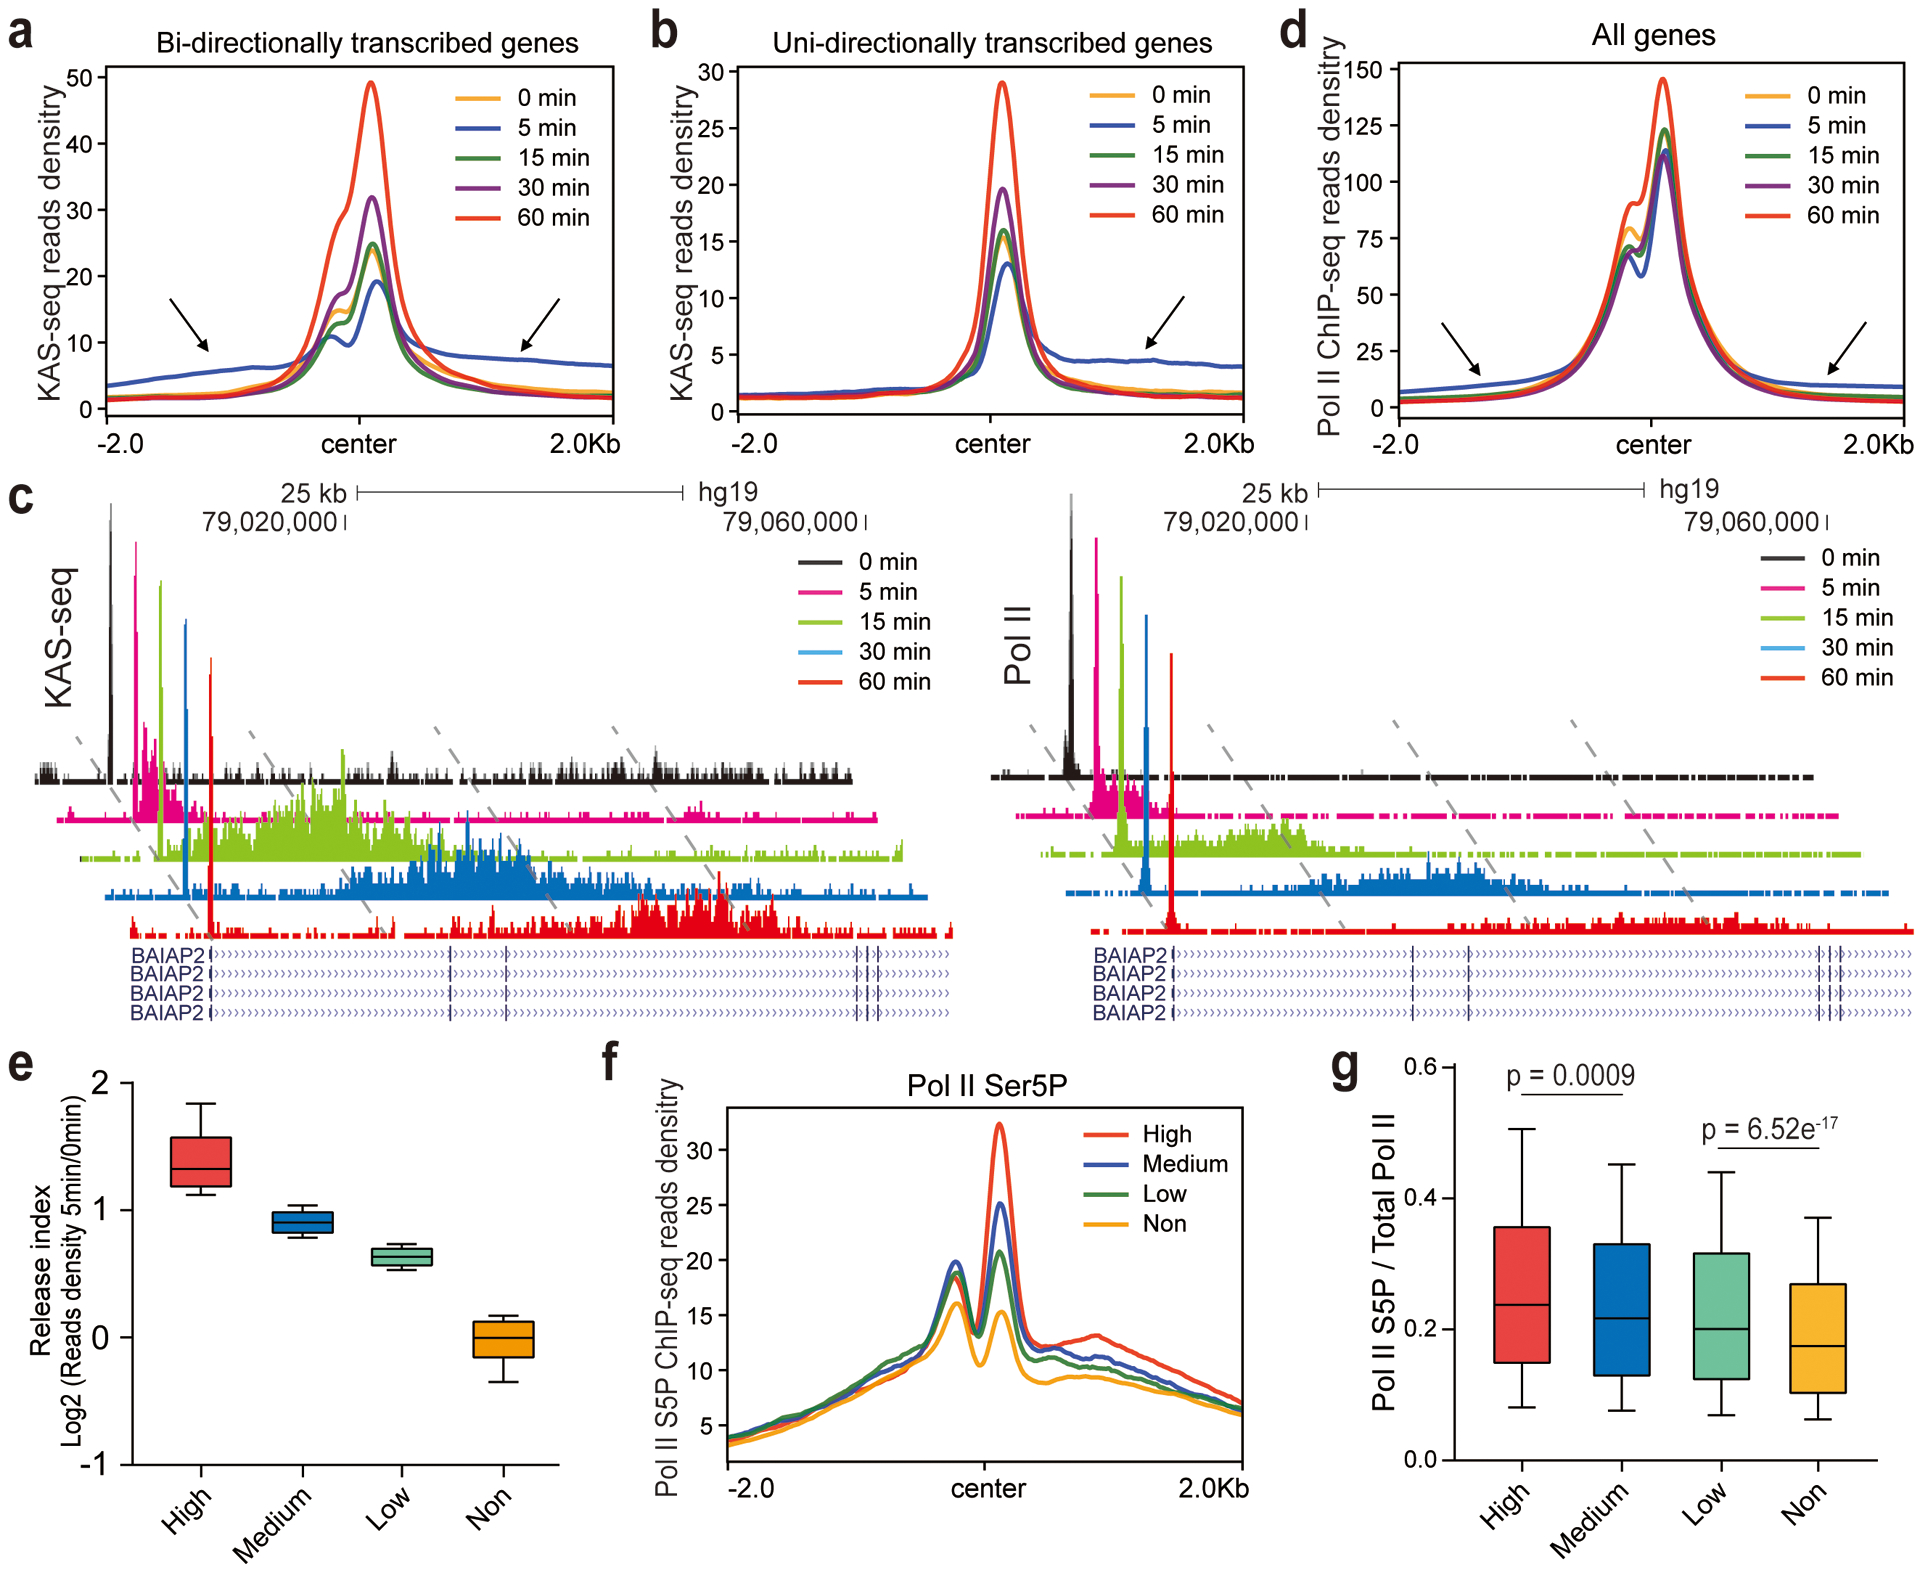
a,b, KAS-seq read densities around TSS on uni-directional (a) and bi-directional (b) transcribed genes after HEK293T cells were treated with 1,6-hexanediol for denoted time intervals. Arrows indicate the upstream and downstream “released” KAS-seq signals at the 5 min time point. c, Snapshots of KAS-seq and Pol II ChIP-seq signals on the BAIAP2 gene after cells were treated with 1,6-hexanediol for denoted time intervals. Snapshots at different time points for each data set are staggered to clearly show differences. Autoscale setting was used for all tracks. The genomic coordinates and the Refseq tracks are aligned to the 60 min time point. d, Pol II ChIP-seq read densities around TSS after cells were treated by 1,6-hexanediol for denoted time intervals. e, Boxplot showing the calculated release index of high (n = 1,730 genes), medium (n =1,730 genes), low (n = 1,730 genes) and non-responsive (n = 1,188 genes) genes. f, Pol II CTD S5P densities on four groups of genes that respond to 1,6-hexanediol to different extents. g, Boxplot showing the ratio of Pol II S5P over total Pol II on TSS in four groups of genes with different strength of responses to 1,6-hexanediol (n = 1,730 for high responsive genes, n = 1,730 for medium responsive genes, n = 1,730 for low responsive genes, and n = 1,188 for non-responsive genes). For e and g, 10 – 90 percentile of data points are shown, with the center line showing the median, and the box limits showing the upper and lower quartiles. P values were calculated using two-sided unpaired Student’s t-test.
We next performed Pol II ChIP-seq at corresponding time points to validate the observations revealed by KAS-seq. The change of Pol II binding generally followed the changes observed by KAS-seq, with a portion of clustered Pol II released from TSS and subsequently moved towards TES at a similar speed as ssDNA clusters (Fig. 5c, d, Extended Data Fig. 10c). Notably, the moving speed of these released Pol II is notably slower (~40 kb per hour, Fig. 5c, Extended Data Fig. 10c) than the rate of Pol II elongation under native condition (>200 kb per hour)5, perhaps due to a lack of certain regulatory components under 1,6-hexanediol treatment.
We defined and ranked genes with the aforementioned ‘release’ feature by calculating a ‘release index’, as the ratio of KAS-seq reads density at 0.5–2.5 kb downstream TSS at 5 min versus that under native state, and defined 4,510 genes as ‘fast responsive genes’, with significant ssDNA cluster formation at this region (Fig. 5e). We then performed similar analysis by using Pol II ChIP-seq. 75% (2,020/2,685) of fast responsive genes defined by Pol II ChIP-seq overlap with those detected by KAS-seq, but KAS-seq detected considerably more genes (Extended Data Fig. 10d). This number difference and the metagene profiles (Fig. 5a, b, d) showed that KAS-seq exhibits higher sensitivity than Pol II ChIP-seq on revealing transcription dynamics during the early stage of inhibition. The extent of Pol II release correlates with the Pol II CTD serine 5 phosphorylation (S5P) level at TSS at the native state (Fig. 5f, g), supporting Pol II phosphorylation as a mechanism to tune transcription regulated through condensate formation19,39.
Discussion
KAS-seq simultaneous detects the dynamics of transcriptionally engaged Pol II, transcribing enhancers, potential non-B form ssDNA structures, and the activities of Pol I and Pol III with high sensitivity and low input materials. ssDNA hotspots may also form during DNA damage40, DNA replication, and meiotic/mitotic double-strand break (DSB)41,42. Although we focused on transcription in this work, KAS-seq can be useful for understanding all of these processes. The robust and tissue-friendly nature coupled with low input material requirement make KAS-seq a method that can be broadly applied to profile transcription dynamics and other ssDNA-involving processes in rare samples such as primary cells and patient samples.
ssDNA-containing enhancers show unique sequence features, correlates with more active transcription of downstream genes, and enrich certain functions. Although we observed two different types of ssDNA-containing enhancers, our current analysis did not distinguish these two types. Current KAS-seq has a similar resolution as ChIP-seq, which is commonly used to study and define enhancers. Other techniques with higher resolution, or a high-resolution version of KAS-seq may be applied to differentiate the two types of enhancers and study their unique properties.
KAS-seq revealed a previously unnoticed phosphorylation-dependent Pol II releasing from promotors to elongation at an early stage of protein condensate inhibition, suggesting that protein condensates at promotors may store pre-phosphorylated Pol II19 and facilitate fast initiation-elongation transition. Released Pol IIs move continuously at a relatively slow speed upon condensate inhibition, while new Pol IIs recruited to the promotor are not subjected to release, potentially due to the dissociation of a series of key TFs, coactivators, and kinases required for elongation. A similar process may exist during cell response to other stresses. The nature of the Pol II complexes that are released from the promoter and elongated at a slow rate is unclear at this moment, nor is its potential physiological relevance or functional roles. Future characterization of this process and the complexes involved may reveal new insights into transcription regulation.
Methods
Labeling DNA oligos with N3-kethoaxl in vitro
1 μL 100 mM synthetic DNA oligo (IDT) was mixed with 5 μL nuclease-free water, 2 μL 5× reaction buffer (0.5 M sodium cacodylate, 50 mM MgCl2, pH 7.0) and 2 μL 500 mM N3-kethoxal (DMSO solution). The mixture was incubated at 37 ˚C for 10 min. The reaction product was purified by Micro Bio-Spin™ P-6 Gel Columns (Biorad, 7326222) and then used for MALDI-TOF analysis directly. 2’4’6’-trihydroxyacetophenone (10 mg/mL in 50% CH3CN/H2O) and ammonium citrate (50 mg/mL in H2O) was mixed in 1:8 (v/v) ratio as the matrix for MALDI-TOF. 1 μL purified reaction product was mixed with 1 μL matrix on the MALDI sample plate and analyzed by Bruker Ultraflextreme MALDI-TOF-TOF.
Dot blot
1 μL DNA was loaded onto the Amersham Hybond-N+ membrane (GE Healthcare, RPN119B). Membranes were air-dried and were crosslinked by UV stratalinker 2400 at 150 mJ/cm2 twice. The membranes were then blocked overnight in 5% fatty-acid free BSA in PBST (0.1% Tween-20). The second day, the membrane was washed and incubated in streptavidin-HRP (Thermo, S-911) in PBST supplemented with 3% fatty-acid free BSA. The membrane was washed in PBST for 5 times before developed by SuperSignal™ West Pico PLUS Chemiluminescent Substrate (Thermo, 34577).
Comparing the labeling reactivity of N3-kethoxal on deoxyguanosine and L-arginine
2 mM deoxyguanosine or 2 mM L-arginine were mixed with 4 mM N3-kethoxal in neutral reaction buffer (0.1 M sodium cacodylate, 10 mM MgCl2, pH 7.0), respectively, at 37 ˚C and the reactions were monitored by thin-layer chromatography (TLC). The reaction between N3-kethoxal and deoxyguanosine was developed in 2:1 (v/v) ratio of dichloromethane and methanol, and was visualized by 254 nm UV light. The reaction between N3-kethoxal and L-arginine was developed in 1:1 (v/v) ratio of acetonitrile and ammonium hydroxide, and was visualized by ninhydrin staining.
Cell culture
HEK293T cells were purchased from ATCC (CRL11268) and were cultured in DMEM (Gibco 11995) supplemented with 10% (v/v) fetal bovine serum (Gibco), 1% penicillin and streptomycin (Gibco) and grown at 37 ˚C with 5% CO2. Murine embryonic stem (ES) cells were purchased from ATCC (CRL-1821) and were cultured in DMEM (Gibco 11995) supplemented with 10% (v/v) fetal bovine serum (Gibco), 1 mM L-glutamine (Gibco), 0.1 mM β-mercaptoethanol (Gibco), 1% (v/v) nonessential amino acid stock (100×, Gibco), 1% penicillin/streptomycin stock (100×, Gibco), and 1,000 U/mL LIF (Millipore).
Cell lines used in this study were examined for mycoplasma contamination test using LookOut Mycoplasma PCR Kit (Sigma, MP0035).
KAS-seq
N3-kethoxal was synthesized according to a previous protocol17. Cells were incubated in completed culture medium containing 5 mM N3-kethoxal and for 5–10 min at 37 ˚C, 5% CO2. For transcription inhibition experiments, cells were treated for 2 h under 100 μM DRB (Sigma, D1916) or 1 μM triptolide (Sigma, T3652) before incubated in the N3-kethoxal-containing medium. For 1,6-hexanediol treatment experiments, cells were treated with 1.5% (v/v) 1,6-hexanediol (Sigma, 240117) in the culture medium for 0 min, 5 min, 15 min, 30 min, and 60 min, respectively, before subjected to N3-kethoxal labeling. Cells were harvested and genomic DNA (gDNA) were isolated from cells by PureLink genomic DNA mini kit (Thermo, K182002). 1 μg genomic DNA was then suspended in 95 μL DNA elution buffer supplemented with 5 μL 20 mM DBCO-PEG4-biotin (DMSO solution, Sigma, 760749), 25 mM K3BO3, and incubated at 37 ˚C for 1.5 h with gentle shake. 5 μL RNase A (Thermo, 12091039) was added into the reaction mixture followed by incubation at 37 ˚C for 5 min. Biotinylated gDNA was then recovered by DNA Clean & Concentrator-5 kit (Zymo, D4013). gDNA was suspended into 100 μL water and was fragmented to 150–350 bp size by using Bioruptor Pico at 30s-on/30s-off setting for 30 cycles. 5% of the fragmented DNA was saved as input, and the rest 95% was used to enrich biotin-tagged DNA by incubating with 10 μL pre-washed Dynabeads MyOne Streptavidin C1 (Thermo, 65001) at room temperature for 15 min. The beads were washed and DNA was eluted by heating the beads in 15 μL H2O at 95 ˚C for 10 min. Eluted DNA and its corresponding input were used for library construction by using Accel-NGS Methyl-seq DNA library kit (Swift, 30024). The libraries were sequenced on Illumina Nextseq500 platform with single-end 80 bp mode, aiming to get 30 million reads per library.
A detailed step-by-step KAS-seq protocol by using mammalian cell cultures is included in the Supplementary Protocol and Protocol Exchange43.
KAS-seq using mice liver
Male B6 mice were purchase from the Jackson Laboratory (catalog No: C57BL/6J). All mice were used at 6–12 weeks of age. Mice were housed under pathogen-free conditions per the NIH Guide for the Care and Use of Laboratory Animals. All animal care and experiments were approved by the University of Chicago Institutional Animal Care and Use Committee (IACUC), and is compliant with all relevant ethical regulations regarding animal research.
For KAS-seq performed by using mice liver, the tissue was first homogenized to cell suspension by using a dounce homogenizer or a pestle grinder. The suspended cells were then wash and subjected to typical KAS-seq procedures.
A detailed step-by-step KAS-seq protocol by using mice liver is included in the Supplementary Protocol and Protocol Exchange43.
Low-input KAS-seq
KAS-seq protocol was applied to 1,000, 5,000, and 10,000 HEK293T cells with the following changes. gDNA was isolated from denoted numbers of N3-kethoxal-labeled cells by using Quick gDNA mini plus kit (Zymo, D4068). After biotinylation, gDNA was fragmented by Tn5 transposase (Illumina, 10527865, 1.5 μL for 1,000 cells, 2 μL for 5,000 cells, 5 μL for 10,000 cells) in a 50 μL volume at 37 ˚C for 30 min, followed by a clean-up by DNA Clean & Concentrator-5 kit (Zymo, D4013). After immunoprecipitation using 5 μL pre-washed Dynabeads MyOne Streptavidin C1, DNA-conjugated beads and corresponding inputs were directed used for library PCR by using i5 and i7 index primers (Illumina, 20027213) and NEBNext Ultra II Q5 Master Mix (NEB, M0544S). The PCR reactions were heated at 5 min at 72 ˚C followed by 10 min at 95 ˚C, and were then amplified by 15 cycles (10 sec at 98 ˚C, 30 sec at 60 ˚C, 1 min at 72 ˚C). The libraries were then cleaned-up by using MinElute PCR purification kit (Qiagen, 28804). A detailed step-by-step low-input KAS-seq protocol is included in the Supplementary Protocol and Protocol Exchange43.
ChIP-seq
Cells were crosslinked in 1% formaldehyde diluted in culture medium for 10 min and then quenched with 125 mM glycine for 5 min. 5 million cells were used for all ChIP reactions. Crosslinked cells were resuspended in ice-cold lysis buffer (50 mM HEPES, pH 7.9, 5 mM MgCl2, 0.2% Triton X-100, 20% glycerol, 300 mM NaCl) and incubated on ice for 10 min before centrifuged at 500 g for 5 min. The pellets were resuspended in 0.1% SDS lysis buffer (50 mM HEPES, pH 7.5, 1 mM EDTA, 1% Triton X-100, 0.1% sodium deoxycholate, 0.1% SDS, 150 mM NaCl) and incubate on ice for 10 min and then sheared by using Bioruptor Pico at 30s-on/30s-off setting for 20 cycles. 5% of sheared chromatin was saved as input and the rest was subjected to pre-clear and then mixed with 30 μL protein A/G bead coated with 5–10 μg antibodies. Immunoprecipitation was performed overnight and the beads were washed twice with 0.1% SDS lysis buffer, high salt buffer (50 mM HEPES, pH 7.5, 1 mM EDTA, 1% Triton X-100, 0.1% sodium deoxycholate; 0.1% SDS, 350 mM NaCl), LiCl wash buffer (10 mM Tris-HCl, pH 8.0, 1 mM EDTA, 0.5% NP-40, 0.5% sodium deoxycholate, 250 mM LiCl) and once with TE buffer (10 mM Tris-HCl, pH 8.0, 1 mM EDTA, 0.2% Triton X-100). Enriched chromatin was eluted from the beads by incubating with elution buffer (50 mM NaHCO3, 10 mM EDTA, 1% SDS) at room temperature for 1 h. The eluent and the input were subjected to reverse crosslink and proteinase K digestion before DNA were purified from the mixture by using DNA Clean & Concentrator-5 kit (Zymo, D4013). Recovered DNA was used for library construction by Kapa HyperPlus kit (Kapa, KK8515).
RNA-seq
Total RNA were extracted from cells by using Trizol reagent (Thermo, 15596026). Total RNA were subjected to polyA selection by using Dynabeads mRNA purification kit (Thermo, 61006). 20 ng polyA RNA were used for library construction by using SMARTer Stranded RNA-seq kit (Takara, 634839).
KAS-seq data processing and peak calling
Low-quality and adapter-containing reads were trimmed from KAS-seq raw data using trim-galore44 package under single-end mode. Reads shorter than 50 bp were removed. Trimmed reads were aligned to the reference genome (hg19 for HEK293T cells or mm10 for mESC) using bowtie2 (v2.3.3.1)45 under default parameters. Mapped sam files were subsequently converted and sorted to bam files using samtools sort (v1.9)46. Duplicates were removed using samtools rmdup (v1.9) to get the unique mapped reads. Unique mapped reads were extended to 150 bp to match the average length of insert DNA fragments of the KAS-seq libraries. Bam files were converted to bed files and bedGraph files using bedtools. BedGraph files were then converted to bigWig files using bedgraphtobigwig from UCSC pre-compiled utilities. BedGraph files were used for visualization at UCSC genome browser and bigWig files were used to calculate tag density under 50-bp resolution.
We used MACS47 to call all reported KAS-seq peaks in this manuscript (macs2 callpeak -t KAS-seq_IP.bed -c KAS-seq_Input.bed -n KAS-seq_peaks.bed --broad -g hs --broad-cutoff 0.01 -q 0.01). Because most KAS-seq peaks on gene bodeis are very broad, MACS2 was run using broad peaks-call mode under default parameters, except for ‘--broad-cutoff = 0.1’ and “–qvalue = 0.01”.
Genome-wide distribution of KAS-seq peaks
A group of regions that have the same number and length of KAS-seq peaks were randomly generated from the hg19 genome by using bedtools shuffle. These random regions and real KAS-seq peaks were subsequently overlapped with different genomic features retrieved from the hg19 Refseq annotation in the order of promoters (TSS +/−2 kb), exons, introns, and terminal regions (TES to +2 kb of TES). If a peak overlaps with promoters, it is regarded as a promoter peak and removed from the peak list. The remaining peaks were then subjected to similar overlap analysis with exons, introns, and terminal regions. Peaks do not have overlap with these genomic features are regarded as intergenic peaks.
RNA-seq data processing
Low-quality and adapter-containing reads were trimmed using the trim-galore package under paired-end mode, and any reads shorter than 50 bp were removed. The remaining trimmed sequences were mapped to the reference genome (hg19) with hisat248 under default settings. The expression level of each gene was quantified with normalized FPKM with FPKM_count.pl in the RSeQC49 software. Genes with FPKM higher than 0.5 were defined as expressed genes. In Fig. 3b, expressed genes were ranked and sorted into 3 groups based on their FPKM values, with the top 2,000 defined as high FPKM, 2,000 genes in the middle defined as medium FPKM, and the bottom 2,000 defined as low FPKM. 2,000 genes with FPKM lower than 0.5 were randomly selected and defined as silent genes.
ChIP-seq data processing and peak calling
ChIP-seq data processing and peak calling generally follow the procedure used for KAS-seq data processing and peak calling.
Correlation analysis
Correlation calculations between KAS-seq, histone modification ChIP-seq and ATAC-seq were performed using deeptools50 package. First, multiBigwigSummary was used to calculate averaged read coverage within equally sized 10 kb bins of the entire genome. Regions in the human genome blacklist were excluded from the read coverage calculation. PlotCorrelation was subsequently used to calculate pairwise Pearson correlation coefficients with the output of multiBigwigSummary. Outliers were defined using the median absolute deviation (MAD) method by applying a threshold of 200, and were removed for correlation analysis. Heatmaps were generated with pairwise Pearson correlation coefficients depicted by varying color intensities, and were clustered using hierarchical clustering. Correlation calculations between KAS-seq, Pol II ChIP-seq, GRO-seq, and 4SU-seq were performed using a similar approach but based on gene-coding regions.
Definition of four transcription states
To define transcription states, we calculated the KAS-seq tag density on the promoters (from −200 bp to +400 bp from TSS) and gene bodies (from +400 bp downstream TSS to TES) of protein-coding genes. Gene promoters with KAS-seq tag densities more than 20× as the density on average were considered to be paused. Similarly, gene bodies with KAS-seq tag densities more than 10× as the density on average were considered to be actively transcribed. A list of genes at four different transcription states can be found in supplemented Source Data.
Defining genes with long, medium and short terminal regions
Genes with terminal regions that do not overlap with other genes within a 10 kb range downstream TES were used for analysis. The 10 kb region downstream TES were divided into 20 bins of the same length. We calculated the averaged KAS-seq reads density on each bin, and bins with averaged KAS-seq reads density equal to or greater than 5 were defined as positive bins. We ranked all genes according to their number of positive bins, from highest to lowest. Genes ranked among top 1/3 were defined as long terminal genes; genes ranked among bottom 1/3 were defined as short terminal genes; the rest were defined as medium-length terminal genes.
Calculation of the termination index
We calculated the termination index for KAS-seq, Pol II ChIP-seq, and GRO-seq as the log2 ratio of reads density on terminal regions (from TES to +2 kb from TES) over that around TSS (from −200 bp to +400 bp from TSS). Only genes with KAS-seq tag density on promoters more than 50× as the density on average were included in the calculation.
Identification of predicted non-B form DNA with KAS-seq peaks
The positions of all the non-B form DNA motifs in this study are downloaded from non-B DB v2.022. To obliterate the effect of Pol II-induced KAS-seq signals, we used KAS-seq peaks identified in triplotide-treated HEK293T cells. KAS-seq peaks related to tRNA, rRNA, small NF90-associated RNAs, and U6 spliceosomal RNA, which are transcribed by Pol I and Pol III, were excluded from the analysis.
Enrichment of KAS-seq signals on non-B form DNAs were determined by calculating log2(IP reads density/input reads density) on each KAS-seq positive non-B form DNA region, with the distribution of enrichment for each non-B form DNA type shown in box plots, comparing with the same number of regions randomly found in the genome. To calculate the enrichment of KAS-seq signal on telomeres, we used the KAS-seq signals the 15 kb rightmost and 15 kb leftmost regions of all chromosomes on the hg38 reference genome.
Definition of single-stranded-DNA-containing enhancers and super-enhancers
We used H3K27ac and H3K4me1 peaks distal from genes promoters (based on mm10 and hg19 on NCBI Refseq) to define active and poised enhancers. H3K27ac enriched regions were defined as active enhancers, regions with enriched H3K4me1 but not H3K27ac were defined as poised enhancers. We found that very few poised enhancers are single-stranded, so only active enhancers with KAS-seq peaks were defined as single-strand-DNA-containing enhancers. In addition, some active enhancers are located on the gene body. Thus KAS-seq signals on these enhancers may derive from Pol II elongation. Therefore, KAS-seq under DRB treatment was used to define single-stranded-DNA-containing enhancers. Enhancers with KAS-seq peaks observed in both DRB replicates were defined as single-stranded-DNA-containing enhancers.
Super enhancers were defined using the ROSE package as previously described24.
Motif analysis
Sequence motifs enriched by ssDNA-containing enhancers and ATAC-seq-positive but KAS-seq negative enhancers were analyzed by using HOMER51.
The sequences of ssDNA-containing enhancers were extracted and used as input for TRAP52 using TRANSFAC vertebrates as the comparison library, promoter sequences as the background, and Benjamini-Hochberg as the correction. P-values were displayed in figures corresponding to the ‘corrected p’ in the output.
Assigning enhancers to their regulated genes
We assigned enhancers to their regulated genes based on the NCBI RefSeq gene annotations. We calculated the distance from the center of the enhancer to the TSS of each gene, and the gene closest to the enhancer and with the distance less than 50 kb is assigned as the gene regulated by this enhancer.
Pol II and CTCF ChIA-PET data were used to define the long-range interactions.
Calculate the release index to define protein condensation inhibition affected genes
We calculated Pol II or ssDNA release index as the log2 ratio of Pol II or KAS-seq reads density at a region from +0.5 kb to +2.5 kb downstream TSS at 5 min versus that with no treatment (0 min). As some genes have very short gene bodies, only genes with gene bodies longer than 5 kb were included in the calculation. Genes with Pol II or ssDNA release index higher than 0.5 were defined as genes affected by protein condensation inhibition, which were sorted into high-, medium- and low-affected genes groups, with the number of genes in each group the same. Genes with Pol II or ssDNA release index lower than 0.2 were defined as non-affected genes.
Definition of bidirectional and uni-directional promoters
We defined bidirectional and unidirectional promoters by reanalyzing published NET-seq data in HEK293 cells by following a previous method10. Promoter-proximal regions were carefully defined to ensure minimal signal contamination from genes nearby. Genes shorter than 5 kb were excluded from the analysis. Genes with TSS located within 2.5 kb upstream of the TSS of another gene, or 2.5 kb downstream of the polyA cleavage site of another gene, were excluded from the analysis. In cases of conflicting isoform annotations, the most upstream annotated TSS and the most downstream annotated polyA cleavage sites were used. Within a 4 kb region around TSS, promoters with more than 40 NET-seq signals covering both sense and antisense directions were defined as bidirectional. In contrast, promotors with 40 NET-seq signals covering only sense but not antisense direction were defined as uni-directional.
Reporting Summary
Further information on research design is available in the Nature Research Reporting Summary linked to this article.
Data availability
All sequencing data are available at NCBI Gene Expression Omnibus with the accession number: GSE139420. Other data that support the findings of this study are available from the corresponding author upon request.
Extended Data
Extended Data Fig. 1. Characterization of the N3-kethoxal-based labeling.
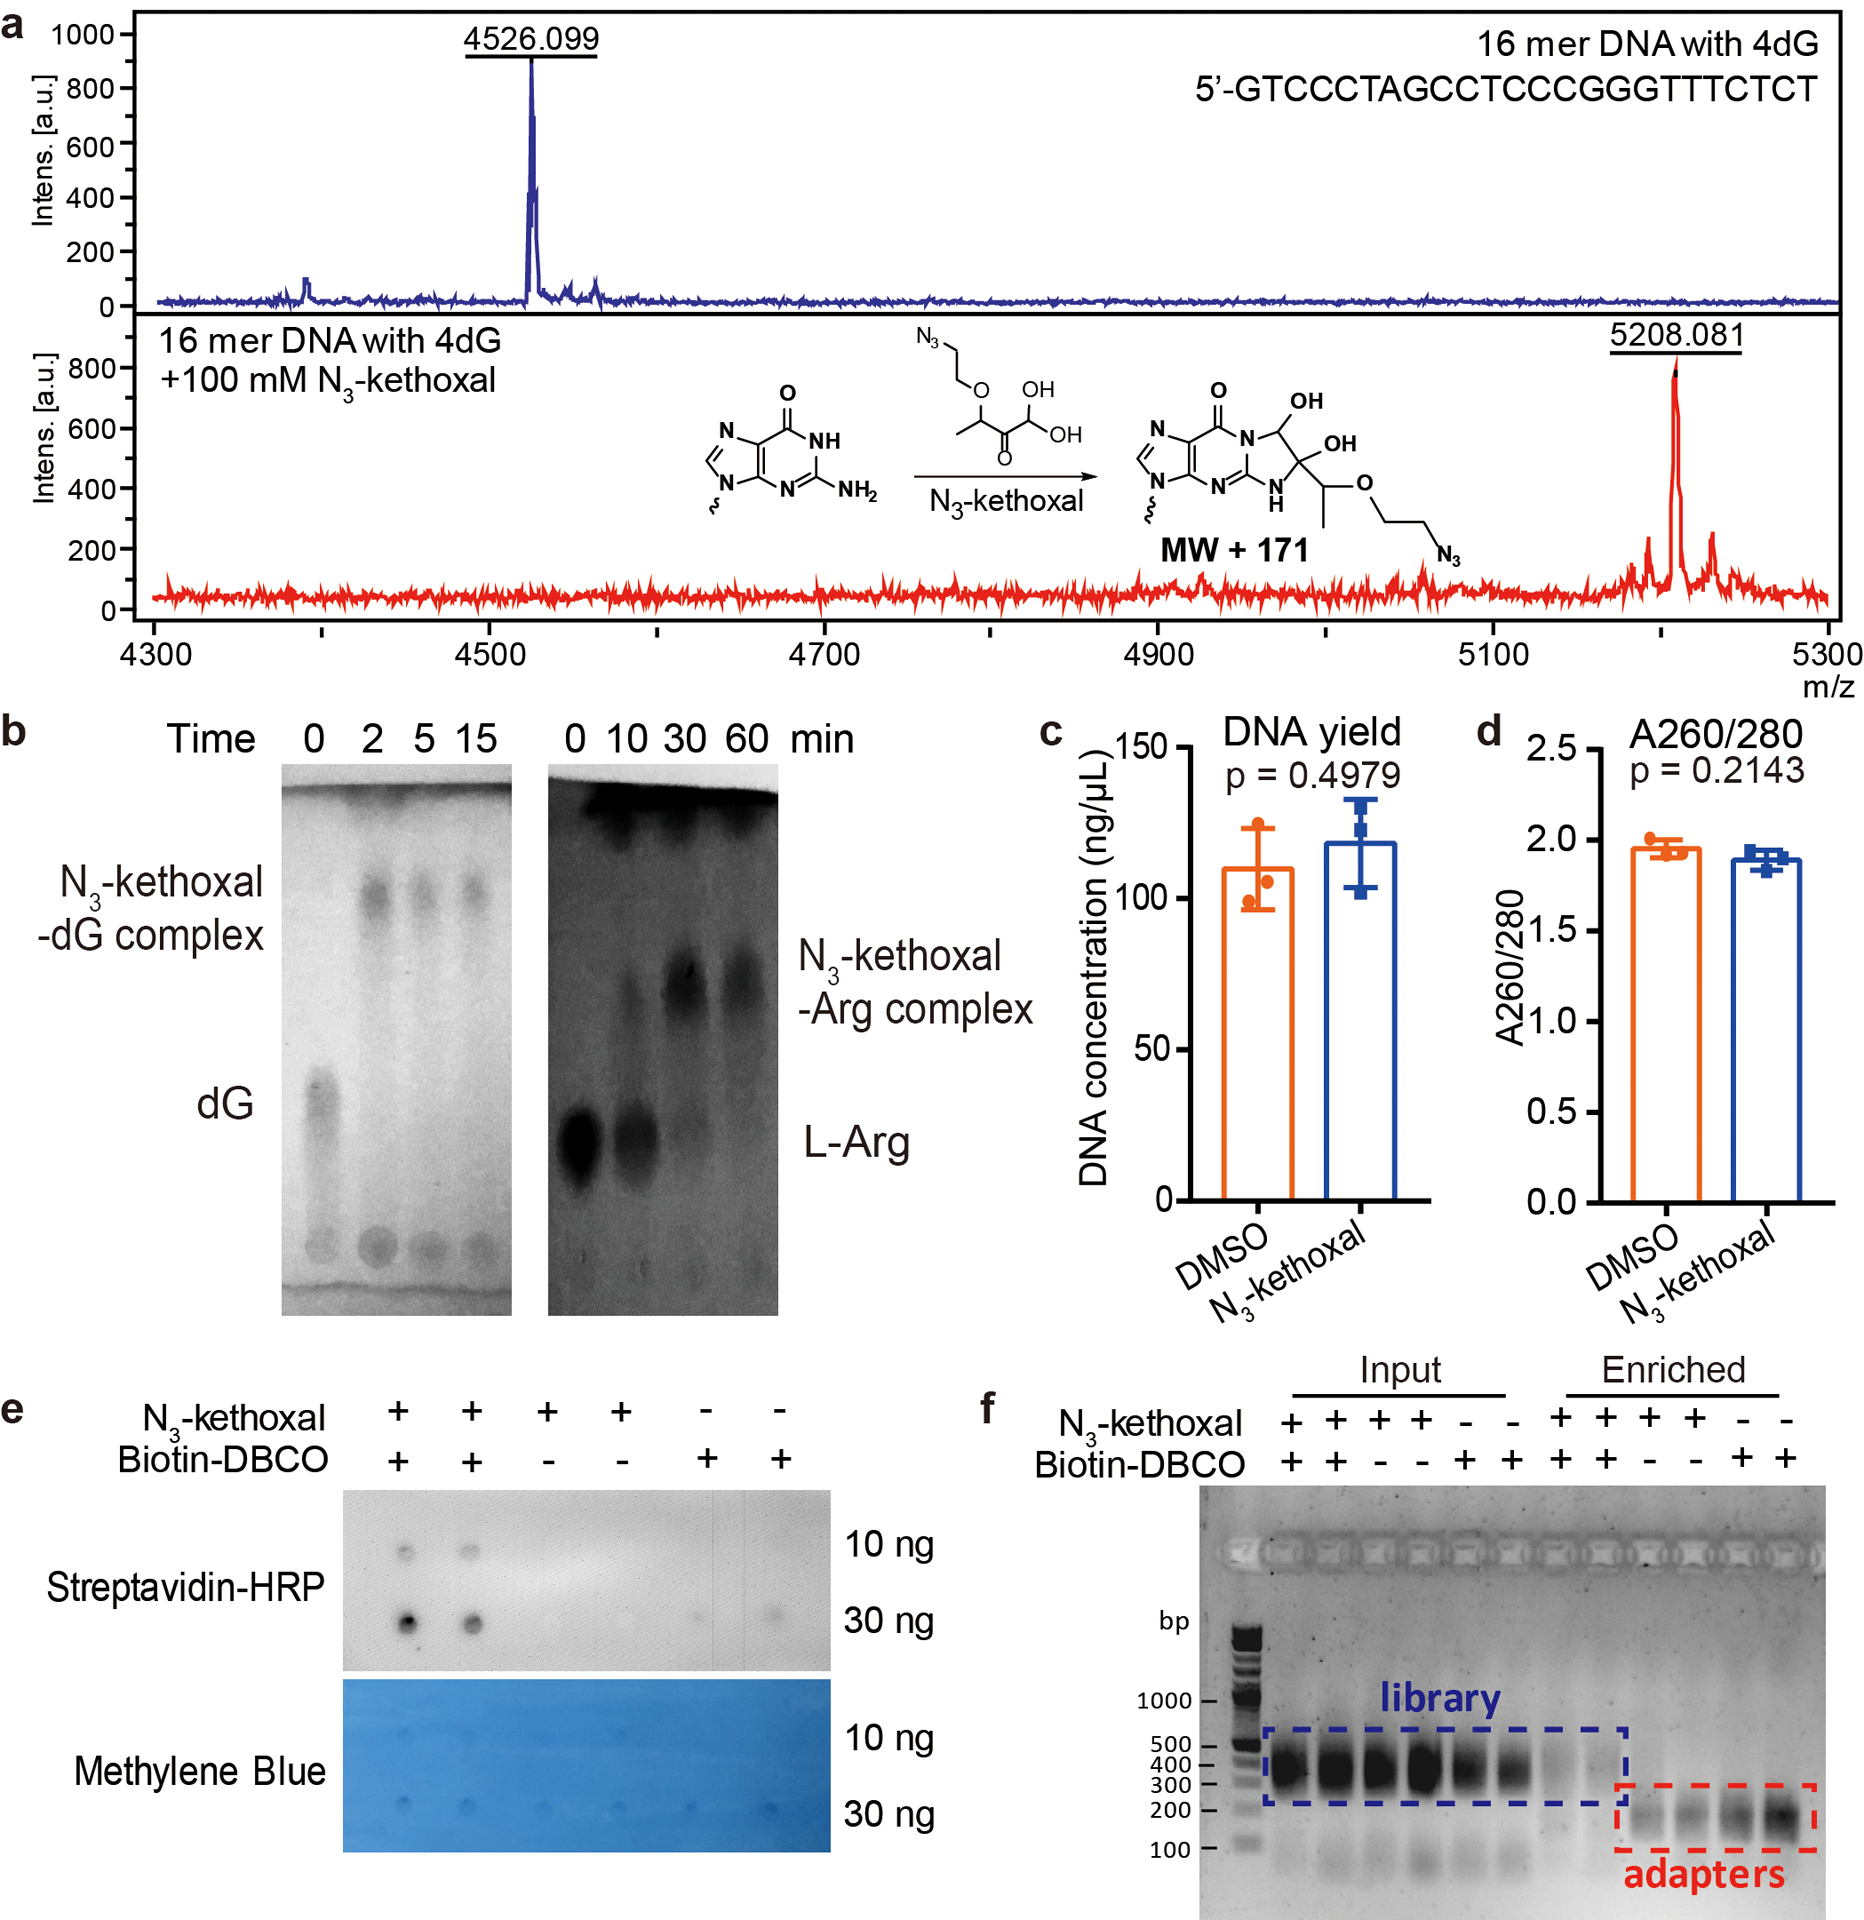
a, MALDI-TOF analysis of the reaction between a 16-mer DNA oligo and N3-kethoxal. The experiment was performed in duplicates with similar results obtained. b, TLC analysis of the reaction between N3-kethoxal and deoxyguanosine (dG, left) or L-arginine (L-Arg, right) after different time intervals. The N3-kethoxal-dG results were visualized by 254 nm UV light. The N3-kethoxal-L-Arg results were visualized by ninhydrin staining. The experiment was performed in duplicates with similar results obtained. c-d, The DNA yield (c) and the A260/280 ratio (d) of gDNA isolated from N3-kethoxal-treated and control cells. P values were calculated by using two-sided unpaired Student’s t-test (n = 3 independent experiments). e, Dot blot showing biotin signals of the DNA after the biotinylation reaction in the presence or absence of N3-kethoxal or biotin-DBCO. Results from two replicates were shown for each condition. The experiment was performed in duplicates with similar results obtained. f, Agarose gel image showing the profile of libraries constructed by using input and enriched DNA samples made in the presence or absence of N3-kethoxal or biotin-DBCO. Results from two replicates were shown for each condition. The experiment was performed in duplicates with similar results obtained.
Extended Data Fig. 2. KAS-seq validation and an overview of the KAS-seq profile.
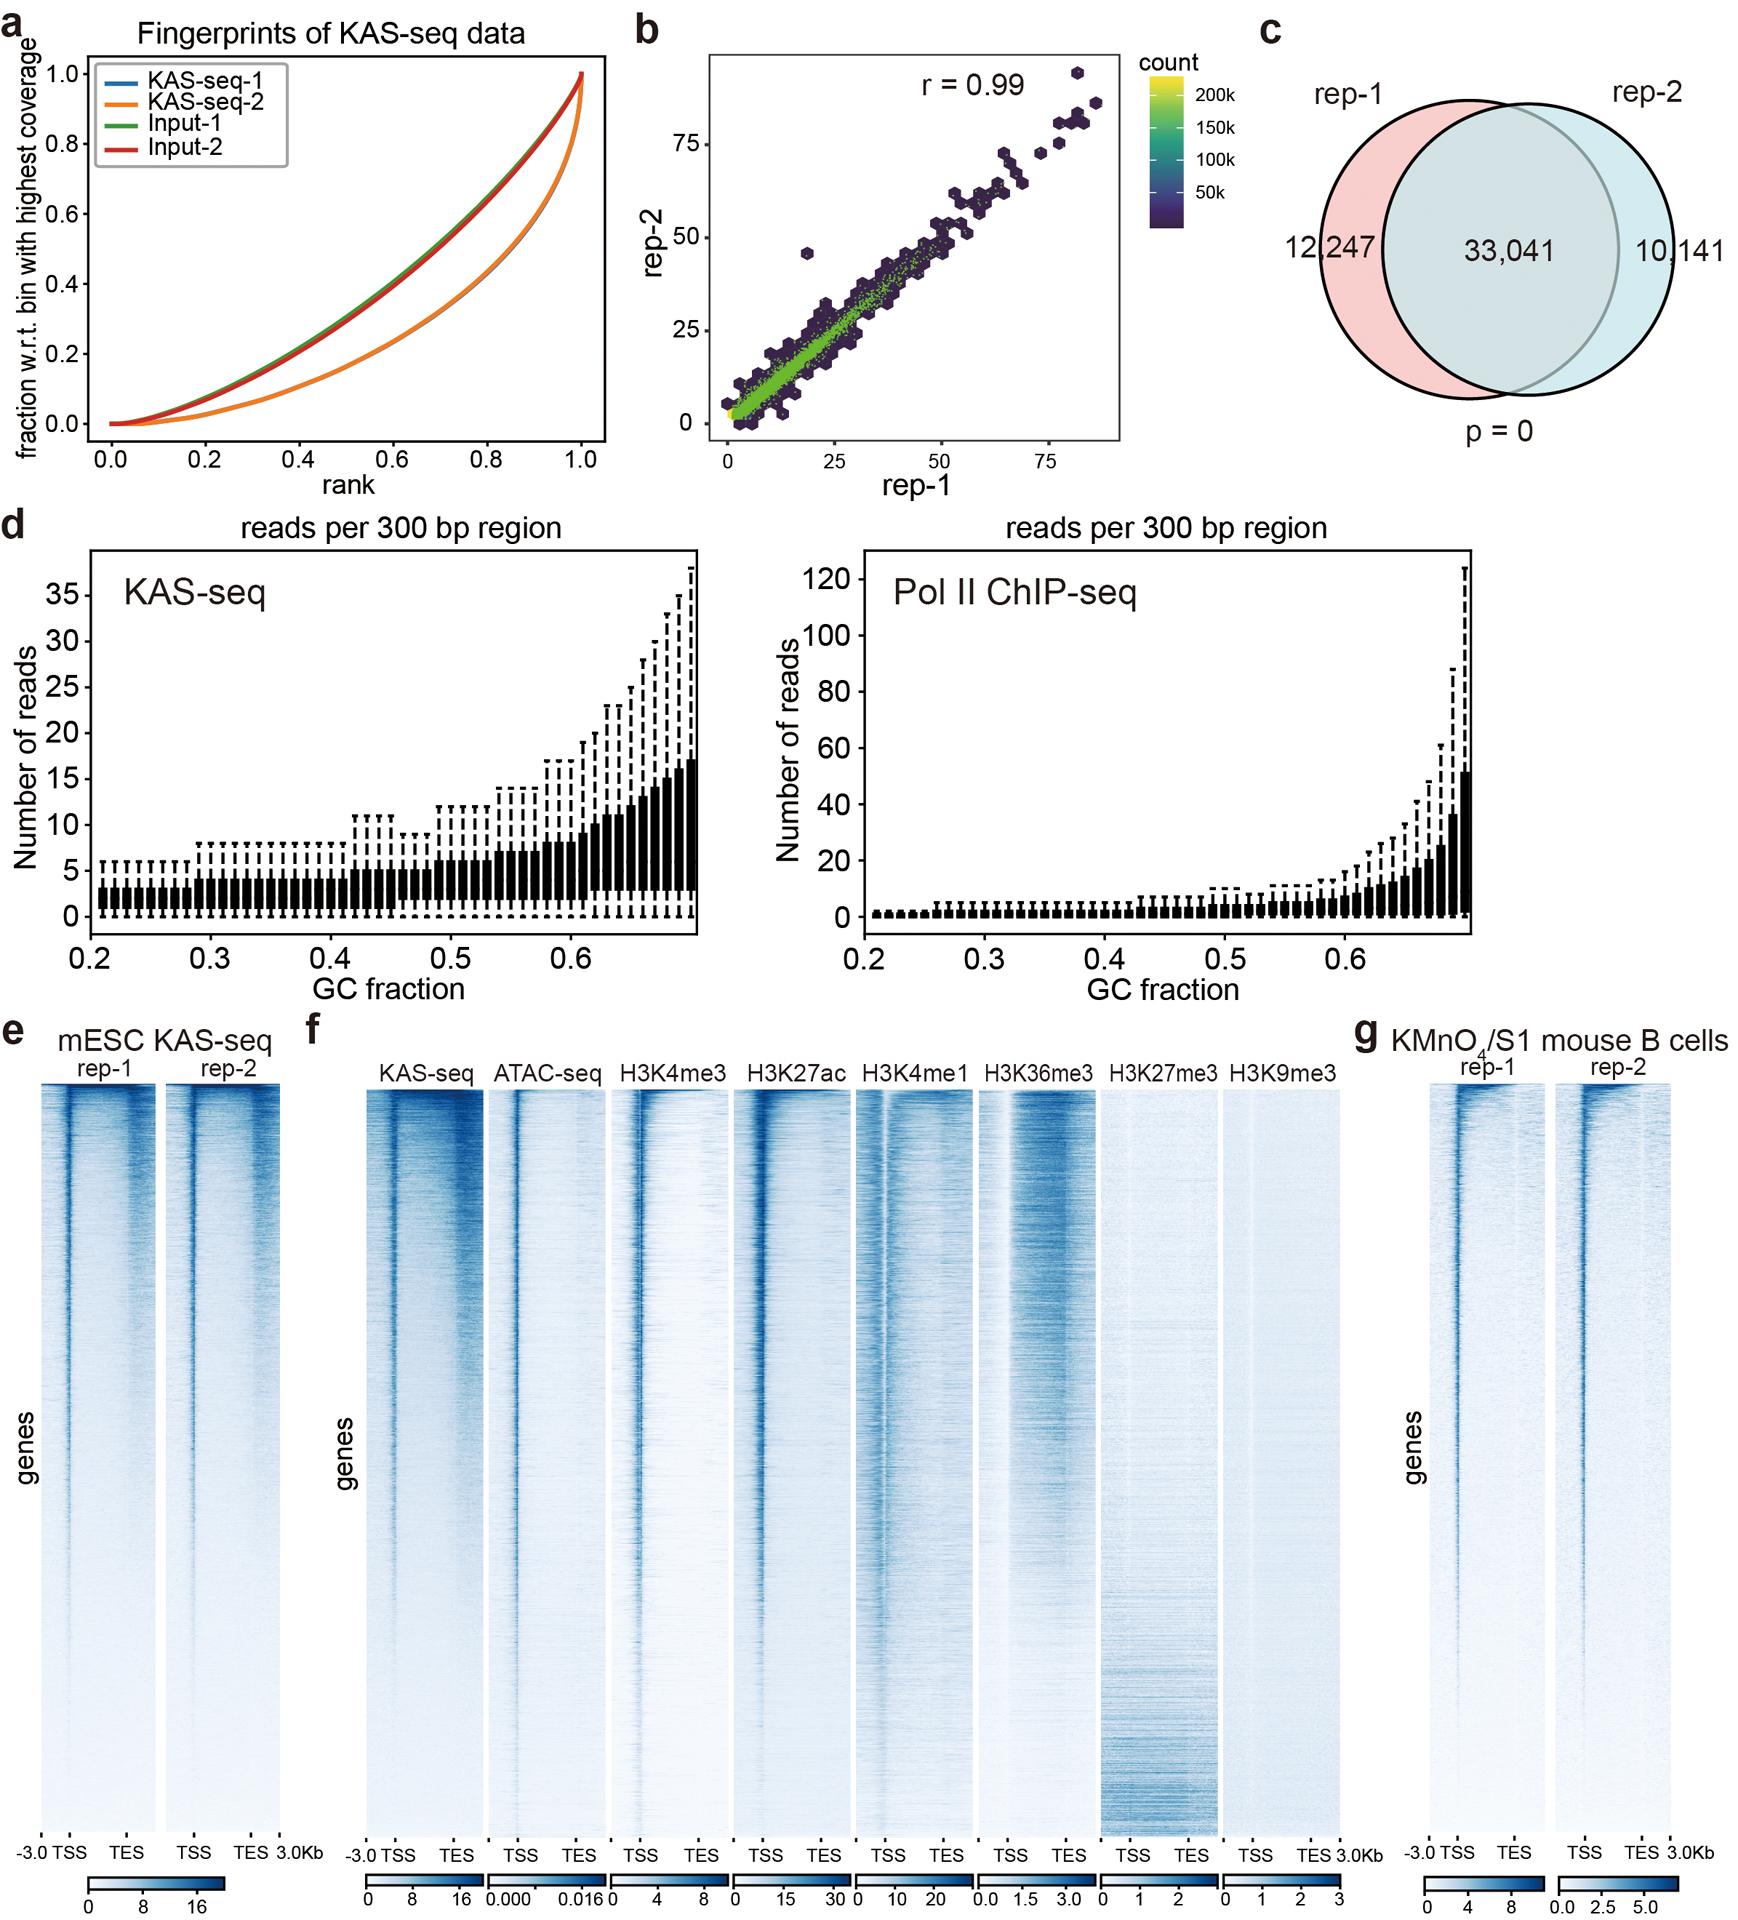
a, Fingerprint plot of KAS-seq libraries and the corresponding inputs in HEK293T cells. b, Pearson correlation scatterplot between two independent KAS-seq replicates (r = 0.99) in HEK293T cells (n = 287,970 10 Kb bins in the hg19 genome). c, Peak overlaps between two independent KAS-seq replicates in HEK293T cells. The p value was calculated using two-sided Fisher’s exact test. d, Reads distributions of KAS-seq (left) and Pol II ChIP-seq (right) signals respect to different GC fractions. e, Heatmap showing reads distribution of two independent KAS-seq replicates at gene-coding regions in mESCs. f, The distribution of KAS-seq signals, ATAC-seq signals, and selected histone modifications at gene-coding regions in HEK293T cells. g, Heatmap showing the reads distribution of two KMnO4/S1 footprinting replicates (activated mouse B cells) at gene-coding regions.
Extended Data Fig. 3. KAS-seq using low input cells and mouse liver.
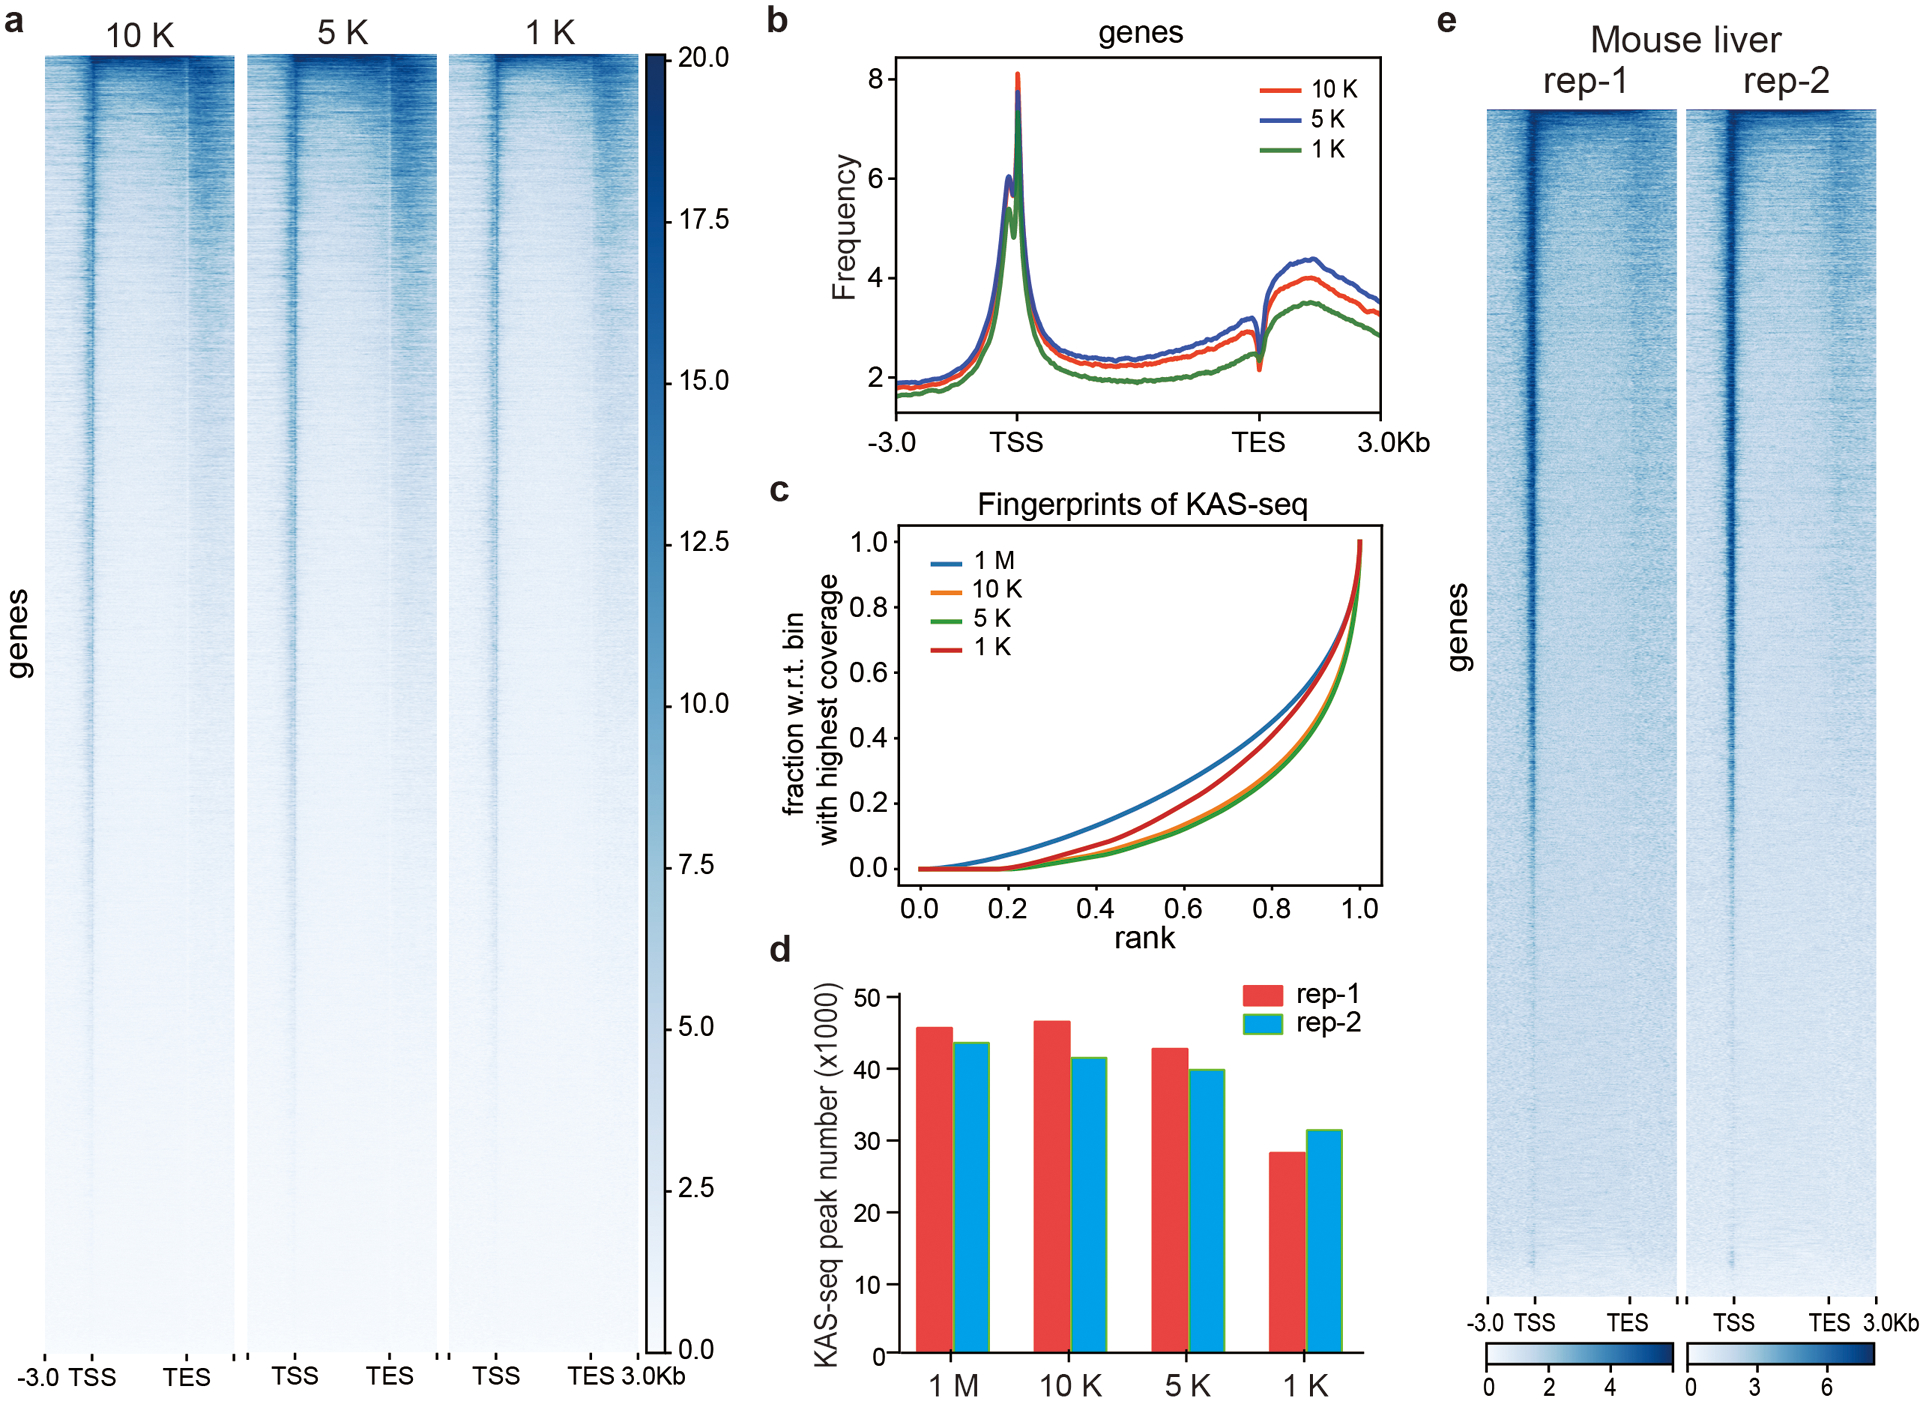
KAS-seq signal distribution at gene-coding regions revealed by using different numbers of HEK293T cells (n = 26,910 genes). b, Profiles of KAS-seq data at gene-coding regions using different numbers of HEK293T cells. c, Fingerprint plot of low-input KAS-seq libraries. d. Numbers of KAS-seq peaks detected by using different amounts of HEK293T cells. e, Heatmap showing reads distribution of two independent KAS-seq replicates at gene-coding regions generated by using livers from two mice. 1 M: 1 million; 10 K: 10 thousand; 5 K: 5 thousand; 1 K: 1 thousand.
Extended Data Fig. 4. Correlation between KAS-seq signals, gene expression levels, Pol II dynamics, and gene transcription states.
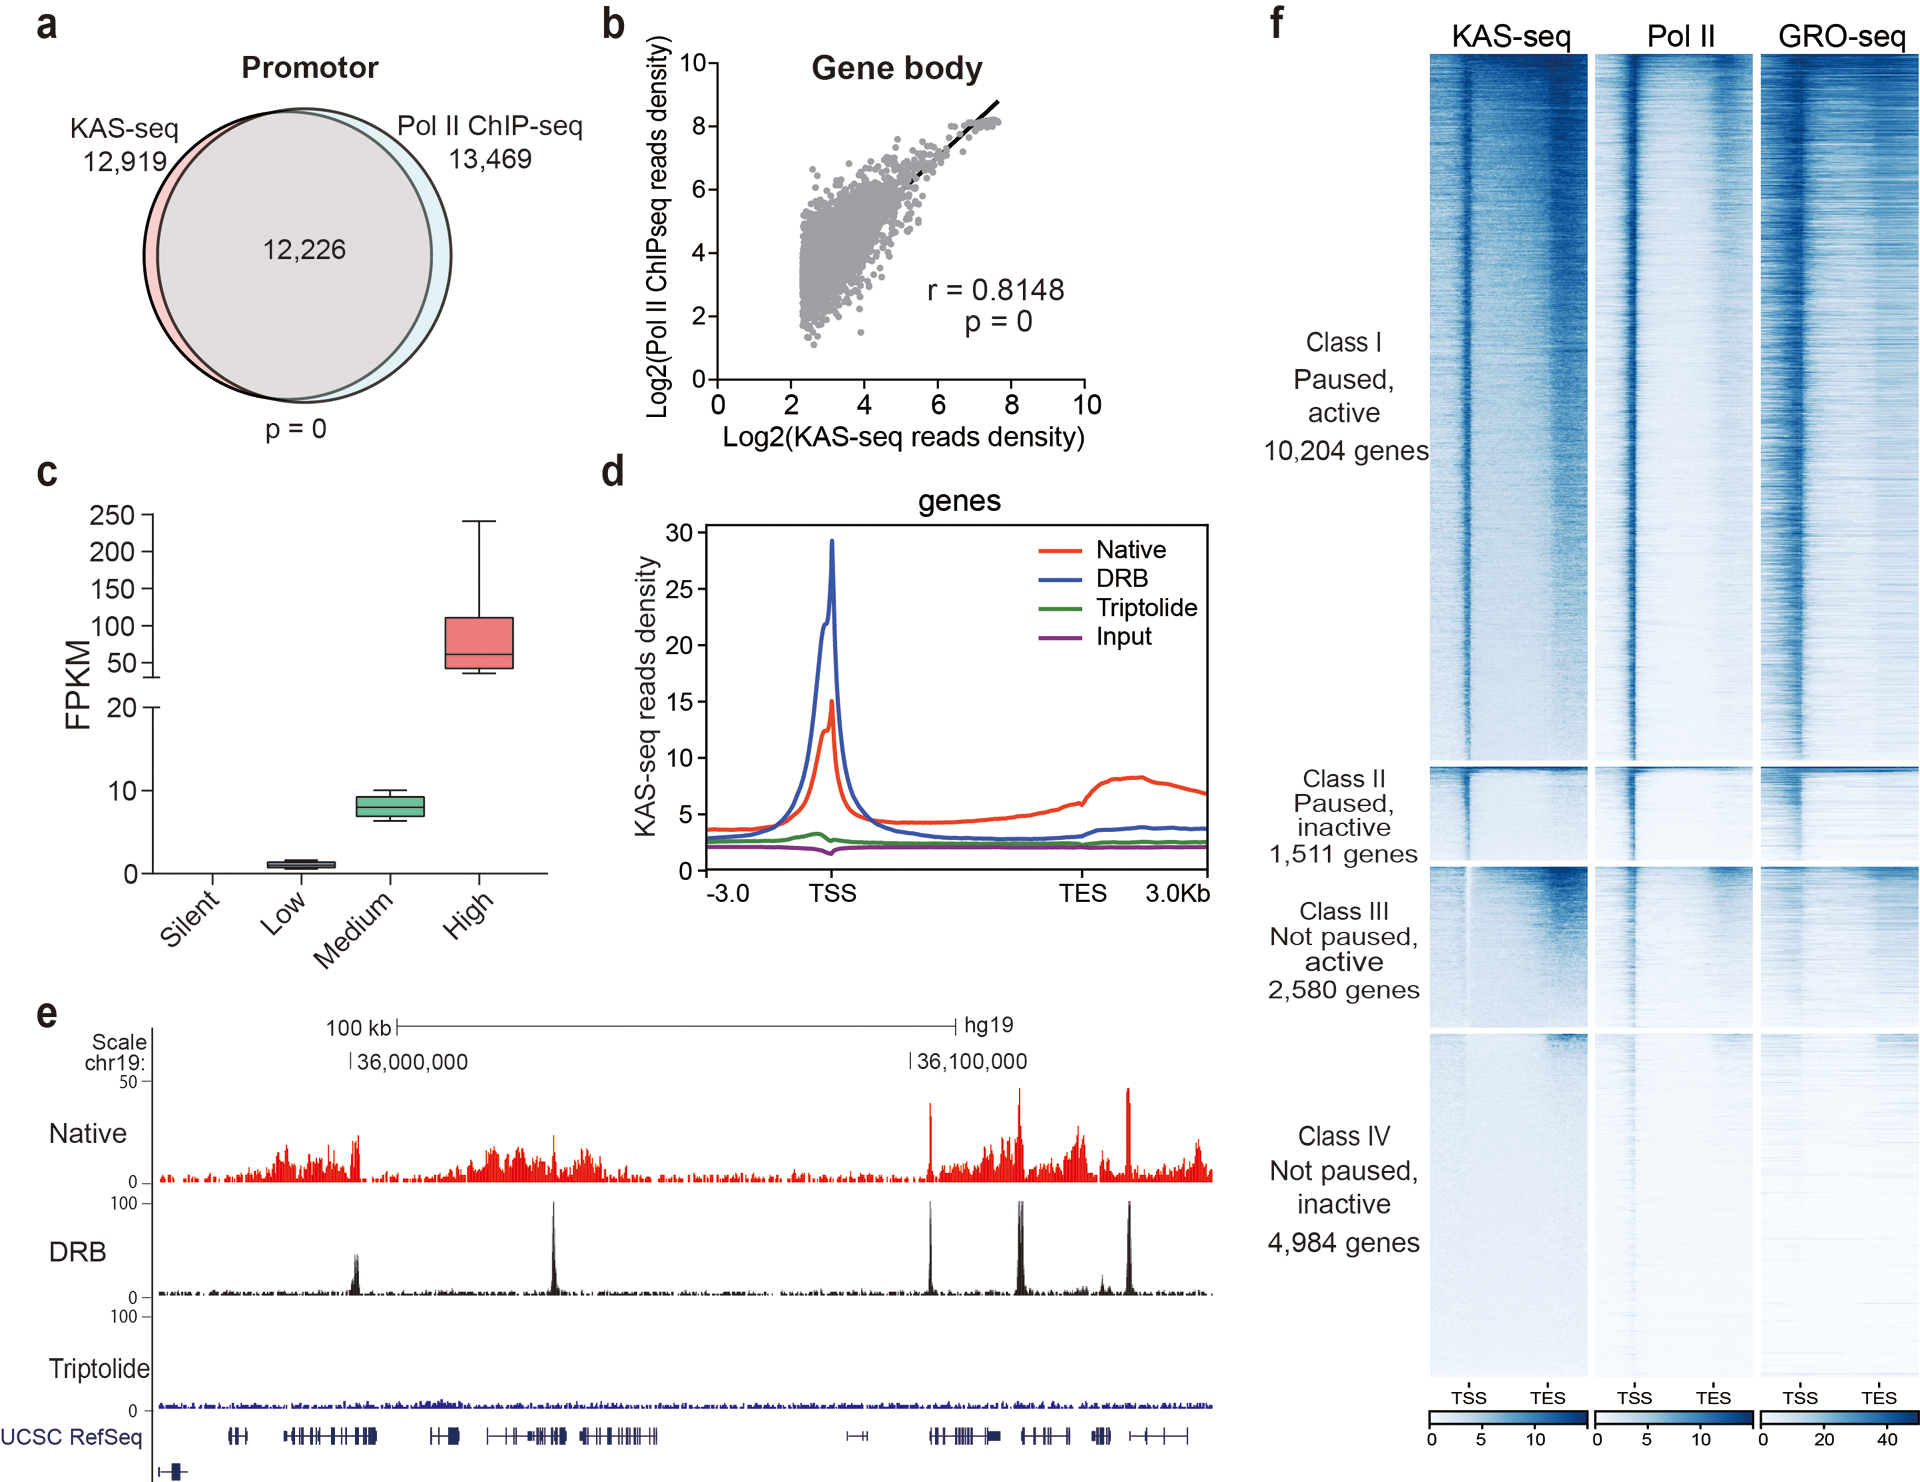
a, Venn diagram showing the overlap between KAS-seq peaks and Pol II ChIP-seq peaks at promotor in mESCs. The p value was calculated using two-sided Fisher’s exact test. b, Pearson correlation scatterplot (n = 24,359 genes) between KAS-seq and Pol II ChIP-seq at gene bodies in mESCs. The r value was calculated as two-tailed probability. c, Genes were grouped according to different expression levels based on RNA-seq. 10–90 percentile of data points are shown, with the center line showing the median, and the box limits showing the upper and lower quartiles. d, Metagene profile of KAS-seq signals at gene-coding regions under control, DRB treatment, and triptolide treatment conditions. e, a snapshot of KAS-seq profiles from UCSC Genome Browser under control, DRB treatment, and triptolide treatment conditions. f, Heatmaps showing KAS-seq, Pol II ChIP-seq, and GRO-seq signals on genes with four different transcription states defined by using KAS-seq.
Extended Data Fig. 5. KAS-seq shows no significant length-dependent bias and yields strong signals around TES regions.
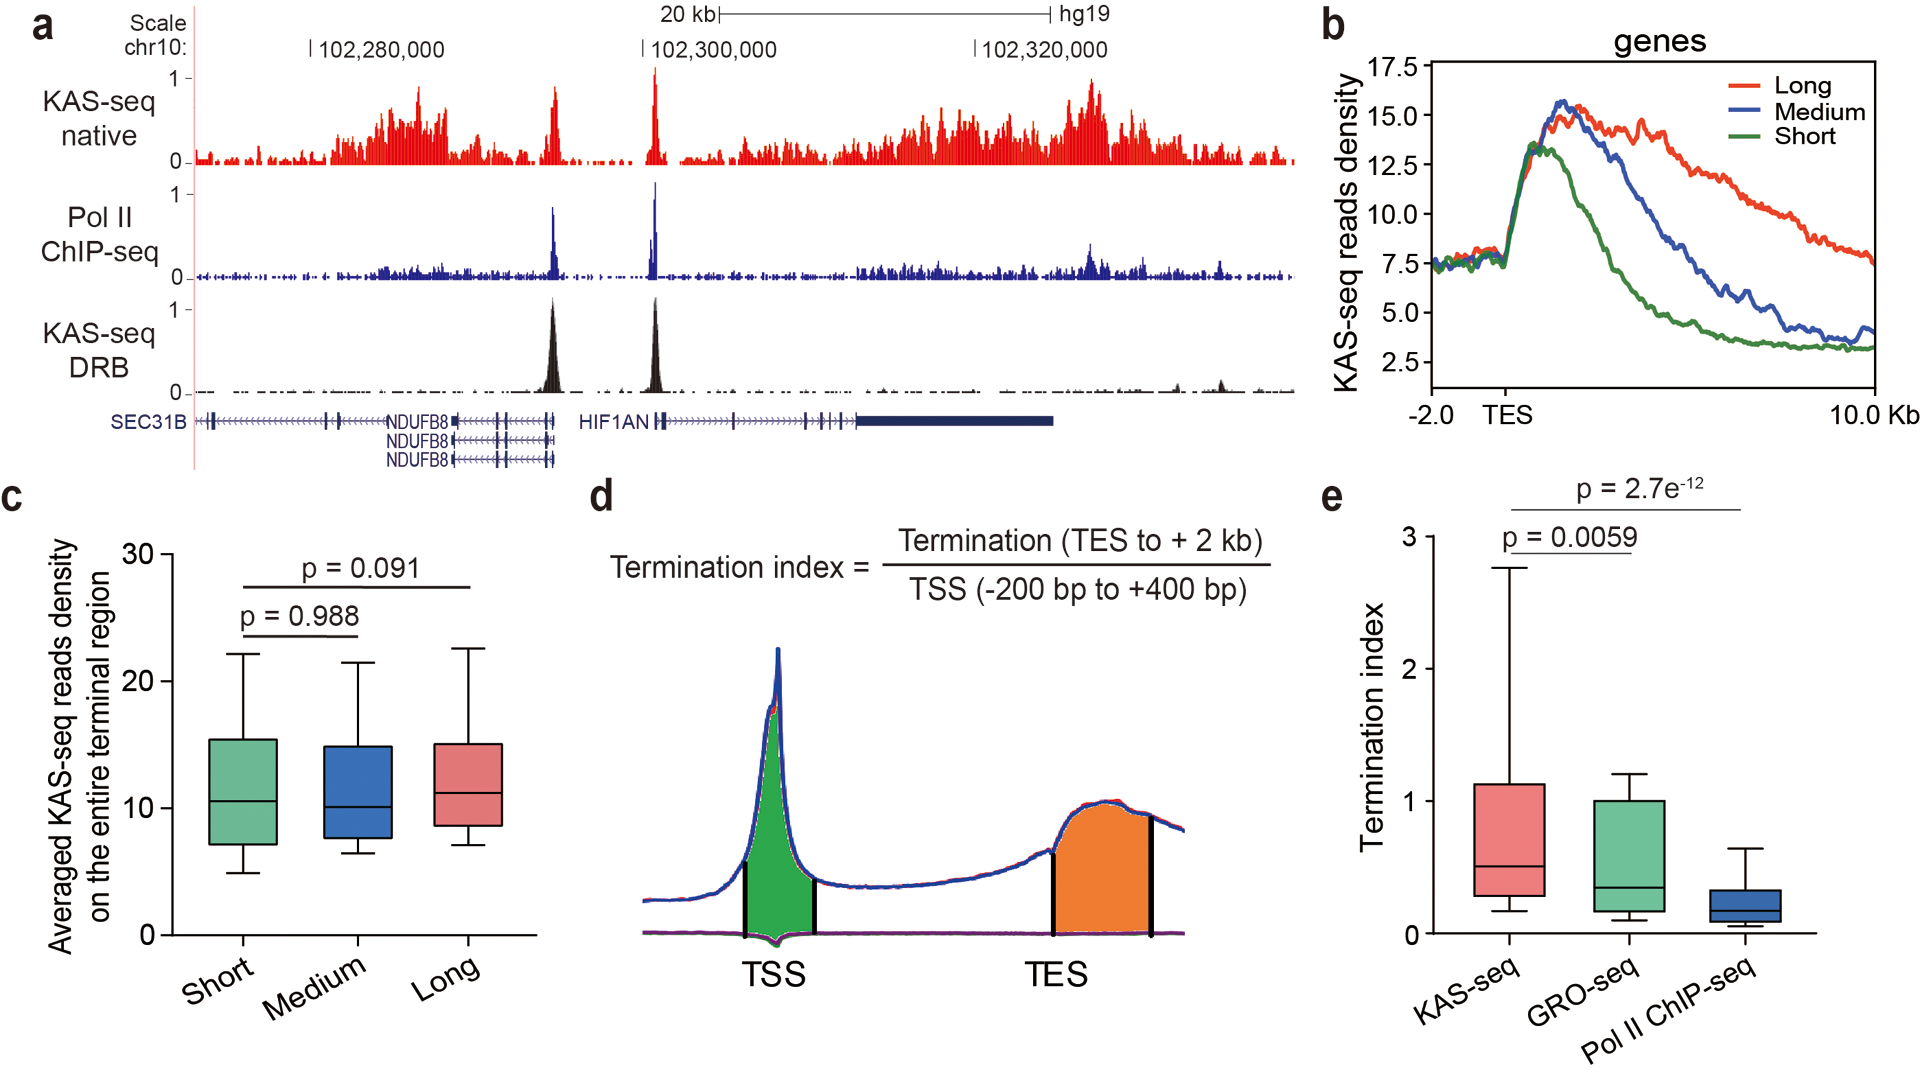
a, A snapshot from UCSC Genome Browser showing KAS-seq and Pol II ChIP-seq profiles at the native state, and KAS-seq profile at the DRB-treated state, indicating that KAS-seq signals around TES are derived from Pol II. Autoscale setting is used for all tracks. b, KAS-seq reads densities of three groups of genes with different lengths of termination signals. c, Averaged KAS-seq reads density in the entire terminal regions in the three groups of genes defined in (b). n = 660 genes for all three groups. d, Termination index for each gene was calculated as the ratio of KAS-seq reads density on TES to its downstream 2 kb region, versus reads density on the – 200 bp to +400 bp region around TSS. e, The distribution of termination index for all genes in KAS-seq, GRO-seq, and Pol II ChIP-seq (n = 29,160 genes). For c and e, 10 – 90 percentile of data points are shown, with the center line showing the median, and the box limits showing the upper and lower quartiles. P values were calculated using two-sided unpaired Student’s t-test.
Extended Data Fig. 6. KAS-seq detects Pol I and Pol III-mediated transcription events, as well as other non-B form DNA structures and telomeric DNA regions.
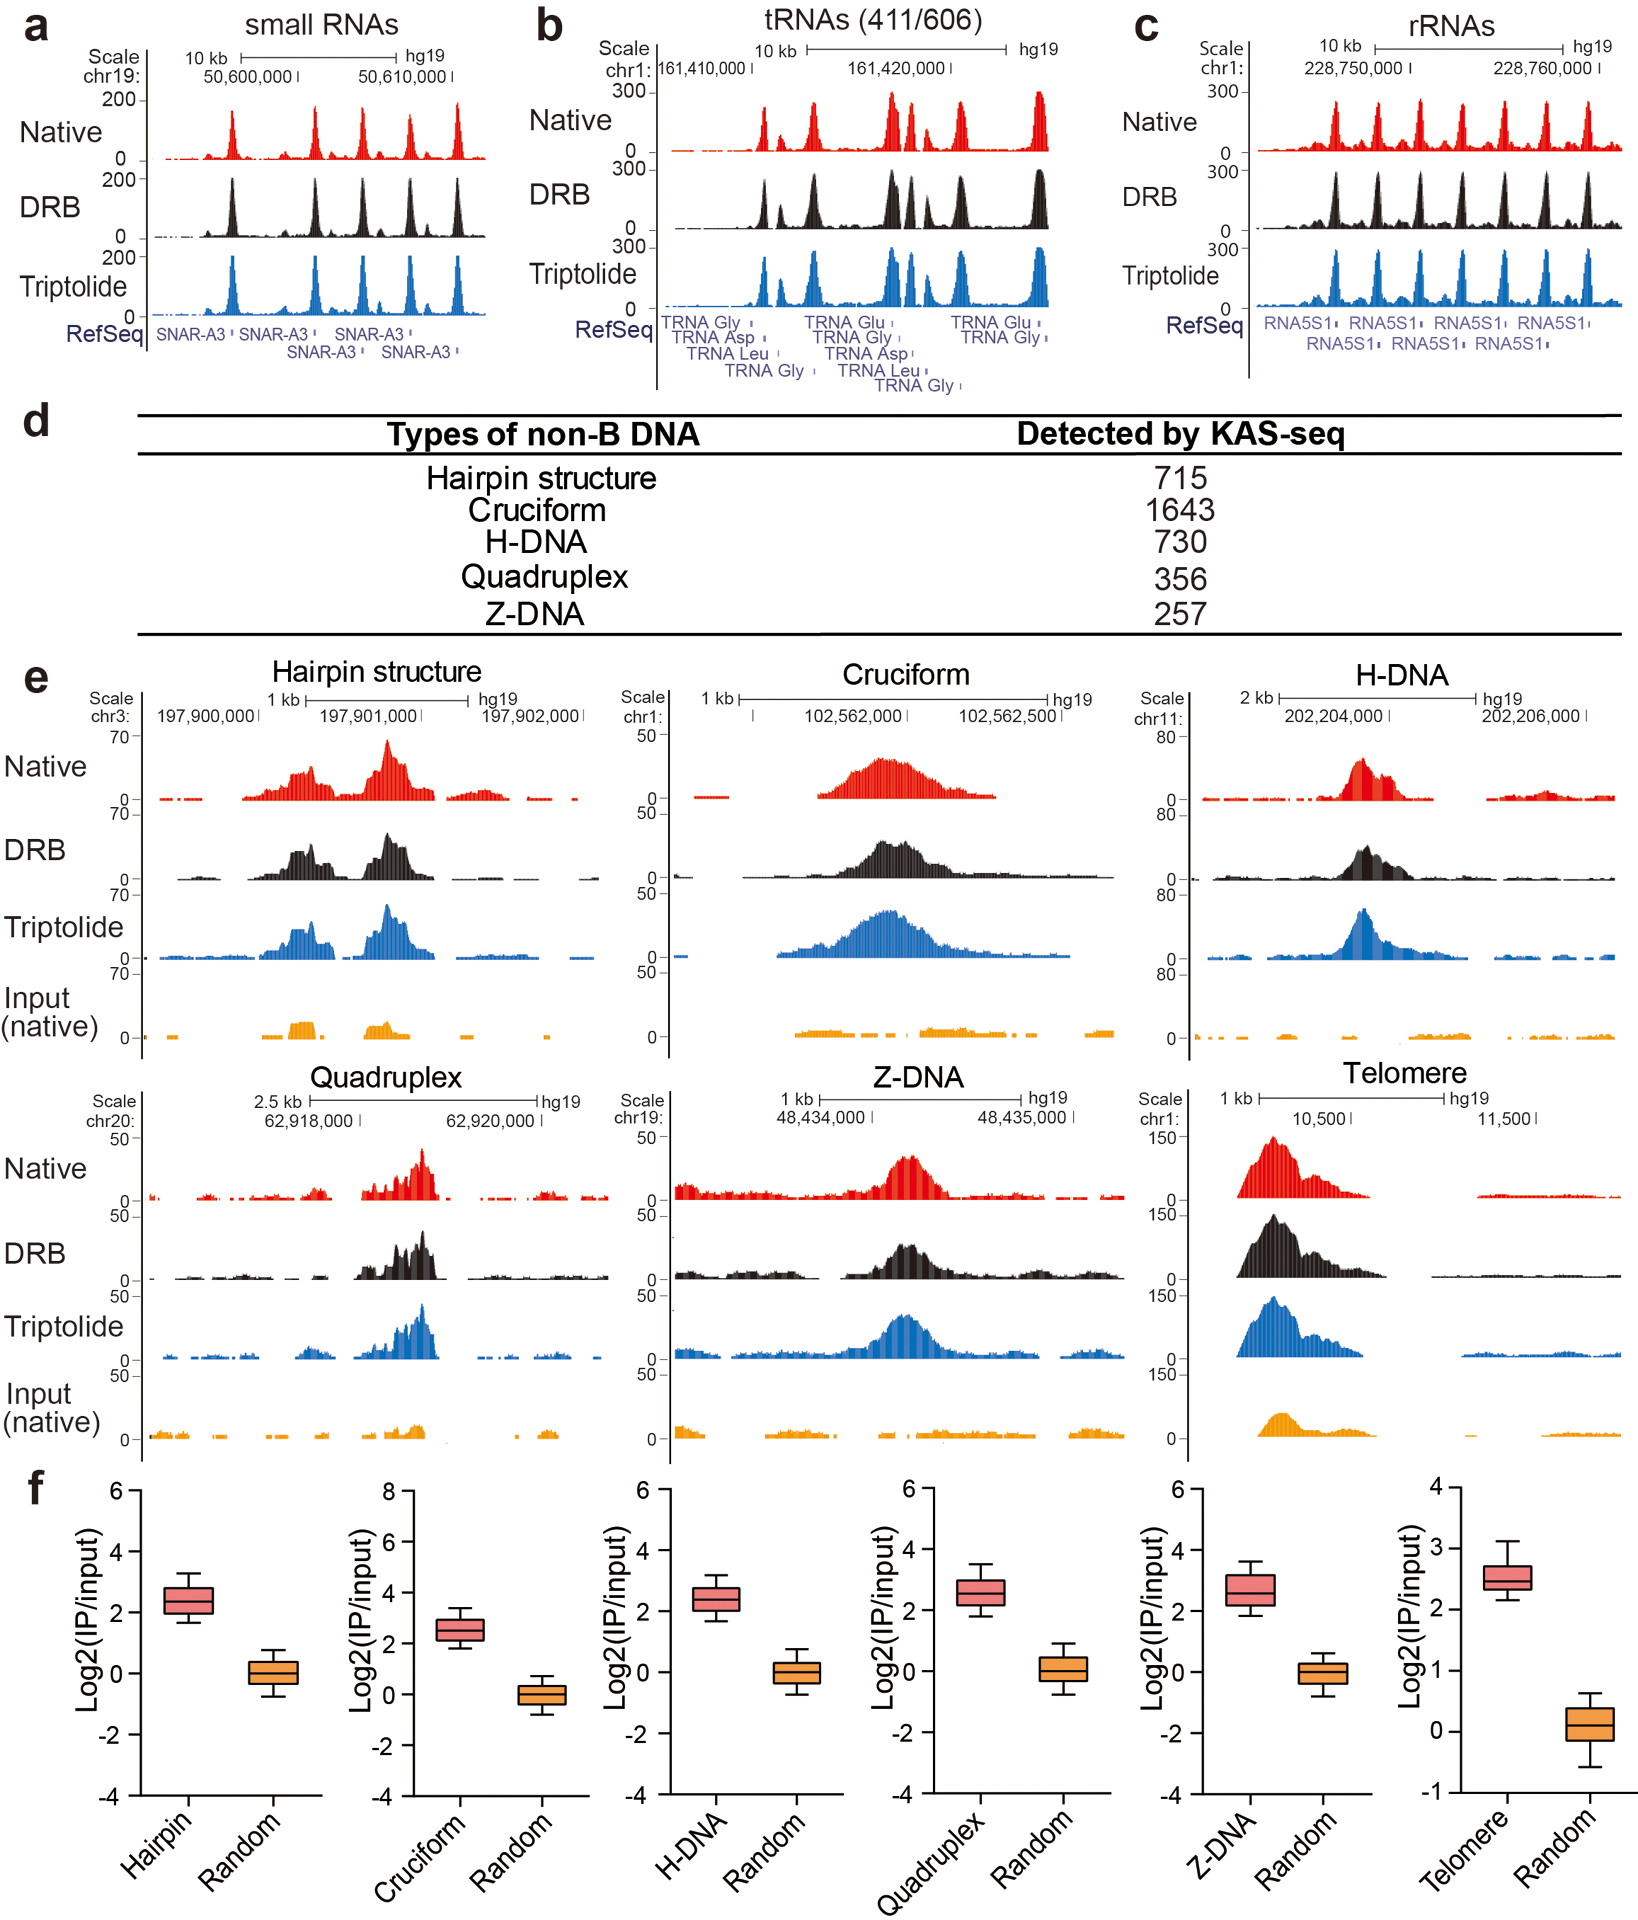
a–c, Snapshots of KAS-seq signals at selected small RNA, tRNA, and rRNA loci in HEK293T cells under native, DRB treatment, and triptolide treatment conditions. d, A summary of different types of non-B form DNA structures and the number of KAS-seq peaks (under triptolide-treatment condition) detected at each type of predicted non-B form DNA regions. e, Snapshots from UCSC genome browser showing examples of KAS-seq signals under native, DRB, and triptolide-treatment conditions at different non-B form DNA regions and telomeric DNA regions. f, Enrichment of KAS-seq signals at different non-B form DNA and telomeric DNA regions showed in (d). n = 715 regions for hairpin, n = 1,643 regions for cruciform, n = 730 regions for H-DNA, n = 356 regions for quadruplex, n = 256 regions for Z-DNA, n = 29 regions for telomere.
Extended Data Fig. 7. Features of ssDNA-containing enhancers in mESCs.
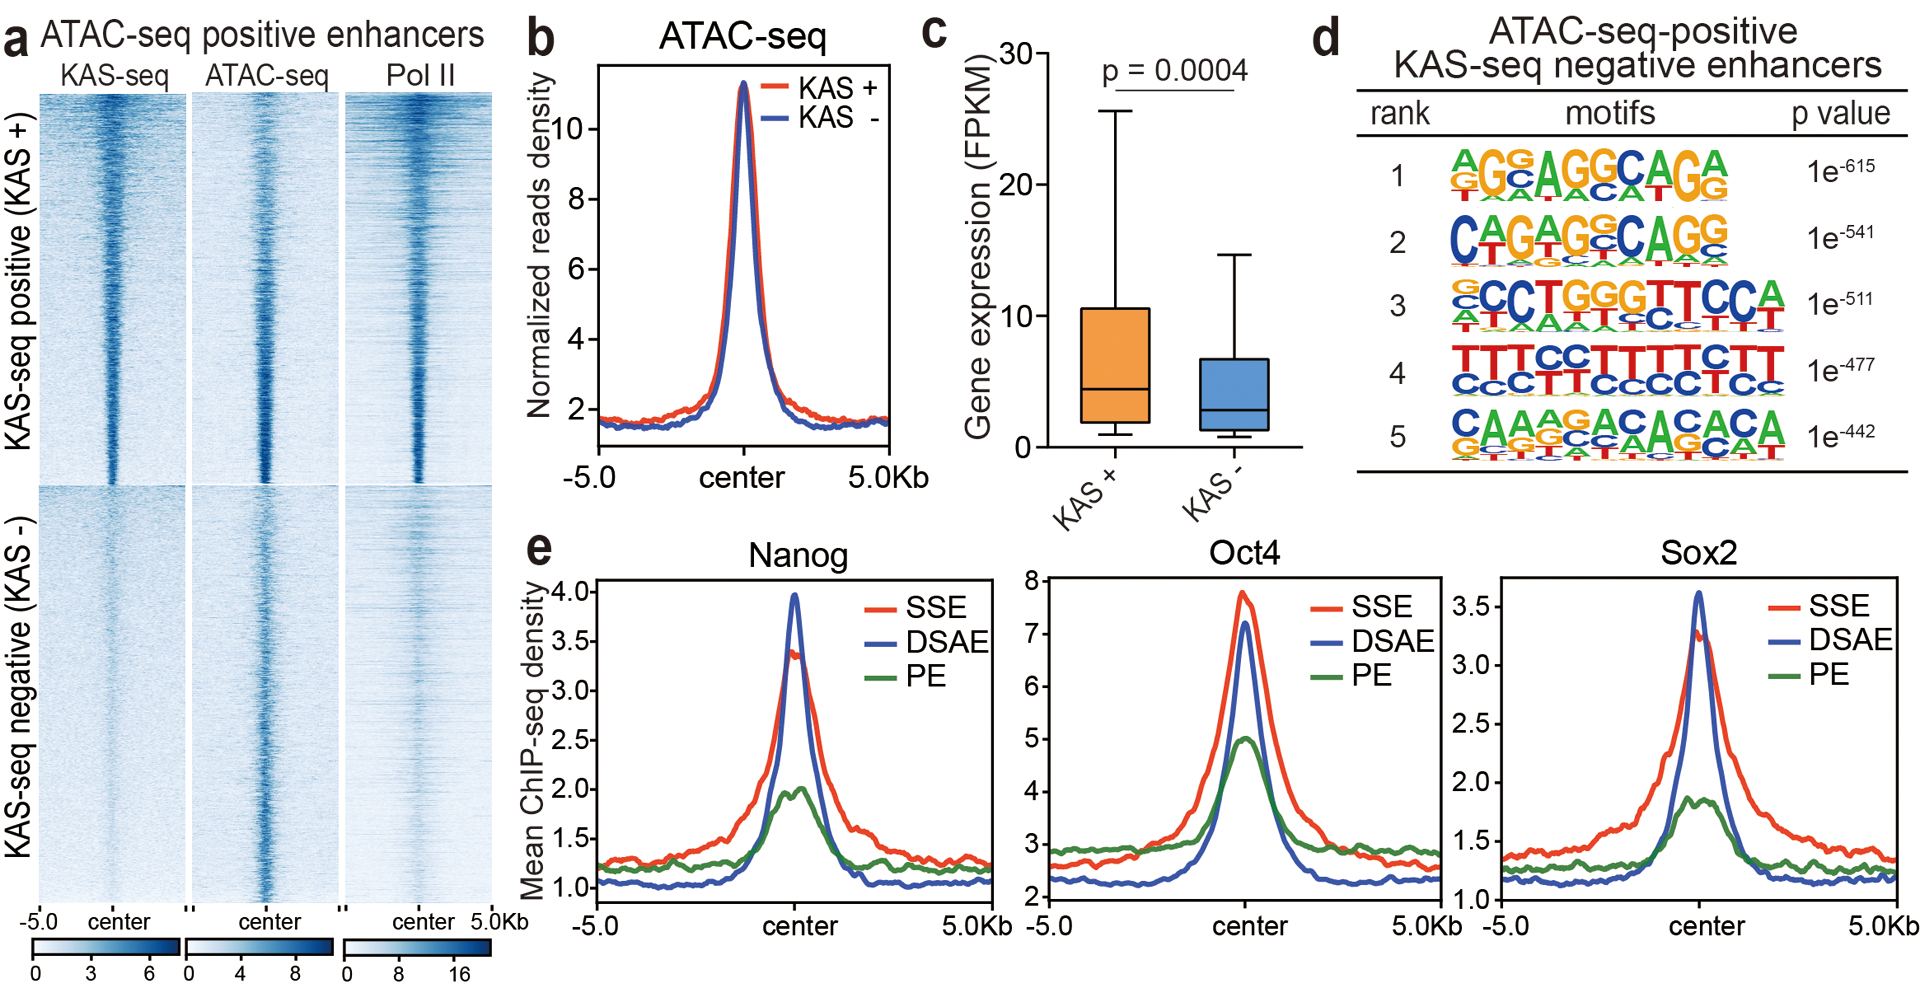
a, All ATAC-seq-positive enhancers were sorted into two groups based on whether they are KAS-seq-positive or not. Heatmaps of KAS-seq, ATAC-seq, and Pol II ChIP-seq signals on these two groups are shown. b, A metagene profile showing ATAC-seq reads density on the two groups of enhancers defined in (a). c, Expression levels of genes associated with KAS-seq positive (n = 3,080 genes) and KAS-seq negative (n = 1,544 genes) enhancers defined in (a). 10 – 90 percentile of data points are shown, with the centerline showing the median, and the box limits showing the upper and lower quartiles. The p value was calculated using two-sided unpaired Student’s t-test. d, Sequence motifs enriched in ATAC-seq-positive but KAS-seq-negative enhancers from mESCs (n = 6,082 enhancers). The p values were calculated by two-sided binomial test. e, Metagene profiles of Nanog, Oct4 and Sox2 ChIP-seq read densities at denoted enhancers in mESCs. Regions within 10 kb around the enhancer centers are shown.
Extended Data Fig. 8. ssDNA-containing enhancers in HEK293T cells.
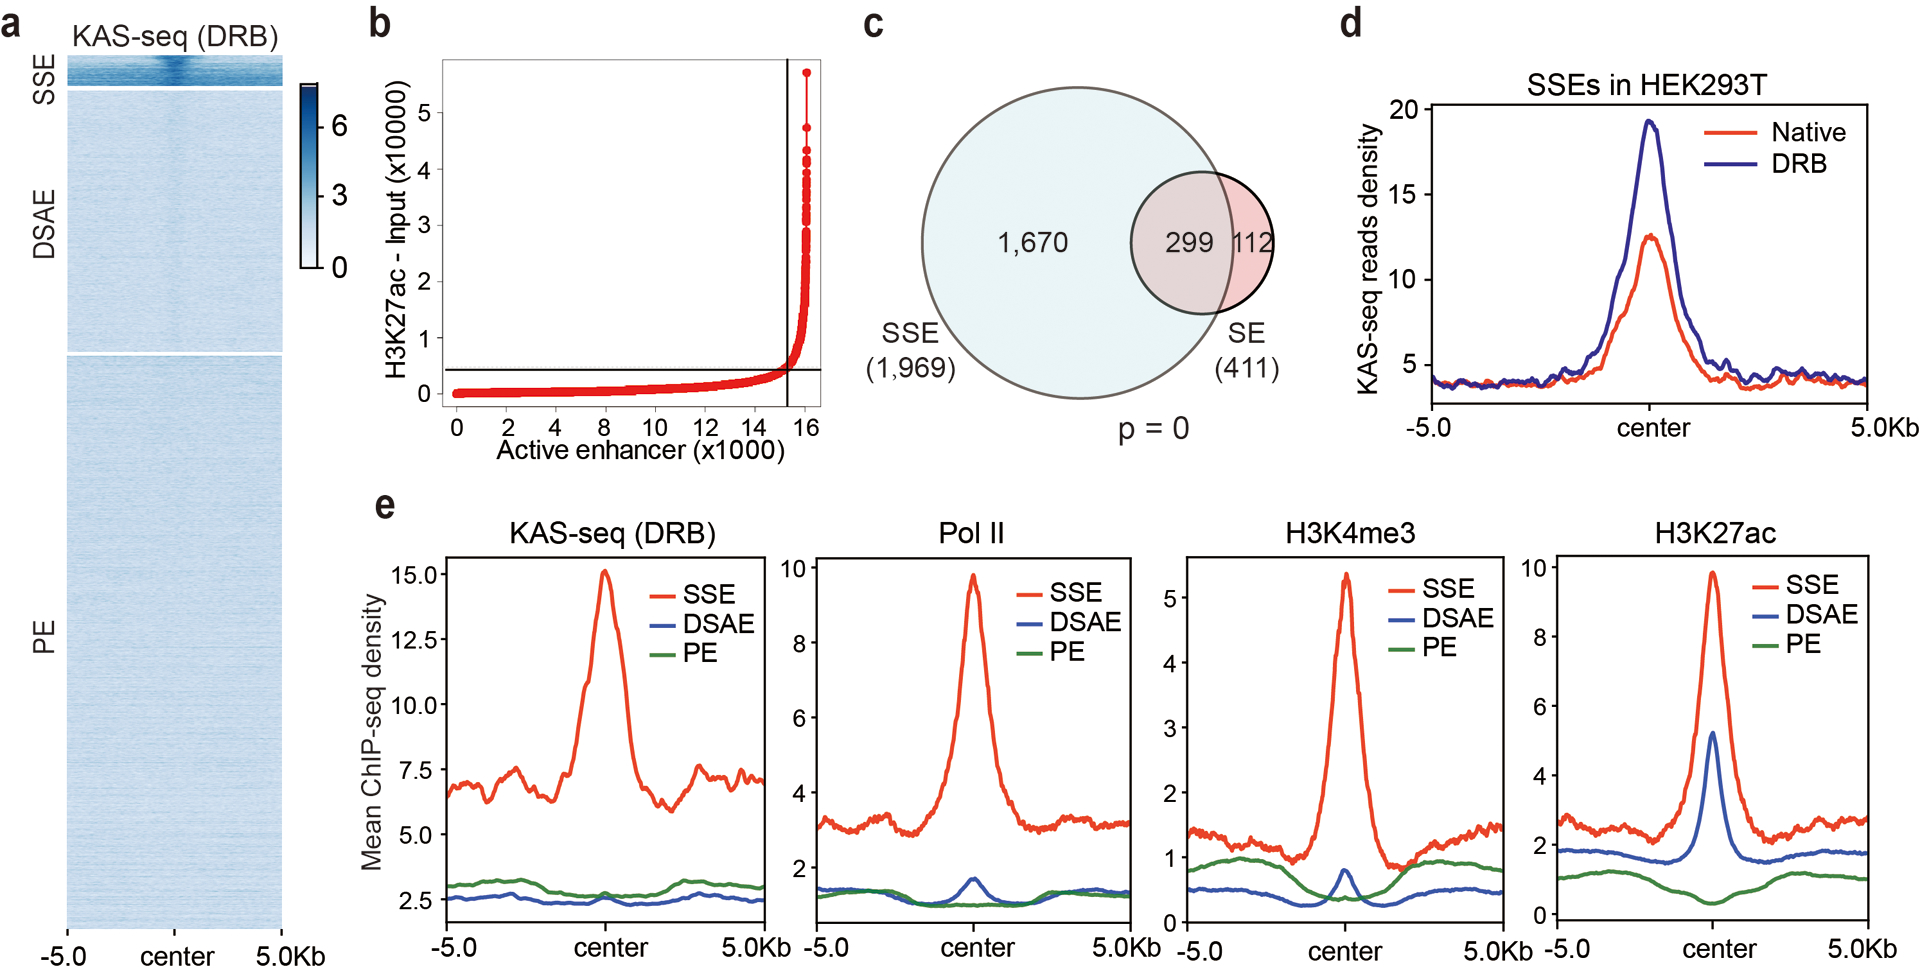
a, A group of enhancers are single-stranded in HEK293T cells. Heatmap of KAS-seq reads densities at all enhancer regions in HEK293T cells. Active and poised enhancer regions are defined by distal H3K27ac and H3K4me1 signals. Active enhancers are sub-grouped into SSEs and DSAEs. b, Distribution of H3K27ac ChIP-seq signal across all HEK293T enhancers. Super-enhancers are defined as containing exceptionally high amounts of H3K27ac. c, The number of ssDNA-containing enhancers and super-enhancers in HEK293T cells and the overlap. The p value was calculated by two-sided Fisher’s exact test. d, KAS-seq reads densities on SSEs in HEK293T cells under native and DRB-treatment conditions. e, Metagene profiles of KAS-seq, Pol II, H3K4me3, and H3K27ac ChIP-seq reads densities at denoted enhancers in HEK293T cells. Regions within 10 kb around the enhancer centers are shown. SSE: ssDNA-containing enhancers; DSAE: double-stranded active enhancers; PE: poised enhancers.
Extended Data Fig. 9. Transcription factors that preferentially bind at ssDNA-containing enhancers in HEK293T cells.
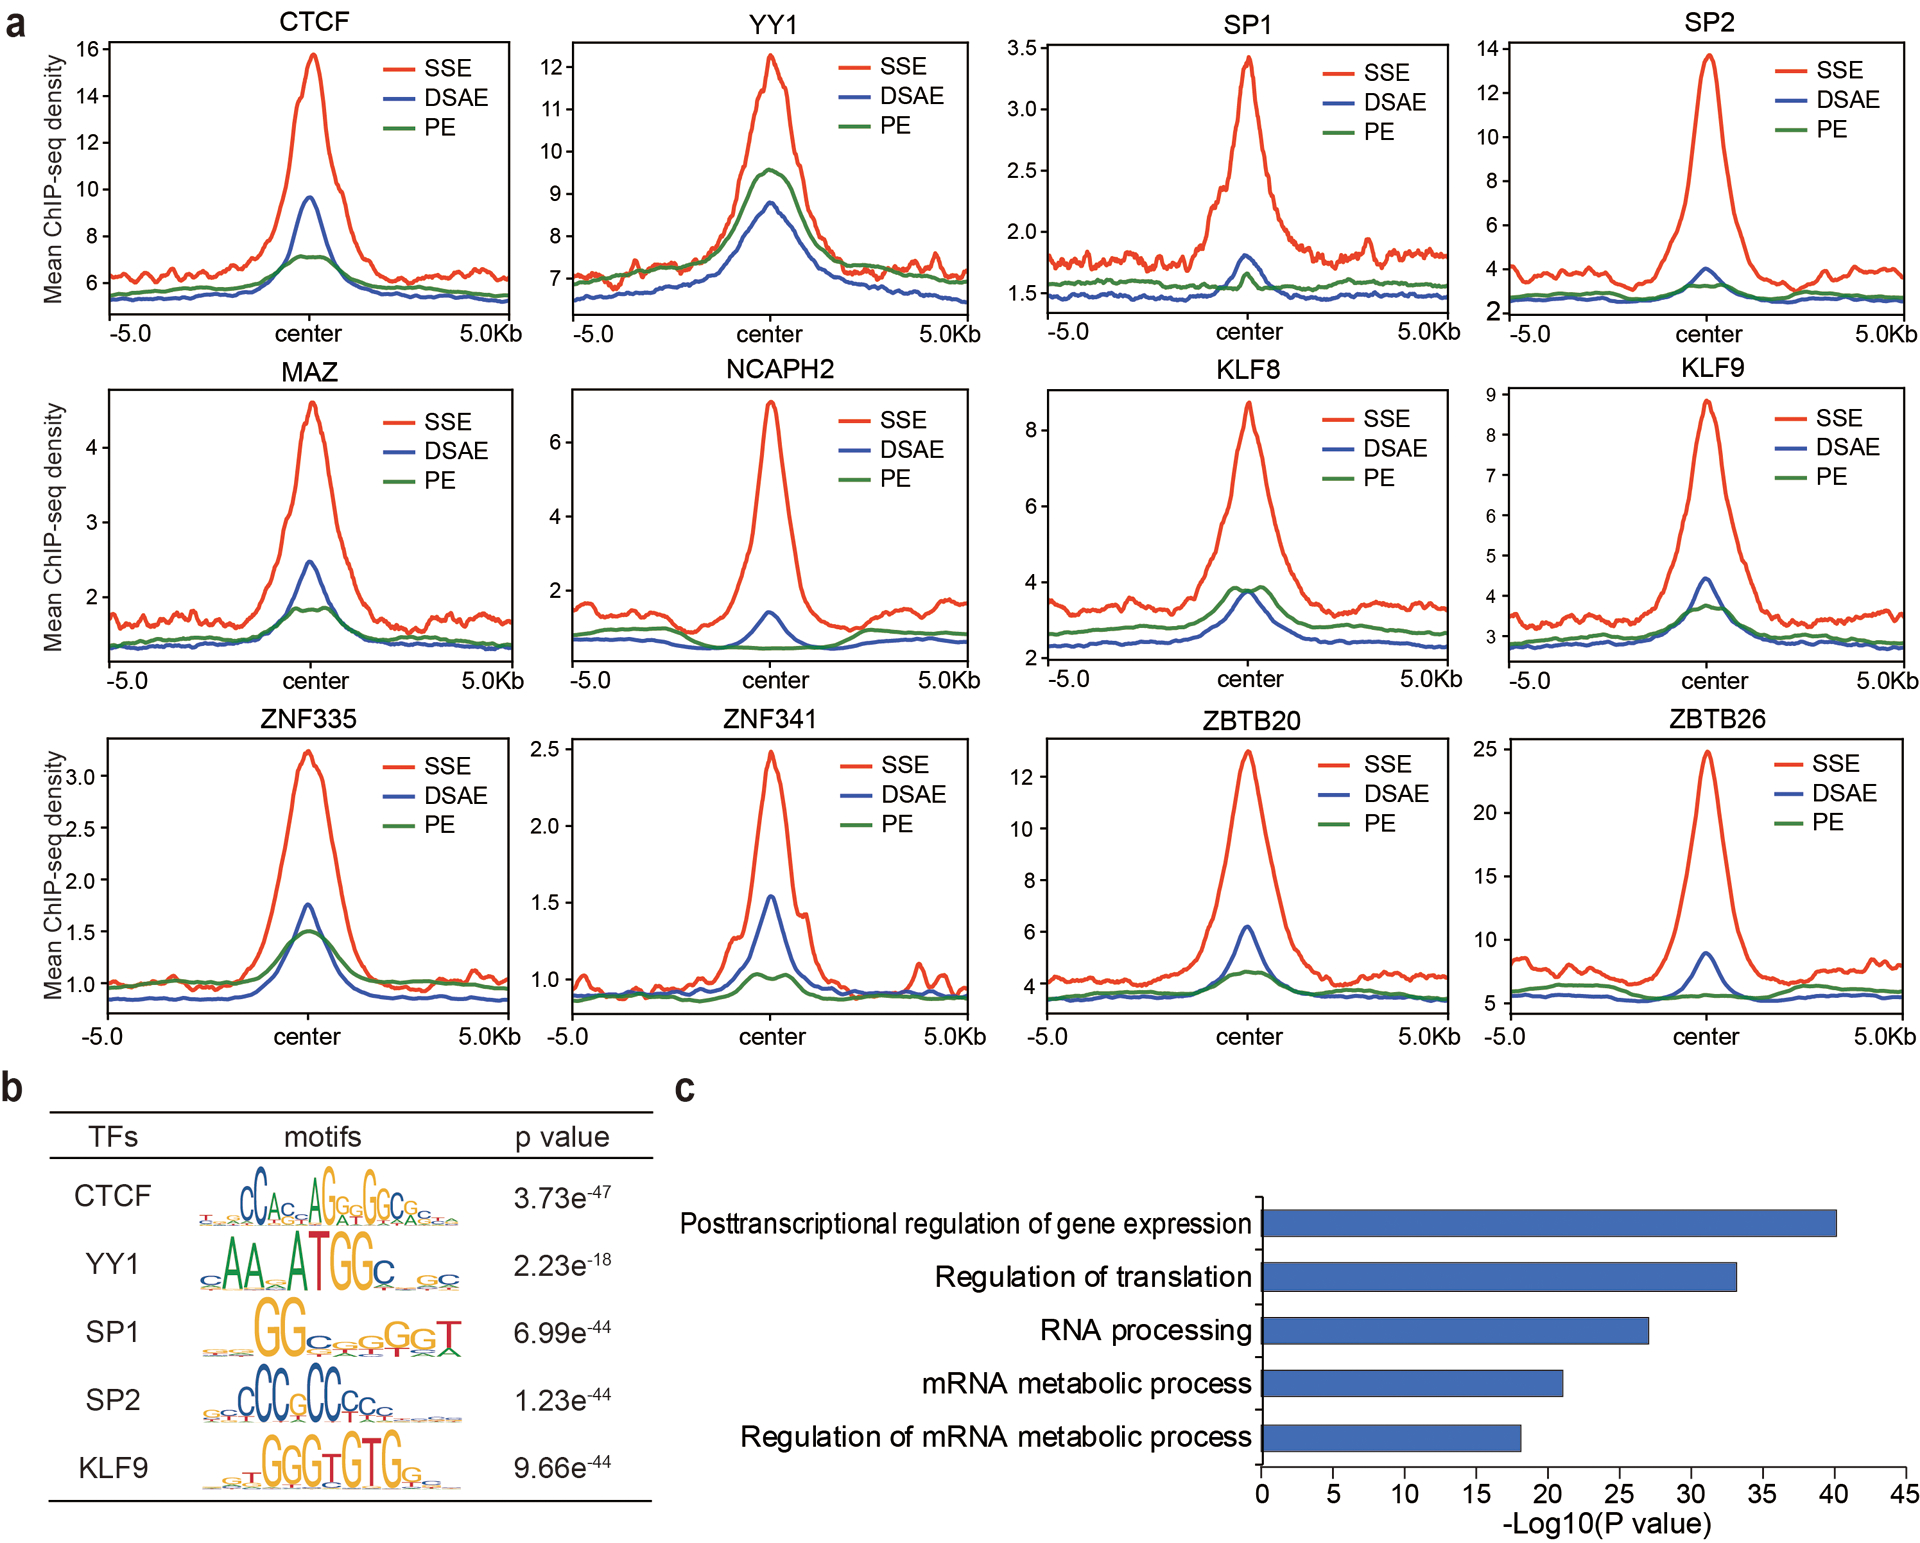
a, Metagene profiles of CTCF, YY1, SP1, SP2, MAZ, NCAPH2, KLF8, KLF9, ZNF335, ZNF341, ZBTB20, and ZBTB26 ChIP-seq reads densities at denoted enhancers in HEK293T cells. Regions within 10 kb around the enhancer centers are shown. b, Transcription factor binding motifs enriched at ssDNA-containing enhancers (n = 1,969 enhancers) in HEK293T cells with corresponding p values by using the genome as background. Only TFs with motif information in the TRANSFAC vertebrates library were analyzed. P values were calculated by two-sided binomial test. c, GREAT analysis of genes regulated by ssDNA-containing enhancers (n = 1,969 enhancers) in HEK293T cells. P values were calculated by two-sided binomial test. SSE: ssDNA-containing enhancers; DSAE: double-stranded active enhancers; PE: poised enhancers.
Extended Data Fig. 10. KAS-seq and Pol II ChIP-seq signals in response to protein condensation inhibition.
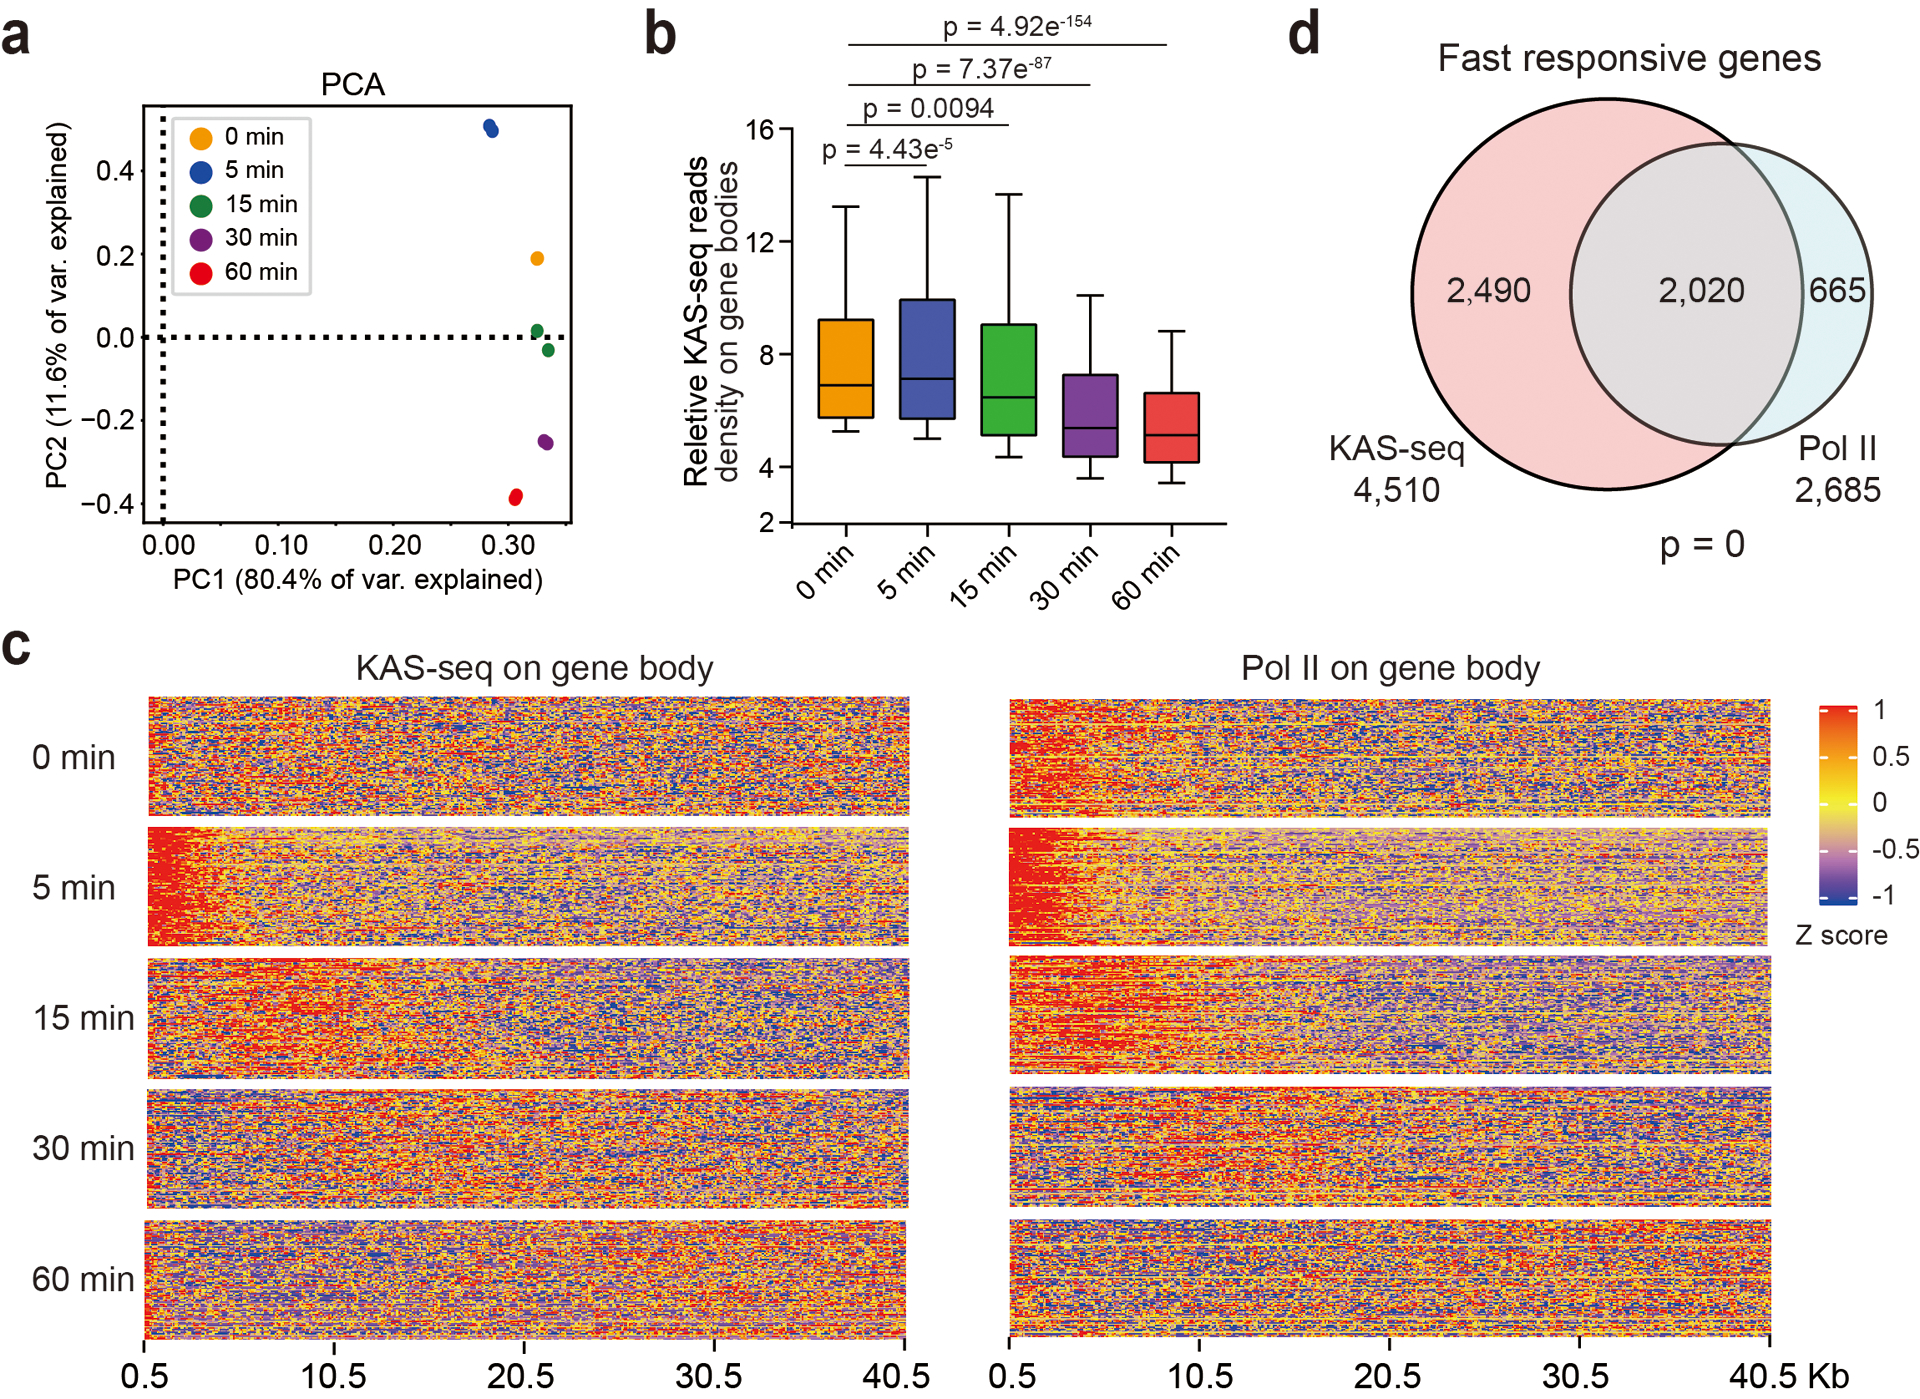
a, PCA analysis of KAS-seq data at different time points after 1,6-hexanediol treatment (n = 3,122,843 1 kb bins). b, Box plots showing normalized KAS-seq reads densities on gene bodies (from 0.5 kb downstream TSS to TES) of the genes defined as responsive to 1,6-hexanediol treatment. 10–90 percentile of data points are shown, with the center line showing the median, and the box limits showing the upper and lower quartiles. P values were calculated by using two-sided unpaired Student’s t-test. c, Heat map showing the release and movement of KAS-seq signals (left) and Pol II clusters (right) from 0 min to 60 min after 1,6-hexanediol treatment. d, Numbers of fast responsive genes defined by KAS-seq and Pol II ChIP-seq, and the overlap. The p value was calculated by two-sided Fisher’s exact test.
Supplementary Material
Supplementary Table 1. Public data used in this study.
Supplementary Table 2. All high-throughput sequencing data generated in this study.
Acknowledgements
We thank all He lab members for discussion. We thank Bryan Harada for helpful comments on the manuscript. We thank Genomics Facility at the University of Chicago for performing high-throughput sequencing (P30 CA014599). This work was supported by US National Institutes of Health (R01 HG006827, RM1 HG008935 and P01 NS097206 to C.H.). C. H. is an investigator of the Howard Hughes Medical Institute.
Footnotes
Competing interests
The University of Chicago has filed a patent application on KAS-seq. C.H. is a scientific founder and a member of the scientific advisory board of Accent Therapeutics, Inc., and a shareholder of Epican Genetech.
References
- 1.Schwanhäusser B et al. Global quantification of mammalian gene expression control. Nature 473, 337–342 (2011). [DOI] [PubMed] [Google Scholar]
- 2.Kim T-K et al. Widespread transcription at neuronal activity-regulated enhancers. Nature 465, 182–187 (2010). [DOI] [PMC free article] [PubMed] [Google Scholar]
- 3.Core LJ, Waterfall JJ & Lis JT Nascent RNA Sequencing Reveals Widespread Pausing and Divergent Initiation at Human Promoters. Science 322, 1845–1848 (2008). [DOI] [PMC free article] [PubMed] [Google Scholar]
- 4.Kwak H, Fuda NJ, Core LJ & Lis JT Precise Maps of RNA Polymerase Reveal How Promoters Direct Initiation and Pausing. Science 339, 950–953 (2013). [DOI] [PMC free article] [PubMed] [Google Scholar]
- 5.Fuchs G et al. 4sUDRB-seq: measuring genomewide transcriptional elongation rates and initiation frequencies within cells. Genome Biology 15, R69 (2014). [DOI] [PMC free article] [PubMed] [Google Scholar]
- 6.Schwalb B et al. TT-seq maps the human transient transcriptome. Science 352, 1225–1228 (2016). [DOI] [PubMed] [Google Scholar]
- 7.Churchman LS & Weissman JS Nascent transcript sequencing visualizes transcription at nucleotide resolution. Nature 469, 368–373 (2011). [DOI] [PMC free article] [PubMed] [Google Scholar]
- 8.Christopher Ramachandran, S. & Henikoff, S. Nucleosomes Are Context-Specific, H2A.Z-Modulated Barriers to RNA Polymerase. Molecular Cell 53, 819–830 (2014). [DOI] [PubMed] [Google Scholar]
- 9.Nojima T et al. Mammalian NET-Seq Reveals Genome-wide Nascent Transcription Coupled to RNA Processing. Cell 161, 526–540 (2015). [DOI] [PMC free article] [PubMed] [Google Scholar]
- 10.Mayer A et al. Native Elongating Transcript Sequencing Reveals Human Transcriptional Activity at Nucleotide Resolution. Cell 161, 541–554 (2015). [DOI] [PMC free article] [PubMed] [Google Scholar]
- 11.Hirabayashi S et al. NET-CAGE characterizes the dynamics and topology of human transcribed cis-regulatory elements. Nature Genetics 51, 1369–1379 (2019). [DOI] [PubMed] [Google Scholar]
- 12.Mirkovitch J & Darnell JE Mapping of RNA polymerase on mammalian genes in cells and nuclei. Molecular Biology of the Cell 3, 1085–1094 (1992). [DOI] [PMC free article] [PubMed] [Google Scholar]
- 13.Muse GW et al. RNA polymerase is poised for activation across the genome. Nature Genetics 39, 1507–1511 (2007). [DOI] [PMC free article] [PubMed] [Google Scholar]
- 14.Kouzine F et al. Global Regulation of Promoter Melting in Naive Lymphocytes. Cell 153, 988–999 (2013). [DOI] [PMC free article] [PubMed] [Google Scholar]
- 15.Kouzine F et al. Permanganate/S1 Nuclease Footprinting Reveals Non-B DNA Structures with Regulatory Potential across a Mammalian Genome. Cell Systems 4, 344–356.e347 (2017). [DOI] [PMC free article] [PubMed] [Google Scholar]
- 16.Shapiro R & Hachmann J The Reaction of Guanine Derivatives with 1,2-Dicarbonyl Compounds*. Biochemistry 5, 2799–2807 (1966). [DOI] [PubMed] [Google Scholar]
- 17.Weng X et al. Keth-seq for transcriptome-wide RNA structure mapping. Nature Chemical Biology (2020). [DOI] [PMC free article] [PubMed] [Google Scholar]
- 18.Buenrostro JD, Giresi PG, Zaba LC, Chang HY & Greenleaf WJ Transposition of native chromatin for fast and sensitive epigenomic profiling of open chromatin, DNA-binding proteins and nucleosome position. Nature Methods 10, 1213–1218 (2013). [DOI] [PMC free article] [PubMed] [Google Scholar]
- 19.Cramer P Organization and regulation of gene transcription. Nature 573, 45–54 (2019). [DOI] [PubMed] [Google Scholar]
- 20.Paule MR Transcription by RNA polymerases I and III. Nucleic Acids Research 28, 1283–1298 (2000). [DOI] [PMC free article] [PubMed] [Google Scholar]
- 21.Borchert GM, Lanier W & Davidson BL RNA polymerase III transcribes human microRNAs. Nature Structural & Molecular Biology 13, 1097–1101 (2006). [DOI] [PubMed] [Google Scholar]
- 22.Cer RZ et al. Non-B DB v2.0: a database of predicted non-B DNA-forming motifs and its associated tools. Proceedings of the National Academy of Sciences 41, D94–D100 (2013). [DOI] [PMC free article] [PubMed] [Google Scholar]
- 23.Henriques T et al. Widespread transcriptional pausing and elongation control at enhancers. Genes & Development, 26–41 (2018). [DOI] [PMC free article] [PubMed] [Google Scholar]
- 24.Warren et al. Master Transcription Factors and Mediator Establish Super-Enhancers at Key Cell Identity Genes. Cell 153, 307–319 (2013). [DOI] [PMC free article] [PubMed] [Google Scholar]
- 25.Raffaella et al. Control of Embryonic Stem Cell Identity by BRD4-Dependent Transcriptional Elongation of Super-Enhancer-Associated Pluripotency Genes. Cell Reports 9, 234–247 (2014). [DOI] [PMC free article] [PubMed] [Google Scholar]
- 26.Liu W et al. BRD4 regulates Nanog expression in mouse embryonic stem cells and preimplantation embryos. Cell Death & Differentiation 21, 1950–1960 (2014). [DOI] [PMC free article] [PubMed] [Google Scholar]
- 27.Wu T, Kamikawa YF & Donohoe ME Brd4’s Bromodomains Mediate Histone H3 Acetylation and Chromatin Remodeling in Pluripotent Cells through P300 and Brg1. Cell Reports 25, 1756–1771 (2018). [DOI] [PubMed] [Google Scholar]
- 28.McLean CY et al. GREAT improves functional interpretation of cis-regulatory regions. Nature Biotechnology 28, 495–501 (2010). [DOI] [PMC free article] [PubMed] [Google Scholar]
- 29.Wang D et al. Reprogramming transcription by distinct classes of enhancers functionally defined by eRNA. Nature 474, 390–394 (2011). [DOI] [PMC free article] [PubMed] [Google Scholar]
- 30.Li W et al. Functional roles of enhancer RNAs for oestrogen-dependent transcriptional activation. Nature 498, 516–520 (2013). [DOI] [PMC free article] [PubMed] [Google Scholar]
- 31.Andersson R et al. An atlas of active enhancers across human cell types and tissues. Nature 507, 455–461 (2014). [DOI] [PMC free article] [PubMed] [Google Scholar]
- 32.Arner E et al. Transcribed enhancers lead waves of coordinated transcription in transitioning mammalian cells. Science 347, 1010–1014 (2015). [DOI] [PMC free article] [PubMed] [Google Scholar]
- 33.Li W, Notani D & Rosenfeld MG Enhancers as non-coding RNA transcription units: recent insights and future perspectives. Nature Reviews Genetics 17, 207–223 (2016). [DOI] [PubMed] [Google Scholar]
- 34.Hnisz D, Shrinivas K, Young RA, Chakraborty AK & Sharp PA A Phase Separation Model for Transcriptional Control. Cell 169, 13–23 (2017). [DOI] [PMC free article] [PubMed] [Google Scholar]
- 35.Boija A et al. Transcription Factors Activate Genes through the Phase-Separation Capacity of Their Activation Domains. Cell 175, 1842–1855.e1816 (2018). [DOI] [PMC free article] [PubMed] [Google Scholar]
- 36.Sabari BR et al. Coactivator condensation at super-enhancers links phase separation and gene control. Science 361, eaar3958 (2018). [DOI] [PMC free article] [PubMed] [Google Scholar]
- 37.Cho W-K et al. Mediator and RNA polymerase II clusters associate in transcription-dependent condensates. Science 361, 412–415 (2018). [DOI] [PMC free article] [PubMed] [Google Scholar]
- 38.Chong S et al. Imaging dynamic and selective low-complexity domain interactions that control gene transcription. Science 361, eaar2555 (2018). [DOI] [PMC free article] [PubMed] [Google Scholar]
- 39.Guo YE et al. Pol II phosphorylation regulates a switch between transcriptional and splicing condensates. Nature 572, 543–548 (2019). [DOI] [PMC free article] [PubMed] [Google Scholar]
- 40.Zhou ZX et al. Mapping genomic hotspots of DNA damage by a single-strand-DNA-compatible and strand-specific ChIP-seq method. Genome Research 23, 705–715 (2013). [DOI] [PMC free article] [PubMed] [Google Scholar]
- 41.Khil PP, Smagulova F, Brick KM, Camerini-Otero RD & Petukhova GV Sensitive mapping of recombination hotspots using sequencing-based detection of ssDNA. Genome Research 22, 957–965 (2012). [DOI] [PMC free article] [PubMed] [Google Scholar]
- 42.Lydall D, Nikolsky Y, Bishop DK & Weinert T A meiotic recombination checkpoint controlled by mitotic checkpoint genes. Nature 383, 840–843 (1996). [DOI] [PubMed] [Google Scholar]
- 43.Wu T, Lyu R, He C, Kethoxal-assisted single-stranded DNA sequencing (KAS-seq) for capturing transcription dynamics and enhancer activity. Protoc. Exch (2020) DOI: 1010.21203/rs.2.24141/v1 [DOI] [PMC free article] [PubMed] [Google Scholar]
- 44.Martin M Cutadapt removes adapter sequences from high-throughput sequencing reads. EMBnet.journal 17, 10 (2011). [Google Scholar]
- 45.Langmead B, Trapnell C, Pop M & Salzberg SL Ultrafast and memory-efficient alignment of short DNA sequences to the human genome. Genome Biology 10, R25 (2009). [DOI] [PMC free article] [PubMed] [Google Scholar]
- 46.Li H et al. The Sequence Alignment/Map format and SAMtools. Bioinformatics 25, 2078–2079 (2009). [DOI] [PMC free article] [PubMed] [Google Scholar]
- 47.Zhang Y et al. Model-based Analysis of ChIP-Seq (MACS). Genome Biology 9, R137 (2008). [DOI] [PMC free article] [PubMed] [Google Scholar]
- 48.Kim D, Langmead B & Salzberg SL HISAT: a fast spliced aligner with low memory requirements. Nature Methods 12, 357–360 (2015). [DOI] [PMC free article] [PubMed] [Google Scholar]
- 49.Wang L, Wang S & Li W RSeQC: quality control of RNA-seq experiments. Bioinformatics 28, 2184–2185 (2012). [DOI] [PubMed] [Google Scholar]
- 50.Ramirez F, Dundar F, Diehl S, Gruning BA & Manke T deepTools: a flexible platform for exploring deep-sequencing data. Nucleic Acids Research 42, W187–W191 (2014). [DOI] [PMC free article] [PubMed] [Google Scholar]
- 51.Heinz S et al. Simple Combinations of Lineage-Determining Transcription Factors Prime cis-Regulatory Elements Required for Macrophage and B Cell Identities. Molecular Cell 38, 576–589 (2010). [DOI] [PMC free article] [PubMed] [Google Scholar]
- 52.Thomas-Chollier M et al. Transcription factor binding predictions using TRAP for the analysis of ChIP-seq data and regulatory SNPs. Nature Protocols 6, 1860–1869 (2011). [DOI] [PubMed] [Google Scholar]
Associated Data
This section collects any data citations, data availability statements, or supplementary materials included in this article.
Supplementary Materials
Supplementary Table 1. Public data used in this study.
Supplementary Table 2. All high-throughput sequencing data generated in this study.
Data Availability Statement
All sequencing data are available at NCBI Gene Expression Omnibus with the accession number: GSE139420. Other data that support the findings of this study are available from the corresponding author upon request.


