

Abstract
Introduction: Despite its associations with falls, disability, and mortality, balance is an under-recognized and frequently overlooked aspect of aging. Studies investigating associations between factors across life and balance are limited. Understanding the factors related to balance performance could help identify protective factors and appropriate interventions across the life course. This study aimed to: (i) identify socioeconomic, anthropometric, behavioral, health, and cognitive factors that are associated with one-legged balance performance; and (ii) explore how these associations change with age.
Methods: Data came from 3,111 members of the MRC National Survey of Health and Development, a British birth cohort study. Multilevel models examined how one-legged standing balance times (assessed at ages 53, 60–64, and 69) were associated with 15 factors across life: sex, maternal education (4 years), paternal occupation (4 years), own education (26 years), own occupation (53 years), and contemporaneous measures (53, 60–64, 69 years) of height, BMI, physical activity, smoking, diabetes, respiratory symptoms, cardiovascular events, knee pain, depression and verbal memory. Age and sex interactions with each variable were assessed.
Results: Men had 18.8% (95%CI: 13.6, 23.9) longer balance times than women at age 53, although this difference decreased with age (11.8% at age 60–64 and 7.6% at age 69). Disadvantaged socioeconomic position in childhood and adulthood, low educational attainment, less healthy behaviors, poor health status, lower cognition, higher body mass index (BMI), and shorter height were associated with poorer balance at all three ages. For example, at age 53, those from the lowest paternal occupational classes had 29.6% (22.2, 38.8) worse balance than those from the highest classes. Associations of balance with socioeconomic indicators, cognition and physical activity became smaller with age, while associations with knee pain and depression became larger. There were no sex differences in these associations. In a combined model, the majority of factors remained associated with balance.
Discussion: This study identified numerous risk factors across life that are associated with one-legged balance performance and highlighted diverse patterns of association with age, suggesting that there are opportunities to intervene in early, mid and later life. A multifactorial approach to intervention, at both societal and individual levels, may have more benefit than focusing on a single risk factor.
Keywords: balance, aging, life course, risk factor, epidemiology
Introduction
From getting out of bed in the morning to sitting, standing and walking throughout the day, balance is a crucial component of everyday life (Muir et al., 2010). Poor balance is linked with several adverse health outcomes, perhaps most notably increased falls risk (Ganz et al., 2007), but also with increased risk of disability, fractures, hospitalization, and premature mortality (Cooper et al., 2011b, 2014; Nofuji et al., 2016; Keevil et al., 2018). Despite the growing awareness of the importance of balance in aging—as reflected in recent physical activity guidelines (Centre for Ageing Better, 2018; US Department of Health Human Services., 2018; Department of Health Social Care., 2019)—the life course epidemiology of balance performance has been under-investigated compared with other measures of physical capability such as grip strength and chair rise performance.
In the few studies that have examined factors across life in relation to balance performance, several associations have been found. Across a range of ages, males tend to have better balance performance than females (Wolfson et al., 1994; Schultz et al., 1997; Cooper et al., 2011a; Kim et al., 2012). Low socioeconomic position (SEP) has been found to have a negative cumulative association with balance performance, with an additive effect of low SEP in childhood and adulthood on risk for poor balance in later life (Birnie et al., 2011b; Strand et al., 2011a). Smoking history (Strand et al., 2011b), low cognitive ability in both childhood and adulthood (Kuh et al., 2009a; Blodgett et al., 2020), higher levels of depression (Nitz et al., 2005), and low levels of physical activity (Cooper et al., 2011c, 2015; Chang et al., 2013), have also been shown to be associated with poor balance.
These previous studies have primarily examined associations between a single risk factor and balance ability at one time point. With the exception of our recent study of the association between childhood cognitive ability and balance performance (Blodgett et al., 2020), to our knowledge, no study has examined whether associations change with age. This is a limitation, given that balance is a complex process that relies on sensory input including visual cues, proprioception, vestibular processes as well as muscular strength and cognitive processing (Merla and Spaulding, 1997), and so may be affected by age-related changes, such as increased levels of morbidity and decline in cognitive functioning. In addition, few studies have investigated sex differences in the associations between risk factors and balance ability. This is despite the fact that investigating sex differences in the relationships between different risk factors and balance may help elucidate why men have better average balance performance than women, as the reasons for this are still not fully understood (Maki et al., 1990; Wolfson et al., 1994; Hageman et al., 1995; Schultz et al., 1997; Bryant et al., 2005).
Using a British birth cohort study, previously used to study factors associated with balance at a single age (Kuh et al., 2006, 2009a; Birnie et al., 2011a; Cooper et al., 2011a,c, 2015; Strand et al., 2011a,b; Mulla et al., 2013; Murray et al., 2013; Blodgett et al., 2020), we aimed to investigate associations of socioeconomic, behavioral, health and cognitive risk factors across life with one-legged balance performance over 16 years and assess if these associations change with age or sex. We hypothesized that positive factors such as high SEP, low BMI, participation in healthy behaviors, absence of poor physical and mental health as well as higher adult cognitive ability would be associated with better balance performance. As physical and mental comorbidities become more common with age, we hypothesized that the associations of health status with balance performance would get stronger with age. Conversely, as health status becomes more important, the relative contributions of SEP were hypothesized to decrease.
Methods
Sample
The MRC National Survey of Health and Development (NSHD) is an ongoing study of 5,362 individuals born in England, Scotland, or Wales within 1 week in March 1946. Since 1946, study members have been followed up to 24 times in infancy, across childhood, adolescence, and adulthood, most recently at ages 53 (n = 2,988), 60–64 (n = 2,229), and 69 (n = 2,149) using a combination of questionnaires, interviews, and clinical examinations (Kuh et al., 2016). Details of loss to follow-up (e.g., death, emigration, refusal, incapacity) in this sample have been previously described (Blodgett et al., 2020). Ethical approval for the most recent data collection wave (2015) was obtained from Queen Square Research Ethics Committee (14/ LO/1073) and Scotland A Research Ethics Committee (14/SS/1009).
Assessment of Balance Ability
One-legged balance performance was assessed by trained nurses during clinical assessments at ages 53, 60–64, and 69 using standardized protocols. Study members were asked to fold their arms and stand on their preferred leg with their eyes closed for as long as possible up to a maximum of 30 s. If individuals were unable to perform the test, the reason was recorded. In these analyses, individuals who could not perform the test due to health reasons and those who attempted but could not maintain the balance position were given a score of zero. The final analytical sample consisted of individuals with a balance time at one or more ages (n = 3,111). The one-legged balance test is considered to be a reliable and valid measure of static balance and has been shown to have high inter-rater and test-retest reliability (Giorgetti et al., 1998; Bohannon, 2006; Springer et al., 2007; Michikawa et al., 2009; Choi et al., 2014; Ortega-Pérez de Villar et al., 2018). Many studies have consistently demonstrated associations between poor one-legged balance performance and higher risk of falls, disability, poor gait speed, frailty and premature mortality (Drusini et al., 2002; Michikawa et al., 2009; Cooper et al., 2010, 2014; Delbaere et al., 2010; Oliveira et al., 2018).
Assessment of Risk Factors
We selected a set of risk factors a priori that had previously been shown to be associated with balance or other measures of physical capability at a single time point in NSHD and other studies (Kuh et al., 2006, 2009a; Birnie et al., 2011b; Cooper et al., 2011a,c, 2015; Strand et al., 2011a,b; Welmer et al., 2012; D'Andréa Greve et al., 2013; Amemiya et al., 2019; Thomas et al., 2019).
Socioeconomic Indicators
Paternal occupational class (at age 4) and own occupational class (reported at age 53 years) were grouped into three categories as distinguished by the Registrar General's Social Classification (Galobardes et al., 2006): (1) I Professional and II Intermediate; (2) III Skilled (non-manual) and III Skilled (manual); and (3) IV Partly skilled and V Unskilled manual. Maternal education was classified into four categories: (1) Primary only; (2) Primary and further education; (3) Secondary only; (4) Secondary and further education. Participants reported their highest level of educational attainment by age 26, which was categorized as degree or higher, advanced secondary qualifications generally attained at 18 years (GCE A level or Burnham B), ordinary secondary qualifications generally attained at 16 years, (e.g., GCE O level or Burnham C), below ordinary secondary qualifications, or none.
Anthropometric Indicators (Ages 53, 60–64, 69)
Height (m) and BMI (kg/m2), derived from height and weight measurements ascertained by nurses using standardized protocols, were used (Braddon et al., 1986).
Behavioral Risk Factors (Ages 53, 60–64, 69)
Individuals self-reported their leisure time physical activity participation (never, 1–4 times/month, 5+ times/month) and their smoking status (never, past smoker, current smoker) (Kuh et al., 2009b; Strand et al., 2011b). Current and past smokers were defined as those who smoked at least one cigarette a day for 12 months or more.
Health Status (Ages 53, 60–64, 69)
Current health conditions (yes/no for each) were ascertained using a series of self-reported questions on history of diabetes, cardiovascular events, respiratory symptoms, and knee pain (Kuh et al., 2005; Cooper et al., 2014). Symptoms of depression and anxiety were assessed using the 28-item self-reported General Health Questionnaire; each item was scored from 1 to 4 and summed together (range: 0–84) (Goldberg and Hillier, 1979).
Cognitive Ability (Ages 53, 60–64, 69)
Verbal memory was assessed using a 15-item word list. Each word was presented for 2 s before individuals were instructed to write down as many words as they could remember. This was repeated over three identical trials and the number of words recalled during each trial were summed (range: 0–45). To minimize any practice effects, two word lists were rotated between follow-up assessments (Davis et al., 2017).
Statistical Analyses
Sex differences in each risk factor were assessed using t-tests or chi-square tests, as appropriate, and described by the mean (±SD) or proportion (n). Separate multilevel models were used to examine the associations between each risk factor (independent variable) and log transformed balance time (dependent variable) in the maximal available sample size. Cross-sectional associations were assessed for time-varying covariates (e.g., anthropometric, behavioral, health, cognitive factors), whereas SEP measures were based on reports from one age. Balance times at each age (level 1) were nested within individuals (level 2) and both the intercept and slope were modeled as random effects. As the sample was age-homogenous, age was employed as a linear time metric and was centered at age 53 (intercept); age 63 was utilized as the time integer for age 60–64 (Kuh et al., 2019; Blodgett et al., 2020). Balance times were log-transformed due to the skewed distribution of balance. Non-linearity of the association between each risk factor and balance was assessed using likelihood ratio tests.
A variable-by-sex interaction term was estimated, with subsequent models stratified by sex if there was evidence of an interaction. An interaction between age and each risk factor was added to the model to test whether the association between each risk factor and balance changes with age. Age interactions were considered if p < 0.05; an alpha of 0.05 was used for both age and sex interactions in order to parsimoniously build each model. Finally, all risk factors and significant interaction terms were included in a combined model. To account for the non-random events of mortality and attrition (not due to death), the model was adjusted for separate binary indicators of both death and attrition (not due to death) between ages 53 and 69. This approach minimizes the correlation between non-random loss to follow up and poorer performance on the balance test, thus reducing bias in the other estimates (Botoseneanu and Liang, 2012; Botoseneanu et al., 2013). All estimates are presented as sympercents (i.e., as % change) to aid interpretation (Cole and Kryakin, 2000). Stata 14 was used for all statistical analyses.
Results
Characteristics of the sample are described in Table 1. Men were taller than women, had higher adult SEP, higher educational attainment, lower verbal memory, and were more likely to have a history of smoking. Men also had a higher prevalence of diabetes and CVD events, although women reported higher prevalence of knee pain and symptoms of anxiety and depression.
Table 1.
Characteristics of analytical sample (n = 3,111), MRC National Survey of Health and Development.
| Men (n = 1,550) | Women (n = 1,561) | Tests of sex differences (p-value) | ||
|---|---|---|---|---|
| ONE-LEGGED BALANCE TIME (s), MEDIAN (Q1, Q3), n | ||||
| Age 53 | 5 (3, 10), n = 1421 | 4 (3, 7), n = 1,476 | <0.001 | |
| Age 60-64 | 3.57 (2.35, 5.53), n =1,055 | 3.16 (2.16, 4.72), n = 1,148 | <0.001 | |
| Age 69 | 2.94 (1.84, 4.78), n = 1,037 | 2.72 (1.69, 4.15), n = 1,079 | <0.005 | |
| SOCIOECONOMIC INDICATORS, n (%) | ||||
| Paternal occupational class | ||||
| I Professional/II Intermediate | 407 (27.6) | 383 (26.0) | 0.56 | |
| III Skilled (non-manual or manual) | 692 (46.9) | 716 (48.7) | ||
| IV Partly skilled/V Unskilled | 377 (25.5) | 372 (25.3) | ||
| Maternal education | ||||
| Secondary and further education | 162 (11.74) | 169 (12.2) | 0.49 | |
| Secondary only | 167 (12.1) | 153 (11.0) | ||
| Primary and further education | 213 (15.4) | 193 (13.90) | ||
| Primary only | 838 (60.7) | 873 (62.9) | ||
| Highest household occupational class | ||||
| I Professional/II Intermediate | 788 (51.6) | 559 (36.1) | <0.001 | |
| III Skilled (non-manual or manual) | 578 (37.8) | 659 (42.6) | ||
| IV Partly skilled/V Unskilled | 162 (10.6) | 329 (21.3) | ||
| Educational attainment at age 26 | ||||
| Degree or higher | 212 (14.5) | 81 (5.5) | <0.001 | |
| GCE A level or Burnham B | 408 (27.9) | 343 (23.3) | ||
| GCE O level or Burnham C | 211 (14.4) | 377 (25.6) | ||
| Sub GCE | 92 (6.3) | 134 (9.1) | ||
| None attempted | 540 (36.9) | 537 (36.5) | ||
| ANTHROPOMETRY, MEAN (SD) | ||||
| Height (m) | ||||
| Age 53 | 1.75 (0.07), n = 1,436 | 1.62 (0.06), n = 1,498 | <0.001 | |
| Age 60–64 | 1.75 (0.09), n=1062 | 1.62 (0.06), n=1159 | <0.001 | |
| Age 69 | 1.73 (0.09), n = 1,023 | 1.61 (0.06), n = 1,077 | <0.001 | |
| BMI (kg/m2) | ||||
| Age 53 | 27.4 (4.0), n = 1,435 | 27.4 (5.5), n = 1,486 | 0.89 | |
| Age 60–64 | 27.9 (4.1), n = 1,061 | 27.9 (5.5), n = 1,158 | 0.92 | |
| Age 69 | 28.2 (4.6), n = 1,040 | 28.2 (5.7), n = 1,081 | 0.91 | |
| BEHAVIORAL RISK FACTORS, n (%) | ||||
| Leisure time physical activity | ||||
| Age 53 | None | 693 (47.9) | 761 (50.4) | 0.18 |
| 1–4 times/month | 270 (18.7) | 245 (16.2) | ||
| 5+ times/month | 485 (33.5) | 503 (33.3) | ||
| Age 60–64 | None | 681 (65.2) | 716 (62.9) | 0.52 |
| 1–4 times/month | 137 (13.1) | 162 (14.2) | ||
| 5+ times/month | 227 (21.7) | 261 (22.9) | ||
| Age 69 | None | 711 (59.9) | 777 (61.33) | 0.08 |
| 1–4 times/month | 135 (11.4) | 170 (13.42) | ||
| 5+ times/month | 341 (28.7) | 320 (25.3) | ||
| Smoking status | ||||
| Age 53 | Current | 343 (23.6) | 339 (22.5) | <0.001 |
| Previous smoker | 737 (50.8) | 671 (44.5) | ||
| Never smoker | 371 (25.6) | 499 (33.1) | ||
| Age 60–64 | Current | 137 (12.3) | 142 (11.8) | <0.001 |
| Previous smoker | 663 (59.5) | 629 (52.1) | ||
| Never smoker | 314 (28.2) | 436 (36.1) | ||
| Age 69 | Current | 123 (10.3) | 111 (8.8) | <0.001 |
| Previous smoker | 756 (63.5) | 723 (57.2) | ||
| Never smoker | 311 (26.1) | 430 (34.0) | ||
| HEALTH STATUS, n (%) | ||||
| Diabetes | Age53 | 57 (3.1) | 43 (2.4) | 0.18 |
| Age60–64 | 129 (10.1) | 99 (7.2) | <0.01 | |
| Age69 | 175 (13.7) | 136 (10.0) | <0.005 | |
| CVD events | Age53 | 85 (5.8) | 48 (3.2) | <0.01 |
| Age60–64 | 131 (11.5) | 62 (5.1) | <0.001 | |
| Age69 | 193 (17.6) | 114 (10.0) | <0.001 | |
| Respiratory symptoms | Age 53 | 292 (19.9) | 276 (18.2) | 0.22 |
| Age 60–64 | 233 (20.1) | 224 (18.2) | 0.15 | |
| Age 69 | 264 (24.5) | 266 (22.4) | 0.23 | |
| Knee pain | Age 53 | 226 (15.5) | 310 (20.6) | <0.001 |
| Age 60–64 | 216 (20.3) | 288 (24.6) | 0.01 | |
| Age 69 | 190 (18.1) | 241 (22.1) | 0.02 | |
| Depression/anxiety | Age 53 | 15.2 (7.3), n = 1,051 | 17.8 (8.9), n = 1,137 | <0.001 |
| Age 60–64 | 15.7 (8.6), n = 1,407 | 18.9 (10.3), n = 1,470 | <0.001 | |
| Age 69 | 14.1 (7.5), n = 1025 | 16.2 (8.2), n = 1068 | <0.001 | |
| VERBAL MEMORY SCORES, MEAN (SD) | ||||
| Age 53 | 23.0 (6.2), n = 1,397 | 24.9 (6.2), n = 1473 | <0.001 | |
| Age 60–64 | 23.0 (5.9), n = 1,023 | 25.4 (6.1), n = 1,127 | <0.001 | |
| Age 69 | 21.2 (6.0), n = 1,005 | 23.1 (6.0), n = 1057 | <0.001 | |
Sex, Age, and Balance
Women had 18.8% (95%CI: 13.6, 23.9%; Table 2, Figure 1) worse balance performance than men at age 53. The interaction between age and sex indicated that for every additional year increase in age, the sex difference in balance decreased by 0.7% (0.3, 1.2%). Thus, at ages 63 and 69, respectively, women had 11.4% (7.6, 15.2%) and 7.0% (2.1, 11.9%) lower balance times than men. Despite the sex differences in balance performance across time, there were no interactions between sex and any of the risk factors investigated.
Table 2.
Associations between risk factors and balance performance in multilevel models.
| Mean difference in % balance time at age 53 (intercept) | Age (years)*risk factor interaction | ||||
|---|---|---|---|---|---|
| Risk factorsa | n participants (n observations) | Coefficient (%) (95% CI) | p-value | Coefficient (%) (95% CI) | p-value |
| 1: Sex [female vs. male (ref)] | 3,111 (obs = 7,216) | −18.8 (−23.9, −13.6) | <0.001 | 0.7 (0.3, 1.2) | <0.001 |
| 2: Paternal occupational classb | 2,947 (obs = 6,838) | −14.8 (−18.4, −11.1) | <0.001 | 0.5 (0.2, 0.8) | <0.001 |
| (per 1 level change) | |||||
| 3: Maternal educationc | 2,768 (obs = 6,424) | −11.3 (−23.8, −8.8) | <0.001 | 0.4 (0.2, 0.6) | <0.001 |
| (per 1 level change) | |||||
| 4: Education at age 26d | 2,935 (obs = 6,830) | −11.1 (−12.9, −9.3) | <0.001 | 0.3 (0.2, 0.5) | <0.001 |
| (per 1 level change) | |||||
| 5: Own occupational classb | 3,075 (obs = 7,167) | −15.2 (−17.9, −12.6) | <0.001 | - | - |
| (per 1 level change) | |||||
| 6: Height (cm) | |||||
| linear term | 3,090 (obs = 7,144) | 12.5 (6.4, 18.7) | <0.001 | - | - |
| quadratic term | −0.04 (−0.05, −0.02) | <0.001 | |||
| 7: BMI (per kg/m2) | 3,083 (obs = 7,150) | −2.8 (−3.1, −2.5) | <0.001 | - | - |
| 8: Leisure time physical activitye | 3,094 (obs = 6,960) | ||||
| 1–4 times/week | 23.9 (17.3, 30.5) | <0.001 | −0.7 (−1.3, 0.02) | 0.04 | |
| 5+ times/week | 23.3 (18.0, 28.7) | <0.001 | −0.4 (−0.9, 0.1) | 0.12 | |
| 9: Smokingf | 3,092 (obs = 6,996) | 6.1 (3.3, 8.9) | <0.001 | - | - |
| (per 1 level change) | |||||
| 10: Diabetesg | 3,111 (obs = 7,214) | 18.0 (11.6, 24.4) | <0.001 | - | - |
| 11: CVD eventsg | 3,072 (obs = 6,895) | 19.1 (12.9, 25.4) | <0.001 | - | - |
| 12: Respiratory symptomsg | 3,062 (obs = 6,634) | 8.6 (4.5, 12.7) | <0.001 | - | - |
| 13: Knee pain g | 3,108 (obs = 7,173) | 10.8 (4.6, 17.0) | <0.001 | −0.7 (−1.3, −0.01) | 0.02 |
| 14: Symptoms of depression/anxietyh | 3,071 (obs = 7,032) | 5.3 (2.8, 7.7) | <0.001 | 0.3 (0.04, 0.5) | <0.02 |
| (per 1 SD) | |||||
| 15: Verbal memoryh | 3,035 (obs = 6,979) | 13.4 (11.0, 15.9) | <0.001 | −0.4 (−0.6, −0.2) | <0.05 |
| (per 1SD) | |||||
all models adjusted for sex as no evidence of sex interactions (see Table 3).
ref: I Professional or II Intermediate.
ref: Secondary and further education.
ref: Degree or higher.
ref: none in last 4 weeks.
ref: current smoker.
ref: individuals with no health condition.
SD estimates at each age are provided in Table 1.
Figure 1.
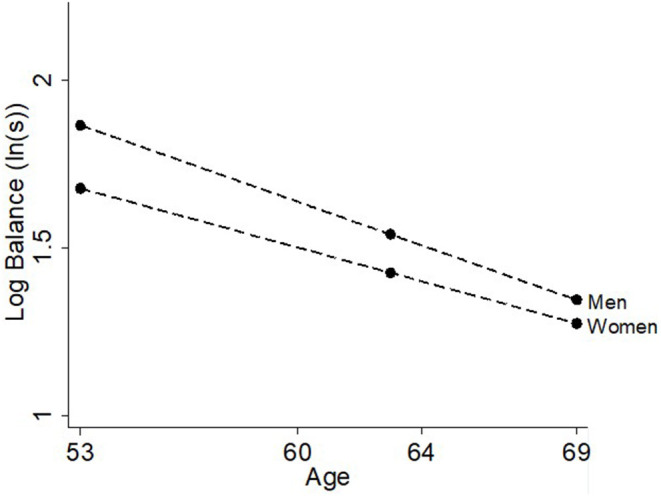
Differences in balance time at ages 53, 60–64, and 69 years by sex.
Socioeconomic Indicators and Balance
The results of the likelihood ratio tests for deviations from linearity suggested that all four socioeconomic indicators could be modeled as continuous variables. More disadvantaged SEP for all four indicators—paternal occupation, maternal education, own education, own occupation—was associated with worse balance times (Table 2, Figure 2). For example, more disadvantaged paternal occupational class was associated with 14.8% (11.1, 18.4%; Table 2, Figure 2A) poorer balance time for each subsequent level. The associations with paternal occupational class, maternal education and own educational attainment all became smaller with age (all p < 0.001, Table 2, Figure 2), however there was no interaction between own occupational class and age (p = 0.1).
Figure 2.

Differences in balance time at ages 53, 60–64, and 69 years by (A) paternal occupational class, (B) maternal education, (C) own education, and (D) own occupational class.
Anthropometric Indicators and Balance
Height had a quadratic association with balance such that taller individuals had better balance times than shorter individuals although this association plateaued at the tallest heights (see Table 2, Figure 3). BMI had an inverse linear association with balance, where every additional kg/m2 was associated with 2.8% (2.5, 3.1%) poorer balance time (Table 2, Figure 4). There was no evidence of an interaction with age for either height (p = 0.1) or BMI (p = 0.6) suggesting that the association stayed constant over time (Table 3).
Figure 3.
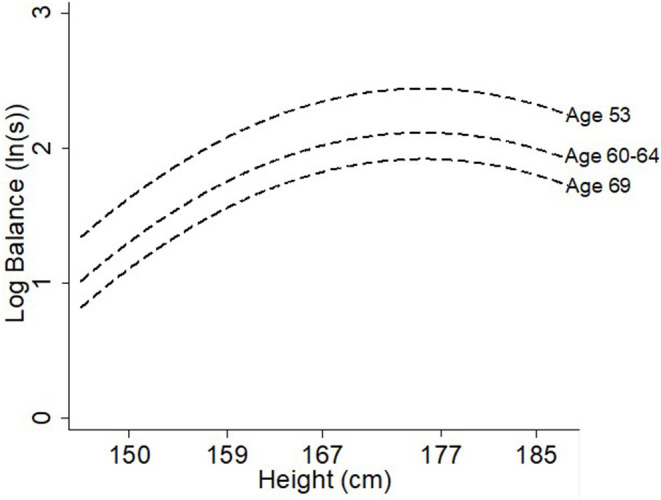
Differences in balance time at ages 53, 60–64, and 69 years by height (cm).
Figure 4.

Differences in balance time at ages 53, 60–64, and 69 years by BMI (kg/m2).
Table 3.
Summary of tests of non-linearity, sex interactions and age interactions of all covariates with balance performance.
| Description of how variable is modeled | Sex interaction p-value | Age interaction effect on size of association | |
|---|---|---|---|
| Sex (female) | n/aa | n/a | ↓ with age |
| Socioeconomic indicators | |||
| Paternal occupational class | Continuously | 0.9 | Effect ↓ with age |
| Maternal education | Continuously | 0.7 | Effect ↓ with age |
| Education | Continuously | 0.5 | Effect ↓ with age |
| Own occupational class | Continuously | 0.4 | Constant with age |
| Anthropometry | |||
| Height | Quadratic term | 0.9 | Constant with age |
| BMI | Linear term only | 0.1 | Constant with age |
| Health behaviors | |||
| Leisure time physical activity | Categorically | 0.7 | Effect ↓ with age |
| Smoking | Continuously | 0.1 | Constant with age |
| Current health status | |||
| History of diabetes | n/aa | 0.5 | Constant with age |
| History of cardiovascular events | n/aa | 0.2 | Constant with age |
| Respiratory symptoms | n/aa | 0.6 | Constant with age |
| Knee pain | n/aa | 0.8 | Effect ↑ with age |
| Symptoms of anxiety & depression | Linear term only | 0.4 | Effect ↑ with age |
| Other | |||
| Verbal memory | Linear term only | 0.2 | Effect ↓ with age |
Unable to test non-linearity in dichotomous indicators.
Health Behaviors and Balance
Those who participated in leisure time physical activity 1–4 times [23.9% (17.3, 30.5%)] or 5+ times [23.3% (18.0, 28.7%)] per month had better balance times than those who did not participate at age 53 (Table 2, Figure 5A). There was no difference in balance between those who participated in leisure time physical activity 1–4 times/month and those who participated 5+ times/month. There was evidence that the association got smaller with age, as shown by the age-interaction for those who participated 1–4 times/month. Individuals who had a past history of smoking or who were current smokers had worse balance ability than those who had never smoked [6.1% (3.3, 8.9%); Table 2, Figure 5B]; there was no evidence that this association changed with age.
Figure 5.

Differences in balance time at ages 53, 60–64, and 69 years by (A) leisure time physical activity and (B) smoking status.
Current Health Status and Balance
Individuals who had a history of diabetes, a history of CVD events or current respiratory symptoms had worse balance performance; these associations remained constant with age (Table 2, Figures 6A–C). Those who reported knee pain had 10.8% (4.6, 17.0%) lower balance times at age 53; this association got larger with age [0.7% per year (0.1, 1.2)] such that those with knee pain at age 69 had 21.6% (15.4, 27.8%) poorer balance than those with no knee pain (Table 2, Figure 6D). A one standard deviation increase in depression and anxiety symptoms on the GHQ-28 questionnaire was associated with a 5.2% (2.8, 7.7%, Table 2, Figure 6E) decrease in balance times. This association also increased with age by 0.3% per year (0.04, 0.5%); by age 69, 1 SD increase in GHQ-28 score was associated with a 9.5% (7.0, 11.9%) decrease in balance time.
Figure 6.

Differences in balance time at ages 53, 60–64, and 69 years by (A) diabetes, (B) CVD events, (C) respiratory symptoms, (D) knee pain, and (E) symptoms of depression and anxiety.
Cognitive Ability and Balance
One standard deviation increase in verbal memory was associated with a 13.4% (11.0, 15.9%; Table 2, Figure 7) increase in balance time at age 53. This association got smaller with age (0.5% per year, (0.3, 0.7%), but remained associated with balance at age 69 [5.1%, (2.6, 7.5%)].
Figure 7.
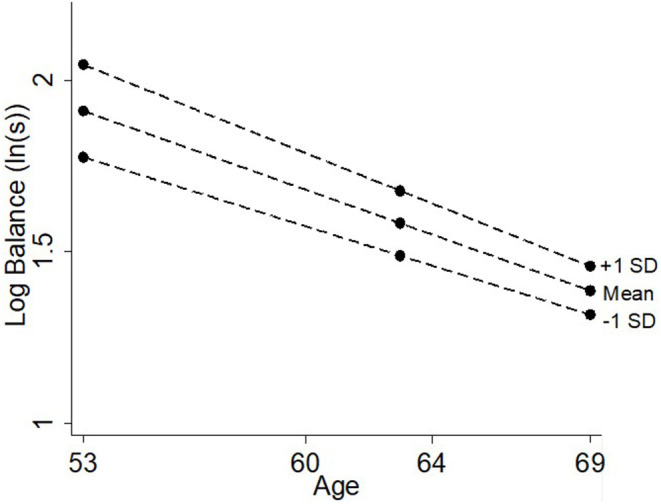
Differences in balance time at ages 53, 60–64, and 69 years by verbal memory.
Combined Model of All Covariates and Their Association With Balance
Table 4 provides the estimates for the combined model of all covariates and the relevant age interaction terms. Notably, being female, having higher BMI, lower maternal education, lower educational attainment, lower own occupational class, not participating in leisure time physical activity, reporting a history of CVD events, higher levels of anxiety and depression and lower verbal memory remained associated with lower balance time. Nearly all age interaction terms weakened and were no longer statistically significant (at the 5% level) in this model, although there remained evidence that the associations with sex and verbal memory decreased with age.
Table 4.
Combined model of all risk factors and all significant age interactions from individual models additionally adjusting for death and attrition, n = 2,465 (obs = 5,150).
| Mean difference in % balance time at age 53 (intercept) | Age (years)*risk factor interaction | |||
|---|---|---|---|---|
| Risk factorsa | Coefficient (%) (95% CI) | p-value | Coefficient (%) (95% CI) | p-value |
| Sex (female) | −21.7 (−28.7, −14.7) | <0.001 | 0.9 (0.4, 1.3) | <0.001 |
| Paternal occupational classb (per 1 level change) | −2.7 (−6.8, 1.5) | 0.21 | 0.3 (−0.1, 0.7) | 0.11 |
| Maternal educationc (per 1 level change) | −3.9 (−6.7, −1.0) | <0.01 | 0.1 (−0.2, 0.3) | 0.51 |
| Education at age 26d (per 1 level change) | −3.8 (−6.2, −1.3) | <0.005 | −0.2 (−0.4, 0.02) | 0.08 |
| Own occupational classb (per 1 level change) | −4.9 (−8.2, −1.7) | <0.005 | – | – |
| Height (m) | ||||
| linear term | 5.0 (−1.6, 11.6) | 0.13 | – | – |
| quadratic term | −0.02 (−0.04, 0.004) | 0.12 | ||
| BMI (per kg/m2) | −2.1 (−2.5, −1.7) | <0.001 | – | – |
| Leisure time physical activitye | ||||
| 1–4 times/week | 9.1 (1.9, 16.3) | <0.001 | 0.1 (−0.6, 0.8) | 0.28 |
| 5+ times/week | 5.8 (−0.2, 11.8) | 0.3 (−0.3, 0.9) | ||
| Smokingf (per 1 level change) | 1.4 (−1.6, 4.4) | 0.36 | – | – |
| Diabetesg | −6.9 (−14.1, 0.5) | 0.07 | – | – |
| CVD eventsg | −7.1 (−14.0, −0.3) | 0.04 | – | – |
| Respiratory symptomsg | −2.5 (−7.0, 2.0) | 0.28 | – | – |
| Knee paing | −4.5 (−11.2, 2.1) | 0.18 | −0.2 (−0.8, 0.4) | 0.55 |
| Symptoms of depression/anxietyh (per 1 SD) | −3.1 (−5.8, −0.4) | 0.02 | −0.1 (−0.4, 0.2) | 0.46 |
| Verbal memoryh (per 1SD) | 5.9 (2.8, 8.9) | <0.001 | −0.4 (−0.7, −0.1) | <0.01 |
all models adjusted for sex as no evidence of sex interactions (see Table 3).
ref: I Professional or II Intermediate.
ref: Secondary and further education.
ref: Degree or higher.
ref: none in last 4 weeks.
ref: current smoker.
ref: individuals with no health condition.
SD estimates at each age are provided in Table 1.
Discussion
Main Findings
We quantified associations between a range of risk factors across life and balance performance at ages 53, 60–64, and 69. Individuals with better balance were more likely to be male, have higher SEP in both childhood and adulthood, be taller, have lower BMI, partake in leisure time physical activity and were less likely to smoke. Individuals with better balance were also more likely to be healthier (no history of diabetes or CVD, not currently experiencing respiratory symptoms or knee pain), less likely to be experiencing symptoms of depression and anxiety, and more likely to have higher verbal memory. In a combined model, the majority of risk factors remained independently associated with balance, indicating that the factors across life that are associated with one-legged balance performance are multifaceted and complex.
Sex differences in balance performance were not explained by adjustment for other risk factors. Furthermore, there was no evidence to suggest that the associations between these risk factors and balance differed by sex, although several associations did change with age. Associations of balance performance with sex, socioeconomic indicators, physical activity and verbal memory became smaller with increasing age, while associations with anthropometric indicators, smoking, and physical health status stayed constant. Two associations became larger with age; associations of both knee pain and symptoms of anxiety and depression with balance doubled from age 53–69.
Comparison With Other Studies and Explanation of Findings
Socioeconomic Indicators
A systematic review and meta-analysis of over 22 000 individuals from 11 separate studies reported that lower childhood SEP (as indicated by parental occupation and education) was associated with inability to balance with eyes open for ≥5 s (Birnie et al., 2011b); adjustment for adult SEP fully attenuated the effect of childhood SEP (paternal occupation used if available). However, maternal education and both indicators of adulthood SEP remained independently associated with balance time in our fully-adjusted model. In addition to differing operationalisations of one-legged balance performance (continuous vs. binary; eyes closed vs. eyes open), a possible explanation for these differing results is that 9 of the 11 studies included in the meta-analysis relied upon retrospective reports of childhood SEP (Birnie et al., 2011a). A strength of NSHD is that data on SEP and other risk factors were prospectively ascertained and so not prone to recall bias. As previously shown in relation to cognitive outcomes (Kaplan et al., 2001; Guralnik et al., 2006), paternal occupational class and maternal education may have distinctive associations with balance performance; further exploration of these differences are required.
While childhood SEP is hypothesized to be associated with balance ability via a complex pathway of health behaviors, education, adult SEP, cognitive ability and/or health conditions, the association remained when these factors were included in the model. Thus, childhood may also represent a sensitive period of development for balance ability, as previously hypothesized when testing associations of childhood cognition and midlife balance performance in NSHD (Blodgett et al., 2020). Adult SEP may also be associated with balance through a pathway of current physical and cognitive health or health behaviors. That both childhood and adult SEP indicators remained independently associated with balance suggests that accumulation of low SEP across the life course may be a greater risk factor than low SEP at any one particular life stage.
Notably, the relationship between most SEP indicators and balance time weakened with increasing age. This suggests that SEP may be more strongly associated with balance in midlife than at older ages when substantial age-related decline begins and chronic diseases manifest. Nevertheless, the association between the most recent measure of SEP (occupational class at age 53) and balance did not change with age.
Anthropometric Indicators
Higher body mass may influence the stability of an individual and the motor mechanisms involved in the balance process. For example, individuals with higher BMI often require more movement in order to maintain their balance, thus frequently demonstrate high levels of postural sway and reduced balance performance (D'Andréa Greve et al., 2013; Hita-Contreras et al., 2013). Studies have suggested that body stability is inversely related to the height of the center of gravity (D'Andréa Greve et al., 2013) and that shorter individuals are better able to maintain their balance. However, we found that taller individuals had better balance than shorter individuals though this effect appeared to plateau above a certain height.
Previous evidence has suggested that sex differences in balance performance disappear when scores are normalized to height (Maki et al., 1990; Hageman et al., 1995; Era et al., 2002; Bryant et al., 2005), while other studies have shown that anthropometric factors are major determinants of balance performance in women only (Kim et al., 2012). However, we found no sex differences in the association of either height or BMI with balance ability and adjustment for these measures did not explain sex differences (as seen in the combined model). Given that men have higher average strength and mobility compared to women (Miller et al., 1993; Sugimoto et al., 2014; Zunzunegui et al., 2015), further investigation into whether more detailed assessment of body composition (e.g., lean mass, fat mass) explains sex differences is warranted.
Health Behaviors
It is well-recognized that low levels of physical activity (de Rezende et al., 2014; Cooper et al., 2016; Olanrewaju et al., 2016; Schwingshackl et al., 2017) and current or past smoking (Cooper et al., 2016; Daskalopoulou et al., 2018) have negative consequences for an individual's physical capability, including their balance performance. Some studies have shown increasing levels of physical activity are associated with better balance (Powell et al., 2011; Cooper et al., 2015), while others have shown that there is no difference in health benefit between moderately active and maximally active groups (Cooper et al., 2016). In this study, participation in leisure time physical activity was associated with better balance performance. Although there was little additional benefit for balance ability beyond 1–4 times per month at age 53, a graded association between increasing levels of physical activity and balance performance emerged by age 69 (see Figure 5A).
Individuals who currently smoked had worse balance performance compared with those who were ex-smokers; ex-smokers also had worse balance compared with those who had never smoked. Although not previously examined in balance ability, this is consistent with increasing severity of poor physical capability seen amongst categories of smoking history (North et al., 2015; Cooper et al., 2016), suggesting that quitting smoking may have a positive association with balance performance.
Current Health Status
The presence of each physical and mental health condition (diabetes, CVD, respiratory symptoms, knee pain, symptoms of anxiety, and depression) was associated with poorer balance performance. This is consistent with the literature on how current health impacts an individual's physical capability or functional decline (Welmer et al., 2012; Kuh et al., 2014; Ryan et al., 2015). Each health condition likely has a direct biological pathway impacting balance. For example, diabetes is related to both peripheral neuropathy (Greene et al., 1992) and age-related visual impairment (Lutty, 2013; Pelletier et al., 2016) while knee pain can have a direct impact on proprioception and musculoskeletal function (Sanchez-Ramirez et al., 2013). Individuals with a history of CVD events or respiratory symptoms often demonstrate shared pathophysiological features common in those with balance impairment including increased postural sway due to physical displacement of breathing (Jeong, 1991), decreased blood flow in specific functional areas (Abate et al., 2009) and decreased musculoskeletal capacity (Crisan et al., 2015). Finally, increased inflammatory markers that are common in arthritis, such as C-reactive protein or nitric oxide (Cepeda et al., 2016) are also more common in individuals with depression than those without. In addition to this inflammation pathway, individuals with depression also tend to restrict their physical activity, have reduced motivation to perform well and exhibit psychomotor impedance such as a slowing in musculoskeletal components (Bennabi et al., 2013); all of these factors can influence balance performance.
The associations of diabetes, CVD and respiratory symptoms with balance performance were constant. However, the associations of knee pain and symptoms of anxiety and depression with balance got stronger at older ages. The constant or increasing associations between health conditions and balance ability with age suggests that overall health becomes relatively more important for balance ability in later life; this could in part explain why the strength of associations with many other risk factors decreased with increasing age.
Cognitive Ability
As expected given previous findings in NSHD (Kuh et al., 2009a; Blodgett et al., 2020), higher verbal memory was associated with higher levels of balance performance. Cognitive processing of sensory and motor input is an important component of the balancing process (Li et al., 2018). Previous evidence in NSHD has shown that childhood cognitive ability is associated with adult balance performance; this is primarily via an adult cognition and education pathway that is independent of most of the other risk factors examined here (Blodgett et al., 2020). As suggested above, the decreasing strength of association with age suggests that cognitive ability becomes less important with age, as other factors in the aging process, in particular health conditions, become more important.
Methodological Considerations
A major strength of this paper is the assessment of balance performance at three ages, which facilitated our novel investigation into whether associations between risk factors and balance ability change over 16 years, from mid to later life. A second strength is the comprehensive investigation, in separate and combined models, of the associations between 14 different factors across life and balance performance. These risk factors were all prospectively ascertained which increases reliability of response and limits recall bias. A third strength was the methods used to include those individuals who had missing balance scores for health reasons or because of death or loss to follow up between ages 53 and 69. These combined strengths provided novel evidence on how the associations between these risk factors and balance ability change with age. Finally, the age homogeneity of the sample eliminated any confounding by age that is common when examining physical capability in mid and later life (Seeman and Chen, 2002; Garber et al., 2010).
One potential limitation of our study is that we were unable to include participants in analyses if they had been lost to follow up before age 53 (i.e., the age at which balance was first assessed). Characteristics of study members who were lost to follow up before the first clinical assessment at age 53 were more likely to be male (Stafford et al., 2013), have lower childhood and adulthood occupational class (Stafford et al., 2013; Kuh et al., 2016), demonstrate unhealthy behaviors (smoking, physical inactivity) (Stafford et al., 2013), have lower verbal memory (Stafford et al., 2013) and have poorer overall health (Kuh et al., 2016). Participants who were followed up to age 53 but could not be included in analyses due to missing data on risk factors had similar characteristics to those lost to follow-up before age 53. Many of these characteristics (i.e., low SEP, unhealthy behaviors, lower cognition, and poorer health) were negatively associated with balance ability, thus it is hypothesized that those with lost to follow up before age 53 or with missing risk factor data may have had poorer balance. This likely resulted in an underestimation of the size and strength of associations.
Two further limitations are the assumptions of the model: that the change in balance over time is linear and that all individuals follow the same mean trajectory of decline. Individuals are likely to exhibit heterogonous aging trajectories as they demonstrate different patterns of change in balance performance with age (e.g., steeper decline, delayed decline, maintenance of balance ability). As there were only three time points for balance, it was not appropriate to test for non-linearity in balance trajectories. Identifying polynomial time terms can help identify the age at which decline begins or accelerates. Further research, with at least four measures of balance performance, should address these differences across time and between individuals. We also need to consider the possibility that other factors not considered in our analyses such as alcohol consumption and medication use may also be important and need to be considered in future research.
Although there were multiple comparisons, the risk of Type 1 error remains low as all of the primary associations in Table 2 were significant at p < 0.001 and an alpha of 0.05 was intentionally used for interaction terms to ensure a parsimonious model. Finally, one-legged balance ability measures a specific aspect of static balance that does not directly represent the dynamic balance relied upon in everyday situations (Owings et al., 2000; Mackey and Robinovitch, 2005; Bhatt et al., 2011). Further research should consider if associations between the risk factors identified in this study are consistent for tests of dynamic balance or for more sensitive measures of postural sway, as assessed with a force plate.
Implications and Conclusions
We investigated 14 different factors across life that are associated with balance performance. These findings are important in considering appropriate interventions to minimize balance decline or when identifying high-risk individuals. That multiple risk factors were identified suggests that a multifactorial approach including behavioral, health and cognitive factors (amongst others) may have more benefit than a focus on a single risk factor. As several of these risk factors have different associations with balance at different ages, there may be benefit in targeting different factors at different ages. Knee pain and symptoms of depression and anxiety both appear to become more important with age and may represent important targets for intervention in midlife before their potential association with balance performance increases. While not all of the factors identified (e.g., socioeconomic, height, smoking history) may be easily modified, they are likely to have utility in helping to identify individuals at high risk of future balance difficulties who may require more support than others to maintain balance ability as they age.
In summary, this study identified many anthropometric, behavioral, socioeconomic, health and cognitive risk factors across life that are associated with balance ability. The majority of variables remained independently associated with one-legged balance performance, suggesting that the range of risk factors associated with poor balance ability is diverse and complex. This highlights the importance of considering both type (i.e., multifactorial approach) and timing (i.e., early, mid, and later life) of interventions that target balance performance in adulthood.
Data Availability Statement
The datasets used in this study will not be made publicly available. Access to NSHD data adheres to strict confidentiality guidelines but these data are available to bonafide researchers upon request to the NSHD Data Sharing Committee via a standard application procedure. Further details can be found at http://www.nshd.mrc.ac.uk/data. doi: 10.5522/NSHD/Q101; doi: 10.5522/NSHD/Q102; doi: 10.5522/NSHD/Q103.
Ethics Statement
At each wave of data collection, relevant ethical approval has been received. Ethical approval for the most recent data collection (2014–2015) was obtained from Queen Square Research Ethics Committee (13/LO/1073) and Scotland A Research Ethics Committee (14/SS/1009). All participants have provided written informed consent.
Author Contributions
JB performed statistical analyses and wrote the first draft of the manuscript. All authors contributed to the conception and design of the study, to manuscript revision, read, and approved the submitted version.
Conflict of Interest
The authors declare that the research was conducted in the absence of any commercial or financial relationships that could be construed as a potential conflict of interest.
Footnotes
Funding. Funding for the MRC NSHD was provided by the Medical Research Council (MC_UU_00019/1 Theme 1: Cohorts and Data Collection). JB was supported by the Canadian Institutes of Health Research (FDSA) and the Canadian Centennial Scholarship Fund. RH was Director of CLOSER which is funded by the Economic and Social Research Council (award reference: ES/K000357/1) and was funded by the ESRC and MRC between 2012 and 2017. DK, RH, and RC were supported by the UK Medical Research Council MC_UU_12019/1 which provided core funding for the MRC National Survey of Health and Development and by MC_UU_12019/2 and MC_UU_12019/4. DD was funded through a Welcome Trust fellowship (WT107467).
References
- Abate M., Di Iorio A., Pini B., Battaglini C., Di Nicola I., Foschini N., et al. (2009). Effects of hypertension on balance assessed by computerized posturography in the elderly. Arch Gerontol Geriatr. 49, 113–117. 10.1016/j.archger.2008.05.008 [DOI] [PubMed] [Google Scholar]
- Amemiya A., Kondo N., Saito J., Saito M., Takagi D., Haseda M., et al. (2019). Socioeconomic status and improvement in functional ability among older adults in Japan: a longitudinal study. BMC Public Health 19:209. 10.1186/s12889-019-6531-9 [DOI] [PMC free article] [PubMed] [Google Scholar]
- Bennabi D., Vandel P., Papaxanthis C., Pozzo T., Haffen E. (2013). Psychomotor retardation in depression: a systematic review of diagnostic, pathophysiologic, and therapeutic implications. Biomed. Res. Int. 2013:158746. 10.1155/2013/158746 [DOI] [PMC free article] [PubMed] [Google Scholar]
- Bhatt T., Espy D., Yang F., Pai Y. C. (2011). Dynamic gait stability, clinical correlates, and prognosis of falls among community-dwelling older adults. Arch. Phys. Med. Rehabil. 92, 799–805. 10.1016/j.apmr.2010.12.032 [DOI] [PubMed] [Google Scholar]
- Birnie K., Cooper R., Martin R. M., Kuh D., Sayer A. A., Alvarado B. E., et al. (2011a). Childhood socioeconomic position and objectively measured physical capability levels in adulthood: a systematic review and meta-analysis. PLoS ONE. 6:e15564. 10.1371/journal.pone.0015564 [DOI] [PMC free article] [PubMed] [Google Scholar]
- Birnie K., Martin R. M., Gallacher 6J., Bayer A., Gunnell D., Ebrahim S., et al. (2011b). Socio-economic disadvantage from childhood to adulthood and locomotor function in old age: a lifecourse analysis of the Boyd Orr and Caerphilly prospective studies. J. Epidemiol. Community Health 65, 1014–1023. 10.1136/jech.2009.103648 [DOI] [PMC free article] [PubMed] [Google Scholar]
- Blodgett J. M., Kuh D., Hardy R., Davis D. H. J., Cooper R. (2020). Childhood cognition and age-related change in standing balance performance from mid to later life: findings from a British birth cohort. J. Gerontol. A Biol. Sci. Med. Sci. 75, 155–161. 10.1093/gerona/gly275 [DOI] [PMC free article] [PubMed] [Google Scholar]
- Bohannon R. W. (2006). Single limb stance times - a descriptive meta-analysis of data from individuals at least 60 years of age. Topics Geriatr. Rehab. 22, 70–77. 10.1097/00013614-200601000-00010 [DOI] [Google Scholar]
- Botoseneanu A., Allore H. G., Gahbauer E. A., Gill T. M. (2013). Long-term trajectories of lower extremity function in older adults: estimating gender differences while accounting for potential mortality bias. J. Gerontol. A Biol. Sci. Med. Sci. 68, 861–868. 10.1093/gerona/gls228 [DOI] [PMC free article] [PubMed] [Google Scholar]
- Botoseneanu A., Liang J. (2012). The effect of stability and change in health behaviors on trajectories of body mass index in older Americans: a 14-year longitudinal study. J. Gerontol. A Biol. Sci. Med. Sci. 67, 1075–1084. 10.1093/gerona/gls073 [DOI] [PMC free article] [PubMed] [Google Scholar]
- Braddon F. E., Rodgers B., Wadsworth M. E., Davies J. M. (1986). Onset of obesity in a 36 year birth cohort study. Br. Med. J. 293, 299–303. 10.1136/bmj.293.6542.299 [DOI] [PMC free article] [PubMed] [Google Scholar]
- Bryant E. C., Trew M. E., Bruce A. M., Kuisma R. M., Smith A. W. (2005). Gender differences in balance performance at the time of retirement. Clin. Biomech. 20, 330–335. 10.1016/j.clinbiomech.2004.11.006 [DOI] [PubMed] [Google Scholar]
- Centre for Ageing Better (2018). Ideas for the NHS Long-Term Plan From the Centre for Ageing Better. [Google Scholar]
- Cepeda M. S., Stang P., Makadia R. (2016). Depression is associated with high levels of c-reactive protein and low levels of fractional exhaled nitric oxide: results from the 2007-2012 National Health and Nutrition Examination Surveys. J. Clin. Psychiatry. 77, 1666–1671. 10.4088/JCP.15m10267 [DOI] [PubMed] [Google Scholar]
- Chang M., Saczynski J. S., Snaedal J., Bjornsson S., Einarsson B., Garcia M., et al. (2013). Midlife physical activity preserves lower extremity function in older adults: age gene/environment susceptibility-Reykjavik study. J. Am. Geriatr. Soc. 61, 237–242. 10.1111/jgs.12077 [DOI] [PMC free article] [PubMed] [Google Scholar]
- Choi Y. M., Dobson F., Martin J., Bennell K. L., Hinman R. S. (2014). Interrater and intrarater reliability of common clinical standing balance tests for people with hip osteoarthritis. Phys. Ther. 94, 696–704. 10.2522/ptj.20130266 [DOI] [PubMed] [Google Scholar]
- Cole T. J., Kryakin Y. V. (2000). Sympercents: symmetric percentage differences on the 100 log(e) scale simplify the presentation of log transformed data. Stat. Med. 21, 2287–2290. 10.1002/sim.1008 [DOI] [PubMed] [Google Scholar]
- Cooper A. J., Simmons R. K., Kuh D., Brage S., Cooper R., Scientific N., et al. (2015). Physical activity, sedentary time and physical capability in early old age: British birth cohort study. PLoS ONE 10:e0126465. 10.1371/journal.pone.0126465 [DOI] [PMC free article] [PubMed] [Google Scholar]
- Cooper R., Hardy R., Aihie Sayer A., Ben-Shlomo Y., Birnie K., Cooper C., et al. (2011a). Age and gender differences in physical capability levels from mid-life onwards: the harmonisation and meta-analysis of data from eight UK cohort studies. PLoS ONE. 6:e27899. 10.1371/journal.pone.0027899 [DOI] [PMC free article] [PubMed] [Google Scholar]
- Cooper R., Kuh D., Cooper C., Gale C. R., Lawlor D. A., Matthews F., et al. (2011b). Objective measures of physical capability and subsequent health: a systematic review. Age Ageing. 40, 14–23. 10.1093/ageing/afq117 [DOI] [PMC free article] [PubMed] [Google Scholar]
- Cooper R., Kuh D., Hardy R., Mortality Review Group, Falcon, Halcyon Study Teams. (2010). Objectively measured physical capability levels and mortality: systematic review and meta-analysis. BMJ 341:c4467. 10.1136/bmj.c4467 [DOI] [PMC free article] [PubMed] [Google Scholar]
- Cooper R., Mishra G. D., Kuh D. (2011c). Physical activity across adulthood and physical performance in midlife: findings from a British birth cohort. Am. J. Prev. Med. 41, 376–384. 10.1016/j.amepre.2011.06.035 [DOI] [PMC free article] [PubMed] [Google Scholar]
- Cooper R., Muniz-Terrera G., Kuh D. (2016). Associations of behavioural risk factors and health status with changes in physical capability over 10 years of follow-up: the MRC National Survey of Health and Development. BMJ Open 6:e009962. 10.1136/bmjopen-2015-009962 [DOI] [PMC free article] [PubMed] [Google Scholar]
- Cooper R., Strand B. H., Hardy R., Patel K. V., Kuh D. (2014). Physical capability in mid-life and survival over 13 years of follow-up: British birth cohort study. BMJ 348:g2219. 10.1136/bmj.g2219 [DOI] [PMC free article] [PubMed] [Google Scholar]
- Crisan A. F., Oancea C., Timar B., Fira-Mladinescu O., Tudorache V. (2015). Balance impairment in patients with COPD. PLoS ONE 10:e0120573. 10.1371/journal.pone.0120573 [DOI] [PMC free article] [PubMed] [Google Scholar]
- D'Andréa Greve J., Cug M., Dülgeroglu D., Brech G. C., Alonso A. C. (2013). Relationship between anthropometric factors, gender, and balance under unstable conditions in young adults. Biomed. Res. Int. 2013:850424. 10.1155/2013/850424 [DOI] [PMC free article] [PubMed] [Google Scholar]
- Daskalopoulou C., Stubbs B., Kralj C., Koukounari A., Prince M., Prina A. M. (2018). Associations of smoking and alcohol consumption with healthy ageing: a systematic review and meta-analysis of longitudinal studies. BMJ Open 8:e019540. 10.1136/bmjopen-2017-019540 [DOI] [PMC free article] [PubMed] [Google Scholar]
- Davis D., Bendayan R., Muniz Terrera G., Hardy R., Richards M., Kuh D. (2017). Decline in search speed and verbal memory over 26 years of midlife in a British birth cohort. Neuroepidemiology 49, 121–128. 10.1159/000481136 [DOI] [PMC free article] [PubMed] [Google Scholar]
- de Rezende L. F., Rodrigues Lopes M., Rey-Lopez J. P., Matsudo V. K., Luiz Odo C. (2014). Sedentary behavior and health outcomes: an overview of systematic reviews. PLoS ONE 9:e105620. 10.1371/journal.pone.0105620 [DOI] [PMC free article] [PubMed] [Google Scholar]
- Delbaere K., Close J. C., Heim J., Sachdev P. S., Brodaty H., Slavin M. J., et al. (2010). A multifactorial approach to understanding fall risk in older people. J. Am. Geriatr. Soc. 58, 1679–1685. 10.1111/j.1532-5415.2010.03017.x [DOI] [PubMed] [Google Scholar]
- Department of Health and Social Care (2019). UK Chief Medical Officers' Physical Activity Guidelines. [Google Scholar]
- Drusini A., Eleazer G., Caiazzo M., Veronese E., Carrara N., Ranzato C., et al. (2002). One-leg standing balance and functional status in an elderly community-dwelling population in northeast Italy. Aging Clin. Exp. Res. 14, 42–46. 10.1007/BF03324416 [DOI] [PubMed] [Google Scholar]
- Era P., Heikkinen E., Gause-Nilsson I., Schroll M. (2002). Postural balance in elderly people: changes over a five-year follow-up and its predictive value for survival. Aging Clin. Exp. Res. 14(S3), 37–46. [PubMed] [Google Scholar]
- Galobardes B., Shaw M., Lawlor D. A., Lynch J. W., Davey Smith G. (2006). Indicators of socioeconomic position (part 1). J. Epidemiol. Community Health 60, 7–12. 10.1136/jech.2004.023531 [DOI] [PMC free article] [PubMed] [Google Scholar]
- Ganz D. A., Bao Y., Shekelle P. G., Rubenstein L. Z. (2007). Will my patient fall? JAMA 297, 77–86. 10.1001/jama.297.1.77 [DOI] [PubMed] [Google Scholar]
- Garber C. E., Greaney M. L., Riebe D., Nigg C. R., Burbank P. A., Clark P. G. (2010). Physical and mental health-related correlates of physical function in community dwelling older adults: a cross sectional study. BMC Geriatr. 10:6. 10.1186/1471-2318-10-6 [DOI] [PMC free article] [PubMed] [Google Scholar]
- Giorgetti M. M., Harris B. A., Jette A. (1998). Reliability of clinical balance outcome measures in the elderly. Physiother. Res. Int. 3, 274–283. 10.1002/pri.150 [DOI] [PubMed] [Google Scholar]
- Goldberg D. P., Hillier V. F. (1979). A scaled version of the general health questionnaire. Psychol. Med. 9, 139–145. 10.1017/S0033291700021644 [DOI] [PubMed] [Google Scholar]
- Greene D. A., Sima A. A. F., Stevens M. J., Feldman E. L., Lattimer S. A. (1992). Complications: neuropathy, pathogenetic considerations. Diabetes Care. 15, 1902–1925. 10.2337/diacare.15.12.1902 [DOI] [PubMed] [Google Scholar]
- Guralnik J. M., Butterworth S., Wadsworth M. E., Kuh D. (2006). Childhood socioeconomic status predicts physical functioning a half century later. J. Gerontol. A Biol. Sci. Med. Sci. 61, 694–701. 10.1093/gerona/61.7.694 [DOI] [PubMed] [Google Scholar]
- Hageman P. A., Leibowitz J. M., Blanke D. (1995). Age and gender effects on postural control measures. Arch. Phys. Med. Rehabil. 76, 961–965. 10.1016/S0003-9993(95)80075-1 [DOI] [PubMed] [Google Scholar]
- Hita-Contreras F., Martinez-Amat A., Lomas-Vega R., Alvarez P., Mendoza N., Romero-Franco N., et al. (2013). Relationship of body mass index and body fat distribution with postural balance and risk of falls in Spanish postmenopausal women. Menopause 20, 202–208. 10.1097/GME.0b013e318261f242 [DOI] [PubMed] [Google Scholar]
- Jeong B. Y. (1991). Respiration effect on standing balance. Arch. Phys. Med. Rehabil. 72, 642–645. [PubMed] [Google Scholar]
- Kaplan G. A., Turrell G., Lynch J. W., Everson S. A., Helkala E. L., Salonen J. T. (2001). Childhood socioeconomic position and cognitive function in adulthood. Int. J. Epidemiol. 30, 256–263. 10.1093/ije/30.2.256 [DOI] [PubMed] [Google Scholar]
- Keevil V. L., Luben R., Hayat S., Sayer A. A., Wareham N. J., Khaw K. T. (2018). Physical capability predicts mortality in late mid-life as well as in old age: findings from a large British cohort study. Arch. Gerontol. Geriatr. 74, 77–82. 10.1016/j.archger.2017.10.001 [DOI] [PMC free article] [PubMed] [Google Scholar]
- Kim J., Kwon Y., Kim J., Chung H.-Y., Park S., Kim C.-S., et al. (2012). Gender-differences in the associations of anthropometry with postural sway in feet-together stance. Int. J. Precision Eng. Manuf. 13, 1897–1902. 10.1007/s12541-012-0249-2 [DOI] [Google Scholar]
- Kuh D., Bassey E. J., Butterworth S., Hardy R., Wadsworth M. E. J. (2005). Grip strength, postural control, and functional leg power in a representative cohort of british men and women: associations with physical activity, health status, and socioeconomic conditions. J. Gerontol. Series A Biol. Sci. Med. Sci. 60, 224–231. 10.1093/gerona/60.2.224 [DOI] [PubMed] [Google Scholar]
- Kuh D., Cooper R., Hardy R., Guralnik J., Richards M., Musculoskeletal Study T. (2009a). Lifetime cognitive performance is associated with midlife physical performance in a prospective national birth cohort study. Psychosom. Med. 71, 38–48. 10.1097/PSY.0b013e31818a1620 [DOI] [PMC free article] [PubMed] [Google Scholar]
- Kuh D., Hardy R., Blodgett J. M., Cooper R. (2019). Developmental factors associated with decline in grip strength from midlife to old age: a British birth cohort study. BMJ Open 9:e025755. 10.1136/bmjopen-2018-025755 [DOI] [PMC free article] [PubMed] [Google Scholar]
- Kuh D., Hardy R., Butterworth S., Okell L., Richards M., Wadsworth M., et al. (2006). Developmental origins of midlife physical performance: evidence from a British birth cohort. Am. J. Epidemiol. 164, 110–121. 10.1093/aje/kwj193 [DOI] [PubMed] [Google Scholar]
- Kuh D., Karunananthan S., Bergman H., Cooper R. (2014). A life-course approach to healthy ageing: maintaining physical capability. Proc. Nutr. Soc. 73, 237–248. 10.1017/S0029665113003923 [DOI] [PMC free article] [PubMed] [Google Scholar]
- Kuh D., Shah I., Richards M., Mishra G., Wadsworth M., Hardy R. (2009b). Do childhood cognitive ability or smoking behaviour explain the influence of lifetime socio-economic conditions on premature adult mortality in a British post war birth cohort? Soc. Sci. Med. 68, 1565–1573. 10.1016/j.socscimed.2009.02.006 [DOI] [PMC free article] [PubMed] [Google Scholar]
- Kuh D., Wong A., Shah I., Moore A., Popham M., Curran P., et al. (2016). The MRC National Survey of Health and Development reaches age 70: maintaining participation at older ages in a birth cohort study. Eur. J. Epidemiol. 31, 1135–1147. 10.1007/s10654-016-0217-8 [DOI] [PMC free article] [PubMed] [Google Scholar]
- Li K. Z. H., Bherer L., Mirelman A., Maidan I., Hausdorff J. M. (2018). Cognitive involvement in balance, gait and dual-tasking in aging: a focused review from a neuroscience of aging perspective. Front. Neurol. 9:913. 10.3389/fneur.2018.00913 [DOI] [PMC free article] [PubMed] [Google Scholar]
- Lutty G. A. (2013). Effects of diabetes on the eye. Investigative ophthalmology & visual science. Invest. Ophthalmol. Vis. Sci. 54:ORSF81-7. 10.1167/iovs.13-12979 [DOI] [PMC free article] [PubMed] [Google Scholar]
- Mackey D. C., Robinovitch S. N. (2005). Postural steadiness during quiet stance does not associate with ability to recover balance in older women. Clin. Biomech. 20, 776–783. 10.1016/j.clinbiomech.2005.05.002 [DOI] [PubMed] [Google Scholar]
- Maki B. E., Holliday P. J., Fernie G. R. (1990). Aging and postural control. A comparison of spontaneous and induced sway balance tests. JAGS 38, 1–9. 10.1111/j.1532-5415.1990.tb01588.x [DOI] [PubMed] [Google Scholar]
- Merla J. L., Spaulding S. J. (1997). The balance system. Phys. Occup. Ther. Geriatr. 15, 21–36. 10.1300/J148v15n01_02 [DOI] [Google Scholar]
- Michikawa T., Nishiwaki Y., Takebayashi T., Toyama Y. (2009). One-leg standing test for elderly populations. J. Orthop. Sci. 14, 675–685. 10.1007/s00776-009-1371-6 [DOI] [PubMed] [Google Scholar]
- Miller A. E., MacDougall J. D., Tarnopolsky M. A., Sale D. G. (1993). Gender differences in strength and muscle fiber characteristics. Eur. J. Appl. Physiol. Occup. Physiol. 66, 254–262. 10.1007/BF00235103 [DOI] [PubMed] [Google Scholar]
- Muir S. W., Berg K., Chesworth B., Klar N., Speechley M. (2010). Quantifying the magnitude of risk for balance impairment on falls in community-dwelling older adults: a systematic review and meta-analysis. J. Clin. Epidemiol. 63, 389–406. 10.1016/j.jclinepi.2009.06.010 [DOI] [PubMed] [Google Scholar]
- Mulla U. Z., Cooper R., Mishra G. D., Kuh D., Stephen A. M. (2013). Adult macronutrient intake and physical capability in the MRC National Survey of Health and Development. Age Ageing. 42, 81–87. 10.1093/ageing/afs101 [DOI] [PMC free article] [PubMed] [Google Scholar]
- Murray E. T., Ben-Shlomo Y., Tilling K., Southall H., Aucott P., Kuh D., et al. (2013). Area deprivation across the life course and physical capability in midlife: findings from the 1946 British Birth cohort. Am. J. Epidemiol. 178, 441–450. 10.1093/aje/kwt003 [DOI] [PMC free article] [PubMed] [Google Scholar]
- Nitz J. C., Choy N. L., Ogilvie M. (2005). The effect of depression on balance decline in mature women. Hong Kong Physiother. J. 23, 27–35. 10.1016/S1013-7025(09)70056-9 [DOI] [Google Scholar]
- Nofuji Y., Shinkai S., Taniguchi Y., Amano H., Nishi M., Murayama H., et al. (2016). Associations of walking speed, grip strength, and standing balance with total and cause-specific mortality in a general population of Japanese elders. J. Am. Med. Dir. Assoc. 17, 184.e1–7. 10.1016/j.jamda.2015.11.003 [DOI] [PubMed] [Google Scholar]
- North T. L., Palmer T. M., Lewis S. J., Cooper R., Power C., Pattie A., et al. (2015). Effect of smoking on physical and cognitive capability in later life: a multicohort study using observational and genetic approaches. BMJ Open 5:e008393. 10.1136/bmjopen-2015-008393 [DOI] [PMC free article] [PubMed] [Google Scholar]
- Olanrewaju O., Kelly S., Cowan A., Brayne C., Lafortune L. (2016). Physical activity in community dwelling older people: a systematic review of reviews of interventions and context. PLoS ONE 11:e0168614. 10.1371/journal.pone.0168614 [DOI] [PMC free article] [PubMed] [Google Scholar]
- Oliveira M. R., Vieira E. R., Gil A. W. O., Fernandes K. B. P., Teixeira D. C., Amorim C. F., et al. (2018). One-legged stance sway of older adults with and without falls. PLoS ONE 13:e0203887. 10.1371/journal.pone.0203887 [DOI] [PMC free article] [PubMed] [Google Scholar]
- Ortega-Pérez de Villar L., Martínez-Olmos F. J., Junqué-Jiménez A., Amer-Cuenca J. J., Martínez-Gramage J., Mercer T., et al. (2018). Test-retest reliability and minimal detectable change scores for the short physical performance battery, one-legged standing test and timed up and go test in patients undergoing hemodialysis. PLoS ONE 13:e0201035. 10.1371/journal.pone.0201035 [DOI] [PMC free article] [PubMed] [Google Scholar]
- Owings T. M., Pavol M. J., Foley K. T., Grabiner M. D. (2000). Measures of postural stability are not predictors of recovery from large postural disturbances in healthy older adults. J. Am. Geriatr. Soc. 48, 42–50. 10.1111/j.1532-5415.2000.tb03027.x [DOI] [PubMed] [Google Scholar]
- Pelletier A. L., Rojas-Roldan L., Coffin J. (2016). Vision loss in older adults. Am. Fam. Physician. 94, 219–226. [PubMed] [Google Scholar]
- Powell K. E., Paluch A. E., Blair S. N. (2011). Physical activity for health: what kind? How much? How intense? On top of what? Ann. Rev. Public Health 32, 349–365. 10.1146/annurev-publhealth-031210-101151 [DOI] [PubMed] [Google Scholar]
- Ryan A., Wallace E., O'Hara P., Smith S. M. (2015). Multimorbidity and functional decline in community-dwelling adults: a systematic review. Health Qual. Life Outcomes. 13:168. 10.1186/s12955-015-0355-9 [DOI] [PMC free article] [PubMed] [Google Scholar]
- Sanchez-Ramirez D. C., van der Leeden M., Knol D. L., van der Esch M., Roorda L. D., Verschueren S., et al. (2013). Association of postural control with muscle strength, proprioception, self-reported knee instability and activity limitations in patients with knee osteoarthritis. J. Rehabil. Med. 45, 192–197. 10.2340/16501977-1087 [DOI] [PubMed] [Google Scholar]
- Schultz A. B., Ashton-Miller J. A., Alexander N. B. (1997). What leads to age and gender differences in balance maintenance and recovery? Muscle Nerve Suppl. 5, S60-4. [DOI] [PubMed] [Google Scholar]
- Schwingshackl L., Schwedhelm C., Hoffmann G., Lampousi A.-M., Knüppel S., Iqbal K., et al. (2017). Food groups and risk of all-cause mortality: a systematic review and meta-analysis of prospective studies. Am. J. Clin. Nutr. 105, 1462–1473. 10.3945/ajcn.117.153148 [DOI] [PubMed] [Google Scholar]
- Seeman T., Chen X. (2002). Risk and protective factors for physical functioning in older adults with and without chronic conditions: MacArthur Studies of Successful Aging. J. Gerontol. B Psychol. Sci. Soc. Sci. 57, S135–S144. 10.1093/geronb/57.3.S135 [DOI] [PubMed] [Google Scholar]
- Springer B. A., Marin R., Cyhan T., Roberts H., Gill N. W. (2007). Normative values for the unipedal stance test with eyes open and closed. J. Geriatr. Phys. Ther. 30, 8–15. 10.1519/00139143-200704000-00003 [DOI] [PubMed] [Google Scholar]
- Stafford M., Black S., Shah I., Hardy R., Pierce M., Richards M., et al. (2013). Using a birth cohort to study ageing: representativeness and response rates in the National Survey of Health and Development. Eur. J. Ageing. 10, 145–157. 10.1007/s10433-013-0258-8 [DOI] [PMC free article] [PubMed] [Google Scholar]
- Strand B. H., Cooper R., Hardy R., Kuh D., Guralnik J. (2011a). Lifelong socioeconomic position and physical performance in midlife: results from the British 1946 birth cohort. Eur. J. Epidemiol. 26, 475–483. 10.1007/s10654-011-9562-9 [DOI] [PMC free article] [PubMed] [Google Scholar]
- Strand B. H., Mishra G., Kuh D., Guralnik J. M., Patel K. V. (2011b). Smoking history and physical performance in midlife: results from the British 1946 Birth Cohort. J. Gerontol. A Biol. Sci. Med. Sci. 66A, 142–149. 10.1093/gerona/glq199 [DOI] [PMC free article] [PubMed] [Google Scholar]
- Sugimoto H., Demura S., Nagasawa Y. (2014). Age and gender-related differences in physical functions of the elderly following one-year regular exercise therapy. Health. 6, 792–801. 10.4236/health.2014.68101 [DOI] [Google Scholar]
- Thomas E., Battaglia G., Patti A., Brusa J., Leonardi V., Palma A., et al. (2019). Physical activity programs for balance and fall prevention in elderly: a systematic review. Medicine 98:e16218. 10.1097/MD.0000000000016218 [DOI] [PMC free article] [PubMed] [Google Scholar]
- US Department of Health Human Services (2018). Physical Activity Guidelines for Americans, 2nd Edn. Washington, DC. [Google Scholar]
- Welmer A. K., Kåreholt I., Angleman S., Rydwik E., Fratiglioni L. (2012). Can chronic multimorbidity explain the age-related differences in strength, speed and balance in older adults? Aging Clin. Exp. Res. 24, 480–489. 10.3275/8584 [DOI] [PubMed] [Google Scholar]
- Wolfson L. W. R., Derby C. A., Amerman P., Nashner L. (1994). Gender differences in the balance of healthy elderly as demonstrated by dynamic posturography. J. Gerontol. 49, M160–M167. 10.1093/geronj/49.4.M160 [DOI] [PubMed] [Google Scholar]
- Zunzunegui M. V., Alvarado B. E., Guerra R., Gomez J. F., Ylli A., Guralnik J. M. (2015). The mobility gap between older men and women: the embodiment of gender. Arch. Gerontol. Geriatr. 61, 140–148. 10.1016/j.archger.2015.06.005 [DOI] [PubMed] [Google Scholar]
Associated Data
This section collects any data citations, data availability statements, or supplementary materials included in this article.
Data Availability Statement
The datasets used in this study will not be made publicly available. Access to NSHD data adheres to strict confidentiality guidelines but these data are available to bonafide researchers upon request to the NSHD Data Sharing Committee via a standard application procedure. Further details can be found at http://www.nshd.mrc.ac.uk/data. doi: 10.5522/NSHD/Q101; doi: 10.5522/NSHD/Q102; doi: 10.5522/NSHD/Q103.