Abstract
Background
Icariside II (ICAII) is a flavonoid isolated from herb Epimedium that has been shown to improve erectile function in rats. However, ICAII’s underlying mechanism remains unclear.
Methods
Type 2 diabetes mellitus erectile dysfunction (T2DMED) rats were induced by single intraperitoneal injection of 25 mg/kg streptozotocin (STZ) and fed a high-fat, high-sugar, and high-calorie diet for 8 weeks. In the control and T2DMED groups, rats were administered with normal saline; in the metformin (MET) group, rats were administered with MET at 0.2 g/kg/day; and in the ICAII + MET group, rats were administered with ICA II at 10 mg/kg/day and MET for 0.2 g/kg/day. The deposition of advanced glycation end products (AGEs), expression of receptor for AGEs (RAGEs), reactive oxygen species (ROS), and superoxide dismutase (SOD) activity, and corpus cavernosum smooth muscle cells (CCSMCs) mitochondrial autophagy were measured. We also evaluated the expression of LC3-II/I, Beclin-1, P70S6K, PI3K, AKT, mTOR, phospho-AKT, phospho-mTOR, and phospho-P70S6K.
Results
ICAII and MET can improve erectile function, and decrease the levels of fasting plasma glucose (FPG), hemoglobin A1c (HbA1c), and AGEs in rats with T2DMED. Furthermore, ICAII and MET can decrease excessive CCSMC mitochondrial autophagy and the level of RAGE and oxidant stress in rats with T2DMED. ICAII and MET may enhance signaling via the PI3K-AKT-mTOR pathway in order to reduce the excessive mitochondrial autophagy of CCSMCs.
Conclusions
ICAII may effectively improve penile erectile function via decreasing excessive CCSMCs mitochondrial autophagy, RAGE, and oxidant stress. Furthermore, ICAII may enhance signaling via the PI3K-AKT-mTOR pathway in order to reduce excessive CCSMC mitochondrial autophagy.
Keywords: Advanced glycation end products (AGEs), icariside II (ICAII), mitochondrial autophagy, oxidative stress, type 2 diabetes mellitus erectile dysfunction (T2DMED)
Introduction
Type 2 diabetic mellitus (T2DM) is a metabolic disease syndrome associated with hyperglycemia, and is characterized by defects in insulin secretion and/or cellular insulin resistance (IR) (1). T2DM accounts for 90–95% of diabetic mellitus (DM) cases; DM is a chronic disease with long-term complications that can seriously affect patients’ quality of life. T2DM erectile dysfunction (T2DMED) is a common complication of T2DM (1,2). The pathogenesis of T2DMED may be related to metabolic disorders, microvascular disease, and cavernosal fibrosis (3,4). Advanced glycation end products (AGEs), the final products of nonenzymatic glycation and the oxidation of proteins, are found in the plasma and accumulate in the tissues at an accelerated rate in T2DM patients (2,5). The receptor for AGE (RAGE) is an integral membrane protein that forms a central part of the cell surface binding site for AGEs; in T2DM, the insulin receptors do not work properly (2,3). Oxidative stress plays an important role in the pathogenesis of T2DM complications (5,6). Moreover, a chronic state of hyperglycemia in patients with T2DM can increase the oxidative stress level, which in turn can generate a vicious cycle of reactive oxygen species (ROS) generation (3,5). Superoxide dismutase (SOD) plays a key role in detoxifying superoxide free radicals by catalyzing the conversion of superoxide to molecular oxygen and hydrogen peroxide in vivo (3,7). Previous studies have involved administrating T2DM patients with antioxidants to improve vascular endothelial function, which indicates that oxidative stress plays a crucial role in T2DM vascular complications (5,6).
Mitochondria are double-membrane-bound organelles present in most eukaryotic organisms, and ROS are generated during mitochondrial oxidative metabolism (7,8). Autophagy is essential for maintaining mitochondrial function, and mitochondrial autophagy is the adaptive metabolic response that is necessary to prevent increased ROS production and cell death (7).
Epimedium is a commonly used ingredient in nourishing prescriptions in traditional Chinese medicine (8). Icariside II (ICAII) is considered to be the main active monomeric component of Epimedium in vivo (8). In the current study, ICAII was naturally extracted from the Epimedium used in the previous study. The current study’s objective was to observe the effect of ICAII and metformin (MET) on penile erectile function, AGEs, RAGE, ROS, SOD, and mitochondrial autophagy in rats with T2DMED. The ICAII mechanism in terms of the protection of penile erectile function and treatment will be discussed.
Methods
Materials
The following materials were used in the current study: blood glucose meter (Roche Diagnostic, Basel, Switzerland), fluorescence b spectrophotometer (Hitachi, Tokyo, Japan), streptozotocin (Sigma Chemical Co., St. Louis, MO, USA), rat insulin enzyme-linked immunosorbent assay (ELISA) kit (Crystal Chem. Inc., USA), AGEs Kit (R&D Systems. Inc., USA), rat RAGE ELISA Kit (R&D Systems. Inc., USA). Apomorphine (APO) (Sigma Chemical Co.). Microtubule-associated protein 1 light chain 3 (LC3), Beclin1, P70S6K, PI3K, AKT, mammalian target of rapamycin (mTOR), phospho-AKT, phospho-mTOR, and phospho-P70S6K antibodies (Cell Signaling Technologies, USA). Type II collagenase kit (Biosharp, USA). Dulbecco’s modified Eagles medium (Thermo Fisher Scientific, USA), fetal bovine serum (Thermo Fisher Scientific, USA), M100, and NIBP multi-electric physiography (Biopac System, USA).
Animals and study design
All experimental protocols were approved by the Institutional Animal Care and Use Committee in Capital Medical University (Beijing, China). Male Wistar rats [SCXK (jing)2014-0010] were obtained from the Animal Breeding Center at the Capital Medical University Health Science Center. After 1-week of adaptive rearing, 150 healthy 8-week-old male Wistar rats were screened out with normal sexual function by fasting plasma glucose (FPG), tail artery pressure (TAP), APO, and mating experiments. Sixteen rats were randomly divided into the control group. T2DM was induced the other rats with a single intraperitoneal injection of 25 mg/kg STZ (Sigma Chemical Co. St. Louis, MO, USA), which was combined with a high-fat, high-sugar, and high-calorie diet. The total body weight, TAP, and FPG were determined every week throughout the study period. After 8 weeks, tail vein blood was taken to measure the level of FPG, hemoglobin A1c (HbA1c), and fasting serum insulin (FINS). The insulin sensitivity index (ISI) was calculated as Ln[1/(FPG × FINS)]. A homeostasis model assessment was used to calculate the insulin resistance index (IRI) = FINS × FPG/22.5. Rats with FPG >16.7 mmol/L, HbA1c >12%, and ISI reduction were confirmed as T2DM rats. The T2DMED rats were chosen for TAP, APO tests, and mating experiments, and were randomly divided into three groups, the T2DMED group, ICAII + MET group, and MET group, with 16 rats in each group. Four groups were fed under the same conditions. In the MET group, MET was administered by gastric irrigation at a dose of 0.2 g/kg/day for 12 weeks. In the ICAII + MET group, based on the MET group treatment method, ICAII was administered by gastric irrigation at a dose of 10 mg/kg for 12 weeks, followed by a one-week washout period without ICAII and MET. Penile erectile function was evaluated by measuring the intracorneal pressure (ICP) and mean arterial pressure (MAP). After 12 weeks of gastric lavage and a 1-week washout period without ICAII and MET, the corresponding indicators were measured in each group.
The Biopac non-invasive blood pressure measurement system was used to measure the TAP when the rats were in a quiet and awake state. The rats were placed in a quiet dark inspection box for 10 minutes, and the backs of their necks were injected with 80 µg/kg APO. We immediately observed and recorded the penile erection, penile erection times, APO penile erectile animal number, APO average erection frequency, and APO erection rate over a 30-minute period. Penile erection was considered as when the glans penis had obvious hyperemia and the end of the corpus penis had an obvious erection; otherwise it was considered to be erectile dysfunction (ED). We also observed mating with female peers and recorded the number of mating animals. The male rats that failed to mate with different female rats more than 3 times were considered to have ED. The rats were anesthetized with intraperitoneal sodium pentobarbital (50 mg/kg), and each rat’s corpus cavernosum was separated and exposed for electrostimulation (3 V, 12 Hz, duration 60 s, and interval time of 30 minutes). The change in penile cavernous pressure (ICP), mean arterial blood pressure (MAP), baseline ICP, maximal ICP, maximal ICP/MAP, and area under ICP-curve (AUC) was recorded. To rule out the influence of cavernosum intra-arterial pressure on the evaluation of erectile function, the ICP/MAP was used to evaluate erectile function. A Biopac multi-purpose polygraph (Biopac, Santa Barbara, CA, USA) was used to evaluate erectile function, and an ICP/MAP lower than 0.45 was identified as ED. The rats’ glucose metabolism and erectile function were comprehensively measured by FPG, HbA1c, ISI, IRI, TAP, APO, mating experiments, TAP, and CP/MAP.
The corpus cavernosum tissue specimens and blood samples were obtained from the rat model in each group. The level of AGEs, RAGE, ROS, and SOD was measured with the corresponding kits according to the manufacturer’s protocols. Corpus cavernosum smooth muscle cells (CCSMCs) were cultured and purified from penis tissue, and the level of autophagy was determined using transmission electron microscopy (TEM), monodansylcadaverine (MDC) staining and the GFP-LC3 transfection method. Western blot was used to measure the protein expression of LC3-II/I, Beclin-1, P70S6K, PI3K, AKT, mTOR, phospho-AKT, phospho-mTOR, and phospho-P70S6K. Real-time PCR was used to measure the mRNA expression of LC3-II/I, Beclin-1, P70S6K, PI3K, AKT, and mTOR.
Primary culture of CCSMCs and assessment of autophagy
The CCSMCs were cultured by the enzyme digestion differential adherence method. Flow cytometry was used to detect cell purity; vimentin (primary only) was a negative control, while α-SM-actin, myosin, and desmin were positive controls. The average positive rate of the three antibodies provided the purity of CCSMCs. The cells’ proliferative capacity was investigated via the cell growth curve using the MTT method. The optical density (OD) value was measured by a microplate reader (Bio-Rad, Hercules, CA, USA). The growth curve was constructed according to the OD value, and the TEM was used to observe the level of CCSMC mitochondrial autophagy. Ten fields of view were randomly selected (Nikon Eclipse 80i), and images were taken with the NIS-Elements BR software. Image-Pro Plus 6.0 software was used to quantify the autophagosome area in the mitochondria of CCSMCs, and MDC staining was used to observe autophagy. Fluorescence microscopy was used to observe autophagosomes. Moreover, CCSMCs were transfected with GFP-LC3 plasmids, and fluorescence microscopy was used to observe GFP-LC3 spot aggregation.
Western blot analysis
The CCSMCs were lysed in radio immunoprecipitation assay (RIPA) lysis buffer containing a protease and phosphatase inhibitor cocktail. The soluble lysate was mixed with 5× loading buffer and boiled for 10 minutes. The cell lysates, containing 20 µg of protein, were electrophoresed by sodium dodecyl sulfate polyacrylamide gel electrophoresis and transferred to a polyvinylidene fluoride membrane. After blocking with 5% skimmed milk for 1 h at room temperature and incubating overnight at 4 °C with primary antibodies against LC3, Beclin1, P70S6K, PI3K, AKT, mTOR, phospho-AKT, phospho-mTOR, and phospho-P70S6K, the membrane was immersed in HRP-conjugated secondary antibody, followed by chemiluminescence detection using a chemiluminescence-compatible digital imaging system. The integrated density value of each protein band from the Western blot images was analyzed with ImageJ software (version 1.46r, ImageJ, NIH, Bethesda, MD, USA).
RNA isolation and real-time PCR
The LC3-II/I, Beclin-1, phospho-PI3K, phospho-AKT, phospho-mTOR, PI3K, AKT, and mTOR primers were designed and synthesized, according to the National Center for Biotechnology Information (NCBI) gene database, using the cDNA sequences of LC3-II/I, Beclin-1, phospho-PI3K, phospho-AKT, phospho-mTOR, PI3K, AKT, mTOR, and GAPDH, which have been reported in the NCBI gene database. The primers were designed with primer analysis software (Oligo 6.71) and synthesized by Shanghai Bioengineering Co., Ltd. The GAPDH gene sequence: 5'-CATTCTTCCACCTTTGAT-3', reverse: 5'-CTGTAGCCATATTCATTGT-3'. The Beclin1 gene sequence: forward: 5'-TGAGATGAGATGCTTGTG-3', reverse: 5'-TAGAAGTGAGGACAGAGTTA-3'. The mTOR gene sequence: forward: 5'-AAGAAGGTCACTGAGGAT-3', reverse: 5'-AAGGAGATAGAACGGAAGA-3'. The LC3-II/I gene sequence: forward: 5'-CTATGAACAGGAGAAGGATGAAG-3', and reverse: 5'-ACTCAGAAGCCGAAGGTT-3'. The P70S6K gene sequence: forward: 5'-CCTGCGTATGAATCTATGA-3', and reverse: 5'-GGTAATGACACTGACTCTT-3'. Subsequently, LC3-II/I, Beclin-1, P70S6K, PI3K, AKT, and mTOR were detected by real-time PCR. The total RNA was extracted with an RNAqueous-4PCR kit (Ambion Inc., Austin, TX, USA) according to the manufacturer’s instructions. The relative target mRNA expression was quantified by the TransStart SYBR Green qPCR SuperMix, and was normalized according to the GAPDH expression.
Statistical methods
Data were expressed as mean ± standard deviation. Comparisons between groups were performed by Student’s unpaired t-test and one-way ANOVA. SPSS 22.0 statistical software package (SPSS Inc., Chicago, IL, USA) was used for all statistical analyses, and P<0.05 was considered statistically significant.
Results
Effect of ICAII treatment on penile erectile function in T2DMED rats
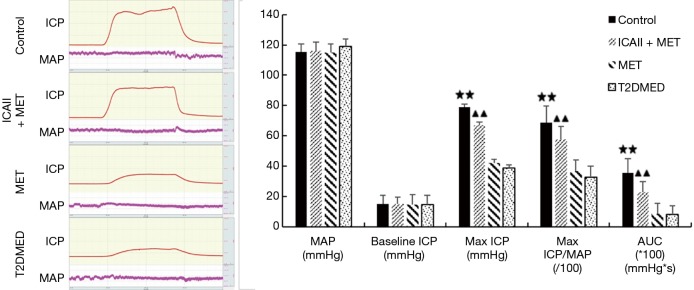
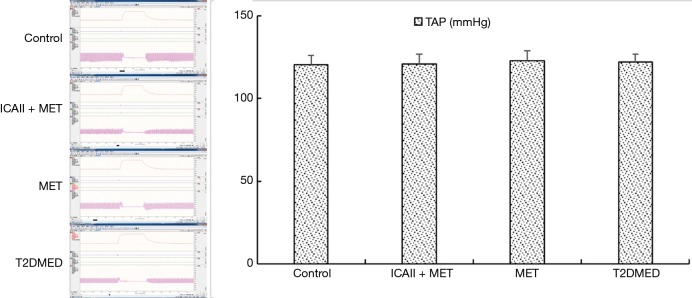
To exclude the impact of intra-group and inter-group differences, erectile function was evaluated by mating experiment, APO, TAP, MAP, ICP, and ICP/MAP. The rats were randomly divided into a control group, ICAII + MET group, MET group, and T2DMED group. There was no statistical difference in TAP, MAP, and baseline ICP values among the four groups (P>0.05). Furthermore, there was no statistical difference in the number of mating rats, number of erectile rats, erection frequency, erection rate, maximal ICP, maximal ICP/MAP, and area under the curve (AUC) values between the MET group and the T2DMED group (P>0.05). The number of mating rats, number of erectile rats, erection frequency, erection rate, maximal ICP, maximal ICP/MAP, and AUC values in the ICAII + MET group and the control group was higher than those in the T2DMED group (P<0.01). In addition, ICAII could improve penile erectile function in T2DMED rats, with no obvious effect on MAP (Figures 1-3).
Figure 1.
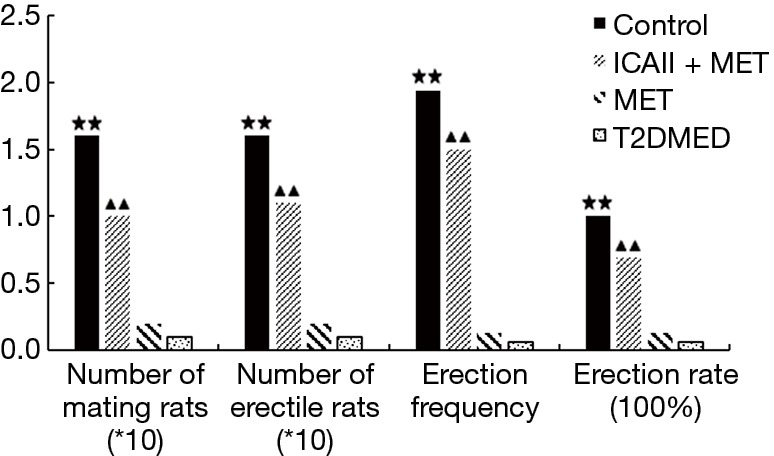
ICAII could improve penile erectile function in T2DMED rats, with no obvious effect on MAP. Comparison of the number of mating rats, number of erectile rats, erection frequency, and erection rate between the control group, ICAII + MET group, MET group, and the T2DMED group (). ★★, P<0.01, control group vs. T2DMED group; ▲▲, P<0.01, ICAII + MET group vs. T2DMED group. MAP, arterial blood pressure; ICAII, icariside II; MET, metformin; T2DMED, type 2 diabetes mellitus erectile dysfunction.
Figure 2.
Comparison of the ICP/MAP experimental of control group, ICAII + MET group, MET group, and T2DMED group (, n=16). ★★, P<0.01, control group vs. T2DMED group; ▲▲, P<0.01, ICAII + MET group vs. T2DMED group. AUC, area under the curve; ICP, intracorneal pressure; MAP, mean arterial pressure; ICAII, icariside II; MET, metformin; T2DMED, type 2 diabetes mellitus erectile dysfunction.
Figure 3.
Comparison of the TAP experiment between the control group, ICAII + MET group, MET group, and T2DMED group (, n=16). TAP, tail artery pressure; ICAII, icariside II; MET, metformin; T2DMED, type 2 diabetes mellitus erectile dysfunction.
Effect of ICAII treatment on FPG, HbA1c, and AGEs in T2DMED rats
The FPG and HbA1c in the MET group, ICAII + MET group, and the control group were significantly lower than those in the T2DMED group after experimental intervention (P<0.01). Moreover, there was no statistical difference in FPG and HbA1c among the MET group, ICAII + MET group, and the control group (P>0.05). The AGE values in the control group were significantly lower than those in the T2DMED group after experimental intervention (P<0.05). The AGE values in the ICAII + MET group and the MET group were slightly lower than those in the T2DMED group (P<0.05), while there was no statistical difference in AGE values between the MET group and the ICAII + MET group after experimental intervention (P>0.05). We found that ICA II + MET could improve glucose metabolism by decreasing the absolute values of FPG, HbA1c, and AGEs in rats with T2DMED (Figure 4).
Figure 4.
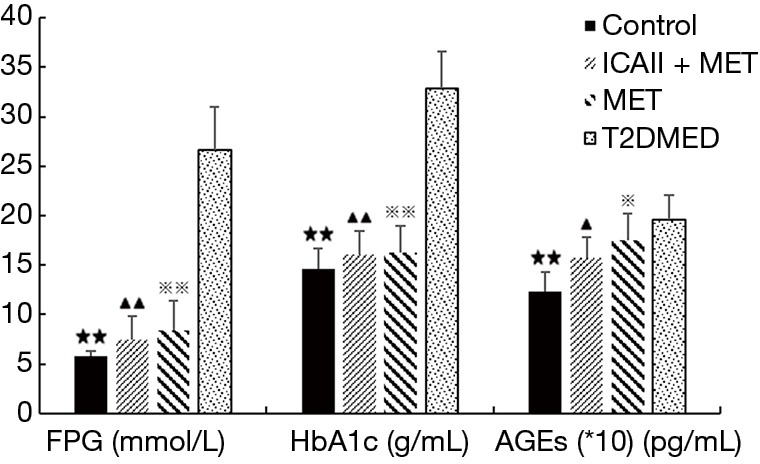
ICAII + MET could improve glucose metabolism by decreasing the absolute values of FPG, HbA1c, and AGEs in rats with T2DMED. Comparison of the FPG, HbA1c, and AGEs between the control group, ICAII + MET group, MET group, and the T2DMED group (, n=16). ★★, P<0.01, control group vs. T2DMED group; ▲, P<0.05; ▲▲, P<0.01, ICAII + MET group vs. T2DMED group; ※, P<0.05; ※※, P<0.01, MET group vs. T2DMED group. ICAII, icariside II; MET, metformin; T2DMED, type 2 diabetes mellitus erectile dysfunction; FPG, fasting plasma glucose; HbA1c, hemoglobin A1c; AGEs, advanced glycation end products.
Effect of ICAII treatment on RAGE, SOD, and RAGE in T2DMED rats
After experimental intervention, the control group’s RAGE values were significantly lower than those of the T2DMED group (P<0.01). After experimental intervention, the ICAII + MET group’s RAGE values were slightly lower than those of the T2DMED group (P<0.05). After experimental intervention, there was no significant difference in RAGE values between the MET group and the T2DMED group (P>0.05). Before experimental intervention, the SOD values of the control group and the ICAII + MET group were significantly higher than those of the T2DMED group (P<0.01). Furthermore, the MET group’s SOD values were slightly higher than those of the T2DMED group (P<0.05). After experimental intervention, the SOD values of the control group, and the ICAII + MET group were significantly lower than those in the T2DMED group (P<0.01). There was no significant difference in SOD values between the MET group and the T2DMED group (P>0.05). It was found that ICAII + MET could improve oxidative stress by decreasing the RAGE and ROS values, and increasing the SOD values, in rats with T2DMED (Figure 5).
Figure 5.
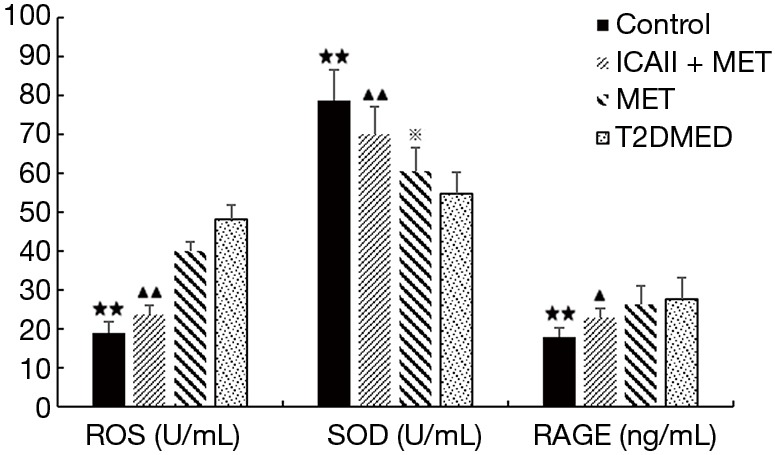
ICAII + MET could improve oxidative stress by decreasing the RAGE and ROS values, and increasing the SOD values, in rats with T2DMED. Comparison of the RAGE, ROS, and SOD values between the control group, MET group, T2DMED group, and ICAII + MET group (, n=16). ★★, P<0.01, control group vs. T2DMED group; ▲, P<0.05; ▲▲, P<0.01, ICAII + MET group vs. T2DMED group; ※, P<0.05, MET group vs. T2DMED group. ICAII, icariside II; MET, metformin; T2DMED, type 2 diabetes mellitus erectile dysfunction; ROS, reactive oxygen species; SOD, superoxide dismutase; RAGE, receptor for advanced glycation end products.
Primary culture, purification, identification, and purity analysis of CCSMCs and MTT growth curve assay
CCSMCs were cultured using an enzyme digestion velocity sedimentation method. Flow cytometry showed that the CCSMCs’ purity was approximately 97%. The survival rate of CCSMCs in the control group and the ICAII + MET group was slightly higher than in the T2DMED group (P<0.05). However, there was no significant difference in survival rates between the MET group and the T2DMED group (P>0.05). The number of CCSMCs in the control group and the ICAII + MET group was slightly higher than that in the T2DMED group on the 5th to 8th day (P<0.05). However, there was no significant difference in the number of CCSMCs between the MET group and the T2DMED group (P>0.05) (Figure 6).
Figure 6.
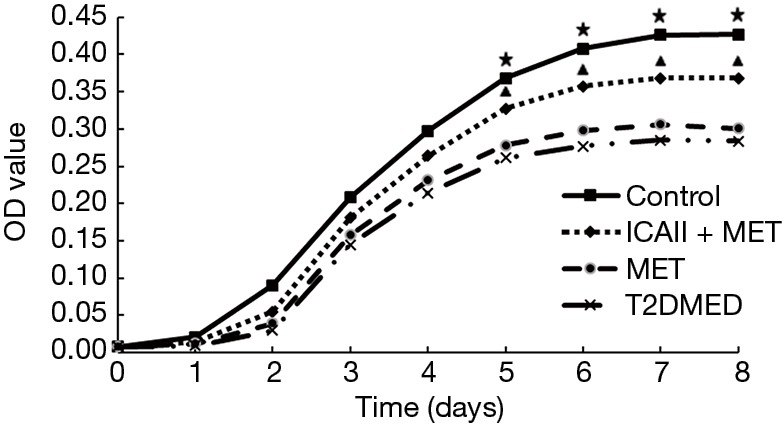
Comparison of the MTT growth curves between the CCSMCs in the control group, MET group, T2DMED group, and ICAII + MET group (, n=16). ★, P<0.05, control group vs. T2DMED group; ▲, P<0.05, ICAII + MET group vs. T2DMED group. OD, optical density; ICAII, icariside II; MET, metformin; T2DMED, type 2 diabetes mellitus erectile dysfunction; CCSMCs, corpus cavernosum smooth muscle cells.
Effect of ICAII treatment on mitochondrial autophagy of CCSMCs in T2DMED rats
The number of mitochondrial autophagosomes of the CCSMCs in the control group and the ICAII + MET group was significantly lower than that in the T2DMED group (P<0.01). After experimental intervention, there was no significant difference in the number of mitochondrial autophagosomes of the CCSMCs between the MET group and the T2DMED group (P>0.05). It was found that ICAII and MET could improve mitochondrial autophagy in rats with T2DMED (Figure 7).
Figure 7.
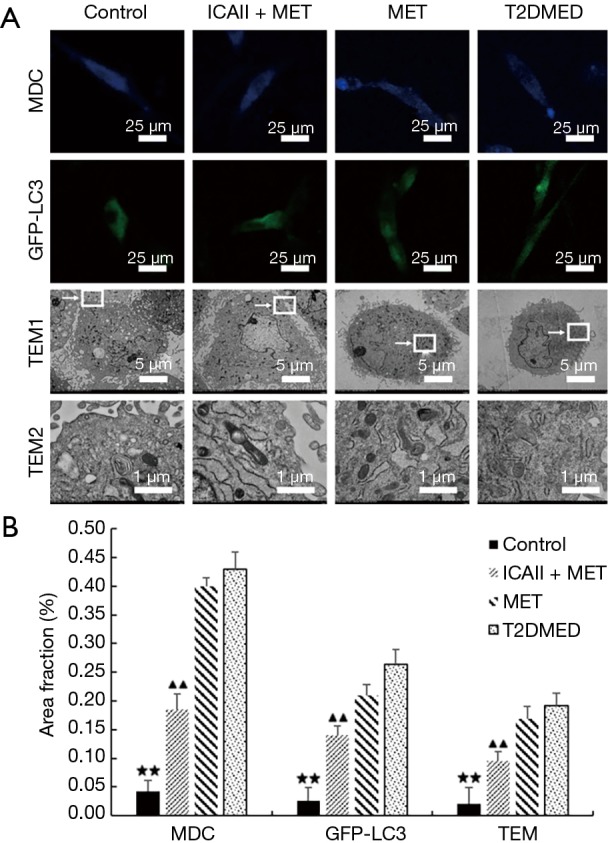
ICAII could improve mitochondrial autophagy in rats with T2DMED. Comparison of the mitochondrial autophagosomes of CCSMCs and the autophagosome/CCSMC area ratio between the control group, ICAII + MET group, MET group, and T2DMED group (, n=16). ★★, P<0.01, control group vs. T2DMED group; ▲▲, P<0.01, ICAII + MET group vs. T2DMED group. MDC, monodansylcadaverine; ICAII, icariside II; MET, metformin; T2DMED, type 2 diabetes mellitus erectile dysfunction; TEM, transmission electron microscopy.
Western blot analysis of LC3-II/I, Beclin-1, P70S6K, PI3K, AKT, mTOR, phospho-AKT, phospho-mTOR, and phospho-P70S6K protein expression in CCSMCs
The protein expression of LC3-II/I and Beclin-1 in the control group and the ICAII + MET group was significantly lower than in the T2DMED group (P<0.01). There was no significant difference in LC3-II/I and Beclin-1 protein expression between the MET group and the T2DMED group (P>0.05). The protein expression of PI3K, AK, mTOR, P70S6K, phospho-AKT, phospho-mTOR, and phospho-P70S6K in the control group and the ICAII + MET group was significantly higher than in T2DMED group (P<0.01). There was no significant difference in the protein expression of PI3K, AKT, mTOR, P70S6K, phospho-AKT, phospho-mTOR, and phospho-P70S6K between the control group and the ICAII + MET group (P>0.05). Furthermore, there was no significant difference in the protein expression of PI3K, AKT, mTOR, P70S6K, phospho-AKT, phospho-mTOR, and phospho-P70S6K between the MET group and the T2DMED group (P>0.05). In addition, we found that ICAII + MET could enhance the PI3K-AKT-mTOR signaling pathway and reduce the CCSMCs’ excessive autophagy by decreasing the expression of LC3-II/I and Beclin-1, and increasing the phosphorylation of AKT and mTOR (Figures 8,9).
Figure 8.
ICAII could reduce the CCSMCs’ excessive autophagy. Comparison of autophagy related protein expression between the control group, ICAII + MET group, MET group, and T2DMED group. (, n=16). ★★, P<0.01, control group vs. T2DMED group; ▲▲, P<0.01, ICAII + MET group vs. T2DMED group. ICAII, icariside II; MET, metformin; T2DMED, type 2 diabetes mellitus erectile dysfunction; CCSMCs, corpus cavernosum smooth muscle cells.
Figure 9.
ICAII could enhance the PI3K-AKT-mTOR signaling pathway. Comparison of PI3K-AKT-mTOR signaling pathway related protein expression between the control group, ICAII + MET group, MET group, and T2DMED group (, n=16). ★★, P<0.01, control group vs. the T2DMED group; ▲▲, P<0.01, ICAII + MET group vs. T2DMED group. ICAII, icariside II; MET, metformin; T2DMED, type 2 diabetes mellitus erectile dysfunction; mTOR, mammalian target of rapamycin.
Real-time PCR analysis of LC3-II/I, Beclin-1, P70S6K, PI3K, AKT, and mTOR mRNA expression in CCSMCs
The mRNA expression of LC3-II/I and Beclin-1 in the control group and the ICAII + MET group was significantly lower than that in the T2DMED group (P<0.01). There was no significant difference in mRNA expression of LC3-II/I and Beclin-1 between the MET group and the T2DMED group (P>0.05). In addition, the mRNA expression of PI3K, AKT, mTOR, and P70S6K in the control group and the ICAII + MET group was significantly higher than in the T2DMED group (P<0.01). There was no significant difference in mRNA expression of LC3-II/I, Beclin-1, PI3K, AKT, mTOR, and P70S6K between the control group and the ICAII + MET group (P>0.05). Moreover, there was no significant difference in the mRNA expression of LC3-II/I, Beclin-1, PI3K, AKT, mTOR, and P70S6K between the MET group and the T2DMED group (P>0.05). We demonstrated that ICAII + MET could enhance the PI3K-AKT-mTOR signaling pathway and reduce CCSMCs’ excessive autophagy by decreasing the expression of LC3-II/I and Beclin-1 and increasing the phosphorylation of AKT and mTOR (Figures 10,11).
Figure 10.
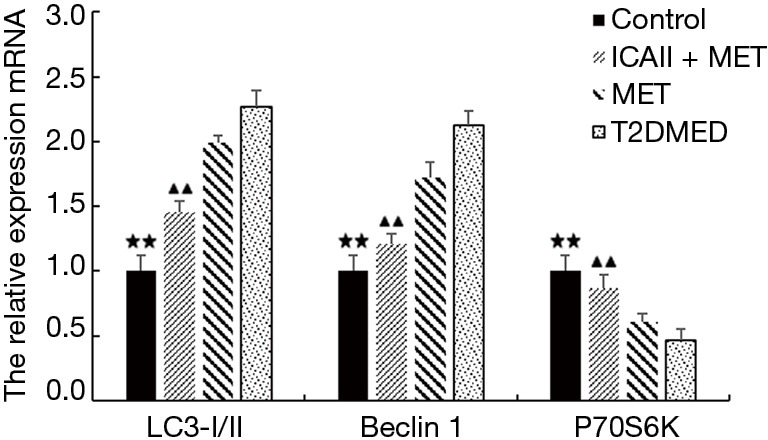
Comparison of autophagy related mRNA expression between the control group, ICAII + MET group, MET group, and T2DMED group (, n=16). ★★, P<0.01, control group vs. T2DMED group; ▲▲, P<0.01, ICAII + MET group vs. T2DMED group. ICAII, icariside II; MET, metformin; T2DMED, type 2 diabetes mellitus erectile dysfunction.
Figure 11.
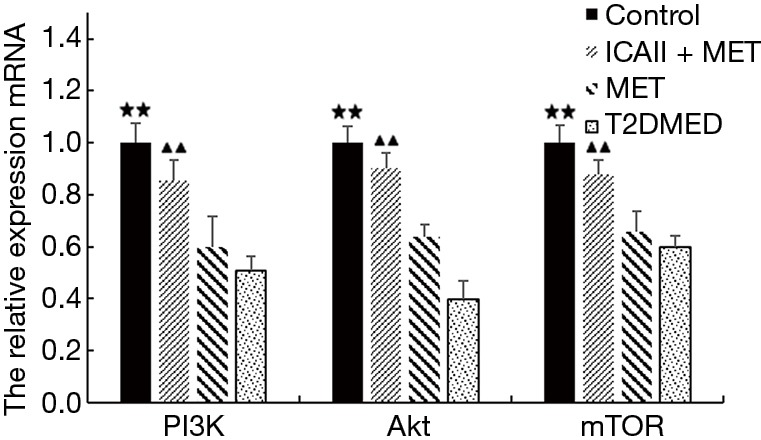
Comparison of the PI3K-AKT-mTOR signaling pathway related mRNA expression between the control group, ICAII + MET group, MET group, and T2DMED group (, n=16). ★★, P<0.01, control group vs. T2DMED group; ▲▲, P<0.01, ICAII + MET group vs. T2DMED group. ICAII, icariside II; MET, metformin; T2DMED, type 2 diabetes mellitus erectile dysfunction; mTOR, mammalian target of rapamycin.
Discussion
Noncommunicable chronic diseases are the primary causes of mortality and disease burden worldwide (1,2). DM’s prevalence has significantly increased with the development of social economy, an aging society, and the changing lifestyle in humans over recent years (1). FPG is a commonly used clinical item for DM, which reflects the function of pancreatic β cells and instant plasma glucose level, and generally represents the function of basal insulin secrete (4,5). HbA1c is a relatively stable component of the chromatographic separation of hemoglobin, and the N-terminal Z-proline amino group of the β-chain is linked to glucose (4). HbA1c accounts for approximately 60–70% of glycated hemoglobin, which is closely correlated to the clinical manifestation of T2DM (9,10). The HbA1c measurement is significant when evaluating the average level of glycemic excursion at 2 months (4). Moreover, the American Diabetes Association integrated HbA1c into the diagnostic criteria for diabetes. Insulin is the protein hormone secreted by pancreatic β cells, the main function of which is to maintain the balance of glucose in vivo by regulating the absorption and metabolism of glucose in the peripheral tissue, as well as the production and storage of hepatic glycogen (11,12). TAP and ICP/MAP assays are considered objective, accurate parameters for penile erection assessment (8). By electrically stimulating the cavernous erectile nerve or pelvic stellate ganglion, objective data and scanned images can be used to monitor changes in the MAP and ICP (8,13). APO is a dopamine receptor agonist that can lead to penile erection through dopamine receptors in the hypothalamic paraventricular nucleus. Mating and APO screening experiments can be used as a non-invasive means of evaluating penile erection function (13). T2DM’s main pathophysiological bases are defects in insulin action, insulin secretion, and IR. ED is a persistent inability to achieve an erection sufficient for satisfactory sexual performance (14). In the current study, the T2DM rats were fed a high-fat, high-sugar, and high-calorie diet for 20 weeks and administered a single intraperitoneal injection of 25 mg/kg STZ. T2DMED rats were selected from the T2DM rats by mating and APO screening experiments. In the current study, the number of mating animals, APO erection rate, APO average erection frequency, APO penile erectile animal number, maximal ICP, maximal ICP/MAP, and the AUC values were compared. The above data in the ICAII + MET and control groups were significantly higher than in the T2DMED group. Furthermore, it was found that ICAII could effectively improve penile erectile function in T2DMED rats, with no obvious effect on MAP.
AGEs are the final products of nonenzymatic glycation and oxidation of proteins (2,3). AGEs can be found in the plasma and accumulate in the tissues in diabetes. RAGE is integral membrane protein that forms a central part of the cell surface binding site for AGEs. AGEs can induce RAGE overexpression in a hyperglycemia state (3,4). The high expression of RAGE combined with AGEs is the main pathophysiological of microangiopathy in T2DMED (15). HbA1c is hemoglobin with glucose attached, and a high level of HbA1c indicates poor blood glucose control in T2DMED patients; it also reflects hypercoagulability and vascular endothelial cell damage (14). Furthermore, a long-term hyperglycemic state can accelerate HbA1c formation in T2DM patients (2,4). HbA1c can participate in the process of oxidative stress in vivo, causing damage to the blood vessel wall (4). There is a high concentration of AGEs under conditions of oxidative stress or hyperglycemia (2). The AGEs-RAGE pathway plays an important role in promoting diabetic complications (16,17). AGEs can reduce calcium ion release and blood flow by interfering with ion channels, gap junctions, and ion receptors, consequently impairing the CCSMC relaxation mechanism. AGEs can interact with the endothelial extracellular matrix, promote the cross-linkage damage of collagen, and lead to capillary basement thickening (16,18). The current study found that ICA II + MET could improve glucose metabolism by decreasing the absolute value of FPG, HbA1c, and AGEs in rats with T2DMED.
Oxidative stress refers to the imbalance, resulting from excess ROS, over the cell’s ability to mount an effective antioxidant response (3,6). ROS is a metabolite, produced by mitochondria, that underlies oxidative damage in many pathologies (5). Excessive ROS can cause oxidative damage to proteins, mitochondrial membrane lipids, and nucleic acids, as well as lead to mitochondrial dysfunction (3,6,19). SOD is known to be an effective antioxidant for treating oxidative stress damage in a wide variety of tissues by inhibiting lipid peroxidation by scavenging superoxide anion radicals produced in vivo (20). Mitochondria are long-elliptical, highly folded bilayer membrane organelles in cells that are the main sites for aerobic respiration of eukaryotic cells and provide energy to cells by oxidative phosphorylation (19). The AGEs-RAGE pathway can induce oxidative stress to promote cell damage, and mitochondria can be injured by oxidative stress when the ROS’ concentrations are high (3,19). The current study found that ICAII + MET could improve oxidative stress by decreasing RAGE and ROS, and increasing SOD in rats with T2DMED.
CCSMCs of T2DMED rats with high purity and stable biological characteristics were cultured by an enzyme digestion differential adherence method (8,20). α-SM-actin is a microfilament protein with contractile function in CCSMCs. Myosin is the main component of thick muscle, and desmin is an intermediate silk skeleton protein. α-SM-actin, myosin, and desmin are specific to CCSMCs (21). Microscopy, immunohistochemistry, immunofluorescence, and flow cytometry can be used to determine CCSMCs’ purity, while the MTT growth curve can be used to indirectly determine cell viability, cell number, and cell growth. In the current study, the CCSMCs were purified and cultured, and it was found that ICAII combined with MET could improve the penile erectile function in T2DMED rats; this may be related to growth curve improvement and the delayed CCSMCs’ fibrosis.
Autophagy refers to the formation of autophagosomes by partial bilayer membrane structures under the stimulation of factors such as starvation (22). Autophagy is a type of catabolism of cells that is unique to eukaryotic cells, and is an important mechanism for cells to self-digest and maintain internal environment stability (22,23). Under physiological conditions, autophagy is essential for optimal cellular function, and survival by ridding the cell of damaged or unwanted proteins and organelles. Under pathological conditions, autophagy may be stimulated to protect the cell from stress stimuli or, alternatively, to contribute to cell death (22,23). Thus, appropriate autophagy regulation can be a matter of life or death. In 1962, the autophagosomes and autophagy was observed by TEM (24,25). Mitochondrial autophagy is an adaptive metabolic response that is necessary to prevent increased levels of ROS and cell death.
ROS play an important role in the development of diabetes and its complications by inhibiting mTOR and activating Beclin-1 pathway to activate autophagy (3). Moderate autophagy facilitates the clearance of ROS and damaged organelles (25,26). ROS accumulation will exceed the compensatory limit of autophagy in a high glucose environment (26,27). The mitochondria will rapidly divide into fragments, and autophagic death of the cells is initiated, which further induces excessive ROS production (26,28). The intracellular localization of autophagosomes often provides valuable information. MDC staining is a specific method for detecting autophagosomes by analyzing the molecular level mechanism during autophagy (28,29). The autophagy-associated protein ATG8 is located on the membrane of autophagosomes and can be combined with the fluorescent dye, MDC. The formation of autophagosomes is associated with two ubiquitin-like modifications of autophagy-associated gene 12 (ATG12) and LC3 (29,30). LC3-II is considered an autophagy marker, and the ratio of LC3-II/I is correlated with the degree of autophagy. Expression of GFP-LC3 is widely used to visualize autophagy in cultured cells (24).
mTOR and the gene Beclin1 have a close relationship with autophagy, and can play important roles by regulating autophagic activity in the progression of cells (26,28). The PI3K/Akt/mTOR pathway is a prototypic survival pathway that regulates several normal cellular functions, such as cellular proliferation, growth, survival, and mobility (28). Activation of the PI3K-AKT-mTOR signaling pathway promotes cell death via autophagy suppression, while autophagy can be promoted by inhibiting the mTOR signaling (27). P70S6K initiates intracellular 40S ribosomal S6 protein kinase (S6K) phosphorylation by multi-step complexes formed by multi-step phosphorylation of structural genes and other proteins (28). Phosphorylating S6K can control cell growth by regulating the initiation of translational proteins containing 5TOP mRNA and the translational efficiency of mRNA (28). Beclin-1 is a key autophagy regulator and a marker of autophagy induction (29). Beclin-1 can regulate ATG-encoded proteins through complexing with PI3K, which, in turn, regulates the expression of autophagy precursors to regulate autophagic activity. Mitochondrial autophagy can be induced by overexpression, and the autophagy inhibitor 3-methyladenine (3-MA) can block autophagosome formation through the Beclin-1 pathway (30). In the current study, we demonstrated that ICAII and MET could improve CCSMCs’ excessive mitochondrial autophagy by inhibiting excessive activation of the mitochondrial autophagy signaling pathway, including the down-regulation of Beclin-1 expression and the up-regulation of PI3K, AKT, mTOR, and P70S6K expression.
Autophagy is a double-edged sword in the development of T2DM complications (26,28). Moderate mitochondrial autophagy can reduce cell damage, but excessive mitochondrial autophagy can induce cell damage, and has become the most popular research area for T2DM complications. Improving ISI is a novel idea for studying hypoglycemic drugs. MET regulates FPG by inhibiting hepatic gluconeogenesis, glycogenolysis, and improving ISI. The natural medicine, Epimedium, is a commonly used ingredient in nourishing and strengthening prescriptions in the traditional medical community. ICAII is considered the main active monomeric component of Epimedium in vivo. In the current study, ICAII was naturally extracted from the Epimedium used in the previous study. MET is one of the prescribed hypoglycemic drugs for the first line of treatment of T2DM patients. MET may improve the levels of FPG, HbA1c, and AGEs. ICAII may decrease the excessive mitochondrial autophagy of CCSMCs, the level of RAGE, and oxidant stress to improve the penile erectile function in rats with T2DMED. ICAII may enhance signaling through the PI3K-AKT-mTOR pathway and improve CCSMCs’ excessive mitochondrial autophagy. Moreover, there may be a synergistic relationship between ICAII and MET, which requires further study.
Conclusions
ICAII may effectively improve penile erectile function via decreasing excessive CCSMCs mitochondrial autophagy, RAGE, and oxidant stress. Furthermore, ICAII may enhance signaling via the PI3K-AKT-mTOR pathway in order to reduce excessive CCSMC mitochondrial autophagy.
Supplementary
The article’s supplementary files as
Acknowledgments
Funding: The study was supported by Beijing Municipal Natural Science Foundation (No. 7172110).
Ethical Statement: The authors are accountable for all aspects of the work in ensuring that questions related to the accuracy or integrity of any part of the work are appropriately investigated and resolved. All experimental protocols were approved by the Institutional Animal Care and Use Committee in Capital Medical University (Beijing, China) (No. AEEI-2017-063).
Footnotes
Conflicts of Interest: All authors have completed the ICMJE uniform disclosure form (available at http://dx.doi.org/10.21037/tau.2020.02.07). XL serves as an unpaid editorial board member of Translational Andrology and Urology from May 2020 to Apr 2021. The other authors have no conflicts of interest to declare.
References
- 1.Lagani V, Chiarugi F, Manousos D, et al. Realization of a service for the long-term risk assessment of diabetes-related complications. J Diabetes Complications 2015;29:691-8. 10.1016/j.jdiacomp.2015.03.011 [DOI] [PubMed] [Google Scholar]
- 2.Koska J, Saremi A, Howell S, et al. Advanced Glycation End Products, Oxidation Products, and Incident Cardiovascular Events in Patients With Type 2 Diabetes. Diabetes Care 2018;41:570-6. 10.2337/dc17-1740 [DOI] [PMC free article] [PubMed] [Google Scholar]
- 3.McGarry T, Biniecka M, Veale DJ, et al. Hypoxia, oxidative stress and inflammation. Free Radic Biol Med 2018;125:15-24. 10.1016/j.freeradbiomed.2018.03.042 [DOI] [PubMed] [Google Scholar]
- 4.Parry HM, Deshmukh H, Levin D, et al. Both high and low HbA1c predict incident heart failure in type 2 diabetes mellitus. Circ Heart Fail 2015;8:236-42. 10.1161/CIRCHEARTFAILURE.113.000920 [DOI] [PMC free article] [PubMed] [Google Scholar]
- 5.Giacco F, Brownlee M. Oxidative stress and diabetic complications. Circ Res 2010;107:1058-70. 10.1161/CIRCRESAHA.110.223545 [DOI] [PMC free article] [PubMed] [Google Scholar]
- 6.Diniz BS, Mendes-Silva AP, Silva LB, et al. Oxidative stress markers imbalance in late-life depression. J Psychiatr Res 2018;102:29-33. 10.1016/j.jpsychires.2018.02.023 [DOI] [PubMed] [Google Scholar]
- 7.Sebastián D, Sorianello E, Segales J, et al. Mfn2 deficiency links age-related sarcopenia and impaired autophagy to activation of an adaptive mitophagy pathway. EMBO J 2016;35:1677-93. 10.15252/embj.201593084 [DOI] [PMC free article] [PubMed] [Google Scholar]
- 8.Zhang J, Wang YB, Ma CG, et al. Icarisid II, a PDE5 inhibitor from Epimedium wanshanense, increases cellular cGMP by enhancing NOS in diabetic ED rats corpus cavernosum tissue. Andrologia 2012;44 Suppl 1:87-93. 10.1111/j.1439-0272.2010.01144.x [DOI] [PubMed] [Google Scholar]
- 9.Jaisson S, Pietrement C, Gillery P. Protein Carbamylation: Chemistry, Pathophysiological Involvement, and Biomarkers. Adv Clin Chem 2018;84:1-38. 10.1016/bs.acc.2017.12.001 [DOI] [PubMed] [Google Scholar]
- 10.Heldal TF, Ueland T, Jenssen T, et al. Inflammatory and related biomarkers are associated with post-transplant diabetes mellitus in kidney recipients: a retrospective study. Transpl Int 2018;31:510-9. 10.1111/tri.13116 [DOI] [PubMed] [Google Scholar]
- 11.Fazekas-Lavu M, Tonks KTT, Samaras K. Benchmarks of Diabetes Care in Men Living With Treated HIV-Infection: A Tertiary Center Experience. Front Endocrinol (Lausanne) 2018;9:634. 10.3389/fendo.2018.00634 [DOI] [PMC free article] [PubMed] [Google Scholar]
- 12.Petersen MC, Shulman GI. Mechanisms of Insulin Action and Insulin Resistance. Physiol Rev 2018;98:2133-223. 10.1152/physrev.00063.2017 [DOI] [PMC free article] [PubMed] [Google Scholar]
- 13.Moses R A, Anderson R E, Kim J, et al. Erectile dysfunction management after failed phosphodiesterase5-inhibitor trial: a cost-effectiveness analysis. Transl Androl Urol 2019;8:387-94. 10.21037/tau.2019.03.10 [DOI] [PMC free article] [PubMed] [Google Scholar]
- 14.Lim PH. Asian herbals and aphrodisiacs used for managing ED. Transl Androl Urol 2017;6:167-75. 10.21037/tau.2017.04.04 [DOI] [PMC free article] [PubMed] [Google Scholar]
- 15.Ahmad S, Khan H, Siddiqui Z, et al. AGEs, RAGEs and s-RAGE; friend or foe for cancer. Semin Cancer Biol 2018;49:44-55. 10.1016/j.semcancer.2017.07.001 [DOI] [PubMed] [Google Scholar]
- 16.Qiu YY, Tang LQ, Wei W. Berberine exerts renoprotective effects by regulating the AGEs-RAGE signaling pathway in mesangial cells during diabetic nephropathy. Mol Cell Endocrinol 2017;443:89-105. 10.1016/j.mce.2017.01.009 [DOI] [PubMed] [Google Scholar]
- 17.Palanissami G, Paul SFD. RAGE and Its Ligands: Molecular Interplay Between Glycation, Inflammation, and Hallmarks of Cancer-a Review. Horm Cancer 2018;9:295-325. 10.1007/s12672-018-0342-9 [DOI] [PMC free article] [PubMed] [Google Scholar]
- 18.Ma WQ, Qu QR, Zhao Y, et al. Association of RAGE gene Gly82Ser polymorphism with coronary artery disease and ischemic stroke: A systematic review and meta-analysis. Medicine (Baltimore) 2016;95:e5593. 10.1097/MD.0000000000005593 [DOI] [PMC free article] [PubMed] [Google Scholar]
- 19.Yuan D, Huang S, Berger E, et al. Kupffer Cell-Derived Tnf Triggers Cholangiocellular Tumorigenesis through JNK due to Chronic Mitochondrial Dysfunction and ROS. Cancer Cell 2017;31:771-789.e6. 10.1016/j.ccell.2017.05.006 [DOI] [PMC free article] [PubMed] [Google Scholar]
- 20.Arora D, Bhatla SC. Melatonin and nitric oxide regulate sunflower seedling growth under salt stress accompanying differential expression of Cu/Zn SOD and Mn SOD. Free Radic Biol Med 2017;106:315-28. 10.1016/j.freeradbiomed.2017.02.042 [DOI] [PubMed] [Google Scholar]
- 21.Ouyang X, Han X, Chen Z, et al. MSC-derived exosomes ameliorate erectile dysfunction by alleviation of corpus cavernosum smooth muscle apoptosis in a rat model of cavernous nerve injury. Stem Cell Res Ther 2018;9:246. 10.1186/s13287-018-1003-1 [DOI] [PMC free article] [PubMed] [Google Scholar]
- 22.Clarke AJ, Simon AK. Autophagy in the renewal, differentiation and homeostasis of immune cells. Nat Rev Immunol 2019;19:170-83. 10.1038/s41577-018-0095-2 [DOI] [PubMed] [Google Scholar]
- 23.Zhang J, Li AM, Liu BX, et al. Effect of icarisid II on diabetic rats with erectile dysfunction and its potential mechanism via assessment of AGEs, autophagy, mTOR and the NO-cGMP pathway. Asian J Androl 2013;15:143-8. 10.1038/aja.2011.175 [DOI] [PMC free article] [PubMed] [Google Scholar]
- 24.Denny P, Feuermann M, Hill DP, et al. Exploring autophagy with Gene Ontology. Autophagy 2018;14:419-36. 10.1080/15548627.2017.1415189 [DOI] [PMC free article] [PubMed] [Google Scholar]
- 25.Cadwell K. Crosstalk between autophagy and inflammatory signalling pathways: balancing defence and homeostasis. Nat Rev Immunol 2016;16:661-75. 10.1038/nri.2016.100 [DOI] [PMC free article] [PubMed] [Google Scholar]
- 26.Zhou Z, Mahdi A, Tratsiakovich Y, et al. Erythrocytes From Patients With Type 2 Diabetes Induce Endothelial Dysfunction Via Arginase I. J Am Coll Cardiol 2018;72:769-80. 10.1016/j.jacc.2018.05.052 [DOI] [PubMed] [Google Scholar]
- 27.Zhang G, Wang Z, Du Z, et al. mTOR Regulates Phase Separation of PGL Granules to Modulate Their Autophagic Degradation. Cell 2018;174:1492-1506.e22. 10.1016/j.cell.2018.08.006 [DOI] [PubMed] [Google Scholar]
- 28.Saiki S, Sasazawa Y, Imamichi Y, et al. Caffeine induces apoptosis by enhancement of autophagy via PI3K/Akt/mTOR/p70S6K inhibition. Autophagy 2011;7:176-87. 10.4161/auto.7.2.14074 [DOI] [PMC free article] [PubMed] [Google Scholar]
- 29.Mercer TJ, Gubas A, Tooze SA. A molecular perspective of mammalian autophagosome biogenesis. J Biol Chem 2018;293:5386-95. 10.1074/jbc.R117.810366 [DOI] [PMC free article] [PubMed] [Google Scholar]
- 30.Khuansuwan S, Barnhill LM, Cheng S, et al. A novel transgenic zebrafish line allows for in vivo quantification of autophagic activity in neurons. Autophagy 2019;15:1322-32. 10.1080/15548627.2019.1580511 [DOI] [PMC free article] [PubMed] [Google Scholar]
Associated Data
This section collects any data citations, data availability statements, or supplementary materials included in this article.
Supplementary Materials
The article’s supplementary files as


