

Abstract
Background
The thymus is a highly specialized organ of the immune system where T cell precursors develop and differentiate into self-tolerant CD4+ or CD8+ T cells. No studies to date have investigated how the human transcriptome profiles differ, between T cells still residing in the thymus and T cells in the periphery.
Results
We have performed high-throughput RNA sequencing to characterize the transcriptomes of primary single positive (SP) CD4+ and CD8+ T cells from infant thymic tissue, as well as primary CD4+ and CD8+ T cells from infant and adult peripheral blood, to enable the comparisons across tissues and ages. In addition, we have assessed the expression of candidate genes related to autoimmune diseases in thymic CD4+ and CD8+ T cells. The thymic T cells showed the largest number of uniquely expressed genes, suggesting a more diverse transcription in thymic T cells. Comparing T cells of thymic and blood origin, revealed more differentially expressed genes, than between infant and adult blood. Functional enrichment analysis revealed an over-representation of genes involved in cell cycle and replication in thymic T cells, whereas infant blood T cells were dominated by immune related terms. Comparing adult and infant blood T cells, the former was enriched for inflammatory response, cytokine production and biological adhesion, while upregulated genes in infant blood T cells were associated with cell cycle, cell death and gene expression.
Conclusion
This study provides valuable insight into the transcriptomes of the human primary SP T cells still residing within the thymus, and offers a unique comparison to primary blood derived T cells. Interestingly, the majority of autoimmune disease associated genes were expressed in one or more T cell subset, however ~ 11% of these were not expressed in frequently studied adult peripheral blood.
Keywords: RNA-seq, Transcriptome, Human, Thymus, T cells
Background
The thymus is a highly specialized organ of the immune system, where T cell precursors develop and differentiate into self-tolerant single positive (SP) CD4+ or CD8+ T cells, through positive and negative selection [1–3]. No studies, to date, have investigated how the human transcriptome profiles differ between SP T cells still residing in the thymus and T cells in the periphery.
At birth, the majority of peripheral T cells are naïve, consisting mostly of recent thymic emigrants (RTE) (~ 80%) [4]. In the first years of life, the load of microbes and pathogens to be encountered, is at its peak. T cells play a crucial role in protecting the body from these invaders, and due to this antigen exposure, the memory T cells begin to accumulate. The establishment of long-term reserves of memory T cells plateaus at 2nd decade of life, after the involution of the thymus [5]. From ages 1 to 50+, there is a gradual decline of thymic epithelial space [6]. Evidence of ongoing thymopoiesis, measured by signal joint T cell receptor excision circles (sjTREC) levels, show an exponential drop with increasing age, with detectable levels up to age ~ 60 [7, 8]. A recent study suggests that the steepest decline in thymopoiesis occurs at ~ 40 years of age, with a drop in double positive (DP) thymocytes and reduced number of RTEs in lymphoid tissues [9]. This age coincides with the age of onset for many autoimmune diseases.
A high-dimensional atlas of human T cell diversity in eight different tissues has been reported, using CyTOF [10], but neither thymus nor peripheral blood from children was among those tissues. In mice, single-cell transcriptomic atlases of the developing [11] and neonatal murine thymus [12] was recently released, providing detailed insights of the development of thymocytes into mature T cells. Previously, transcriptome profiling using microarray of flow sorted cells from murine thymi has been reported, including for CD4+ and CD8+ T cells [13, 14]. So far, humans studies have explored the gene expression of recent thymic emigrants, immature T cell stages and naïve T cells, derived from peripheral blood [15, 16] and umbilical cord blood [17]. To our knowledge, no one has yet explored the human transcriptome of the finale stage of thymocytes, the SP T cells, or the transcriptome of the peripheral blood T cells in young children.
In this study, we have performed high-throughput RNA sequencing to characterize the transcriptomes of SP CD4+ and CD8+ T cells from primary human thymic tissue, and compared them to CD4+ and CD8+ T cells in infant and adult peripheral blood, providing a unique insight into the mechanisms of T cell migration and differentiation in thymus, infant blood and adult blood.
Results
Cell purity and viability assessments
The purity of the CD4+ cells from both tissues was ~ 95% (Supplementary Figure S1–3, Additional File 1). The CD8+ populations displayed more varying purity scores. The thymic CD8+ T cells achieved ~ 95% purity, using negative enrichment. (Supplementary Figure S4, Additional File 1). The positive selection assay for CD8α used on peripheral blood, performed better in adult than infant blood, with purity scores at 95 and 75%, respectively (Supplementary Figure S6–5, Additional File 1). Staining the CD8α + cells after sorting, with CD3 we found that > 90% of the CD8 T cells were CD3+ (Supplementary Figure S7, Additional File 1), suggesting that a small portion of the CD8α + cells could be NK, immature thymocytes or other CD8α + CD3- cells. CD3+ NKT cells may be present, however in supposedly small numbers as NKT cells constitute 1% of all peripheral blood T cells [18]. We detected suspected double positive CD4CD8+ thymocytes in the CD4+ thymocyte population (Supplementary Figure S1, Additional File 1), and vice versa (about 10%) (Supplementary Figure S4, Additional File 1). In the infant blood, we observed 2% CD4+ cells in the CD8+ population (Supplementary Figure S5, Additional File 1), while in adult blood we observed 5% CD4+ cells in the CD8+ population (Supplementary Figure S6, Additional File 1). We also found traces of CD8+ T cells in the isolated CD4+ T cells. This was seen, to a less extent, in CD4+ adult blood (~ 2% CD8+ cells, Supplementary Figure S3, Additional File 1). The viability differed between sample subsets. The thymic samples had a higher average viability (88%) than blood (77%) for CD4+ T cells, while the average viability of CD8+ cells was 63% from thymus and 71% from blood (data not shown).
Descriptive statistics
Figure 1 provides a graphical overview of the experimental design and workflow. For the SP CD4+ and CD8+ T cells from infant thymus and blood, we used 3–5 biological replicates (ages 5 days – 15 months), while peripheral blood CD4+ and CD8+ T cells from adults were pooled from five individuals (23–45 years). From all 18 transcriptome profiles generated, the sequencing depth ranged from 69 to 122 M reads (Supplementary Table S1, Additional File 2). However, particularly the sequencing data from the CD8+ T cells contained a considerable proportion of multimapping reads (28–86%). Yet, after excluding multimapping reads from further analysis, satisfactory estimated library sizes for detecting DE genes (> 10 M) [19], remained for 14 out of 18 samples (range: 4–67 M, median: 49 M).
Fig. 1.

Graphical outline of the experiment
The thymic and peripheral blood T cell transcriptome
RNA-seq of human CD4+ and CD8+ T cells, derived from infant thymus, as well as from infant and adult peripheral blood, detected 44,282 known coding transcripts (Fig. 2a). In addition, 19,116 potentially novel alternative transcripts, 242 novel long non-coding RNA (lncRNA) and 153 novel transcripts of uncertain coding potential (TUCP) were also uncovered. The novel alternative transcripts displayed the largest range in number of exons, with 26.5% of the transcripts exceeding 20 exons (Supplementary Figure S1A, Additional File 3), showed a high coding probability (median 0.99, Supplementary Figure S1B, Additional File 3), and comprised the longest transcripts, with 30% exceeding 10 kb (Supplementary Figure S1C, Additional File 3). The median coding probability was high also for the generally shorter TUCP (0.67), while it was very low (0.004) for the novel lncRNA. Both TUCP and lncRNA had a median of two exons. Investigating thymic SP T cells exclusively, 39,965 known transcripts, 20,764 potentially novel alternative transcripts, 252 potentially novel lncRNA and 171 transcripts of uncertain coding potential (Supplementary Figure S1D, Additional File 3) were detected. Infant CD4+ T cells of blood and thymic origin presented similar numbers of detected transcripts, while for the CD8+ T cells, the infant blood derived displayed ~ 30% less transcripts than the thymic T cells (Table 1). The adult blood derived transcripts were consistently the least abundant.
Fig. 2.

a log2 FPKM and total number of known coding transcripts, potentially novel lincRNA, tentative novel alternative transcripts and TUCP (transcript of uncertain coding potential) identified in CD4+ and CD8+ thymic, infant and adult blood derived T cells. b MDS plot displaying unsupervised clustering of the samples. The distance corresponds to the average (root-mean-square) of the 500 largest absolute log-fold-changes between each pair of samples. Uniquely and commonly expressed genes between c CD4+ and d CD8+ thymic, infant and adult blood T cells, at a threshold of FPKM > = 2
Table 1.
Number of known coding transcripts, potentially novel lincRNA, tentative alternative transcripts and TUCP (transcript of uncertain coding potential) identified in CD4+ and CD8+ thymic, infant and adult blood derived T cells
| Cell | Group | Known coding | Novel lncRNA | Novel alterntive transcripts | TUCP |
|---|---|---|---|---|---|
| CD4 | adult blood | 31,906 | 64 | 9807 | 35 |
| CD4 | infant blood | 38,857 | 107 | 14,389 | 56 |
| CD4 | infant thymus | 37,886 | 124 | 11,691 | 57 |
| CD8 | adult blood | 18,249 | 30 | 5022 | 29 |
| CD8 | infant blood | 28,108 | 65 | 8366 | 42 |
| CD8 | infant thymus | 39,058 | 139 | 12,962 | 109 |
Genes expressed in T cells from human thymus and blood
RNA-seq of the primary T cell subsets from human thymus and blood identified transcripts from 18,218 known genes in total, after filtering low expressed genes (< 1 pr million counts) (Supplementary Figure S2, Additional File 3). 14,441 (79%) were protein coding (representing 61% of Ensembl protein coding genes), 2501 lncRNA, 944 pseudogenes and 332 non-coding RNA (ncRNA). A multidimensional scaling (MDS) plot of the transcriptomes (Fig. 2b), revealed that the samples were separated by tissue in the first dimension and by cell type in the second dimension. Both thymic SP CD4+ (Fig. 2c) and CD8+ T cells (Fig. 2d) showed more uniquely expressed genes (average gene expression FPKM> 2 for the replicates) than the blood derived T cells from infants or adults. A higher number of expressed genes were shared between thymic CD4+ and thymic CD8+ T cells, than between infant blood vs thymic T cells of the same cell population (Supplementary Figure S3A, Additional File 3). This pattern was also true for genes associated with autoimmune diseases (Supplementary Figure S3B, Additional File 3).
Genes associated with autoimmune diseases
Of 555 loci associated with autoimmune diseases (AID; GWAS catalogue Nov 2015, P < 5 × 10− 8), the majority were expressed in our T cell datasets. Only 123 (22.2%) of the annotated genes were not detected (at FPKM > = 2) in neither CD4+ nor CD8+ T cells from any of the three origins, while more than half of the genes (N = 285) were expressed in both T cell populations from all sample types (Supplementary Table S2, Additional File 2). The proportion of AID genes expressed varied across our T cell populations and between the diseases (Fig. 3). For the AIDs we investigated, at least half of the identified risk genes were found to be expressed. Observing the T cell populations separately, 378 of AID associated genes were expressed by CD4+ of any origin and 421 genes were expressed by CD8+ of any origin (Supplementary Figure S3C-D, Additional File 3). Interestingly, 49 of the 432 expressed AID genes were not expressed in T cells from adult blood (Supplementary Table S2, Additional File 2). Of these 18 AID risk genes were only expressed in thymic SP T cells while 20 AID risk genes were only detected in peripheral T cells from children. These 49 loci were mainly associated with inflammatory bowel disease (N = 21), multiple sclerosis (N = 18), rheumatoid arthritis (N = 15) and type 1 diabetes (N = 10).
Fig. 3.

Mean expression (log2 FPKM, visualized by the blue-yellow color scale) and number of genes expressed at FPKM > = 2 (represented by white numbers) of 555 AID associated genes, for each condition and cell population. BA = blood adult, BI = blood infant, TI = thymus infant
Differential expression was most pronounced between thymus and blood
In both CD4+ and CD8+ T cells, the largest number of differentially expressed genes (DEGs) was discovered when comparing T cells from thymus with infant blood, followed by adult blood (Table 2). Comparing infant with adult blood T cells provided less DEGs. Similarly, when comparing the transcriptomes of CD4+ with CD8+ T cells, from different origins (Table 2), the highest numbers of DEGs were observed between the two T cell subpopulations in thymus, followed by infant blood, and lastly, adult blood. Volcano plots of DEGs for the pairwise comparisons are shown in Supplementary Figure S4 (Additional File 3), and complete lists of DEGs with expression values for all samples are found in Supplementary Tables S3–11 (Additional File 2).
Table 2.
Number of significantly differentially expressed genes (DEGs) from the pairwise comparisons, at FDR < 0.05, and additional criteria logCPM> 1.5 and logFC> 1
| group | comparison | upregulated in | #DEGs | #DEGs total |
|---|---|---|---|---|
| CD4+ | thymus vs infant blood | thymus | 1624 | 2957 |
| infant blood | 1333 | |||
| CD4+ | thymus vs adult blood | thymus | 1451 | 2688 |
| adult blood | 1237 | |||
| CD4+ | infant blood vs adult blood | infant blood | 246 | 575 |
| adult blood | 329 | |||
| CD8+ | thymus vs infant blood | thymus | 1286 | 2695 |
| infant blood | 1409 | |||
| CD8+ | thymus vs adult blood | thymus | 1154 | 2222 |
| adult blood | 1068 | |||
| CD8+ | infant blood vs adult blood | infant blood | 250 | 405 |
| adult blood | 155 | |||
| adult blood | CD4+ vs CD8+ | CD4+ | 339 | 675 |
| CD8+ | 336 | |||
| infant blood | CD4+ vs CD8+ | CD4+ | 819 | 1995 |
| CD8+ | 1176 | |||
| thymus | CD4+ vs CD8+ | CD4+ | 1107 | 2028 |
| CD8+ | 921 |
Clustering the, in total, 5925 DEGs from all comparisons, revealed that the subsets clustered according to tissue of origin, then cell type and age – with one major clade for the thymic cells and one major clade for the blood derived cells (Supplementary Figure S5, Additional File 3). Genes associated with V(D) J recombination and T cell commitment, including RAG2, HES1 and DNTT, were amongst the top 10 DEGs upregulated in thymic T cells (Fig. 4a). In CD8+ infant and adult blood T cells, the top upregulated genes included genes involved in cell migration and lineage commitment; S1PR5, PLEKHG3, and TBX21, while, amongst others, interleukin receptors IL6R and IL4R displayed high expression in CD4+ infant and adult peripheral blood T cells.
Fig. 4.

a Top 10 up and downregulated genes (FDR < 0.05, logCPM> 1.5, logFC> 1), sorted by FDR, from 6 comparisons; CD4+ thymic vs infant blood, thymic vs adult blood and infant vs adult blood and CD8+ thymic vs infant blood, thymic vs adult blood and infant vs adult blood. b Expression patterns of selected DEGs (FDR < 0.05, logCPM> 1.5, logFC> 1) involved in T cell function, development or migration. The color scale represents z-scores
Differences in gene set enrichment profiles related to developmental stage
The upregulated DEGs in thymic SP CD4+ and CD8+ T cells, were mainly involved in cell division and proliferation, when compared to infant blood CD4+ and CD8+ T cells (Fig. 5a). The DEGs upregulated in infant blood CD4+ and CD8+, compared to the equivalent thymic subset, were enriched for multiple immune related biological processes, such as defense response, cytokine production, and intercellular signal transduction, as well as regulation of cell proliferation and differentiation. When comparing infant to adult blood T cells (Fig. 5b), the infant blood T cells were enriched for genes involved in proliferation and cell death, besides regulation of gene expression and immune system processes. The genes upregulated in adult blood T cells were engaged in response to stimulus, immune and defense response, cytokine production and biological adhesion. Comparing CD4+ to CD8+ T cells, of the same tissue and age, revealed that genes upregulated in thymic CD4+ T cells were heavily involved in chromosome organization and cell cycle, while enriched GO terms in CD8+ T cells in infant blood, were dominated by immune related processes (Supplementary Figure S6, Additional File 3).
Fig. 5.
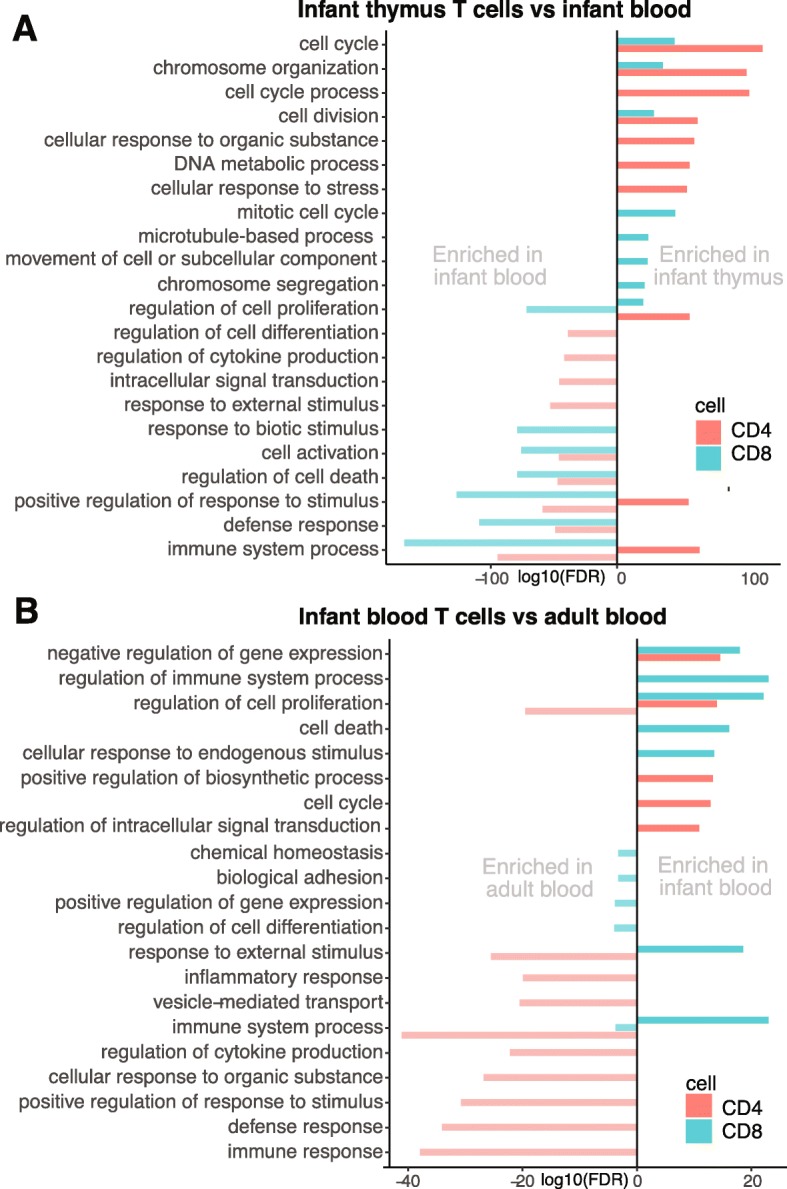
Biological processes enriched when comparing significant DEGs (FDR < 0.05, logCPM> 1.5, logFC> 1) in a thymic vs infant blood CD4+ and CD8+ T cells. Negative values represent enriched terms in infant blood, positive values represent enriched terms in infant thymus. b Infant vs adult blood CD4+ and CD8+ T cells. Negative values represent enriched terms in adult blood, positive values represent enriched terms in infant blood
T cell markers for egress, differentiation and migration
Since we have a unique material of primary T cells from both thymic and blood from infants, we looked specifically at the expression patterns of genes involved in T cell egress (Fig. 6a), migration and differentiation. In general, the CD4+ T cells expressed a wider repertoire of PTPRC transcripts than CD8+ T cells (Fig. 6b). In peripheral blood, the adults showed higher expression of CD45RO transcripts (PTPRC-201) in their CD4+ T cells than children, while the opposite was observed for the CD45RABC isoform (PTPRC-209). The isoform patterns of CD45 have been less well characterized in CD8+ T cells. We observed tentative novel isoforms (Fig. 6c I and II), sharing exons with CD45RABC, in CD8+ T cells, not found to be expressed in CD4+ T cells. In the CD8+ cells, these novel PTPCR transcripts were expressed at similar levels as CD45RABC and CD45RO. We also observed that the CD45RB transcripts (PTPRC 203 and 214) displayed higher expression in the peripheral blood CD4+ T cells than the SP CD4+ T cells in the thymus, yet compared to the RO and the RABC isoforms, overall expression was low.
Fig. 6.

PTPRC (CD45) transcript expression for each T cell subset, for a known transcripts and b tentative novel isoforms most similar to CD45RABC (PTPRC-209/ ENST00000442510). Gene expression of c the CD8A and CD8B genes, and d T cell egress markers, for each T cell subset. The horizontal red line represents a cutoff at FPKM = 2. Figure legend abbreviations: BA = blood adult, BI = blood infant, TI = thymus infant
We furthermore investigated the CD45RA/RO ratios of the CD4 T cells, at the surface protein level using FACS, comparing a thymic sample and blood from the same child, and blood samples from two adults aged 30 and 70 years (Supplementary Figure S8, Additional File 1). Like others [5, 20], we observed high amounts of CD45RO in the thymic sample, while the blood sample, from the same individual, displayed less CD45RO and more CD45RA positive cells. Both the adult samples, regardless of age, showed extensive co-expression of CD45RA and CD45RO (43–51%, Supplementary Figure S8, Additional File 1), yet the overall expression of CD45RA was low, compared to infant blood. The higher CD45RA expression in infants compared to adults is likely due to a higher proportion of naïve T cells.
Our data suggests that infant CD8+ T cells may express CD8B at a higher level than CD8A, while the opposite was seen in the adult pool of CD8+ T cells (Fig. 6d), though the difference was not statistically significant. The expression levels of CD8A and CD8B in the SP thymic T cells were equivalent. We explored the distribution of CD8B isoforms, and detected highest expression of CD8b-201 (ENST00000331469) in SP thymic CD8+ T cells, followed by the blood CD8+ T cells from adults and infants (Supplementary Figure S7, Additional File 3). The most abundant isoform was CD8b-203 (ENST00000390655), mainly expressed by the CD8+ mature thymocytes, followed by the infant blood T cells, and to a lesser degree in adult CD8+ T cells.
To further investigate differentially expressed genes involved in T cell differentiation and migration, we extracted DEGs associated with the GO terms “lymphocyte migration” (GO:0072676) and “T cell differentiation” (GO:0030217), as well as relevant genes from the literature (Fig. 4b). The genes upregulated in thymic T cells included recombination-activating genes; RAG1 and RAG2, genes involved in adhesion and homing; ITGAE (CD103) and CCR9, T lineage commitment; SATB1, cell proliferation; MKI67 and transcriptional regulators involved in T cell development; ID2, SOX4, LEF1 and BCL6. In adult blood T cells, several chemokines, interleukins, and their receptors were upregulated; CCL5 (RANTES), IL12RB1, IL10RA, IL32, CCR2 and CCR5, as well as genes involved in cell adhesion and migration; ADAM8, ITGB7, SELPLG, and lymphocyte function and activation, including SLAMF6, PIK3CD, TXK and NFATC2. Several genes involved in cell adhesion and lymphocyte homing, migration, egress and maturation were upregulated in infant blood T cells; CD69, CD44, SELL (CD62L), CCR7, S1PR1, ITGA6, ITGA5, ITK and TESPA1.
Discussion
In this study, we present the transcriptomes from primary human CD4+ and CD8+ T cells from thymus and peripheral blood from young children and, in addition, provide comparisons to adult peripheral CD4+ and CD8+ T cells. A graphical summary of the results is displayed in Fig. 7. The transcriptomes deviated more according to site of origin, i.e. thymus vs blood, than according to T cell subtype or age. The thymic T cells showed the largest number of uniquely expressed genes, suggesting a more diverse transcription compared to peripheral blood derived T cells. CD4+ and CD8+ T cells showed more distinct differences in peripheral blood than in thymus, likely reflecting the differentiation and diversification of naïve T cells when encountering its cognate antigen in the periphery.
Fig. 7.

Graphical summary of the results. CD4+ and CD8+ T cells were isolated from infant blood and thymus, and a pool of adult blood samples. RNA was extracted and sequenced, before differential gene expression was assessed comparing the different tissues of origin, ages and cell populations. Differences in gene expression levels, number of uniquely expressed genes and enriched gene sets were detected
T cell egress and migration
In mice, the T cell egress phenotype has been determined as Cd3 + Cd27 + Cd45ra + Cd62l + Cd69- [21]. In the thymus, CD69 expression has been reported to be downregulated in mature SP thymocytes, enabling expression of S1PR1 and egress from the thymus [22, 23]. We detected lower CD69 expression in thymus compared to blood from infants, most pronounced in CD4+ T cells (Fig. 6d). CD69 and S1PR1 regulates the retention or egress of T cells from lymphoid tissue by forming a complex inhibiting the egress function of S1PR1, with little effect on the transcriptional level of S1PR1 [24, 25]. In peripheral T cells, CD69 is an early activation marker [26, 27], where expression is rapidly and transiently induced following activation [28]. The high expression of both CD69 and S1PR1 in infant blood CD4+ T cells detected in this study, could suggest active recirculating of T cells between peripheral blood and lymphatic tissue of young children.
PECAM1 (CD31) has been proposed as a marker for CD4+ recent thymic emigrants [29, 30]. The expression is down regulated upon proliferation after antigenic priming or homeostatic signals [31], in coherence with the high levels detected in thymic SP CD4+ T cells, compared to peripheral CD4+ T cells (Fig. 6d). In contrast, naïve CD8+ T cells egress the thymus expressing PECAM1 and retain its expression during differentiation in the periphery [32]. In our study, the highest expression of PECAM1 was detected in CD8+ infant blood T cells, followed by thymic CD8+ SP T cells. The overall expression of PECAM1 was higher in CD8+ than CD4+ T cells, consistent with previously reported findings [10, 33].
In humans, the CD8+ recent thymic emigrant phenotype has been described as CD8 + CD103 + CD62L + CD27 + CD11adimCD95dim [34]. Homing to secondary lymphoid organs is enabled by CCR7 and CD62 ligand (CD62L/SELL), expressed on naïve T cells [35], in coherence with the high expression we observed in infant blood T cells. CCR7 and CD62 expression is high in central memory cells as well [36, 37], which could explain the high levels detected in adult peripheral blood CD4+ T cells, nearly as high as in infant blood. However, the recent article by Park et al. [38] identified KLF2 to be a regulator of thymic emigration. KLF2 is a transcription factor that regulates the expression of S1PR1 and CD62L [39]. Though not expressed in DP thymocytes, expression is induced in the mature SP thymocytes, both CD4+ and CD8+, and is maintained in naïve T cells until activation, introducing a rapid and profound loss of KFL2 [40]. We observed high expression of KLF2 in CD4+ and CD8+ T cells from both infant and adult blood, compared to thymus, indicating that the ratio of egressing or naive T cells was high in blood from both children and adults in both cell types.
T cell differentiation
In our SP thymic T cells and in the infant blood CD8+ T, we detected expression of BCL6. BCL6 is essential for memory B cell development in germinal centers. In addition, follicular helper CD4+ (Tfh) cells are known to express this transcription factor [41]. CXCR5 is associated with B cell zone migration and homing, and has been well described in B cells and CD4 Tfh cells [42]. During unresolved infections or chronic inflammation, a subset of CD8+ cells localize to B cell follicles and differentiate to follicular CD8+ T cells, facilitated by the expression of CXCR5 and BCL6 [43, 44]. In a murine study, Bcl6 was identified as a key molecule for the establishment of memory CD8 T cells as well the peripheral CD8 T cell compartment in infancy [41]. Two decades ago, the BCL6 protein was detected in cortical thymocytes and some medullary thymocytes from human prenatal and postnatal thymi [40], supporting our findings of BCL6 expression in infant thymic T cells. All this supports our findings of the expression of BCL6 in CD8 T cells from both infant blood and thymic tissue, although further subtyping or single cell sequencing would elaborate their fate further.
In humans, six different isoforms of CD45 mRNAs have been isolated [45]. The majority of DP (> 90%) and SP (90%) thymocytes are CD45RO+, while egressing SP T cells are CD45RA+ [46, 47]. We find quite high expression of the CD45RO isoform in the thymic SP T cells, indicating what we have mainly captured SP T cells not yet ready for egress. Upon stimulation the naïve T cells lose their CD45RA and acquire CD45RO expression to become effector or memory cells, with a transitional stage of dual CD45RA/RO expression [48]. From our FACS data, we observed that a large proportion of the T cells in adults co-expressed CD45RA and CD45RO, which could suggest that a majority of the peripheral T cells were in a transitional stage.
Distinct differences between infant and adult T cells
Amongst the top differentially expressed genes was the cytokine CXCL8 (IL8), almost exclusively expressed in CD8+ infant blood T cells. CXCL8 is previously detected in human CD8+ from umbilical cord blood [10]. Elevated CXCL8 expression in pre-term babies and umbilical cord blood compared to adult blood, indicates that T lymphocytes in very early life are intrinsically anti-inflammatory and also emphasizes qualitative distinctions between infants’ and adults’ immune systems [49]. Both CD4+ and CD8+ infant peripheral T cells displayed higher expression of CD44 than their adult blood counterparts. CD44 is upregulated after activation of naïve T cells and the elevated level is sustained for a while to protect against re-infection [50], and thereby also considered a marker for memory T cells in humans [51]. This suggests that the population of infant peripheral T cells are vigorously protecting the young body from previously unencountered invaders, and due to this high load of antigen exposure the memory T cells accumulates.
Autoimmune diseases
Interestingly, about 3/4 of genes annotated to be involved in susceptibility to autoimmune diseases were found to be expressed in our T cell panel. Of these, more than 10% were not expressed in T cells from adult blood. This is noteworthy, as most studies addressing the expression of autoimmune risk genes investigate blood samples from adult individuals. An interesting instance is SIRPG, a gene associated with type 1 diabetes, which we have previously found to act an expression quantitative loci (eQTL) in human total thymic tissue [20]. Our current data revealed that SIRPG is particularly highly expressed the thymic CD8+ T cells, followed by the infant blood CD4+ and CD8+ T cells.
Limitations of the study
Due to the young age of our participants, we were merely able to draw a 4 ml blood sample. Hence, the number of CD4+ and CD8+ T cells isolated from infant peripheral blood are lower (6 × 10⁴–2.7 × 10⁶) than the respective T cells isolated from infant thymi and adult peripheral blood (1.5 × 10⁶–4.6 × 10⁸). For the adult samples, we used a pool of 5 samples. This may have limited the number of transcripts detected in infant and adult peripheral blood T cells. Mature CD8+ T cells in human can express either the homodimer of CD8α-α or the heterodimer CD8α-β. Using a selection kit capturing the CD8alfa positive cells, enabled us to detect both dimers of CD8 T cells in our cohort. A pitfall of this choice, is that selected sub-population of human PBMC also express CD8α-α. Staining with CD3 in the CD8+ pool, we discovered that > 90% of the CD8+ cells are CD3+, hence considered T cells and also a minute proportion of NKT, while the remaining < 10% could be NK-cells, pDendrittic cells, Macrophages or monocytes, that may present CD8α on their surface under specific conditions. From the cell purity assessments, we uncovered lower purity of the CD8+ T cells isolated from infant blood than the CD8+ T cells from adult blood (75% vs 95% respectively). This may be since the kit is manufactured for adult human PBMC use. The impurities, particularly affecting the CD8+ T cells of infant blood, could have affected our results by adding gene transcripts originating from other cell types thereby influencing the assessed expression profiles of the infant blood. The low viability of our cells (63–88%) could indicate that the isolation procedure stressed the cells and thereby could also influence their observed expression profiles. Additionally, we have not distinguished naïve and memory T cells but their ratios are expected to differ between the T cell sources used in this study.
Conclusion
This study provides novel insight into the transcriptome of the human primary SP T cells still residing in the thymus, and offers unique comparisons to primary blood derived T cells from infants and adults. Thymic T cells were enriched for gene ontology terms involved in cell proliferation and differentiation, when compared to infant blood derived T cells, whereas the infant blood T cells were enriched for immune responses, cell activation and signaling. We discovered that genes involved in migration, homing and recirculation, between peripheral blood and lymphatic tissue, were particularly active in infant blood T cells, suggesting active migration and recirculation in young children which likely also reflect the enrichment of naïve T cells. Genes encoding chemokine and interleukin receptors were particularly active in adult blood T cells, while upregulated genes in thymic T cells comprised genes involved in proliferation and early T cell development. From a list of 555 autoimmune disease associated genes, the majority were expressed in one or more T cell subset. However, ~ 11% were expressed in infant blood or infant thymic T cells alone, thus potentially evading detection in studies merely focusing on adult peripheral blood.
Methods
Sample material
Human thymic tissue was collected from 10 Caucasian infants (3 females and 7 males, age range: 5 days – 15 months), with no known syndromes, undergoing cardiac surgery to repair congenital abnormalities. From 5 of these infants (3 females, 2 males, age range: 5 days – 12 months), a 4 ml EDTA blood sample was collected. Furthermore, 27 ml blood was collected from 5 healthy adult individuals (ages 23–45, 3 females, 2 males). For the FACS study, 4 ml EDTA blood and thymic tissue was collected from a 6 years old male, while 10 ml EDTA blood was collected from two female adults (30 and 70 years old).
Isolation of T cells from thymus and peripheral blood
Thymic tissue (~ 10 g) was collected and immediately washed in 10 ml PBS (Gibco, Thermo Fischer, MA, USA), before storage in a medium of 90% RPMI (Sigma-Aldrich, MO, USA) and 10% heat inactivated FCS (PAAlab, Pasching, Austria) for 30 min. The thymic tissue was further treated with Collagenase D (Roche Life Science, Basel, Switzerland) three times and Liberase TM (Roche Life Science) twice, until completely dissolved. Mononuclear cells were enriched from blood with Lymphoprep™ (Alere Technologies, Oslo, Norway) and EasySep tubes (STEMCELL Technologies, Vancouver, Canada) according to the manufacturer’s instructions. The PBMC of the 5 adults were pooled immediately prior to the cell sorting. We sorted the desired cell populations from homogenized single cell suspensions, manually, by targeted magnetic bead assays (STEMCELL Technologies, Vancouver, Canada). The CD4+ T cells from both thymus and blood were isolated with EasySep™ Human CD4 + CD25+ T Cell Isolation Kit (i.e. CD8-, CD14, CD16-, CD19-, CD20-, CD36-, CD56-, CD123-, TCRgamma/delta-, CD66b-, glycophorin A-, CD25-) to obtain single positive CD4 + CD25−/low. The blood CD8+ T cells were isolated using EasySep™ Positive CD8+ Selection Kit (STEMCELL Technologies), involving the monoclonal antibody clone RIV11, while the thymic CD8+ T cells were isolated by negative selection (CD4-, CD14-, CD16-, CD19-, CD20-, CD36-, CD56-, CD66b, CD123-, TCRgamma/delta-, glycophorin A-), using the human CD8+ T cell enrichment kit (STEMCELL Technologies). The pelleted cells were stored in RNAprotect® Cell Reagent (Qiagen, Hilde, Germany) at − 80 °C, before total RNA was extracted by RNeasy Plus mini Kit (Qiagen). According to manufacturer’s facultative suggestion, we used both the gDNA eliminator column, as well as DNase treatment. This provided a total of 4 thymic and 4 peripheral blood CD4+ CD25−/low T cell samples, and 5 thymic and 3 blood CD8+ T cell samples, in addition to two pools of blood derived CD4 + CD25- / low and CD8+ T cells, from 5 adults.
Purity analyses of isolated T-cell subsets
To investigate the purity of the isolated cell populations, samples for flow cytometry were prepared from some of the thymi and blood samples in the project, as well as two blood samples from adult females (aged 30 and 70 years) and thymus and blood samples from a 6-year-old male for the CD45 RA/RO ratio. Samples for flow cytometry were analyzed on a BD Accuri C6 FCM Software (BD biosciences, New Jersey, USA), and we used Fluorescence Minus One Control to set the gates. To study the CD45 RA/RO ratio in the CD4+ T cell populations, we bead sorted the CD4 + CD25−/low by CD45RO+ selection, stained the two populations with either CD45RO-PE for CD45RO+ cells and CD45RA-APC for CD45RO- cells,
Sequencing
The cDNA libraries were prepared using Truseq Stranded Total RNA Kit with Ribo-Zero GOLD set A (Illumina, California, USA # RS-122-2301). For the CD4+, and CD8+ thymic cells, sequencing was performed on Illumina HiSeq 2000 (Illumina, California, USA), 100 bp paired end, while the CD8+ blood T cells were sequenced on Illumina HiSeq 2500, 125 bp paired end.
High performance computing
Computational analyses were performed using Services for Sensitive Data (TSD), a platform to store, analyze and share sensitive data provided by the University of Oslo, in compliance with the Norwegian “Personal Data Act” and “Health Research Act”.
Read mapping and quantification
Low quality reads and adapter sequence was trimmed with Trimmomatic v0.33 [52, 53], using the following parameters: “ILLUMINACLIP:TruSeq3-PE.fa:2:30:10:8:true LEADING:3 TRAILING:3 SLIDINGWINDOW:4:15 MINLEN:36”, and PhiX sequence (used as spike-in all Illumina sequencing runs) was removed with BBMap v35.14 [53]. Reads were mapped with TopHat2 v2.1.0 [54] to both genome (EnsemblGRCh38) and transcriptome reference (Ensembl release 80), specifying estimated mate inner distance and mate standard deviation for each sample. Paired reads mapping in the right orientation to the exons were counted for each annotation gene using FeatureCounts (subread v1.4.6-p3) [55], with the following parameters: “–C –p –s 2 –t exon –g gene_id”.
Selection of AID genes
The 555 genes associated with autoimmune diseases (AID) were selected from the National Institute of Health’s catalog of genome wide association studies (NHGRI) (http://www.ebi.ac.uk/gwas/). The following AID phenotypes were included in the search (November 2015): atopic dermatitis, ankylosing spondylitis, celiac disease, Crohn’s disease, ulcerative colitis, inflammatory bowel disease, juvenile idiopathic arthritis, multiple sclerosis, psoriasis, primary sclerosing cholangitis, rheumatoid arthritis, systemic sclerosis, type 1 diabetes. The selection was restricted to GWAS performed in Caucasian populations and annotated to SNPs with P-values < 5 × 10− 8. We did not include the X- or the Y-chromosome or the HLA-region.
Differential expression analysis
Differential expression analysis was carried out in edgeR v3.16.5 [56]. TMM normalization was applied to account for compositional differences between libraries. Due to the complex multifactor design of the experiment, a generalized linear model (GLM) was used, considering the factors; cell type (CD4+, CD8+), tissue (thymus, blood) and age (infant, adult). Due to the large number of differentially expressed genes (DEGs) at FDR < 0.05; in total 14,975 unique DEGs, additional criteria; logFC> 1| < − 1 and logCPM> 1.5, was introduced to obtain biologically meaningful genes. The logCPM threshold of 1.5 was decided upon, due to its proximity to the local minimum of the bimodal logCPM density distribution (Supplementary Figure S8, Additional File 3). When determining the number of uniquely expressed and shared genes between the subsets, a cutoff of FPKM > 2 was used. To identify enriched biological processes, we used Gene Set Enrichment Analysis (http://software.broadinstitute.org/gsea) on significant DEGs from the pairwise comparisons. Redundant GO terms were reduced by REVIGO [57] web server tool. Genes associated with GO terms GO:0072676 lymphocyte migration and GGO:0030217 T cell differentiation were extracted from AmiGO v2.5.12 (http://amigo.geneontology.org/amigo), in addition to genes of special interest selected from the literature.
De novo assembly of transfrags
To enable the detection of potential novel transcripts, guided de novo assembly was preformed using Stringtie v1.2.2 [58] (parameters: -B -G) with Ensembl GRCh38 release 80 annotation. The output gtf files were merged using cuffmerge (Cufflinks v2.2.1) [59], and the resulting merged gtf was provided as reference for a second Stringtie run (parameters -B -e -G). Assembled transfrags were normalized with edgeR’s Trimmed Mean of M (TMM). The coding potential was determined by the Coding Potential Assessment Tool (CPAT) [60]. Stringent filtering criteria was applied for length of transcript (> 200), length of ORF (< 120, > 100), FPKM expression level (multi-exon transfrags FPKM > 0.1 in > = 2 samples per group, single-exon transfrags FPKM > 1 in > = 2 samples per group) and coding potential (CPAT < 0.364, > 0.364, to classify transfrags as lncRNA or TUCP, respectively. Single-exon intergenic transfrags were not included. Using blastn (https://www.ncbi.nlm.nih.gov/blast/) against RefSeq release 98, February 2020, by the following criteria; identity > 90%, alignment length > 100, query or subject coverage > 80%, 72 tentative novel lncRNA and 47 TUCP transcripts were annotated. Under the following criteria; identity > 95%, alignment length > 200, query coverage > 80%, 6228 tentative novel isoforms were assigned to a known transcript.
Additional files
Additional File 1. Purity plots of T cell suspensions.
Additional File 2. Supplementary Tables.
Additional File 3. Supplementary Figures.
Acknowledgements
We thank Egil Seem at the Department of Cardiothoracic Surgery, Oslo University Hospital, for providing the thymus tissues. The Norwegian Sequencing Center, Oslo University Hospital and University of Oslo, performed the RNA sequencing, and Hans Christian Dalsbotten Aass at the department of Medical Biochemistry, Oslo University Hospital provided flowcytometry expertise.
Abbreviations
- AID
Autoimmune disease
- BA
Blood adult
- BI
Blood infant
- CPAT
Coding Potential Assessment Tool
- CPM
Counts per million
- DEG
Differentially expressed gene
- DP
Double positive
- FPKM
Fragments Per Kilobase of transcript per Million mapped reads
- lncRNA
Long non-coding RNA
- MDS
Multidimensional scaling
- ncRNA
Non-coding RNA
- ORF
Open reading frame
- PBMC
Peripheral blood mononuclear cell
- RTE
Recent thymic emigrant
- SP
Single positive
- TI
Thymus infant
- TMM
Trimmed mean of M
- TUCP
Transcripts of uncertain coding potential
Authors’ contributions
HH preformed data analysis. IG, HA and SFT preformed the experimental work. AYMS contributed to bioinformatic analysis. HH, SFT and BAL drafted the manuscript. BAL and SFT conceived and supervised the study. BAL provided conceptual design and funding. HH finalized the manuscript. All authors discussed and interpreted results, and all authors read and approved the submitted manuscript.
Funding
This work was supported by grants from the Research Council of Norway, the University of Oslo, the Norwegian Diabetes Association, and the South-Eastern Norway Regional Health Authorities. The funders had no role in study design, data collection and analysis, decision to publish, or preparation of the manuscript.
Availability of data and materials
The datasets supporting the conclusions of this article are available in the Gene Expression Omnibus repository, Series accession number GSE139242 (https://www.ncbi.nlm.nih.gov/geo/query/acc.cgi?acc=GSE139242). EnsemblGRCh38, Ensembl release 80 was used as reference genome (ftp://ftp.ensembl.org/pub/release-80/fasta/homo_sapiens/dna/) and transcriptome (ftp://ftp.ensembl.org/pub/release-80/gtf/homo_sapiens). Unfortunately, we are not permitted to deposit the raw transcriptome data from this study. As required according to the Norwegian Health Research Act and the Norwegian Data Protection Act, we have a permit and approval from the Regional Ethical Committees to use and store Personal Data related to health. The RNA sequencing data for this study is Personal Data, as defined in Norwegian and European legislation. Even though all personal identifiers have been removed, the number of variables on the individual level is so extensive that identification of persons by use of other information from open sources is possible. Access to data is controlled and accepted by our Principal Investigator (PI), who has the formal responsibility as ‘Controller’ pursuant to Norwegian and European legislation. Sharing of data is a well-established routine for the PI, and after a Direct Transfer Agreement (DTA) has been signed and it has been approved by the ethical committee to submit data to a specific researcher or team, data will be shared. Data access can be requested directly from the PI at b.a.lie@medisin.uio.no or s.t.flam@medisin.uio.no.
Ethics approval and consent to participate
This project was approved by the Regional Committees for Medical and Health Research – South East Norway. All samples were made anonymous and all adult participants and parents of enrolled infants gave written informed consent.
Consent for publication
Not applicable.
Competing interests
The authors declare that they have no competing interest.
Footnotes
Publisher’s Note
Springer Nature remains neutral with regard to jurisdictional claims in published maps and institutional affiliations.
Contributor Information
Hanna Helgeland, Email: hhelgela@gmail.com.
Benedicte Alexandra Lie, Email: b.a.lie@medisin.uio.no.
Supplementary information
Supplementary information accompanies this paper at 10.1186/s12864-020-6755-1.
References
- 1.Kyewski B, Derbinski J. Self-representation in the thymus: an extended view. Nat Rev Immunol. 2004;4:688. doi: 10.1038/nri1436. [DOI] [PubMed] [Google Scholar]
- 2.Cheng M, Anderson MS. Thymic tolerance as a key brake on autoimmunity. Nat Immunol. 2018;19(7):659–664. doi: 10.1038/s41590-018-0128-9. [DOI] [PMC free article] [PubMed] [Google Scholar]
- 3.Hogquist KA, Baldwin TA, Jameson SC. Central tolerance: learning self-control in the thymus. Nat Rev Immunol. 2005;5:772. doi: 10.1038/nri1707. [DOI] [PubMed] [Google Scholar]
- 4.Collier FM, Tang ML, Martino D, Saffery R, Carlin J, Jachno K, et al. The ontogeny of naive and regulatory CD4(+) T-cell subsets during the first postnatal year: a cohort study. Clin Transl Immunol. 2015;4(3):e34. doi: 10.1038/cti.2015.2. [DOI] [PMC free article] [PubMed] [Google Scholar]
- 5.Cossarizza A, Ortolani C, Paganelli R, Barbieri D, Monti D, Sansoni P, et al. CD45 isoforms expression on CD4+ and CD8+ T cells throughout life, from newborns to centenarians: implications for T cell memory. Mech Ageing Dev. 1996;86(3):173–95. [DOI] [PubMed]
- 6.Haynes BF, Markert ML, Sempowski GD, Patel DD, Hale LP. The role of the Thymus in immune reconstitution in aging, bone marrow transplantation, and HIV-1 infection. Annu Rev Immunol. 2000;18(1):529–560. doi: 10.1146/annurev.immunol.18.1.529. [DOI] [PubMed] [Google Scholar]
- 7.Douek DC, McFarland RD, Keiser PH, Gage EA, Massey JM, Haynes BF, et al. Changes in thymic function with age and during the treatment of HIV infection. Nature. 1998;396:690. doi: 10.1038/25374. [DOI] [PubMed] [Google Scholar]
- 8.Sempowski GD, Hale LP, Sundy JS, Massey JM, Koup RA, Douek DC, et al. Leukemia inhibitory factor, oncostatin M, IL-6, and stem cell factor mRNA expression in human thymus increases with age and is associated with thymic atrophy. J Immunol. 2000;164(4):2180–2187. doi: 10.4049/jimmunol.164.4.2180. [DOI] [PubMed] [Google Scholar]
- 9.Thome JJ, Grinshpun B, Kumar BV, Kubota M, Ohmura Y, Lerner H, et al. Longterm maintenance of human naive T cells through in situ homeostasis in lymphoid tissue sites. Sci Immunol. 2016;1(6):eaah6506. 10.1126/sciimmunol.aah6506. https://immunology.sciencemag.org/content/1/6/eaah6506.full. [DOI] [PMC free article] [PubMed]
- 10.Wong MT, Ong DEH, Lim FSH, Teng KWW, McGovern N, Narayanan S, et al. A high-dimensional atlas of human T cell diversity reveals tissue-specific trafficking and cytokine signatures. Immunity. 2016;45(2):442–56. [DOI] [PubMed]
- 11.Kernfeld EM, Genga RMJ, Neherin K, Magaletta ME, Xu P, Maehr R. A Single-Cell Transcriptomic Atlas of Thymus Organogenesis Resolves Cell Types and Developmental Maturation. Immunity. 2018;48(6):1258–1270. doi: 10.1016/j.immuni.2018.04.015. [DOI] [PMC free article] [PubMed] [Google Scholar]
- 12.Bacon WA, Hamilton RS, Yu Z, Kieckbusch J, Hawkes D, Krzak AM, et al. Single-Cell Analysis Identifies Thymic Maturation Delay in Growth-Restricted Neonatal Mice. Front Immunol. 2018;9:2523. doi: 10.3389/fimmu.2018.02523. [DOI] [PMC free article] [PubMed] [Google Scholar]
- 13.Lustig A, Carter A, Bertak D, Enika D, Vandanmagsar B, Wood W, et al. Transcriptome analysis of murine thymocytes reveals age-associated changes in thymic gene expression. Int J Med Sci. 2009;6(1):51–64. doi: 10.7150/ijms.6.51. [DOI] [PMC free article] [PubMed] [Google Scholar]
- 14.Moore JB, Blanchard RK, McCormack WT, Cousins RJ. cDNA array analysis identifies thymic LCK as upregulated in moderate murine zinc deficiency before T-lymphocyte population changes. J Nutr. 2001;131(12):3189–3196. doi: 10.1093/jn/131.12.3189. [DOI] [PubMed] [Google Scholar]
- 15.Pekalski ML, García AR, Ferreira RC, Rainbow DB, Smyth DJ, Mashar M, et al. Neonatal and adult recent thymic emigrants produce IL-8 and express complement receptors CR1 and CR2. JCI insight. 2017;2(16):e93739. doi: 10.1172/jci.insight.93739. [DOI] [PMC free article] [PubMed] [Google Scholar]
- 16.van den Broek T, Delemarre EM, Janssen WJM, Nievelstein RAJ, Broen JC, Tesselaar K, et al. Neonatal thymectomy reveals differentiation and plasticity within human naive T cells. J Clin Invest. 2016;126(3):1126–1136. doi: 10.1172/JCI84997. [DOI] [PMC free article] [PubMed] [Google Scholar]
- 17.Canté-Barrett K, Mendes RD, Li Y, Vroegindeweij E, Pike-Overzet K, Wabeke T, et al. Loss of CD44(dim) expression from early progenitor cells Marks T-cell lineage commitment in the human Thymus. Front Immunol. 2017;8:32. doi: 10.3389/fimmu.2017.00032. [DOI] [PMC free article] [PubMed] [Google Scholar]
- 18.Jerud ES, Bricard G, Porcelli SA. CD1d-restricted natural killer T cells. Roles in tumor immunosurveillance and tolerance. 2006;33(1):18–36. [Google Scholar]
- 19.Liu Y, Zhou J, White KP. RNA-seq differential expression studies: more sequence or more replication? Bioinformatics. 2014;30(3):301–304. doi: 10.1093/bioinformatics/btt688. [DOI] [PMC free article] [PubMed] [Google Scholar]
- 20.Fukuhara K, Okumura M, Shiono H, Inoue M, Kadota Y, Miyoshi S, et al. A study on CD45 isoform expression during T-cell development and selection events in the human thymus. Hum Immunol. 2002;63(5):394–404. [DOI] [PubMed]
- 21.Resop RS, Uittenbogaart CH. Human T-cell development and Thymic egress: An infectious disease perspective. Forum on immunopathological diseases and therapeutics. 2015;6(1–2):33–49. doi: 10.1615/ForumImmunDisTher.2015014226. [DOI] [PMC free article] [PubMed] [Google Scholar]
- 22.Nakayama T, Kasprowicz DJ, Yamashita M, Schubert LA, Gillard G, Kimura M, et al. The generation of mature, single-positive Thymocytes in vivo is Dysregulated by CD69 blockade or overexpression. J Immunol. 2002;168(1):87. doi: 10.4049/jimmunol.168.1.87. [DOI] [PubMed] [Google Scholar]
- 23.Matloubian M, Lo CG, Cinamon G, Lesneski MJ, Xu Y, Brinkmann V, et al. Lymphocyte egress from thymus and peripheral lymphoid organs is dependent on S1P receptor 1. Nature. 2004;427:355. doi: 10.1038/nature02284. [DOI] [PubMed] [Google Scholar]
- 24.Shiow LR, Rosen DB, Brdičková N, Xu Y, An J, Lanier LL, et al. CD69 acts downstream of interferon-α/β to inhibit S1P1 and lymphocyte egress from lymphoid organs. Nature. 2006;440:540. doi: 10.1038/nature04606. [DOI] [PubMed] [Google Scholar]
- 25.Bankovich AJ, Shiow LR, Cyster JG. CD69 suppresses sphingosine 1-phosophate receptor-1 (S1P1) function through interaction with membrane helix 4. J Biol Chem. 2010;285(29):22328–22337. doi: 10.1074/jbc.M110.123299. [DOI] [PMC free article] [PubMed] [Google Scholar]
- 26.Caruso A, Licenziati S, Corulli M, Canaris AD, De Francesco MA, Fiorentini S, et al. Flow cytometric analysis of activation markers on stimulated T cells and their correlation with cell proliferation. Cytometry. 1997;27(1):71–76. doi: 10.1002/(SICI)1097-0320(19970101)27:1<71::AID-CYTO9>3.0.CO;2-O. [DOI] [PubMed] [Google Scholar]
- 27.Cibrián D, Sánchez-Madrid F. CD69: from activation marker to metabolic gatekeeper. Eur J Immunol. 2017;47(6):946–53. [DOI] [PMC free article] [PubMed]
- 28.Sancho D, Gómez M, Sánchez-Madrid F. CD69 is an immunoregulatory molecule induced following activation. Trends Immunol. 2005;26(3):136–140. doi: 10.1016/j.it.2004.12.006. [DOI] [PubMed] [Google Scholar]
- 29.Kimmig S, Przybylski GK, Schmidt CA, Laurisch K, Mowes B, Radbruch A, et al. Two subsets of naive T helper cells with distinct T cell receptor excision circle content in human adult peripheral blood. J Exp Med. 2002;195(6):789–794. doi: 10.1084/jem.20011756. [DOI] [PMC free article] [PubMed] [Google Scholar]
- 30.Kilpatrick RD, Rickabaugh T, Hultin LE, Hultin P, Hausner MA, Detels R, et al. Homeostasis of the naive CD4+ T cell compartment during aging. J Immunol. 2008;180(3):1499–1507. doi: 10.4049/jimmunol.180.3.1499. [DOI] [PMC free article] [PubMed] [Google Scholar]
- 31.Demeure CE, Byun DG, Yang LP, Vezzio N, Delespesse G. CD31 (PECAM-1) is a differentiation antigen lost during human CD4 T-cell maturation into Th1 or Th2 effector cells. Immunology. 1996;88(1):110–115. doi: 10.1046/j.1365-2567.1996.d01-652.x. [DOI] [PMC free article] [PubMed] [Google Scholar]
- 32.Stockinger H, Schreiber W, Majdic O, Holter W, Maurer D, Knapp W. Phenotype of human T cells expressing CD31, a molecule of the immunoglobulin supergene family. Immunology. 1992;75(1):53–58. [PMC free article] [PubMed] [Google Scholar]
- 33.Douaisi M, Resop RS, Nagasawa M, Craft J, Jamieson BD, Blom B, et al. CD31, a Valuable Marker to Identify Early and Late Stages of T Cell Differentiation in the Human Thymus. J Immunol. 2017;198(6):2310–2319. doi: 10.4049/jimmunol.1500350. [DOI] [PMC free article] [PubMed] [Google Scholar]
- 34.McFarland RD, Douek DC, Koup RA, Picker LJ. Identification of a human recent thymic emigrant phenotype. Proc Natl Acad Sci U S A. 2000;97(8):4215–4220. doi: 10.1073/pnas.070061597. [DOI] [PMC free article] [PubMed] [Google Scholar]
- 35.Förster R, Davalos-Misslitz AC, Rot A. CCR7 and its ligands: balancing immunity and tolerance. Nat Rev Immunol. 2008;8:362. doi: 10.1038/nri2297. [DOI] [PubMed] [Google Scholar]
- 36.Sallusto F, Lenig D, Forster R, Lipp M, Lanzavecchia A. Two subsets of memory T lymphocytes with distinct homing potentials and effector functions. Nature. 1999;401(6754):708–712. doi: 10.1038/44385. [DOI] [PubMed] [Google Scholar]
- 37.Unsoeld H, Pircher H. Complex memory T-cell phenotypes revealed by coexpression of CD62L and CCR7. J Virol. 2005;79(7):4510–4513. doi: 10.1128/JVI.79.7.4510-4513.2005. [DOI] [PMC free article] [PubMed] [Google Scholar]
- 38.Park J-E, Botting RA, Domínguez Conde C, Popescu D-M, Lavaert M, Kunz DJ, et al. A cell atlas of human thymic development defines T cell repertoire formation. Science. 2020;367(6480):eaay3224. doi: 10.1126/science.aay3224. [DOI] [PMC free article] [PubMed] [Google Scholar]
- 39.Stein JV. How to be naive. Immunity. 2009;31(1):9–11. doi: 10.1016/j.immuni.2009.06.010. [DOI] [PubMed] [Google Scholar]
- 40.Takada K, Wang X, Hart GT, Odumade OA, Weinreich MA, Hogquist KA, et al. Kruppel-like factor 2 is required for trafficking but not quiescence in postactivated T cells. J Immunol. 2011;186(2):775–783. doi: 10.4049/jimmunol.1000094. [DOI] [PMC free article] [PubMed] [Google Scholar]
- 41.Brenna E, Davydov AN, Ladell K, McLaren JE, Bonaiuti P, Metsger M, et al. CD4(+) T Follicular Helper Cells in Human Tonsils and Blood Are Clonally Convergent but Divergent from Non-Tfh CD4(+) Cells. Cell Rep. 2020;30(1):137–152. doi: 10.1016/j.celrep.2019.12.016. [DOI] [PMC free article] [PubMed] [Google Scholar]
- 42.Breitfeld D, Ohl L, Kremmer E, Ellwart J, Sallusto F, Lipp M, et al. Follicular B helper T cells express CXC chemokine receptor 5, localize to B cell follicles, and support immunoglobulin production. J Exp Med. 2000;192(11):1545–1552. doi: 10.1084/jem.192.11.1545. [DOI] [PMC free article] [PubMed] [Google Scholar]
- 43.Leong YA, Chen Y, Ong HS, Wu D, Man K, Deleage C, et al. CXCR5+ follicular cytotoxic T cells control viral infection in B cell follicles. Nat Immunol. 2016;17(10):1187–1196. doi: 10.1038/ni.3543. [DOI] [PubMed] [Google Scholar]
- 44.Quigley MF, Gonzalez VD, Granath A, Andersson J, Sandberg JK. CXCR5+ CCR7- CD8 T cells are early effector memory cells that infiltrate tonsil B cell follicles. Eur J Immunol. 2007;37(12):3352–3362. doi: 10.1002/eji.200636746. [DOI] [PubMed] [Google Scholar]
- 45.Hermiston ML, Xu Z, Weiss A. CD45: a critical regulator of signaling thresholds in immune cells. Annu Rev Immunol. 2003;21:107–137. doi: 10.1146/annurev.immunol.21.120601.140946. [DOI] [PubMed] [Google Scholar]
- 46.Fujii Y, Okumura M, Inada K, Nakahara K, Matsuda H. CD45 isoform expression during T cell development in the thymus. Eur J Immunol. 1992;22(7):1843–1850. doi: 10.1002/eji.1830220725. [DOI] [PubMed] [Google Scholar]
- 47.Rheinlander A, Schraven B, Bommhardt U. CD45 in human physiology and clinical medicine. Immunol Lett. 2018;196:22–32. doi: 10.1016/j.imlet.2018.01.009. [DOI] [PubMed] [Google Scholar]
- 48.Summers KL, O'Donnell JL, Hart DN. Co-expression of the CD45RA and CD45RO antigens on T lymphocytes in chronic arthritis. Clin Exp Immunol. 1994;97(1):39–44. doi: 10.1111/j.1365-2249.1994.tb06576.x. [DOI] [PMC free article] [PubMed] [Google Scholar]
- 49.Gibbons D, Fleming P, Virasami A, Michel ML, Sebire NJ, Costeloe K, et al. Interleukin-8 (CXCL8) production is a signatory T cell effector function of human newborn infants. Nat Med. 2014;20(10):1206–10. doi: 10.1038/nm.3670. [DOI] [PubMed] [Google Scholar]
- 50.Baaten BJ, Li C-R, Bradley LM. Multifaceted regulation of T cells by CD44. Commun Integr Biol. 2010;3(6):508–512. doi: 10.4161/cib.3.6.13495. [DOI] [PMC free article] [PubMed] [Google Scholar]
- 51.Zhou J, Nagarkatti P, Zhong YIN, Nagarkatti M. Characterization of T-cell memory phenotype after in vitro expansion of tumor-infiltrating lymphocytes from melanoma patients. Anticancer Res. 2011;31(12):4099–4109. [PMC free article] [PubMed] [Google Scholar]
- 52.Bolger AM, Lohse M, Usadel B. Trimmomatic: A flexible trimmer for Illumina Sequence Data. Bioinformatics. 2014;30(15):2114–20. [DOI] [PMC free article] [PubMed]
- 53.B B. BBMap [Available from: sourceforge.net/projects/bbmap/.
- 54.Kim D, Pertea G, Trapnell C, Pimentel H, Kelley R, Salzberg S. TopHat2: accurate alignment of transcriptomes in the presence of insertions, deletions and gene fusions. Genome Biol. 2013;14(4):R36. doi: 10.1186/gb-2013-14-4-r36. [DOI] [PMC free article] [PubMed] [Google Scholar]
- 55.Liao Y, Smyth GK, Shi W. FeatureCounts: an efficient general-purpose program for assigning sequence reads to genomic features. Bioinformatics. 2013. [DOI] [PubMed]
- 56.Robinson MD, McCarthy DJ, Smyth GK. edgeR: a bioconductor package for differential expression analysis of digital gene expression data. Bioinformatics. 2010;26(1):139–140. doi: 10.1093/bioinformatics/btp616. [DOI] [PMC free article] [PubMed] [Google Scholar]
- 57.Supek F, Bošnjak M, Škunca N, Šmuc T. REVIGO summarizes and visualizes long lists of gene ontology terms. PLoS One. 2011;6(7):e21800. doi: 10.1371/journal.pone.0021800. [DOI] [PMC free article] [PubMed] [Google Scholar]
- 58.Pertea M, Pertea GM, Antonescu CM, Chang T-C, Mendell JT, Salzberg SL. StringTie enables improved reconstruction of a transcriptome from RNA-seq reads. Nat Biotech. 2015;33(3):290–295. doi: 10.1038/nbt.3122. [DOI] [PMC free article] [PubMed] [Google Scholar]
- 59.Trapnell C, Williams BA, Pertea G, Mortazavi A, Kwan G, van Baren MJ, et al. Transcript assembly and quantification by RNA-Seq reveals unannotated transcripts and isoform switching during cell differentiation. Nat Biotechnol. 2010;28(5):511–515. doi: 10.1038/nbt.1621. [DOI] [PMC free article] [PubMed] [Google Scholar]
- 60.Wang L, Park HJ, Dasari S, Wang S, Kocher J-P, Li W. CPAT: Coding-Potential Assessment Tool using an alignment-free logistic regression model. Nucleic Acids Res. 2013;41(6):e74. doi: 10.1093/nar/gkt006. [DOI] [PMC free article] [PubMed] [Google Scholar]
Associated Data
This section collects any data citations, data availability statements, or supplementary materials included in this article.
Supplementary Materials
Additional File 1. Purity plots of T cell suspensions.
Additional File 2. Supplementary Tables.
Additional File 3. Supplementary Figures.
Data Availability Statement
The datasets supporting the conclusions of this article are available in the Gene Expression Omnibus repository, Series accession number GSE139242 (https://www.ncbi.nlm.nih.gov/geo/query/acc.cgi?acc=GSE139242). EnsemblGRCh38, Ensembl release 80 was used as reference genome (ftp://ftp.ensembl.org/pub/release-80/fasta/homo_sapiens/dna/) and transcriptome (ftp://ftp.ensembl.org/pub/release-80/gtf/homo_sapiens). Unfortunately, we are not permitted to deposit the raw transcriptome data from this study. As required according to the Norwegian Health Research Act and the Norwegian Data Protection Act, we have a permit and approval from the Regional Ethical Committees to use and store Personal Data related to health. The RNA sequencing data for this study is Personal Data, as defined in Norwegian and European legislation. Even though all personal identifiers have been removed, the number of variables on the individual level is so extensive that identification of persons by use of other information from open sources is possible. Access to data is controlled and accepted by our Principal Investigator (PI), who has the formal responsibility as ‘Controller’ pursuant to Norwegian and European legislation. Sharing of data is a well-established routine for the PI, and after a Direct Transfer Agreement (DTA) has been signed and it has been approved by the ethical committee to submit data to a specific researcher or team, data will be shared. Data access can be requested directly from the PI at b.a.lie@medisin.uio.no or s.t.flam@medisin.uio.no.